aquatecture: architectural adaptation to rising sea levels
TRANSCRIPT

University of South FloridaScholar Commons
Graduate Theses and Dissertations Graduate School
11-20-2009
Aquatecture: Architectural Adaptation to RisingSea LevelsErica WilliamsUniversity of South Florida
Follow this and additional works at: https://scholarcommons.usf.edu/etd
Part of the American Studies Commons
This Thesis is brought to you for free and open access by the Graduate School at Scholar Commons. It has been accepted for inclusion in GraduateTheses and Dissertations by an authorized administrator of Scholar Commons. For more information, please contact [email protected].
Scholar Commons CitationWilliams, Erica, "Aquatecture: Architectural Adaptation to Rising Sea Levels" (2009). Graduate Theses and Dissertations.https://scholarcommons.usf.edu/etd/85
Aquatecture: Architectural Adaptation to Rising Sea Levels
by
Erica Williams
A thesis submitted in partial fulfillment of the requirements for the degree of
Master of Architecture
School of Architecture and Community Design
College of The Arts
University of South Florida
Major Professor: Mark Weston, M.Arch. Shannon Bassett, M.Arch.U.D.
David Fries, M.S.
Date of Approval: November 20, 2009
Keywords: Waterhouse, Community, Sustainability, Climate Change, Flood Protection
©Copyright 2009, Erica Williams
DEDICATION
I want to thank those that
Inspire me,
Motivate me,
Believe in me.
This one is for you.

i
TABLE OF CONTENTS
LIST OF TABLES iii
LIST OF FIGURES iv
ABSTRACT vii
CHAPTER 1: THE PROBLEM 1
MELTING ICE EQUALS RISING WATER 2
Climate Change: A Global Crisis 2
Main Contributions to Sea Level Rise 3
CURRENT AND PROJECTED IMPACTS 4
Recent Flooding Triggered by Climate Change 4
Future Impacts of Climate Change 5
Global Impacts 6
Projected Impacts on Communities 7
Projected Sea Levels and the United States 8
Climate Change: A Problem that is „Slow to 9
Stop‟
CHAPTER 2: SOLUTIONS AND GOALS 10
AQUATECTURE: PREPARING FOR SEA LEVEL RISE
Devising a Plan: Project Goals 11
Redefining Architecture to Sustain 12
Communities
The Solution: Implementing Aquatecture 12
Step 1: Redefining a Coastal Home 12
Step 2: Redefining a Coastal Community 12
Step 3: Redefining a Coastal City 13
CHAPTER 3: CASE STUDIES 14
CASE STUDY: INDIVIDUAL HOUSING UNIT 15
Summary 15
Critique 15
CASE STUDY: ADAPTIVE RE-USE 16
Summary 16
Critique 16
CASE STUDY: COMMUNITY ON THE WATER 17
Summary 17
Critique 17
PRECEDENT STUDYl THE NETHERLANDS 18
Adopting Dutch Strategies 18
CHAPTER 4: PROJECT CONCEPT 19
MITIGATE, ADAPT, SUSTAIN 20
Strategies: Mitigate, Adapt, and Sustain 20
Mitigate 20
Adapt 20
Sustain 20
CHAPTER 5: SITE SELECTION AND ANAYLSIS 21
SITE SELECTION PROCESS 22
Site Selection and Risk Management 22
PROJECTED SEA-LEVEL IMPACT ON SOUTH FLORIDA 23
Rising Tides: Florida 23
The Effects on Florida 23 Sea Level Rise and South Florida 24
Climate Change Impacts to South Florida 24
THE SITE- MIAMI FLORIDA 25
Miami, Florida 25
Risk Management 25
Miami: An Endangered City 25
Sea-level rise in Miami-Dade County On 25
Urban and Natural Resources 25

ii
Miami Residents: Interview 27
Average Rainfall and Impact 27
Is Miami Prepared for Rising Sea Levels? 28
Prepare for Flooding 28
Stay Informed 28
Aquatecture Opportunities within the Miami- 29
Miami Beach Context 29
CHAPTER 6: REDEFINING A COASTAL HOME 30
A HOME THAT FLOATS 31
H2OME 31
Necessity of an Adaptable Home In Existing 31
Communities
Mitigation Principles for Living Units 31
Lifted: Rising with the Water 32
CHAPTER 7: REDEFINING A COASTAL COMMUNITY 56
WHEN HOMES CREATE A COMMUNITY 57
Aquatecture Community Development 57
Main Community Goals 57
Alternative Living 57
Adaptability 57
Self Sustain 58
Archetype 58
PROPOSED COMMUNITY LOCATION 59
COMMUNITY ESSENTIALS 63
Incorporating Community Needs 63
AGRICULTURE 64
Farming Methods for an Inundated Environment 64
TRANSPORTATION 65
Transportation Services: Alternative Mobility 65
The Effects of Alternative Transportation 65
Services
AQUACULTURE 66
Aquaculture 66
Mariculture 66
Alternatives to Controlled Farming 66
DESALINIATION WATER FILTRATION 67
Desalination and Water Filtration 67
Grey Water Filtration Methods 67
ALTERNATIVE ENERGY PRODUCTION 68
Alternative Energy Production 68
COMMUNITY PROPOSAL 69
COMMUNITY PHASING DRAWINGS 71
PROPOSED COMMUNITY 79
CHAPTER 8: REDEFINING A COASTAL CITY 95
LIVING IN AN INNUNDATED CITY 97
What Happens to Our City Cores? 97
Adaptive Re-Use Strategies 97
CHAPTER 9: CONCLUSION 104
EXPLORING WORLD-WIDE POSSIBILITIES 104
Conclusion 104
CHAPTER 10: REFERENCES 107
iii
LIST OF TABLES
Table 1.1. Increases in Sea Level for over 120 Years 4
Table 1.2. Holocene Sea Level Increase 4
iv
LIST OF FIGURES
Figure 1.1. Polar Bear on Melting Glacier .............................. 2
Figure 1.2. Satellite Image of Shrinking Ice Cap
Over a Two Decade Span 3
Figure 1.3. Mother and Child Making their Way Through 5
Figure 1.4. World Regions Vulnerable to Sea Level Rise ....... 6
Figure 1.5. Southeast Asian Family Living in Flood
Waters ................................................................... 7
Figure 1.6. Hurricane Katrina Victims Seeking Refuge 8
Figure 1.7. Tom Agnew Quote Discussing the Severity of
Climate Change 9
Figure 2.1. Lifted Conceptual Diagram ................................. 11
Figure 3.1. Floating House on Hollow Concrete Pontoon ..... 15
Figure 3.2. Exterior Material Options15 .................................. 15
Figure 3.3. Hotelier at Sea: Adaptive Re-use of an Oil Rig ... 16
Figure 3.4. Adaptable Living Unit Design .............................. 16
Figure 3.5. Silodam by MVRDV ............................................ 17
Figure 3.6. Showing Silodam Site Context ............................ 17
Figure 3.7. Waterstudio NL Waterhouse Architecture ............ 18
Figure 4.1. Aquatecture Concept 20
Figure 4.2. Project Concept Presentation Board ................... 20
Figure 5.1. The Crichton Risk Triangle .................................. 22
Figure 5.2. 100 Year Sea Level Rise Projection ................... 23
Figure 5.3. South Florida Projected to be Most Vulnerable ... 24
Figure 5.4. Ocean Drive, South Beach Florida ...................... 25
Figure 5.5. Satellite Image of Miami, Florida (Year 2009) ...... 26
Figure 5.6. Projected Sea Level Impact: Miami (Year 2100) 26
Figure 5.7. Miguel Quesada, Resident of Miami Beach for
25-Years 27
Figure 5.8. Average Rainfall in Miami ................................... 27
Figure 5.9. Flooding in Miami after Hurricane Andrew ......... 28
Figure 5.10. Site Analysis: View of Miami from .............................
North Key Biscayne ............................................. 29
Figure 6.1. H20ME Flood Protection Diagram ...................... 31
Figure 6.2. Floating Boat Dock in the Everglades, Florida 32
Figure 6.3. H20ME: Housing Unit Concept ............................ 33
Figure 6.4. Housing Unit Designs ......................................... 34
Figure 6.5. One Bedroom Housing Unit Design .................... 35
Figure 6.6. Two Bedroom Housing Unit Design .................... 36
Figure 6.7. Three Bedroom Housing Unit Design 37
Figure 6.8. Row of Waterhouses in Miami Intercoastal
Waters ................................................................ 38
Figure 6.9. Unit Systems ........................................................ 39
Figure 6.10. Unit Sustainable Systems ................................... 40
Figure 6.11. Exploded Axonometric of Unit Components ....... 41
Figure 6.12. Set of Housing Units from Above ......................... 42
Figure 6.13. Exterior Perspective of Two Bedroom
Housing Unit 43
Figure 6.14. Longitudinal Section of Three-Bedroom Unit ...... 44
Figure 6.15. Cross Section of Three Bedroom Unit 45
Figure 6.16. H2OME Unit Perspectives .................................. 46
v
Figure 6.17. Final Model: One Bedroom Unit View #1 .............. 47
Figure 6.18. Final Model: One Bedroom Unit View #2 48
Figure 6.19. Final Model: Two Bedroom Unit View #1 ........... 49
Figure 6.20. Final Model: Two Bedroom Unit View #2 .............. 50
Figure 6.21. Final Model: One Bedroom Unit View #1 .............. 51
Figure 6.22. Final Model: Two Bedroom Unit View #4 ............. 52
Figure 6.23. Final Model: Showing Linking Capabilities of
Housing Units ...................................................... 53
Figure 6.24. Final Model: Three Bedroom Unit View #1 54
Figure 6.25. Final Model: Three Bedroom Unit View #2 55
Figure 7.1. View of Proposed Community
(from Mac Aurthur Causeway) 59
Figure 7.2. View of Proposed Community Location 59
Figure 7.3. Panoramic of Proposed Water Community
of Site (year 2009) 60
Figure 7.4. Site Panoramic Water level Year (2050) 60
Figure 7.5. Site Location and Context 61
Figure 7.6. Community Conceptual Model 62
Figure 7.7. Hydroponic Farming 64
Figure 7.8. Alternative Transportation 65
Figure 7.9. Aquaculture Fish Farm 66
Figure 7.10. Desalination Tank 67
Figure 7.11. Hydroelectric Power Turbine 68
Figure 7.12. Site Plan of Proposed Water Community:
Miami (Year 2025) 69
Figure 7.13. Community Diagrams 70
Figure 7.14. Possible Linking Configuration s 71
Figure 7.15. Phase 1 View of Miami-Dade Inter-coastal 72
Figure 7.16. Phase 2 Showing Addition to Existing
Community 73
Figure 7.17. Phase 3 View Showing Growth of
Existing Community 74
Figure 7.18. Phase 4 View Showing Small Water
Communities Branching from Vulnerable/
Flooded Areas 75
Figure 7.19. Phase 5 View Showing Small Water
Communities Growing from Vulnerable/
Flooded Areas 76
Figure 7.20. Phase 6 View of Miami-Dade Inter-coastal
Water Community Network 77
Figure 7.21. Phase 7 View of Miami-Dade Inter-coastal
Water Community Network 60
Figure 7.22. Elevation (North-Side) of Community
Site (year 2009) 79
Figure 7.23. Cross-Section of Community Center Area and
Inhabitation Capabilities within Substructure 80
Figure 7.24. Cross-Section Showing Desalination Tanks,
Pedestrian Paths, and Housing Units within
Community Context 81
Figure 7.25. Section of Community and Surrounding
Context 82
Figure 7.26. Aerial View of Community 83
Figure 7.27. Community with Water 'Removed' to
Show Piling to Ground Connections 84
Figure 7.28. Bio-Swales for Water Run-off Management 85
Figure 7.29. Tide Gardens Between Housing Units 86

vi
Figure 7.30. Undulating Boardwalk and Waterhouses 87
Figure 7.31. Micro-Hydroelectric Power Chamber and
Desalination Silo 88
Figure 7.32. Housing Unit Configurations 89
Figure 7.33. Community Park 90
Figure 7.34. View of Dock at Night 91
Figure 7.35. Final Model: Water Community View #1 92
Figure 7.36. Final Model: Water Community View #2 93
Figure 7.37. Final Model: Water Community View #3 94
Figure 8.1. Concept Statement: Barnacle Colony 96
Figure 8.2. Housing Units Latch onto Pre-Existing
Towers 97
Figure 8.3. Barnacle Living Presentation Board 98
Figure 8.4. Adaptive Re-use of Downtown Miami
Infrastructure 99
Figure 8.5. Community Cluster Along Bridge 100
Figure 8.6. Final Model: Barnacle Living 101
Figure 8.7. Clusters of Units Latch onto Existing Tower 102
Figure 8.8. Roof of Existing Towers to be Garden Spaces 104

vii
Aquatecture: Architectural Adaptation to Rising Sea Levels
Erica Williams
ABSTRACT
Our world is drastically changing. Temperatures are
rising, skies over cities are blanketed with smoke, and melting
glaciers are raising sea levels at alarming rates. Although the
destruction we face is already threatening the quality of life for
billions around the world, it could just be the beginning. What is
projected to come in the future could be catastrophic.
It is crucial to realize that climate change is already
happening. One of the main concerns relating to climate change
is that as the polar ice caps continue to melt, rising water will
invade our coastal cities around the world. In accordance with
sea level projection maps, sea levels will rise 20 feet1, and major
cities like Miami, Shanghai, Calcutta, and Manhattan will be
completely submerged.2 We must ask ourselves: How can we
avoid a mass migration as water levels invade our homes and
cities?
Instead of retreating inland, adaptation strategies should
be devised. This proposal will explore how homes and cities
should respond to sea level increase through the implementation
of a new architectural typology—Aquatecture.
1 “An Inconvenient Truth.” Motion Picture. Paramount, 2006.
2 Ibid.
Aquatecture is defined as an architectural adaptation
typology used to mitigate and manage flooding (long and short
term). With this typology, water and architectural design can
unite to produce dynamic and reliable mitigation solutions. The
main course of action involves redefining three main living
systems: a home, a neighborhood, and a residential tower to
resist destruction of rising water levels and to continue city-town-
home inhabitation.
In addition to adaptable building design, supporting
systems will be integrated throughout affected areas. Systems
such as alternative energy production, alternative farming,
mixed-used industry, alternative transportation, and water
filtration zones will be incorporated.
With the help of Aquatecture, alternatives to abandoning
our coastal cities are provided. Due to the flexibility of site
location that Aquatecture allows, this intervention can serve as a
long- term solution and standard of living within current and
projected flood prone areas around the world.

1
CHAPTER 1: THE PROBLEM

2
MELTING ICE EQUALS RISING WATER
Climate Change: A Global Crisis
Our world is drastically changing. Within the recent
years, climate change has become a growing concern
worldwide. The various modes of destruction imposed on our
environment are targeted to be the catalyst to these changes. A
substantial increase in hurricane activity, noticeable fluctuations
in temperature, and an influx in CO2 emissions have all been
noted concerns for many.
One of the primary fears stemming from global warming
is that not only will weather patterns become more severe and
unpredictable, but our oceans will rise and destroy our
coastlines, buildings, homes, and communities world-wide.
According to climate scientists, sea level rise is "One of the most
important impacts of global climate change."3 Sea level has been
consistently rising over the past 100 years, and global warming
is expected to increase the annual rate by two to five times.4
3 Intergovernmental Panel on Climate Change, Working Group I Report. “The
Science of Climate Change.” (1996). 364-365.
4 Ibid.
Figure 7.1. Polar Bear on Melting Glacier
3
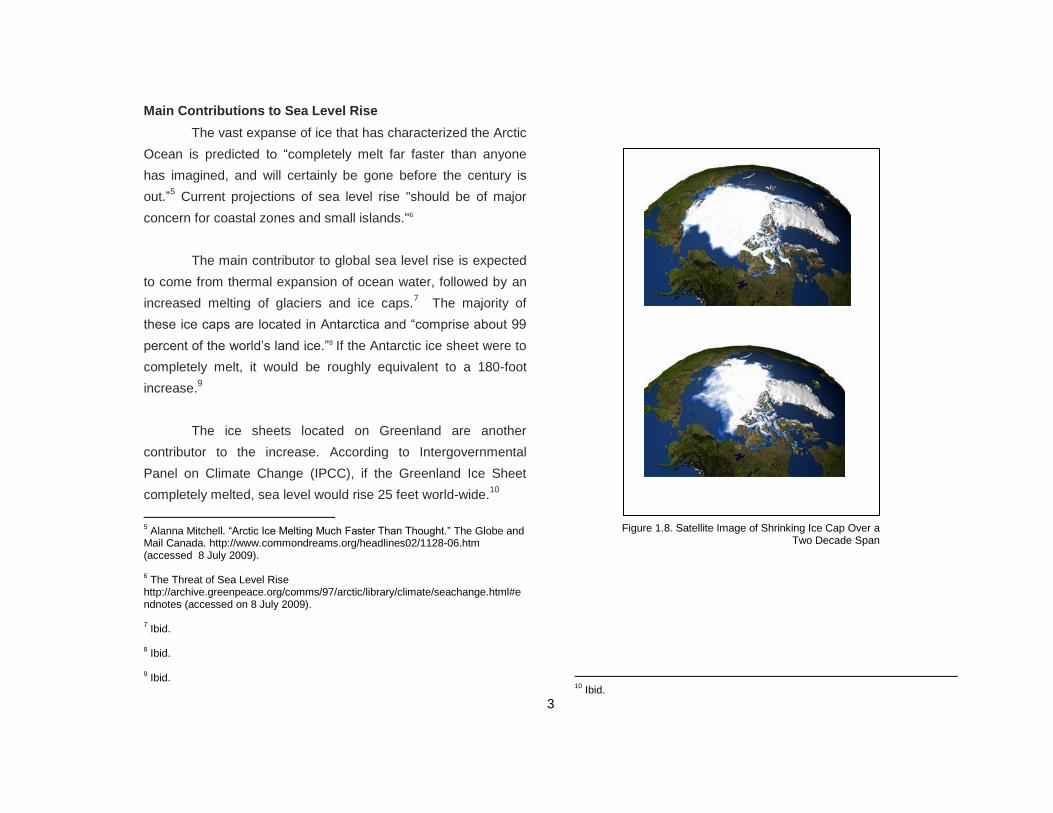
Main Contributions to Sea Level Rise
The vast expanse of ice that has characterized the Arctic
Ocean is predicted to “completely melt far faster than anyone
has imagined, and will certainly be gone before the century is
out.”5 Current projections of sea level rise "should be of major
concern for coastal zones and small islands."6
The main contributor to global sea level rise is expected
to come from thermal expansion of ocean water, followed by an
increased melting of glaciers and ice caps.7 The majority of
these ice caps are located in Antarctica and “comprise about 99
percent of the world‟s land ice.”8 If the Antarctic ice sheet were to
completely melt, it would be roughly equivalent to a 180-foot
increase.9
The ice sheets located on Greenland are another
contributor to the increase. According to Intergovernmental
Panel on Climate Change (IPCC), if the Greenland Ice Sheet
completely melted, sea level would rise 25 feet world-wide.10
5 Alanna Mitchell. “Arctic Ice Melting Much Faster Than Thought.” The Globe and
Mail Canada. http://www.commondreams.org/headlines02/1128-06.htm (accessed 8 July 2009). 6 The Threat of Sea Level Rise
http://archive.greenpeace.org/comms/97/arctic/library/climate/seachange.html#endnotes (accessed on 8 July 2009). 7 Ibid.
8 Ibid.
9 Ibid.
10
Ibid.
Figure 1.8. Satellite Image of Shrinking Ice Cap Over a Two Decade Span
4
CURRENT AND PROJECTED IMPACTS
Recent Flooding Triggered by Climate Change
The consequences of climate change are impacting
people and communities world-wide. While many people remain
unaware of the scope of climate change and sea level rise,
threats are constantly being posed.
On a global scale, the numbers of climate-related
incidents are rapidly rising. “On average, 250 million people a
year are affected by climate-related disasters.”11 In Asia,
approximately 66 million households suffered from damage or
destruction of their homes by floods in 2007.12 “In November
2007, Mexico‟s Tabasco state was swamped by a flood, having
all crops ruined and affecting more than two million people
directly.”13
In the United States, “Hurricane Katrina killed more
than 1,600 people, destroyed 200,000 Gulf Coast homes, and
displaced approximately 1 million people.“14
11
“Number of People Affected by Climate Disaster up 54 Percent by 2015.” Oxfam America. http://www.oxfamamerica.org. (accessed 12
Yagi, Koji, “Indigenous Settlements in Southwest Asia;” (Tokyo: Process Architecture Publishing Co. Ltd., 1980), 27. 13
Climate Action, “The Case for Action” 2007, p.21 14
“Hurricane Katrina-Livability Statistics.” http://uspolitics.about.com/od/katrina/l/bl_katrina_stats.htm (accessed 2 November 2009).
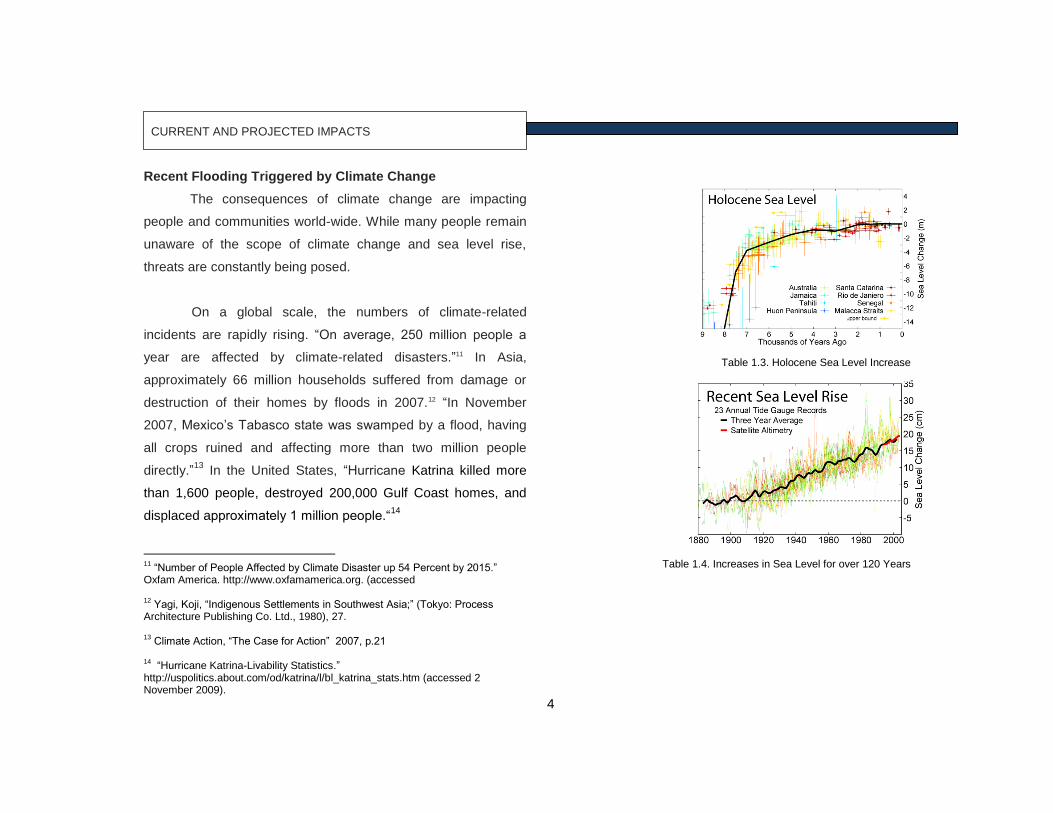
Table 1.4. Increases in Sea Level for over 120 Years
Table 1.3. Holocene Sea Level Increase
5
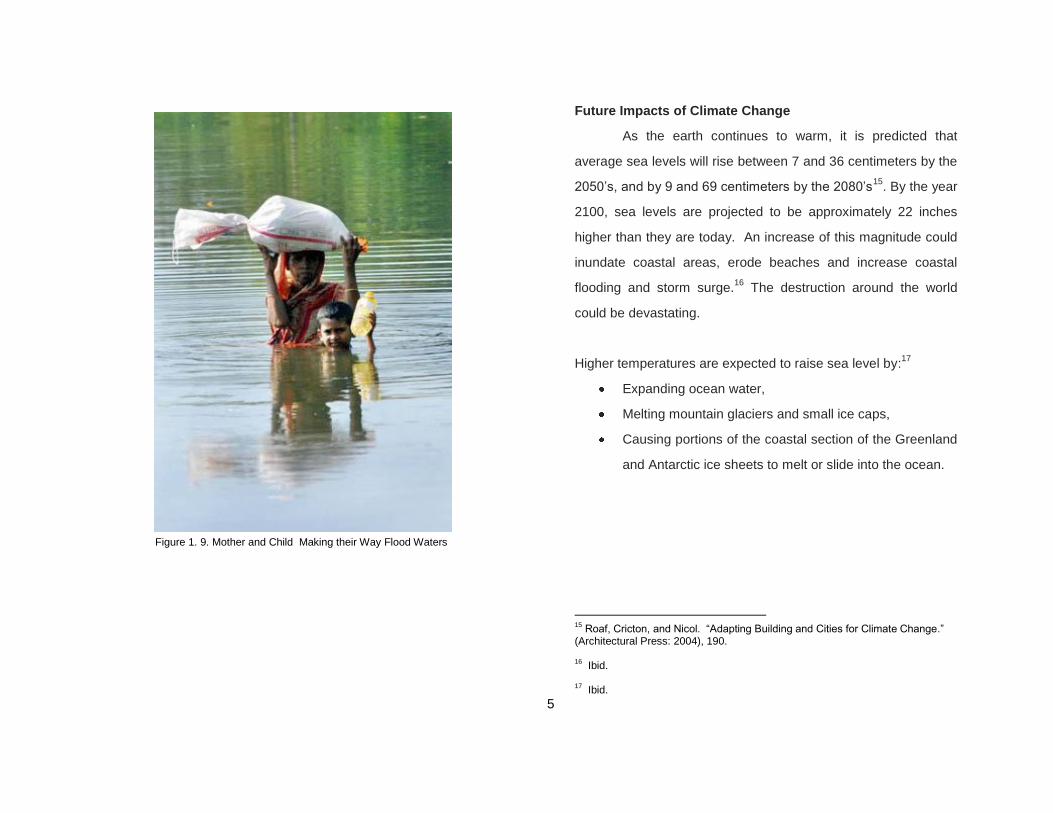
Future Impacts of Climate Change
As the earth continues to warm, it is predicted that
average sea levels will rise between 7 and 36 centimeters by the
2050‟s, and by 9 and 69 centimeters by the 2080‟s15
. By the year
2100, sea levels are projected to be approximately 22 inches
higher than they are today. An increase of this magnitude could
inundate coastal areas, erode beaches and increase coastal
flooding and storm surge.16
The destruction around the world
could be devastating.
Higher temperatures are expected to raise sea level by:17
Expanding ocean water,
Melting mountain glaciers and small ice caps,
Causing portions of the coastal section of the Greenland
and Antarctic ice sheets to melt or slide into the ocean.
15
Roaf, Cricton, and Nicol. “Adapting Building and Cities for Climate Change.” (Architectural Press: 2004), 190. 16
Ibid. 17
Ibid.
Figure 1. 9. Mother and Child Making their Way Flood Waters

6
Global Impacts
As noted by the Intergovernmental Panel on Climate
Change's Third Assessment Report (WG II), the current and
future climate changes induced by global warming will have such
impacts:
Increased coastal erosion, higher storm-surge flooding,
inhibition of primary production processes, more
extensive coastal inundation, changes in surface water
quality and groundwater characteristics, increased loss
of property and coastal habitats, increased flood risk and
potential loss of life, loss of nonmonetary cultural
resources and values, impacts on agriculture through
decline in soil and water quality, and loss of tourism,
recreation, and transportation functions.18
18
IPCC Reports. “Intergovernmental Panel on Climate Change.” Internet; http://www.ipcc.ch/ipccreports/index.htm (accessed on 9 March 2009).
Figure 1. 10. World Regions Vulnerable to Sea Level Rise
7
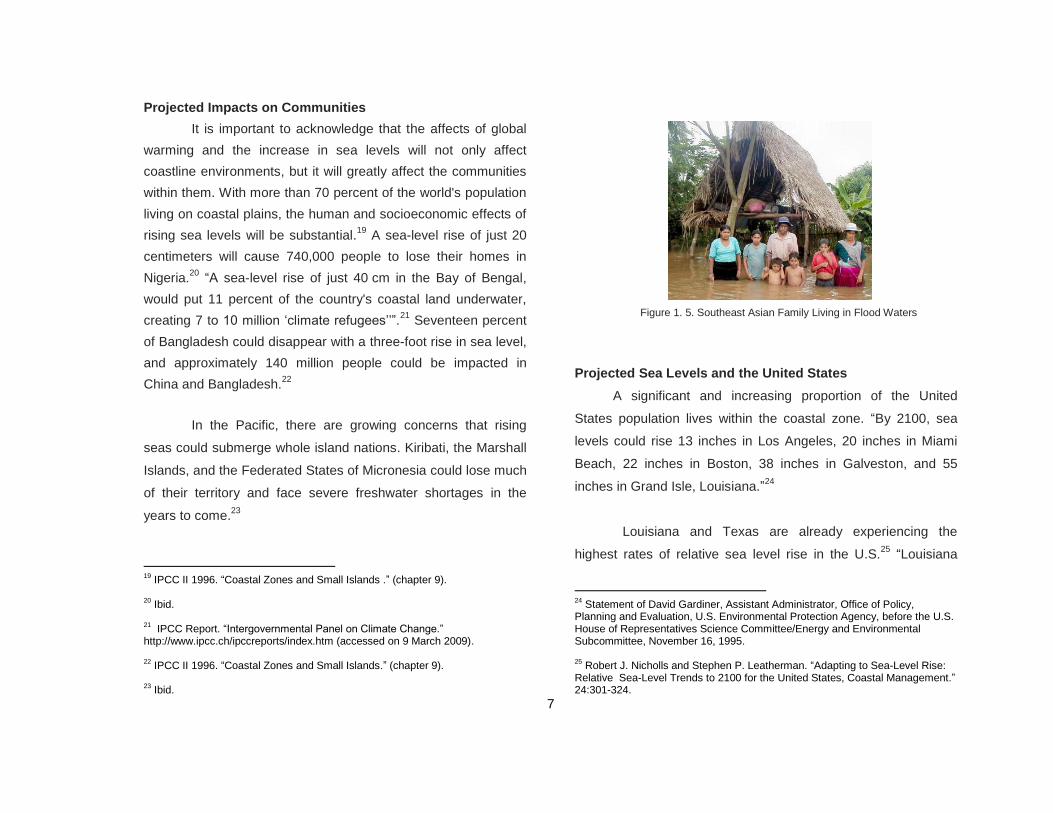
Projected Impacts on Communities
It is important to acknowledge that the affects of global
warming and the increase in sea levels will not only affect
coastline environments, but it will greatly affect the communities
within them. With more than 70 percent of the world's population
living on coastal plains, the human and socioeconomic effects of
rising sea levels will be substantial.19
A sea-level rise of just 20
centimeters will cause 740,000 people to lose their homes in
Nigeria.20
“A sea-level rise of just 40 cm in the Bay of Bengal,
would put 11 percent of the country's coastal land underwater,
creating 7 to 10 million „climate refugees‟‟”.21
Seventeen percent
of Bangladesh could disappear with a three-foot rise in sea level,
and approximately 140 million people could be impacted in
China and Bangladesh.22
In the Pacific, there are growing concerns that rising
seas could submerge whole island nations. Kiribati, the Marshall
Islands, and the Federated States of Micronesia could lose much
of their territory and face severe freshwater shortages in the
years to come.23
19
IPCC II 1996. “Coastal Zones and Small Islands .” (chapter 9). 20
Ibid. 21
IPCC Report. “Intergovernmental Panel on Climate Change.” http://www.ipcc.ch/ipccreports/index.htm (accessed on 9 March 2009). 22
IPCC II 1996. “Coastal Zones and Small Islands.” (chapter 9). 23
Ibid.
Projected Sea Levels and the United States
A significant and increasing proportion of the United
States population lives within the coastal zone. “By 2100, sea
levels could rise 13 inches in Los Angeles, 20 inches in Miami
Beach, 22 inches in Boston, 38 inches in Galveston, and 55
inches in Grand Isle, Louisiana.”24
Louisiana and Texas are already experiencing the
highest rates of relative sea level rise in the U.S.25
“Louisiana
24
Statement of David Gardiner, Assistant Administrator, Office of Policy, Planning and Evaluation, U.S. Environmental Protection Agency, before the U.S. House of Representatives Science Committee/Energy and Environmental Subcommittee, November 16, 1995. 25
Robert J. Nicholls and Stephen P. Leatherman. “Adapting to Sea-Level Rise: Relative Sea-Level Trends to 2100 for the United States, Coastal Management.” 24:301-324.
Figure 1. 5. Southeast Asian Family Living in Flood Waters

8
loses 25 square miles of wetlands per year, due to
subsidence.”26
Sea level near Galveston is also steadily increasing.
Though the city was designed to withstand moderate sea level
rise it could not withstand the levels predicted to result from
global warming. Along the Chesapeake Bay, where many
beaches have already been lost, the sea is rising “more than an
inch per decade.” 27
“In the U.S., a sea level rise consistent with IPCC's
estimates could drown more than 5,000 square miles of dry
land—an area the size of Connecticut—by the year 2100.”28
The
highest risk areas are those currently experiencing rapid erosion
rates and areas at low levels, such as “parts of the Atlantic and
Gulf coasts where sea level is already rising by small amounts
each year.”29
26
Ibid.
27 "Fragile Beaches Being Replaced by Armored Shore." Baltimore Sun. May
25, 1997.
28
D.G. Vaughan and C.S.M. Doake, Recent atmospheric warming and retreat of
ice shelves on the Antarctic Peninsula, Nature, January 25, 1996, 379: 328-330. 29
Mitchell. “Arctic Ice Melting Much Faster Than Thought.”
Climate Change: A Problem that is „Slow to Stop‟
Tom Agnew, a research meteorologist with the
Meteorology Service of Canada, states that “Global warming is
linked to the greenhouse-gas emissions that humans are
pumping into the atmosphere as they burn fossil fuels.”30
As
much as we need to re-evaluate our consumption and reduce
CO2 emissions, the habits formed by nations could be difficult to
stop.
30
Mitchell. “Arctic Ice Melting Much Faster Than Thought.”
Figure 1.6. Hurricane Katrina Victims Seeking Refuge

9
Even if global greenhouse gas emissions are stabilized,
nearly all projections show that sea levels will continue to rise
beyond the year 2100 due to delay in climate response.31
It is believed that even if we eliminated all greenhouse
gas emissions today, “We have already bought decades of
climate change impacts.”32
Over the course of decades the
environment has been slowly destroyed. As research
meteorologist Tom Agnew states, “This change is already taking
effect; the whole system is very slow to start and also very slow
to stop."33
Due to the current circumstances, we should not only
reduce and counteract climate change, but we should prepare
for worst-case scenarios.
31
Ibid.
32 Hefty L, Nichole. Department of Environmental Resource Management.
“Miami- Dade County's Climate Change Adaptation Efforts.”
33
Mitchell. “Arctic Ice Melting Much Faster Than Thought.”
Figure 1.7. Tom Agnew Quote Discussing the Severity of Climate Change

10
CHAPTER 2: SOLUTIONS AND GOALS
CHAPTER 2: THE SOLUTION
11
AQUATECTURE: PREPARING FOR SEA LEVEL INCREASE
Devising a Plan: Project Goals
We should be at a time of great concern. With
catastrophic scenarios posing a threat to billions of people and
communities around the world, it is crucial that defense
strategies against devastation are prepared.
The main goal and intent of this proposal, is to provide
long-term solutions to flooding and rising sea levels for coastal
cities. By taking into considerations the risks created by rising
water levels on a short term and long term (climate-change)
scale, the predominate questions to be answered are: Where will
people go when the water rises? How can people continue to live
in coastal cities in spite of the threats that inundation poses?
What will happen to homes, to cities—to architecture?
Strategies must be implemented to make populated,
economic and city infrastructure “climate proof.”34
Adaptation
strategies should be focused within „hot spots‟, which are areas
that are highly vulnerable to the impacts of climate change—
areas with high human, social, and economic activity.35
34
Royal Netherlands Embassy: “Pioneering Water.” 45. 35
Ibid.
If the areas that are currently threatened by rising sea
levels start to plan and invest in a variety of reliable mitigation
strategies, coastline abandonment could be avoided when water
levels become threatening. However, to successfully do so,
architecture and city planning must start to redefine its current
position.
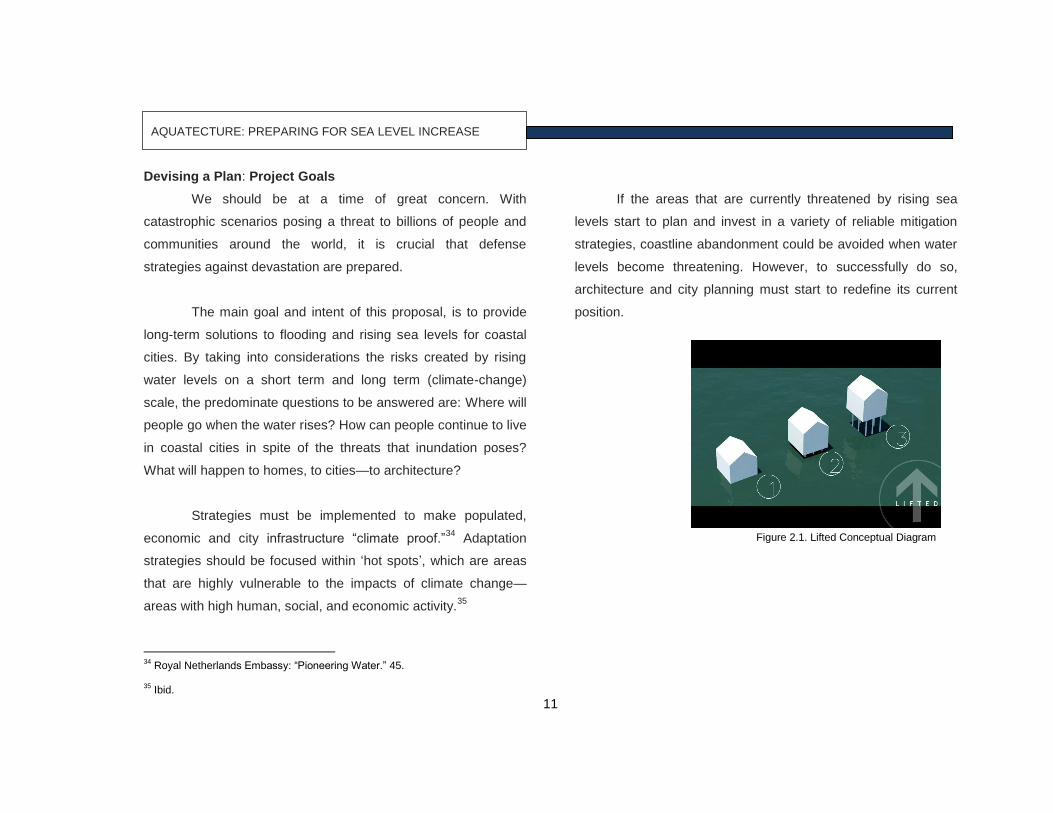
Figure 2.1. Lifted Conceptual Diagram

12
Redefining Architecture to Sustain Communities
People have an unexplainable connection and desire to
live by the water—they will continue to live by water systems in
spite of risk factors and threats they may pose. According to Frits
Schoute, a Dutch engineering professor and advocate of living at
sea, “People are still migrating to metropolises—most of which
lie in coastal regions. Soon there will be these enormous
pressures to colonize the sea.”36
The number of people living in
world is approximately 6-billion, and it will increase to 9-billion by
2050.”37
The Solution: Implementing Aquatecture
The main course of action is to avoid the destruction of
communities through adaptation and the implementation of a
new architectural typology—Aquatecture. Aquatecture—derived
from merging water and architecture—pertains to building types
and adaptive re-use strategies that mitigate and manage flood-
related threats.
To successfully, counteract potential destruction and
migration caused by rising sea levels, the built environment
within coastal communities need to be redefined.
36
Ibid. 37
Ibid.
Step 1: Redefining a Coastal Home
Homes are a primary component in a coastal
community. Without a safe and reliable place to live, people will
become threatened and migrate to inland locations. To avoid this
migration, it is important to redefine the current housing typology.
As a first line of defense, a home that adapts with rising water
will be the first step towards providing alternative, reliable, and
adaptable living solutions.
Step 2: Redefining a Coastal Community
Following the implementation of a reliable and safe
home, a coastal community will be redefined. The proposed
water houses will be one of many components that make up the
water community.
In this proposal, a micro community comprised of 40
homes will be integrated as an introduction to water community
design. As the water rises, and the need increases, growth and
adaptation of the community will follow. This small community of
40 homes will serve as an archetype for future communities in
„endangered areas‟ to adopt.
Step 3: Redefining a Coastal City
As the final phase of Aquatecture, city components will
be redefined. As time progresses, and water rises, high-rise
residential towers, bridges, city infrastructure, etc. will become
13
affected or unusable because of flood waters. In this case, pre-
existing city infrastructure is no longer suitable for its intended
use. As a result of this, adaptive re-use strategies for the building
envelopes and existing infrastructure will be integrated within the
city core.

14
CHAPTER 3: CASE STUDIES
15
CASE STUDY: INDIVIDUAL HOUSING UNIT
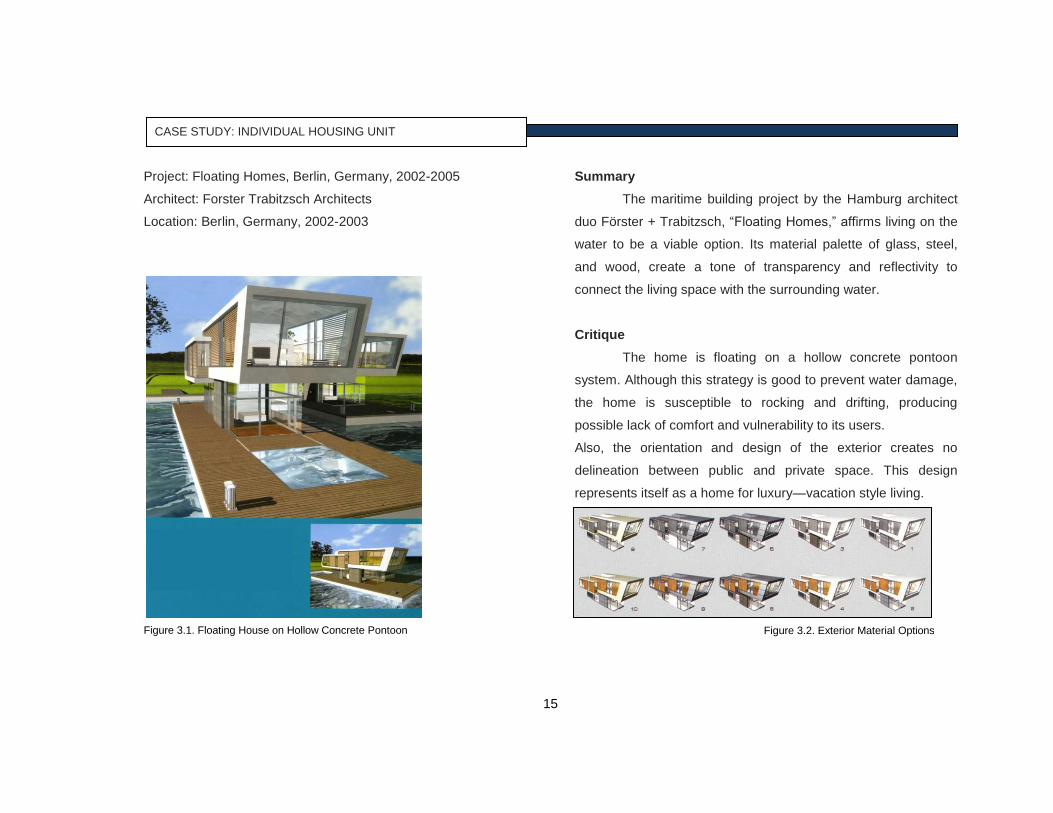
Project: Floating Homes, Berlin, Germany, 2002-2005
Architect: Forster Trabitzsch Architects
Location: Berlin, Germany, 2002-2003
Figure 3.1. Floating House on Hollow Concrete Pontoon
Summary
The maritime building project by the Hamburg architect
duo Förster + Trabitzsch, “Floating Homes,” affirms living on the
water to be a viable option. Its material palette of glass, steel,
and wood, create a tone of transparency and reflectivity to
connect the living space with the surrounding water.
Critique
The home is floating on a hollow concrete pontoon
system. Although this strategy is good to prevent water damage,
the home is susceptible to rocking and drifting, producing
possible lack of comfort and vulnerability to its users.
Also, the orientation and design of the exterior creates no
delineation between public and private space. This design
represents itself as a home for luxury—vacation style living.
Figure 3.2. Exterior Material Options
16
CASE STUDY: ADAPTIVE RE-USE
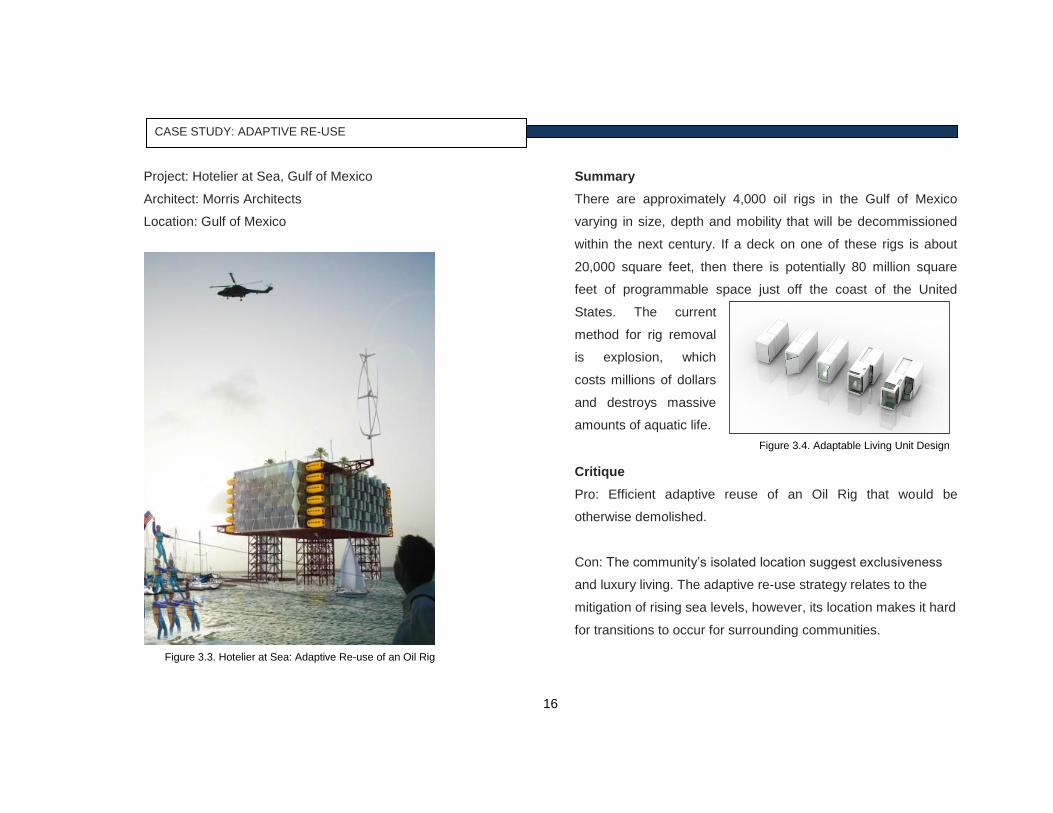
Project: Hotelier at Sea, Gulf of Mexico
Architect: Morris Architects
Location: Gulf of Mexico
Summary
There are approximately 4,000 oil rigs in the Gulf of Mexico
varying in size, depth and mobility that will be decommissioned
within the next century. If a deck on one of these rigs is about
20,000 square feet, then there is potentially 80 million square
feet of programmable space just off the coast of the United
States. The current
method for rig removal
is explosion, which
costs millions of dollars
and destroys massive
amounts of aquatic life.
Critique
Pro: Efficient adaptive reuse of an Oil Rig that would be
otherwise demolished.
Con: The community‟s isolated location suggest exclusiveness
and luxury living. The adaptive re-use strategy relates to the
mitigation of rising sea levels, however, its location makes it hard
for transitions to occur for surrounding communities.
Figure 3.3. Hotelier at Sea: Adaptive Re-use of an Oil Rig
Figure 3.4. Adaptable Living Unit Design
17
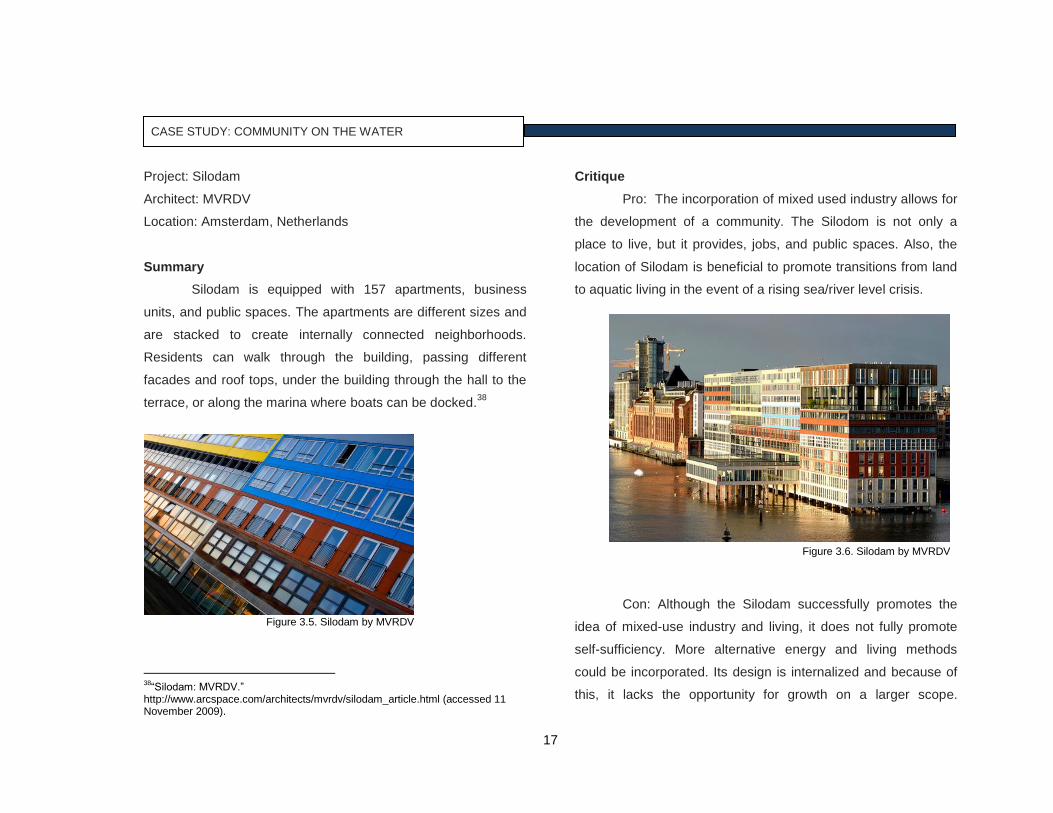
CASE STUDY: COMMUNITY ON THE WATER
Project: Silodam
Architect: MVRDV
Location: Amsterdam, Netherlands
Summary
Silodam is equipped with 157 apartments, business
units, and public spaces. The apartments are different sizes and
are stacked to create internally connected neighborhoods.
Residents can walk through the building, passing different
facades and roof tops, under the building through the hall to the
terrace, or along the marina where boats can be docked.38
38
“Silodam: MVRDV.” http://www.arcspace.com/architects/mvrdv/silodam_article.html (accessed 11 November 2009).
Critique
Pro: The incorporation of mixed used industry allows for
the development of a community. The Silodom is not only a
place to live, but it provides, jobs, and public spaces. Also, the
location of Silodam is beneficial to promote transitions from land
to aquatic living in the event of a rising sea/river level crisis.
Con: Although the Silodam successfully promotes the
idea of mixed-use industry and living, it does not fully promote
self-sufficiency. More alternative energy and living methods
could be incorporated. Its design is internalized and because of
this, it lacks the opportunity for growth on a larger scope.
Figure 3.6. Silodam by MVRDV
Figure 3.5. Silodam by MVRDV

18
PRECEDENT STUDY: THE NETHERLANDS
Adopting Dutch Strategies
When choosing precedents, Holland serves as a
successful example. The Netherlands have been threatened by
the water systems that surround them for hundreds of years. The
top two-thirds of the country are at or below sea level, and the
whole country is vulnerable to river flooding and tidal inundation.
In spite of these circumstances, more than 11 million people—
two-thirds of all Dutch citizens—live in these areas, and 70
percent of Dutch gross domestic product is produced in these
flood prone areas.39
Due to these circumstances, the Dutch have had to
conceptualize and develop their communities to avoid flooding.
While developing this proposal—Aquatecture—the Netherlands
served as a predecessor for innovation.
For years, they have battled the sea Instead of
constantly fighting it; their country has learned to view water as a
site opportunity. Currently in the Netherlands, projects are being
designed to accommodate living and the sea.
39
“Pioneering Water.” Royal Netherlands Embassy. 25.
Hurricane Katrina‟s devastation shocked the world. As a
response to the unfortunate event, the Dutch have strategized
with U.S. public and private sector officials how Dutch expertise
and technology might strengthen U.S. flood protection systems.
Currently, Policymakers from Florida and the Netherlands are
sharing best practices on water system management, climate
change, environmental restoration, emergency response, and
sound waterfront development.40
40
Ibid, 27.
Figure 3.7. Waterstudio NL Waterhouse Architecture

19
CHAPTER 4: PROJECT CONCEPT
20
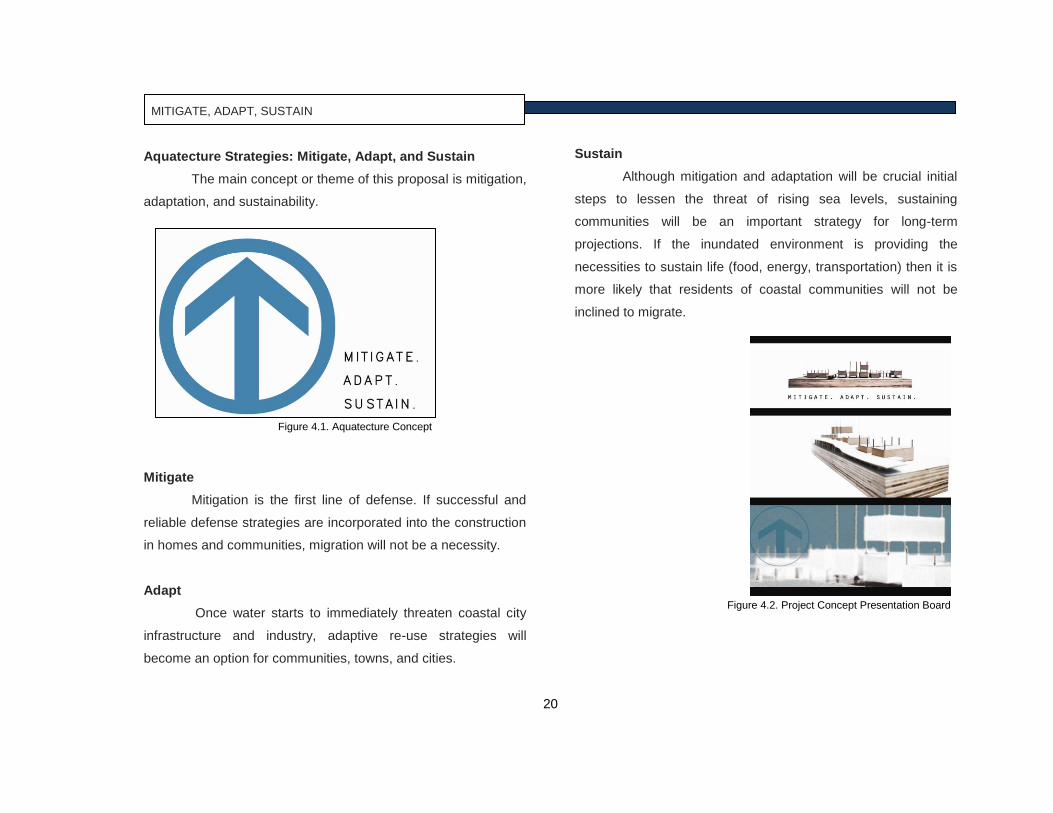
MITIGATE, ADAPT, SUSTAIN
Aquatecture Strategies: Mitigate, Adapt, and Sustain
The main concept or theme of this proposal is mitigation,
adaptation, and sustainability.
Mitigate
Mitigation is the first line of defense. If successful and
reliable defense strategies are incorporated into the construction
in homes and communities, migration will not be a necessity.
Adapt
Once water starts to immediately threaten coastal city
infrastructure and industry, adaptive re-use strategies will
become an option for communities, towns, and cities.
Sustain
Although mitigation and adaptation will be crucial initial
steps to lessen the threat of rising sea levels, sustaining
communities will be an important strategy for long-term
projections. If the inundated environment is providing the
necessities to sustain life (food, energy, transportation) then it is
more likely that residents of coastal communities will not be
inclined to migrate.
Figure 4.1. Aquatecture Concept
Figure 4.2. Project Concept Presentation Board

21
CHAPTER 5: SITE SELECTION AND ANAYLSIS

22
SITE SELECTION PROCESS
Site Selection and Risk Management
As water levels rise and start to impact communities
worldwide, the areas with the highest population, infrastructure,
and economic investment should be benchmarks as to where
adaptation should occur. It is important to examine the risks in
order to „water-proof‟ the coastlines threatened by inundation.
There are varying degrees of threats dispersed around the world.
Targeting areas with the highest risk factors first, will provide
rankings of possible impact—most vulnerable sites to least
vulnerable site. Three factors used to evaluate site risks are: (1)
Vulnerability (2) Exposure (3) Hazard.41
Vulnerability: The lack of ability people may have to
adapt to sea level rise.
Exposure: Relating to geographical location, latitude,
and the current risk to water. In the case of inundation,
developments situated adjacent to a water systems will
be the most exposed.
Hazard: The size of the risk and the frequency with
which it will be experienced.
41
“Adapting Cities for Climate Change” 63-65.
This risk analysis model provides a practical strategy for site
selection and scenario planning. From this analysis, the site was
chosen.
(Possible) Hazard X Vulnerability X Exposure= (Possible) Impact
Figure 5.1 The Crichton Risk Triangle
42
42
The Crichton Risk Triangle. (Source: Crichton, D.C. (2001) in the Climate Change for the Insurance Industry, ed. Dr. J. Salt, Building Research Establishment, UK. D.C. Crichton 2001).
23
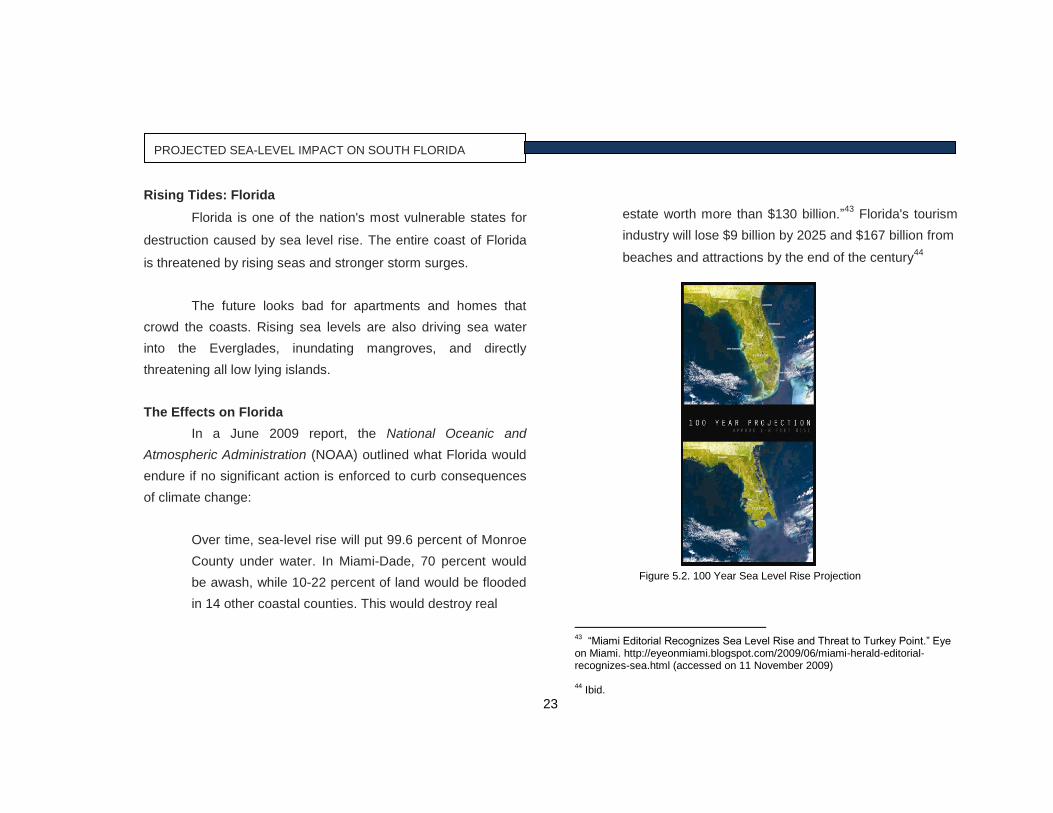
PROJECTED SEA-LEVEL IMPACT ON SOUTH FLORIDA
Rising Tides: Florida
Florida is one of the nation's most vulnerable states for
destruction caused by sea level rise. The entire coast of Florida
is threatened by rising seas and stronger storm surges.
The future looks bad for apartments and homes that
crowd the coasts. Rising sea levels are also driving sea water
into the Everglades, inundating mangroves, and directly
threatening all low lying islands.
The Effects on Florida
In a June 2009 report, the National Oceanic and
Atmospheric Administration (NOAA) outlined what Florida would
endure if no significant action is enforced to curb consequences
of climate change:
Over time, sea-level rise will put 99.6 percent of Monroe
County under water. In Miami-Dade, 70 percent would
be awash, while 10-22 percent of land would be flooded
in 14 other coastal counties. This would destroy real
estate worth more than $130 billion.”43
Florida's tourism
industry will lose $9 billion by 2025 and $167 billion from
beaches and attractions by the end of the century44
43
“Miami Editorial Recognizes Sea Level Rise and Threat to Turkey Point.” Eye on Miami. http://eyeonmiami.blogspot.com/2009/06/miami-herald-editorial-recognizes-sea.html (accessed on 11 November 2009) 44
Ibid.
Figure 5.2. 100 Year Sea Level Rise Projection

24
Sea-level rise will destroy important infrastructure
throughout South Florida: Two nuclear power plants, three
prisons, 68 hospitals, 74 airports, 334 public schools and nearly
20,000 historic structures.45
Gradual warming and rising of the seas will increase
hurricane-intensity, inflicting an estimated $25 billion in damages
on Floridians by 205046
45
Ibid. 46
Ibid.
Sea Level Rise and South Florida
South Florida faces the most threats. It will be one of the
first regions in the world to be affected as the sea levels rise.
Patrick Gleason, a geologist and member of the Broward County
Climate Change Committee, noted that South Florida is “among
the world's more vulnerable areas, due to low elevation and a
porous limestone base.”47
The state of Florida is already dealing
with flooding, and coastal erosion, but is still using traditional and
insufficient means of mitigation.
Climate Change Impacts to South Florida48
● Flooding
● Infrastructure Damage/Loss
● Beach Erosion
● Loss of Coastal Wetlands
● Drinking Water Supply
● Loss of Tourism
● Agricultural/Fishing Impacts
47
Cammy Clark. “Florida Keys Ill Prepared for Rising Sea.” Carbon Based:
Climate Change Adaptation. http://carbon-based-ghg.blogspot.com/2009/06/florida-keys-ill-prepared-for-rising.html (accessed on 11 November 2009). 48
“Miami-Dade County‟s Climate Change Adaption Efforts”
Figure 5.3. South Florida Projected to be the Most Vulnerable Area in Florida
25
THE SITE- MIAMI FLORIDA
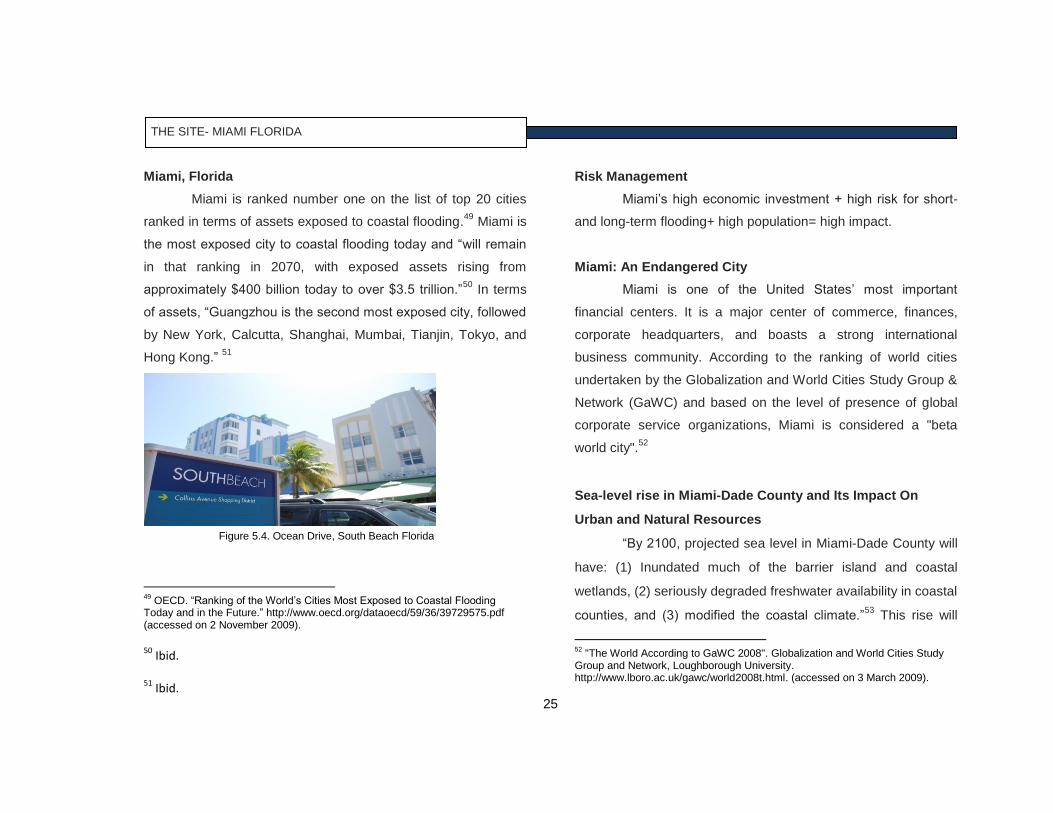
Miami, Florida
Miami is ranked number one on the list of top 20 cities
ranked in terms of assets exposed to coastal flooding.49
Miami is
the most exposed city to coastal flooding today and “will remain
in that ranking in 2070, with exposed assets rising from
approximately $400 billion today to over $3.5 trillion.”50
In terms
of assets, “Guangzhou is the second most exposed city, followed
by New York, Calcutta, Shanghai, Mumbai, Tianjin, Tokyo, and
Hong Kong.” 51
49
OECD. “Ranking of the World‟s Cities Most Exposed to Coastal Flooding Today and in the Future.” http://www.oecd.org/dataoecd/59/36/39729575.pdf (accessed on 2 November 2009).
50
Ibid. 51
Ibid.
Risk Management
Miami‟s high economic investment + high risk for short-
and long-term flooding+ high population= high impact.
Miami: An Endangered City
Miami is one of the United States‟ most important
financial centers. It is a major center of commerce, finances,
corporate headquarters, and boasts a strong international
business community. According to the ranking of world cities
undertaken by the Globalization and World Cities Study Group &
Network (GaWC) and based on the level of presence of global
corporate service organizations, Miami is considered a "beta
world city".52
Sea-level rise in Miami-Dade County and Its Impact On
Urban and Natural Resources
“By 2100, projected sea level in Miami-Dade County will
have: (1) Inundated much of the barrier island and coastal
wetlands, (2) seriously degraded freshwater availability in coastal
counties, and (3) modified the coastal climate.”53
This rise will
52
"The World According to GaWC 2008". Globalization and World Cities Study Group and Network, Loughborough University. http://www.lboro.ac.uk/gawc/world2008t.html. (accessed on 3 March 2009).
Figure 5.4. Ocean Drive, South Beach Florida

26
also result in unique ecological problems as the region‟s natural
resources respond to relatively rapid and widespread flooding. 54
In order to better understand the impact of sea-level rise in the
Miami-Dade County area, maps of the region‟s coastal
topography were constructed and then “flooded” at one foot
intervals to sea level heights projected by the Intergovernmental
Panel on Climate Change. The impact of each flooding scenario
on urban and natural resources was then evaluated.
Two sea-level elevations were identified as critical “nick
points” that trigger rapid and widespread flooding. “At a nick
point of about +6 ft, a very plausible height under even the most
conservative sea level-rise models, only the highest mainland
elevations on the Atlantic Coastal Ridge will remain above sea
level, while the vast majority of urbanized areas and associated
ecosystems will be under water.”55
53
Peter W. Harlem. “Sea Level Rise in Miami-Dade County and its Impact on Urban and Natural Recourses.” Southeast Environmental Research Center, Florida International University. http://spacecoastclimatechange.com/images/Harlem_Abstract.pdf (accessed on 8 November 2009). 54
Ibid. 55
Ibid.
Figure 5.5. Satellite Image of Miami, Florida (Year 2009)
Figure 5.6. Projected Sea Level Impact: Miami (Year 2100)
27
Miami Residents: Interview
Due to Miami‟s proximity to water, they are a city
constantly threatened by water. Interviews were conducted to
discover the inconveniences brought on by short-term flooding.
As stated by Miguel Quesada, a 25-year resident of Miami
Beach, “Every rainy season, my house floods….Frequently, it
floods to the point that I can‟t even leave my house.” He
continued to explain how this problem is getting worse and it is
not only triggered by hurricane activity—it occurs every time
there is a heavy downpour. Unfortunately, heavy downpours are
very common during the summertime in Florida.
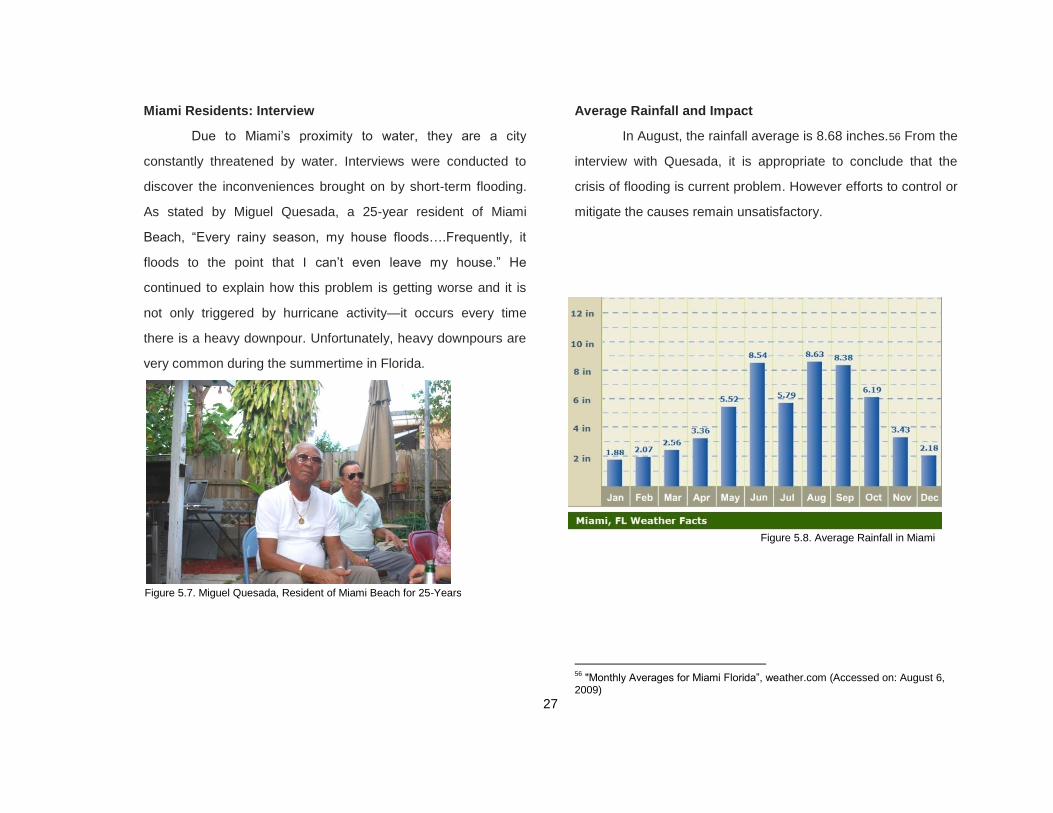
Average Rainfall and Impact
In August, the rainfall average is 8.68 inches.56 From the
interview with Quesada, it is appropriate to conclude that the
crisis of flooding is current problem. However efforts to control or
mitigate the causes remain unsatisfactory.
56
"Monthly Averages for Miami Florida”, weather.com (Accessed on: August 6, 2009)
Figure 5.8. Average Rainfall in Miami
Figure 5.7. Miguel Quesada, Resident of Miami Beach for 25-Years
28
Is Miami Prepared for Rising Sea Levels?
In spite of the current threat, Miami does not have a
sufficient plan to combat the reality of rising sea levels. “Miami‟s
Current Mitigation Strategies to Short-Term and Long Term
Flooding” are as follows:
Prepare for Flooding
Elevate the furnace, water heater, and electric panel in
your home if you live in an area that has a high flood
risk.
Consider installing "check valves" to prevent flood water
from backing up into the drains of your home.
A flash flood warning means a flash flood is occurring.
Seek higher ground immediately; do not wait for
instructions.
Plan to Evacuate
Plan how you will leave and where you will go if you are
advised to evacuate.
If you do not have a car, plan alternate means of
evacuating.
Do not walk through moving water, if possible. Look for
areas where the water is not moving. What might see
like a small amount of moving water can easily knock
you down.
Do not drive into flooded areas. If your vehicle becomes
surrounded by rising water, get out quickly and move to
higher ground, if possible.
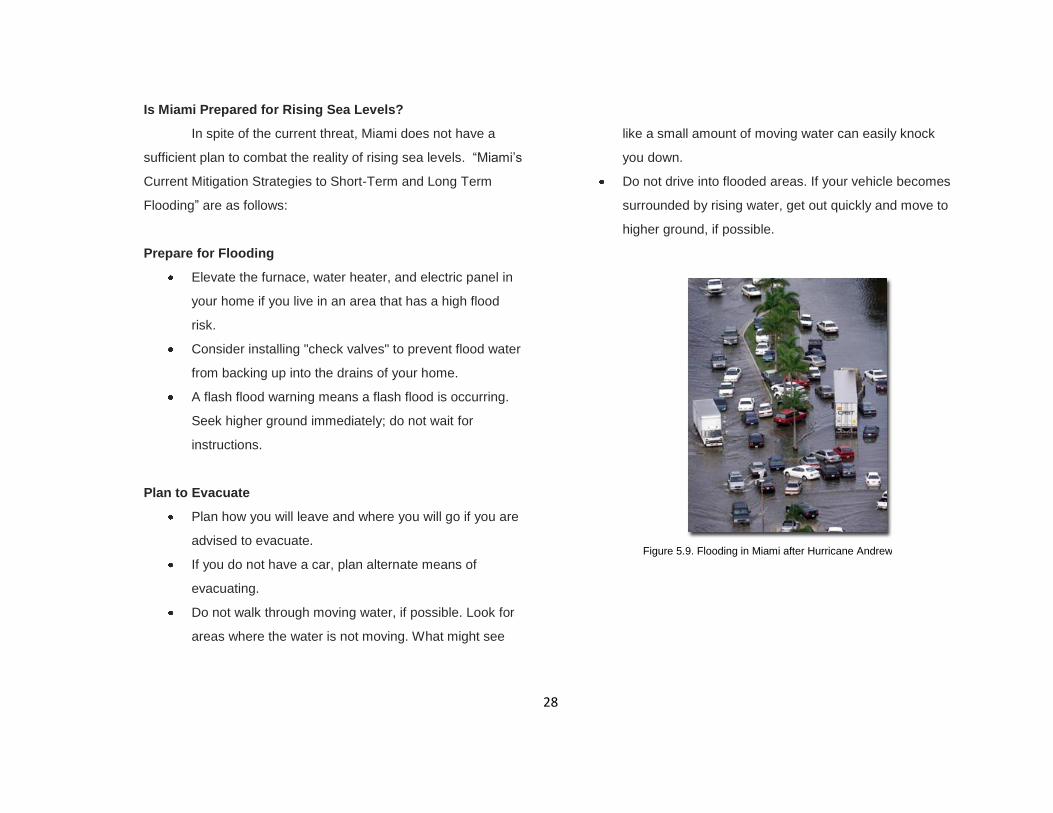
Figure 5.9. Flooding in Miami after Hurricane Andrew

29
Stay Informed
Stay out of flood waters, if possible. The water may be
contaminated or electrically charged. However, should
you find yourself trapped in your vehicle in rising water
get out immediately and seek higher ground.
Stay away from downed power lines to avoid the risk of
electric shock or electrocution.
Do not return to your home until local authorities say it is
safe. Even after flood waters recede, roads may be
weakened and could collapse. Buildings may be
unstable, and drinking water may be contaminated. Use
common sense and exercise caution.57
Aquatecture Opportunities within the Miami-Miami Beach
Context
Many areas in Miami will be affected in some way by
rising sea levels. Aquatecture will be presented in phases.
Phase 1: Incorporating housing units that adapt
to water level increases
Phase 2: Aqua-Communities start to form within
intercoastal water
Phase 3: Adaptive Re-use of existing building
structures in urban conditions: Barnacle-Living
57
“Floods.” Miami.gov. http://www.miamidade.gov/oem/floods.asp (accessed on 12 October 2009).
Figure 5.10. Site Analysis: View of Miami from North Key Biscayne

30
CHAPTER 6: REDEFINING A COASTAL HOME
31
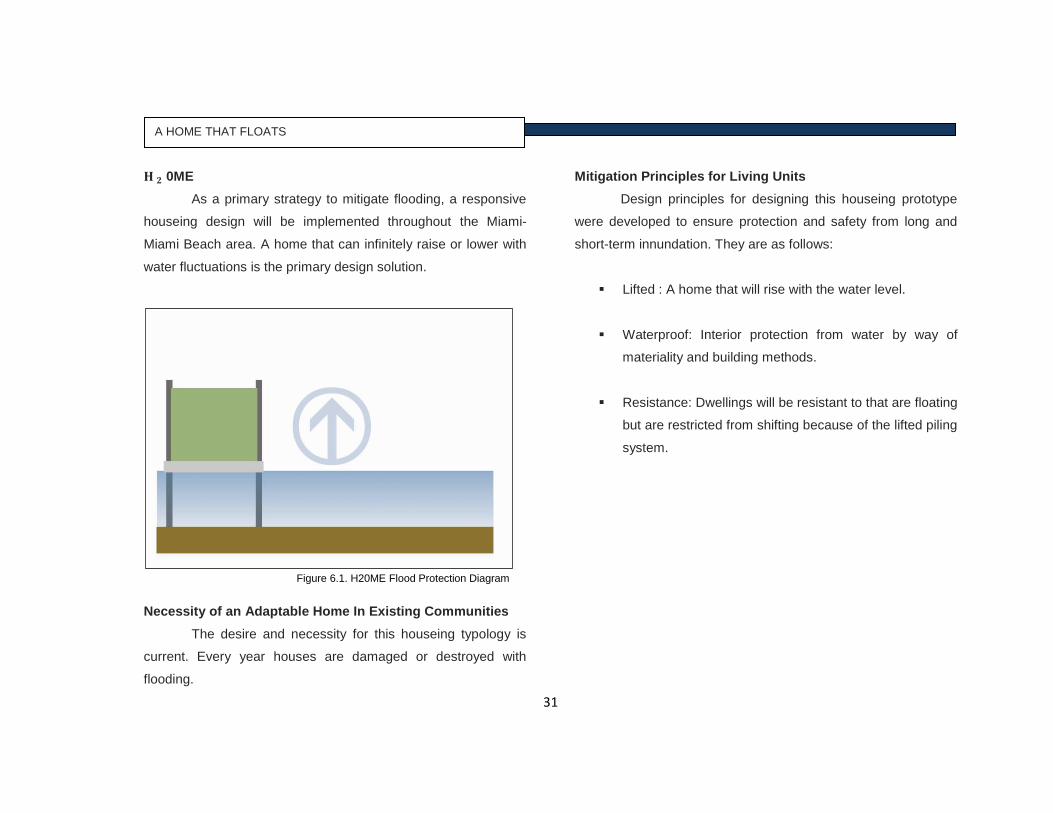
A HOME THAT FLOATS
0ME
As a primary strategy to mitigate flooding, a responsive
houseing design will be implemented throughout the Miami-
Miami Beach area. A home that can infinitely raise or lower with
water fluctuations is the primary design solution.
Necessity of an Adaptable Home In Existing Communities
The desire and necessity for this houseing typology is
current. Every year houses are damaged or destroyed with
flooding.
Mitigation Principles for Living Units
Design principles for designing this houseing prototype
were developed to ensure protection and safety from long and
short-term innundation. They are as follows:
Lifted : A home that will rise with the water level.
Waterproof: Interior protection from water by way of
materiality and building methods.
Resistance: Dwellings will be resistant to that are floating
but are restricted from shifting because of the lifted piling
system.
Figure 6.1. H20ME Flood Protection Diagram

32
Lifted: Rising with the Water
Nautical engineering will be adopted to redefine living
unit design and construction methods. To create a living situation
that is reliable and adaptable in high-risk areas for flooding,
floating dock technology will be adopted. Traditionally, a floating
dock is comprised of a buoyant subsurface material and topped
with a secondary material. Some floating docks are designed
with pilings incorporated that act as guides to allow the platform
to glide up and down in accordance with the surrounding water
levels.
The base of each home will be equipped with a buoyant
platform to keep each unit afloat. Additionally, pilings will be used
as guides to allow each unit to rise in accordance to the level of
water in which it resides. The piling system is designed to
promote adaptation to a variety of water levels. Each pilling
guide is comprised of five-foot galvanized steel sections. As the
water continues to rise and the distance of the exposed piling is
reduced, another guide can be linked and attached to create
more length. This additive and subtractive method provides
reassurance that the unit can withstand any height increase in
water levels.
Ultimately, this flood protection system can provide a
sense of security and reliability for home owners residing in
endangered community zones. This adaptable „floating dock
strategy can also be very useful in locations where dramatic
fluctuations in water levels occur frequently.
Figure 6.2. Floating Boat Dock in the Everglades, Florida

33
Figure 6.3. H20ME: Housing Unit Concept
34
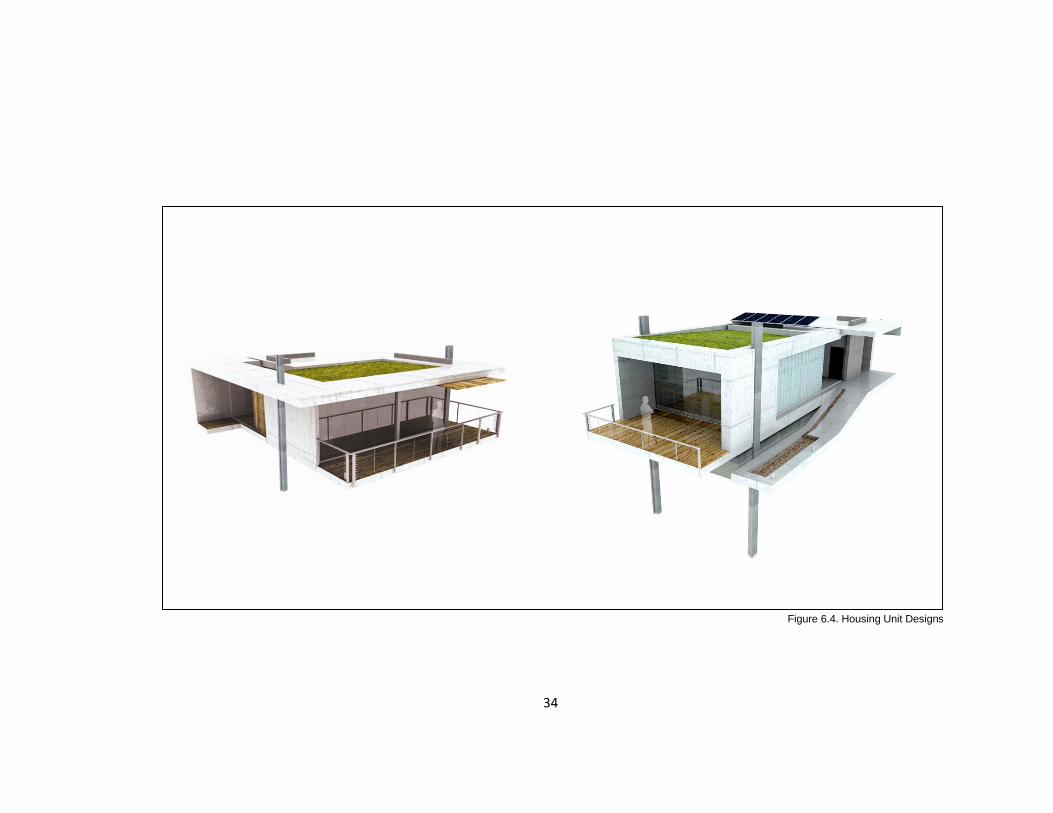
Figure 6.4. Housing Unit Designs

35
Figure 6.5. One Bedroom Housing Unit Design

36
Figure 6.6. Two Bedroom Housing Unit Design

37
Figure 6.7. Three Bedroom Housing Unit Design

38
Figure 6.8. Row of Waterhouses in Miami Intercoastal Waters
39
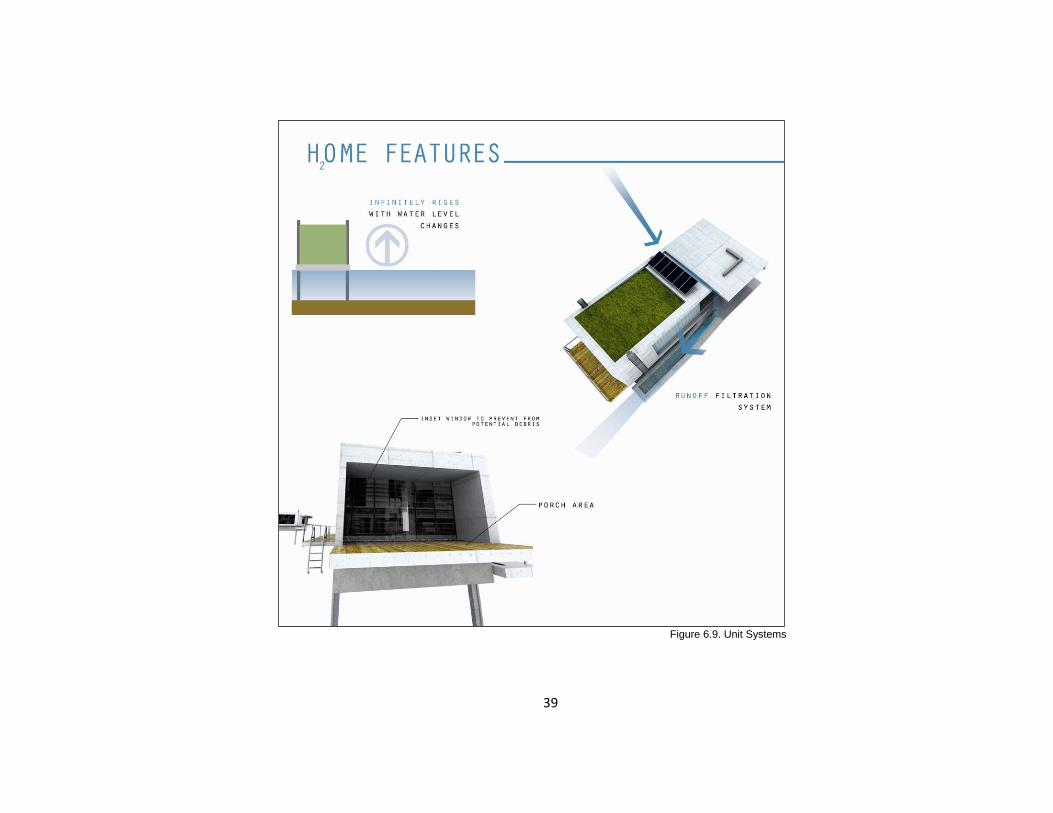
Figure 6.9. Unit Systems

40
Figure 6.10. Unit Sustainable Systems
41
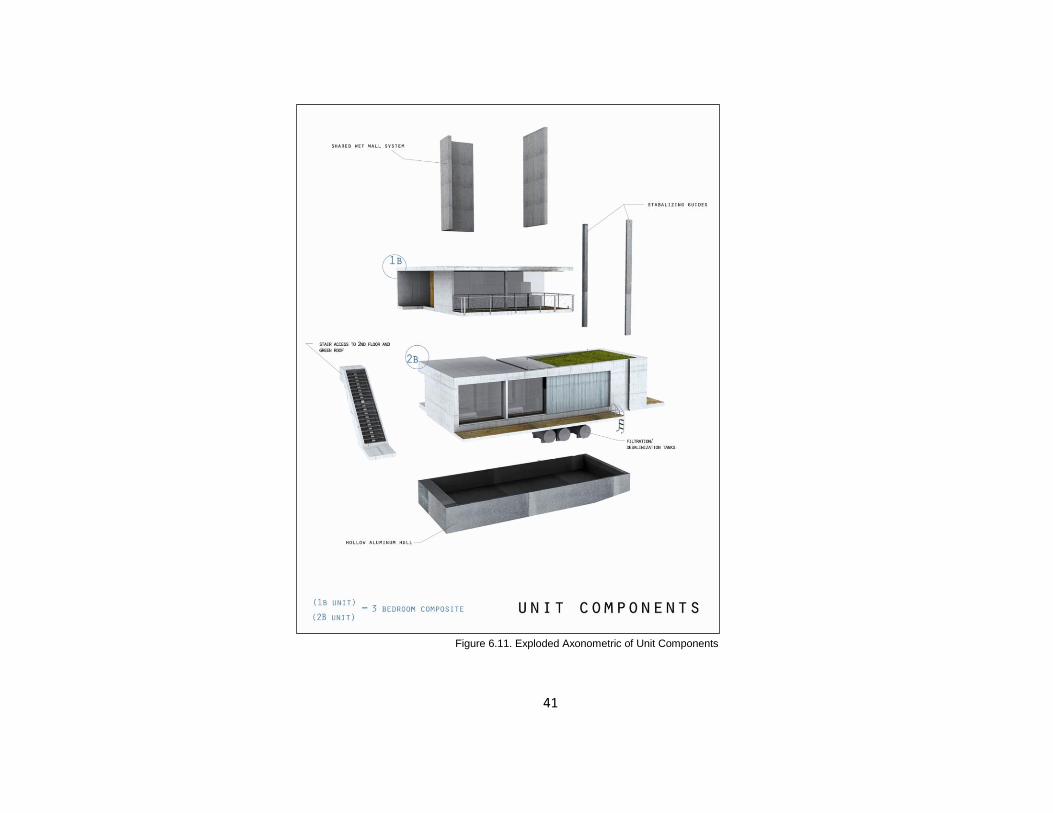
Figure 6.11. Exploded Axonometric of Unit Components

42
Figure 6.12. Set of Housing Units from Above
43
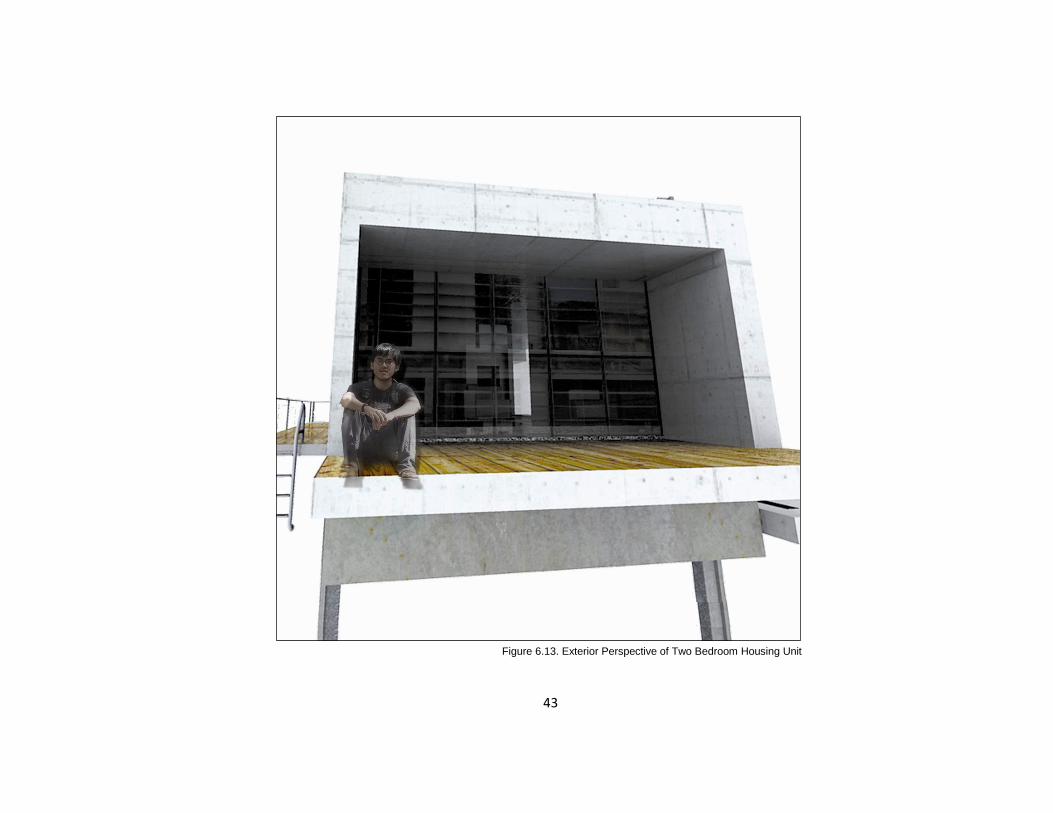
Figure 6.13. Exterior Perspective of Two Bedroom Housing Unit
44
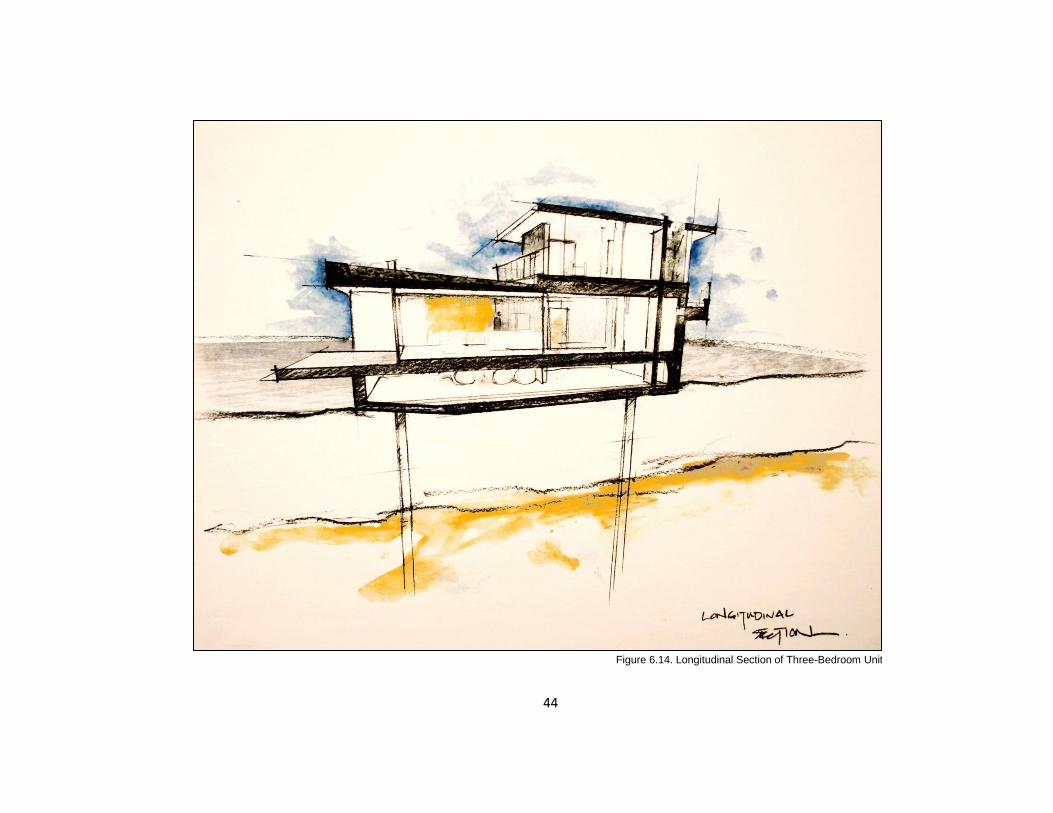
Figure 6.14. Longitudinal Section of Three-Bedroom Unit
45
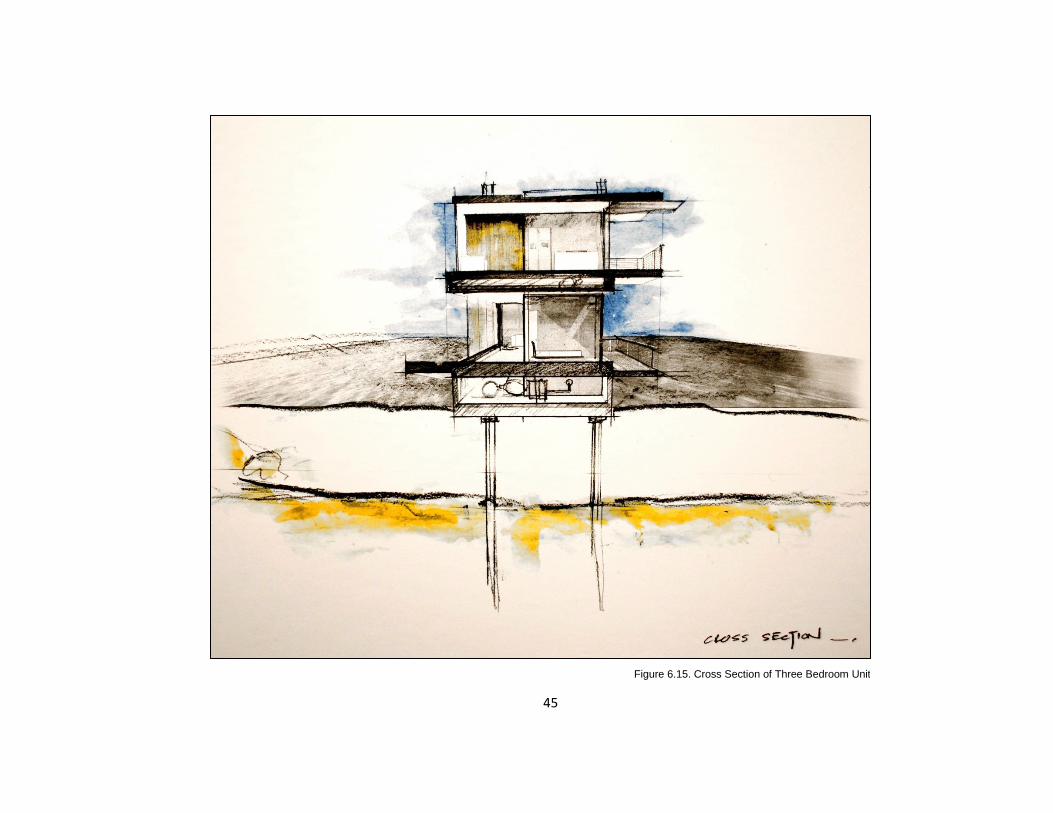
Figure 6.15. Cross Section of Three Bedroom Unit

46
Figure 6.16. H2OME Unit Perspectives

47
Figure 6.17. Final Model: One Bedroom Unit View #1
48
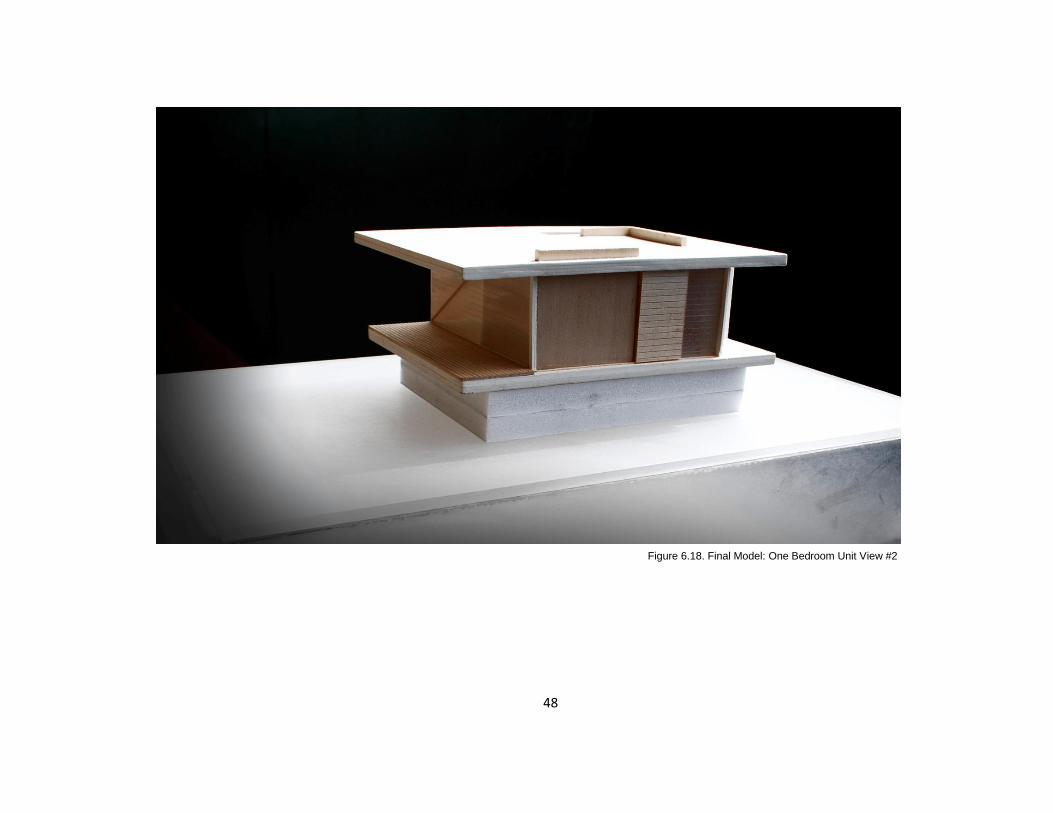
Figure 6.18. Final Model: One Bedroom Unit View #2

49
Figure 6.19. Final Model: Two Bedroom Unit View #1

50
Figure 6.20. Final Model: Two Bedroom Unit View #2

51
Figure 6.21. Final Model: One Bedroom Unit View #1

52
Figure 6.22. Final Model: Two Bedroom Unit View #4
53
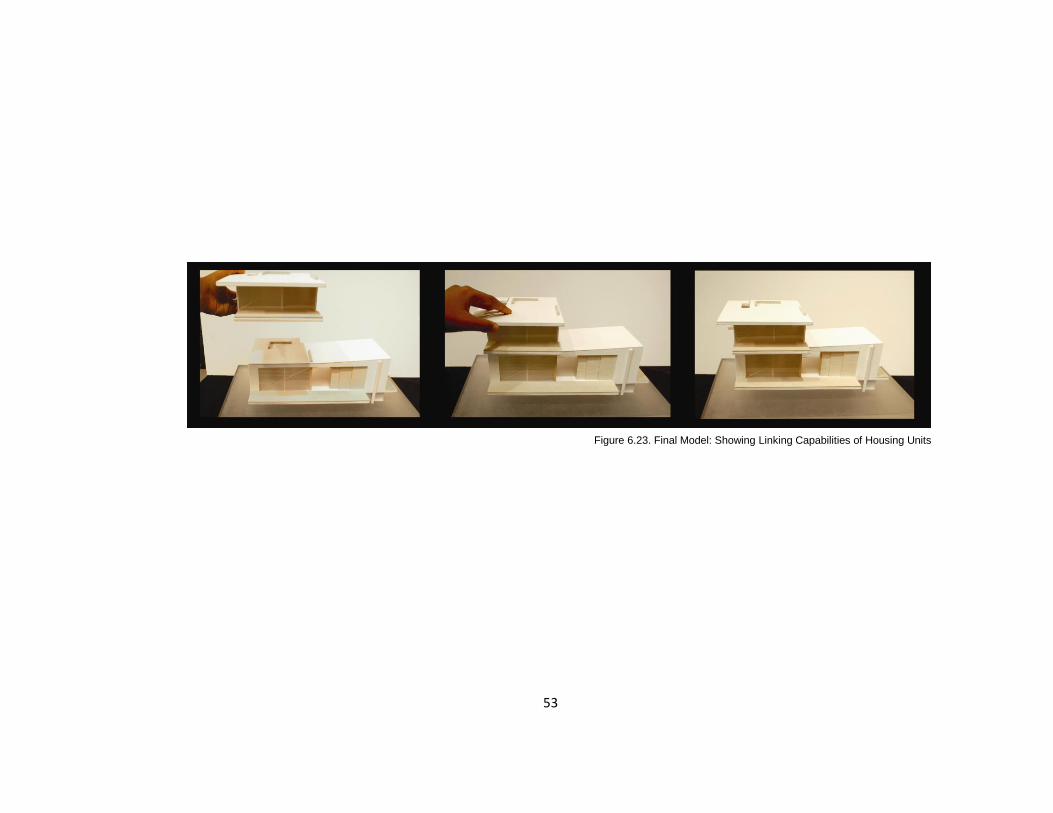
Figure 6.23. Final Model: Showing Linking Capabilities of Housing Units

54
Figure 6.24. Final Model: Three Bedroom Unit View # 1
55
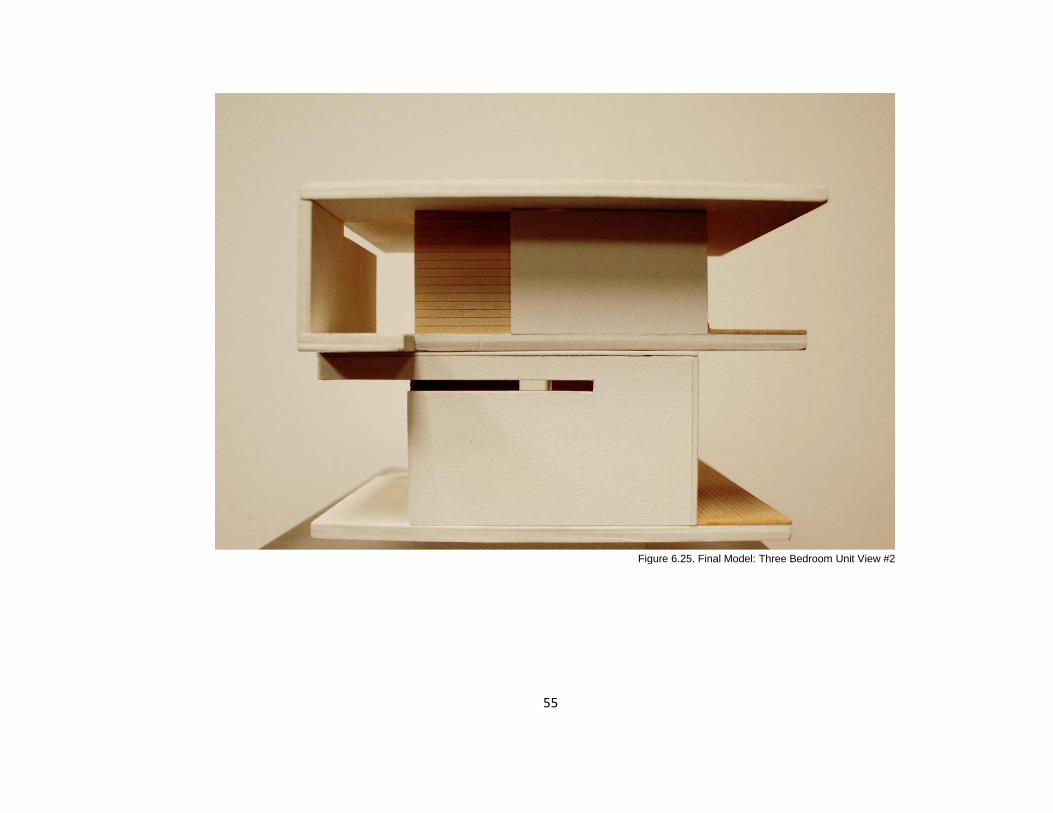
Figure 6.25. Final Model: Three Bedroom Unit View #2

56
CHAPTER 7: REDEFINING A COASTAL COMMUNITY

57
WHEN HOMES CREATE A COMMUNITY
Aquatecture Community Development
Following the implementation of a reliable and safe
home, each unit will be oriented to promote community
development. In this proposal, a micro community of 40 homes
will be created. From that, possibilities of growth and adaptation
will be explored. This small community of 40 homes serves as an
archetype to future communities and will be an example to future
Aquatecture communities in threatened areas.
Main Community Goals
Goals are set forth to exemplify the main intent of water
community development. They are as follows:
Alternative Living
Adaptability
Self Sustain
Archetype
Alternative Living:
Over-time, the majority of the water communities will be
branching from island and areas affected by rising water levels.
Due to the adjacency to the previously inhabited (now destroyed
and inundated) environments, a transition will occur. As water
continues to be a threat to pre-existing communities, the need for
water communities will increase.
Adaptability
Due to the magnitude of people that this crisis will be
affecting, it is important to consider the possibilities of growth
and configurations that these communities can undergo. The
community is built on a 20‟ by 20‟ structural module. The housing
units are designed for their width to fit on this module. Because
of this system, a house can be added or removed from the
community module at any time.
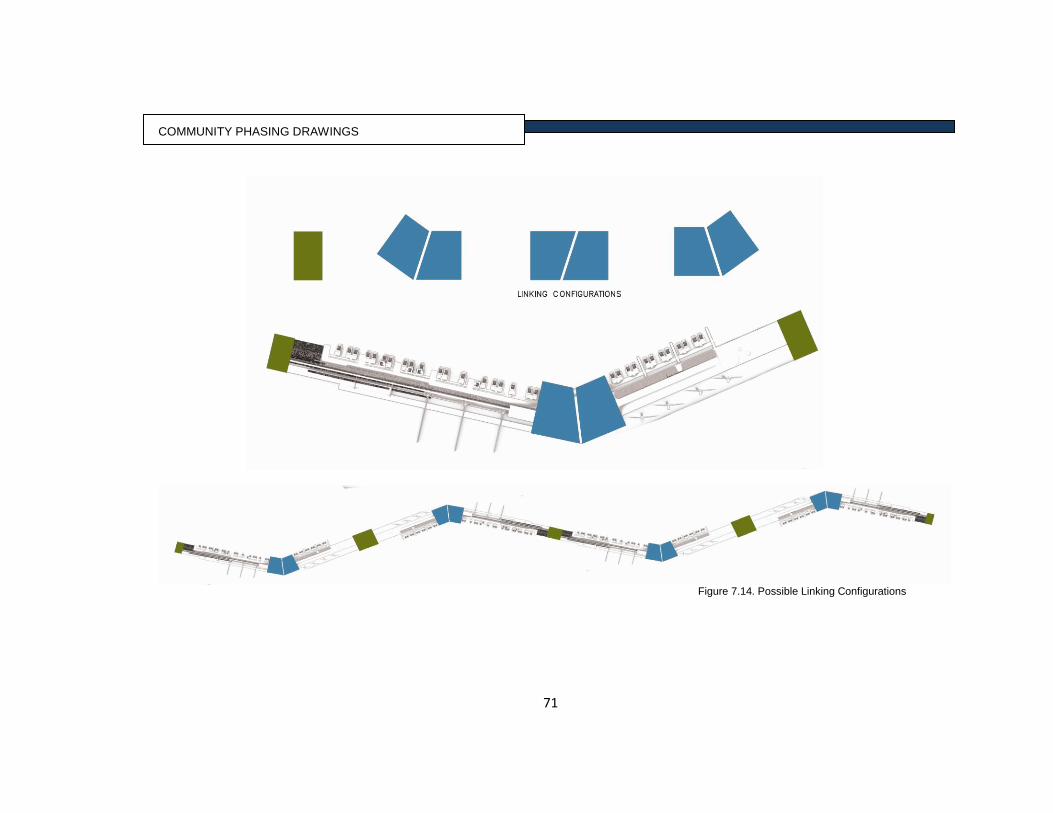
On a macro-scale, the community system is designed as
a „kit of parts‟. When the need for expansion and growth arises,
the community has linking capabilities—possibly turning a 20-
home community into a 100-home community network.

58
Self Sustain:
As water levels rise, it is important to design for self-
sustainability and independence from land. Essentials will be
provided to the community such as food, potable water, energy,
etc. When the community starts to provide living necessities, it
will create an independence from land.
Archetype
Rising sea levels and flooding continues to destroy
homes and communities. If these strategies are implemented
within threatened communities Aquatecture can serve as an
archetype for future developments.
59
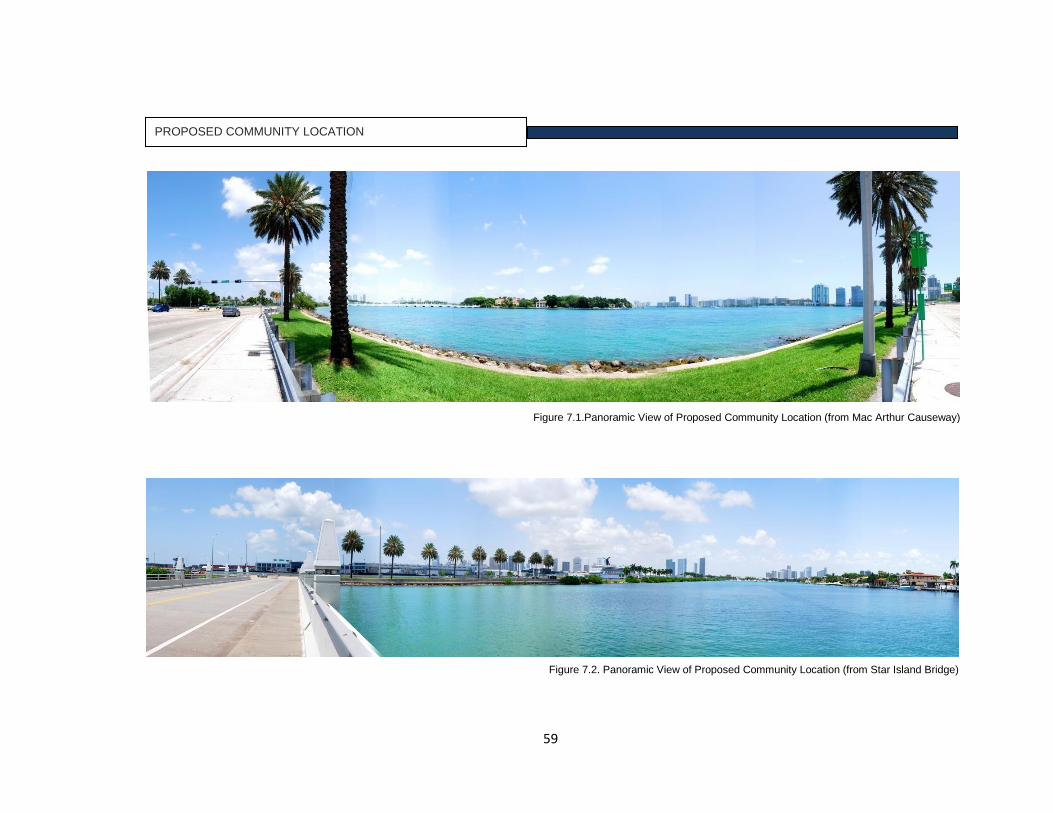
PROPOSED COMMUNITY LOCATION
Figure 7.1.Panoramic View of Proposed Community Location (from Mac Arthur Causeway)
Figure 7.2. Panoramic View of Proposed Community Location (from Star Island Bridge)
60
)
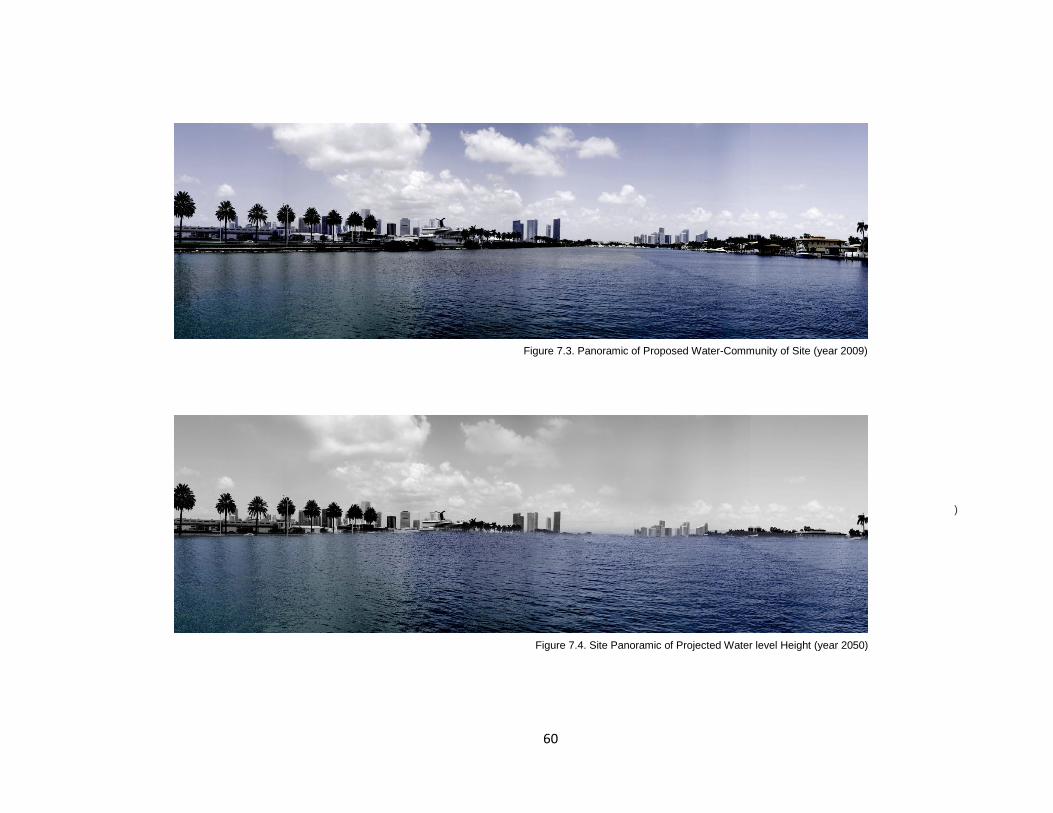
Figure 7.4. Site Panoramic of Projected Water level Height (year 2050)
Figure 7.3. Panoramic of Proposed Water-Community of Site (year 2009)

61
Figure 7.5. Site Location and Context

62
Figure 7.6. Community Conceptual Model
63
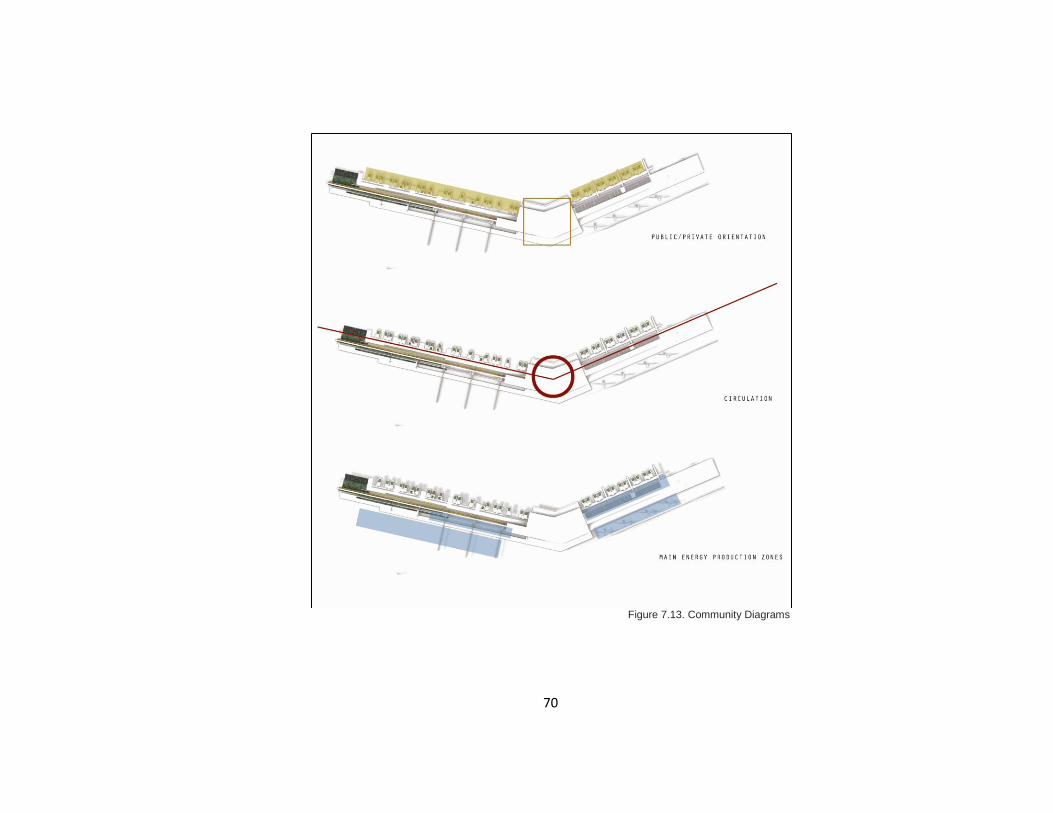
COMMUNITY ESSENTIALS
Incorporating Community Needs to Avoid Migration
In order to promote an independent self-sustaining
community on the water, Essential Community Needs (ECNs)
are to be integrated:
In addition to the living units, the next step towards
growth is the implementation of supporting community functions.
Environments will be redefined when implemented into the water
communities. The preconceived notions of what a park, a
garden, a front yard, and a street will change and be redefined to
relate to the water. The circulation of these communities can be
conceptually to a street. The main connection all of these units
and functions will be through a boardwalk pedestrian path.
These networks of circulations will not only be used as a
mode for the users to move throughout the area, but it will also
provide recreational spaces, community gathering spaces, and
boat docking areas.
64
AGRICULTURE
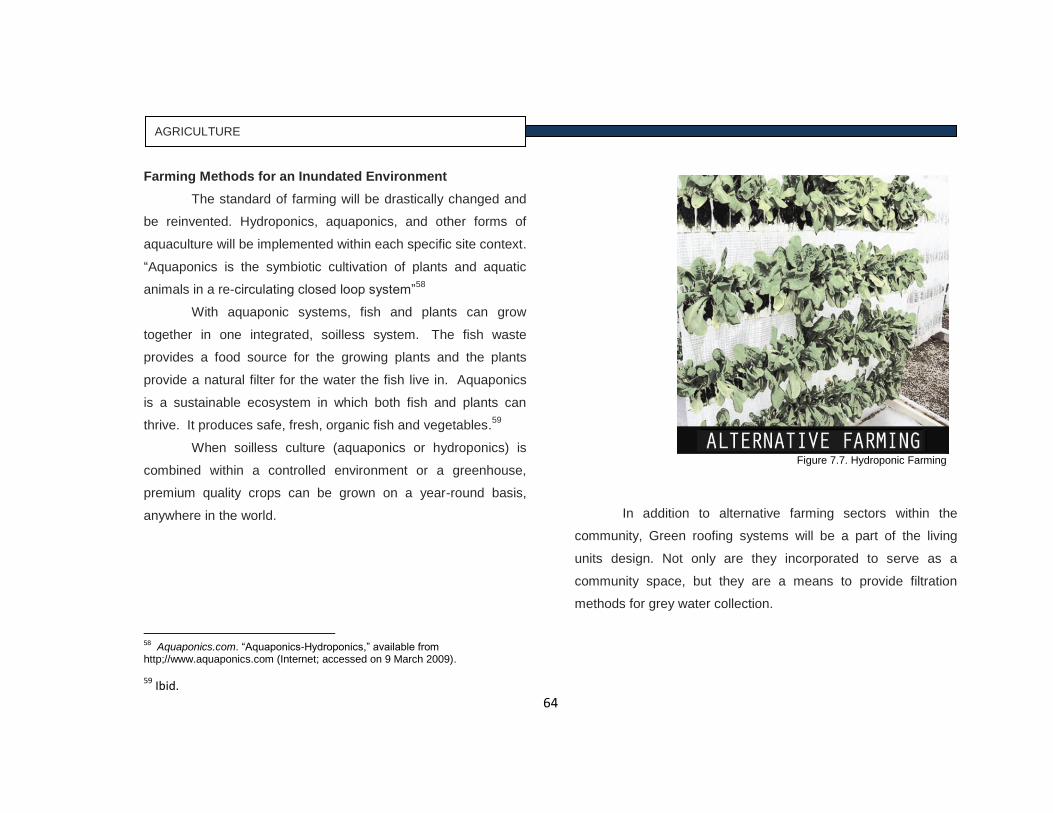
Farming Methods for an Inundated Environment
The standard of farming will be drastically changed and
be reinvented. Hydroponics, aquaponics, and other forms of
aquaculture will be implemented within each specific site context.
“Aquaponics is the symbiotic cultivation of plants and aquatic
animals in a re-circulating closed loop system”58
With aquaponic systems, fish and plants can grow
together in one integrated, soilless system. The fish waste
provides a food source for the growing plants and the plants
provide a natural filter for the water the fish live in. Aquaponics
is a sustainable ecosystem in which both fish and plants can
thrive. It produces safe, fresh, organic fish and vegetables.59
When soilless culture (aquaponics or hydroponics) is
combined within a controlled environment or a greenhouse,
premium quality crops can be grown on a year-round basis,
anywhere in the world.
58
Aquaponics.com. “Aquaponics-Hydroponics,” available from http;//www.aquaponics.com (Internet; accessed on 9 March 2009). 59
Ibid.
In addition to alternative farming sectors within the
community, Green roofing systems will be a part of the living
units design. Not only are they incorporated to serve as a
community space, but they are a means to provide filtration
methods for grey water collection.
Figure 7.7. Hydroponic Farming
65
TRANSPORTATION
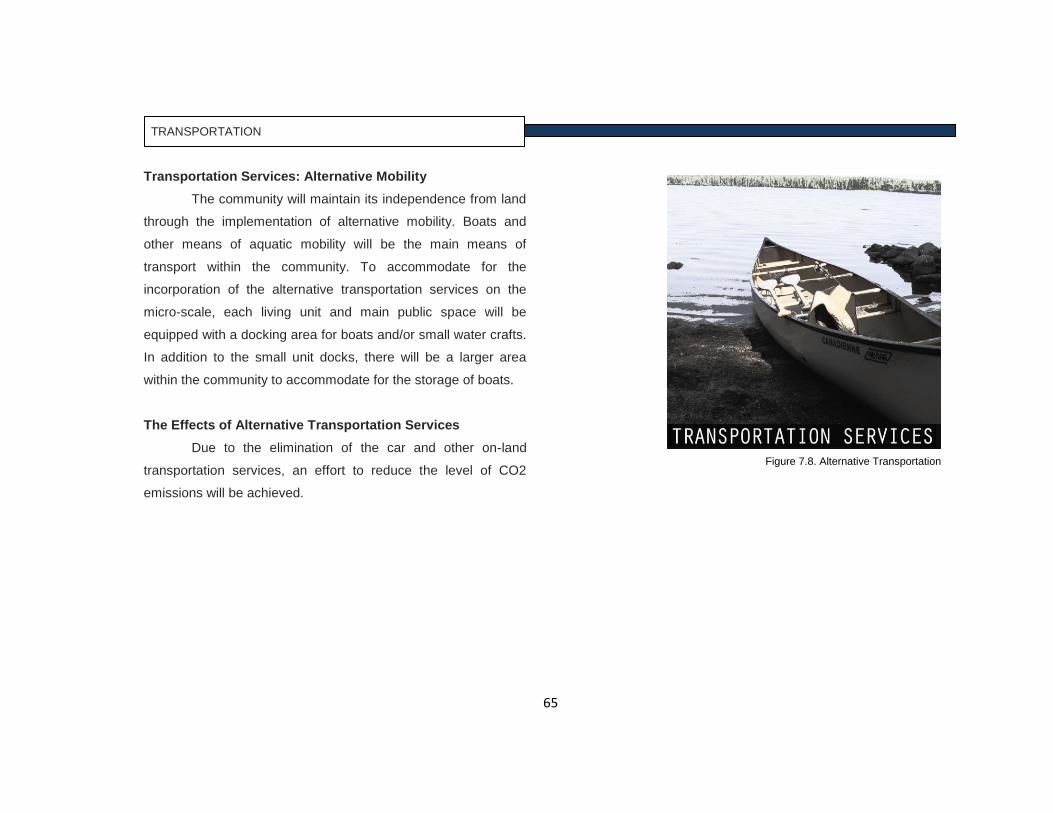
Transportation Services: Alternative Mobility
The community will maintain its independence from land
through the implementation of alternative mobility. Boats and
other means of aquatic mobility will be the main means of
transport within the community. To accommodate for the
incorporation of the alternative transportation services on the
micro-scale, each living unit and main public space will be
equipped with a docking area for boats and/or small water crafts.
In addition to the small unit docks, there will be a larger area
within the community to accommodate for the storage of boats.
The Effects of Alternative Transportation Services
Due to the elimination of the car and other on-land
transportation services, an effort to reduce the level of CO2
emissions will be achieved.
Figure 7.8. Alternative Transportation

66
AQUACULTURE
Aquaculture
“Aquaculture is the farming of freshwater and saltwater
organisms including fish, mollusks, crustaceans and aquatic
plants.”60
Unlike fishing, aquaculture, also known as
aquafarming, implies the cultivation of aquatic populations under
controlled conditions.61
Particular kinds of aquaculture include
algaculture (the production of kelp/seaweed and other algae),
fish farming, shrimp farming, oyster farming, and the growing of
cultured pearls.
Mariculture
Mariculture will also be introduced into the aqua
communities. Mariculture refers to aquaculture practiced in
marine environments. “Mariculture is a specific branch of
aquaculture involving the cultivation of marine organisms for food
and other products in the open ocean, an enclosed section of the
ocean, or in tanks, ponds or raceways which are filled with
seawater.”62
60
American Heritage Definition of Aquaculture 61
Ibid. 62
Water Encyclopedia. “Mariculture,” available from http://www.waterencyclopedia.com (Internet accessed on 10 March 2009).
Alternatives to Controlled Farming
Although this is a controlled and reliable way to provide
food for the community „wild‟ or uncontrolled fishing will still be
promoted in the communities as a source for food as well.
Figure 7.9. Aquaculture Fish Farm
67
DESALINIATION WATER FILTRATION
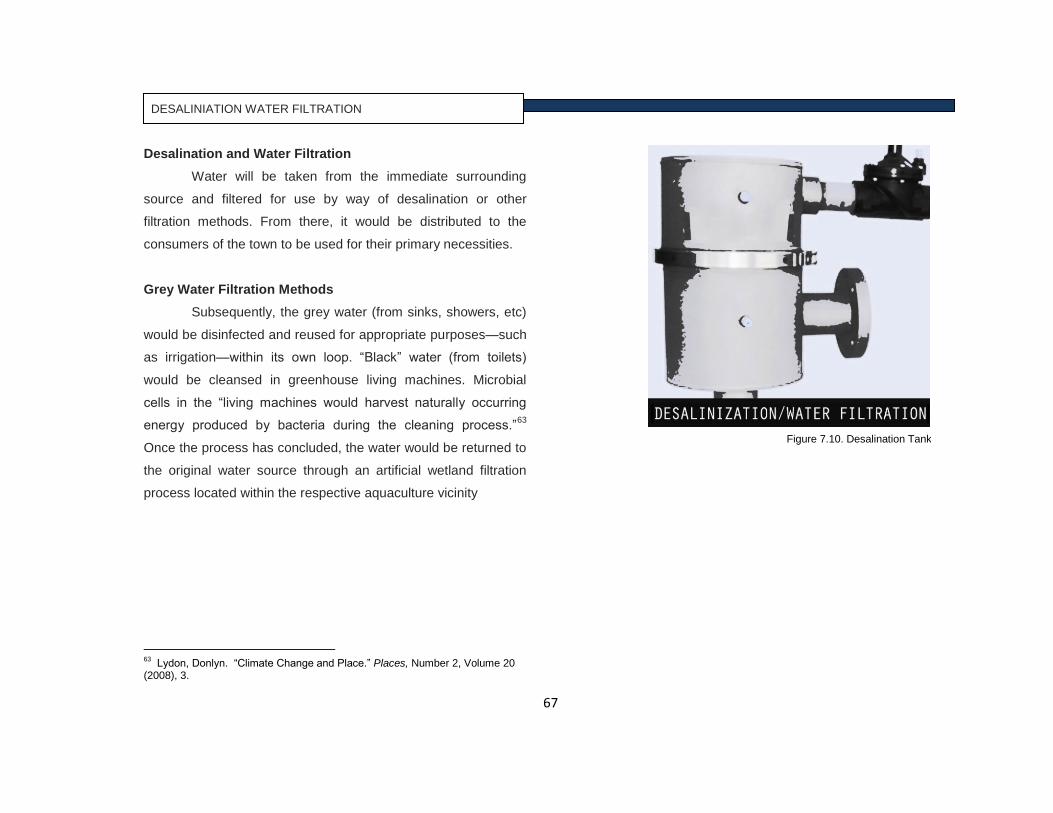
Desalination and Water Filtration
Water will be taken from the immediate surrounding
source and filtered for use by way of desalination or other
filtration methods. From there, it would be distributed to the
consumers of the town to be used for their primary necessities.
Grey Water Filtration Methods
Subsequently, the grey water (from sinks, showers, etc)
would be disinfected and reused for appropriate purposes—such
as irrigation—within its own loop. “Black” water (from toilets)
would be cleansed in greenhouse living machines. Microbial
cells in the “living machines would harvest naturally occurring
energy produced by bacteria during the cleaning process.”63
Once the process has concluded, the water would be returned to
the original water source through an artificial wetland filtration
process located within the respective aquaculture vicinity
63
Lydon, Donlyn. “Climate Change and Place.” Places, Number 2, Volume 20 (2008), 3.
Figure 7.10. Desalination Tank

68
ALTERNATIVE ENERGY PRODUCTION
Alternative Energy Production
In order to create a self-sustaining community on the
water, sources to provide energy need to be introduced. Through
the use of wind, water, and solar energy the aqua communities
will acquire sustainable energy supply. For main communities on
the water, hydroelectric power could be the most efficient option
for energy production. Tidal power is also a viable energy
producer. Tidal power, sometimes called tidal energy, is a form
of “hydropower that converts the energy of tides into electricity or
other useful forms of power.”64
Although not widely used yet,
tidal power has potential for water communities. In many cases,
tides are more predictable than wind energy and solar power.65
64
Maas, Winy. MVRDV: Excursions on Capacities KM3; “Energyzone: Redefinition of Urban Planning in the Netherlands,” (Actar-D Roca Printing Press: 2005), 206. 65
Ibid.
Figure 7.11. Hydroelectric Power Turbine
69
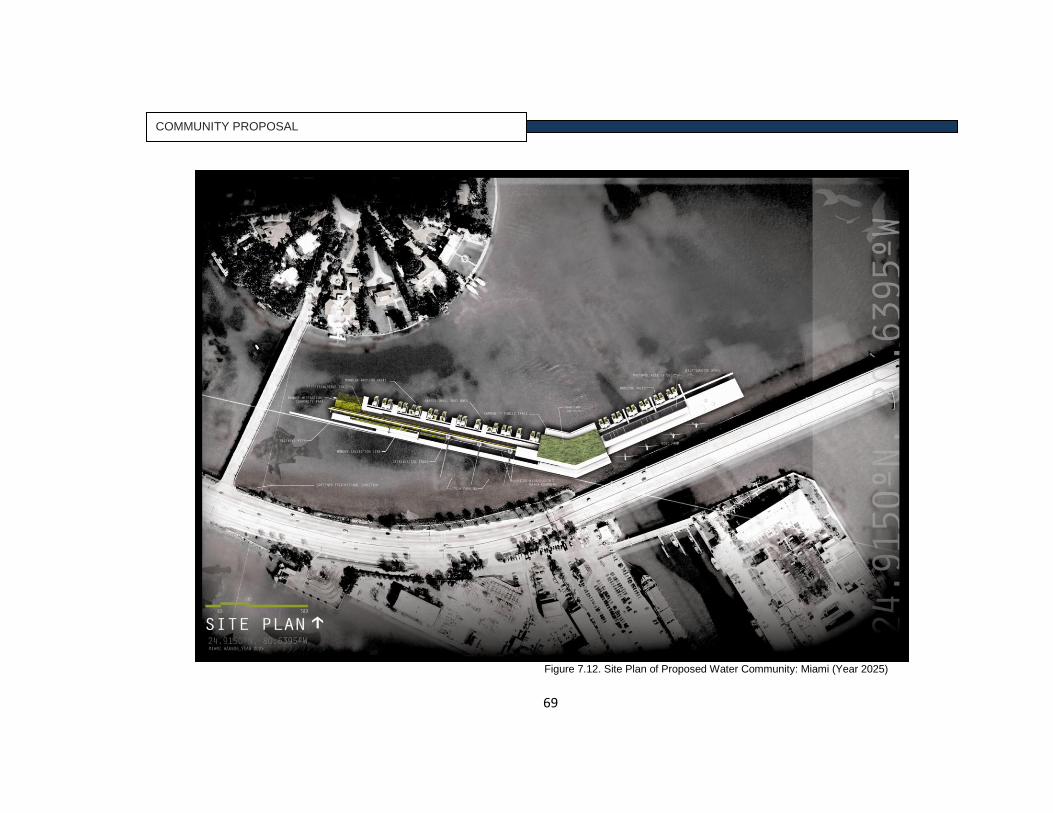
COMMUNITY PROPOSAL
Figure 7.12. Site Plan of Proposed Water Community: Miami (Year 2025)
70
Figure 7.13. Community Diagrams
71
COMMUNITY PHASING DRAWINGS
Figure 7.14. Possible Linking Configurations
72
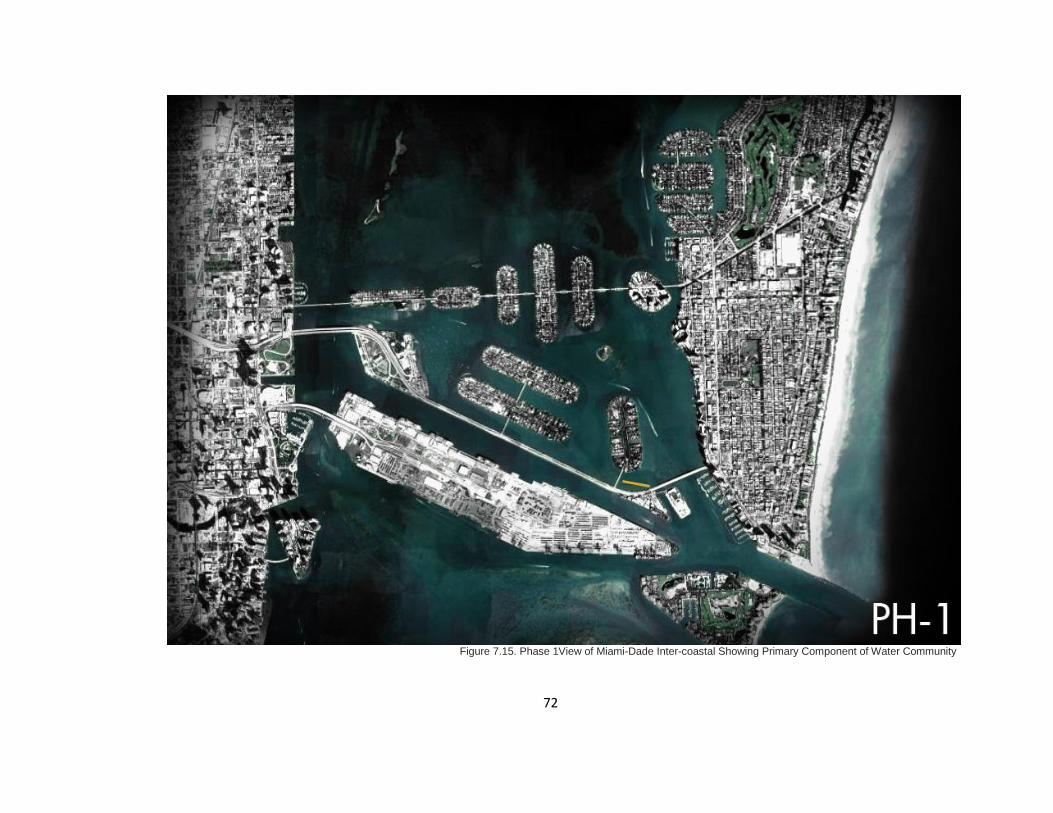
Figure 7.15. Phase 1View of Miami-Dade Inter-coastal Showing Primary Component of Water Community
73
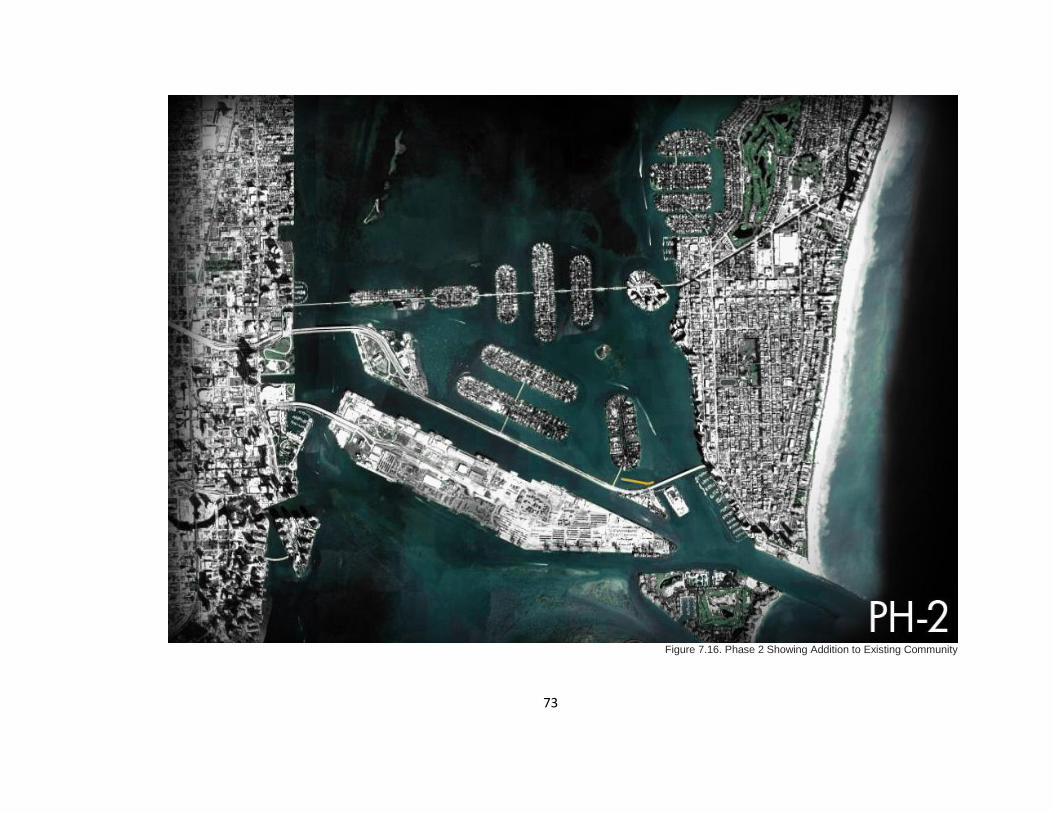
Figure 7.16. Phase 2 Showing Addition to Existing Community

74
Figure 7.17.Phase 3 View Showing Growth of Existing Community

75
Figure 7.18. Phase 4 View Showing Small Water Communities Branching from Vulnerable/ Flooded Areas
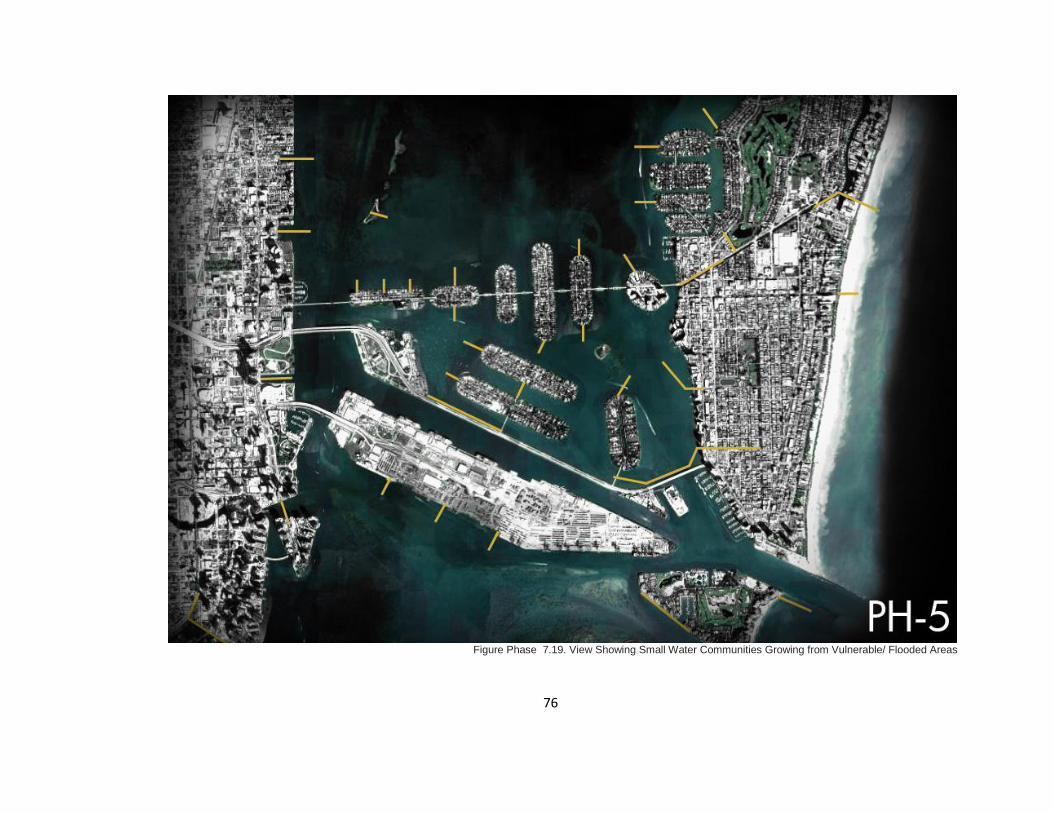
76
Figure Phase 7.19. View Showing Small Water Communities Growing from Vulnerable/ Flooded Areas

77
Figure 7.20. Phase 6 view of Miami-Dade Inter-coastal Water Community Network

78
Figure 7.21.Phase 7 view of Miami-Dade Inter-coastal Water Community Network

79
PROPOSED COMMUNITY
Figure 7.22. Elevation (North-Side) of Community

80
Figure 7.23. Cross-Section of Community Center Area and Inhabitation Capabilities within Substructure to be used as Shelter and Storage Area
81
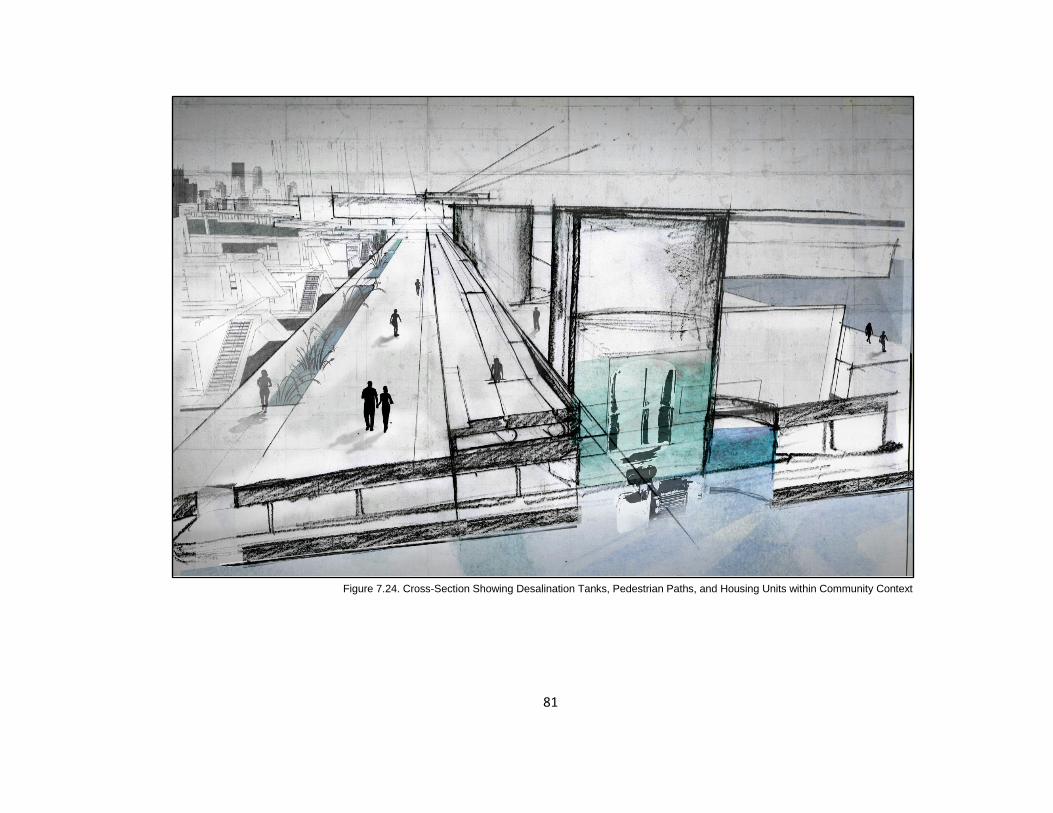
Figure 7.24. Cross-Section Showing Desalination Tanks, Pedestrian Paths, and Housing Units within Community Context
82
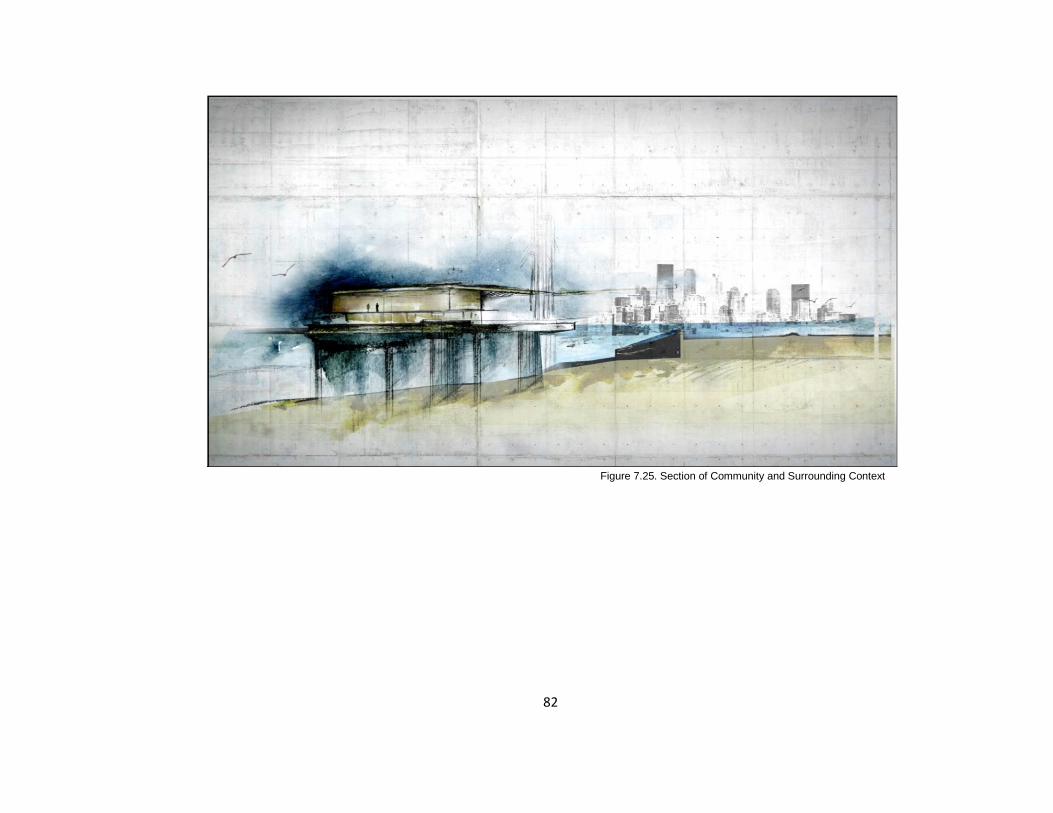
Figure 7.25. Section of Community and Surrounding Context
83
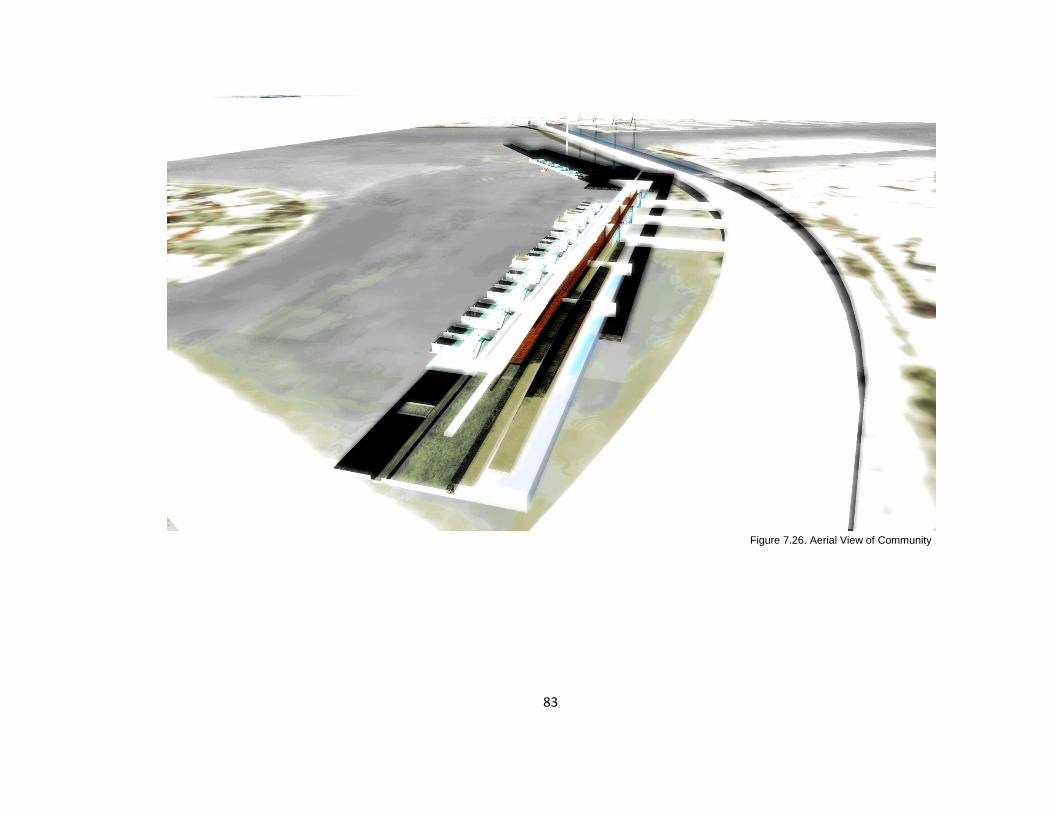
Figure 7.26. Aerial View of Community
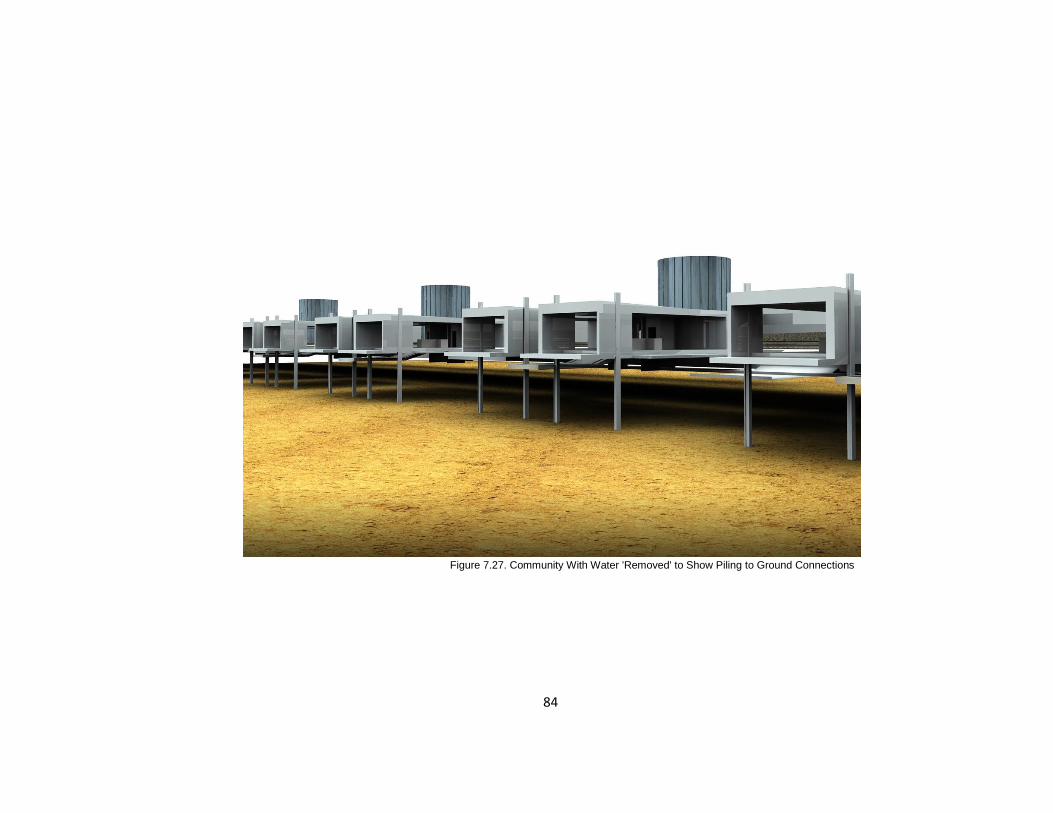
84
Figure 7.27. Community With Water 'Removed' to Show Piling to Ground Connections

85
Figure 7.28. Bio-Swales for Water Run-off Management

86
Figure 7.29. Tide Gardens Between Housing Units
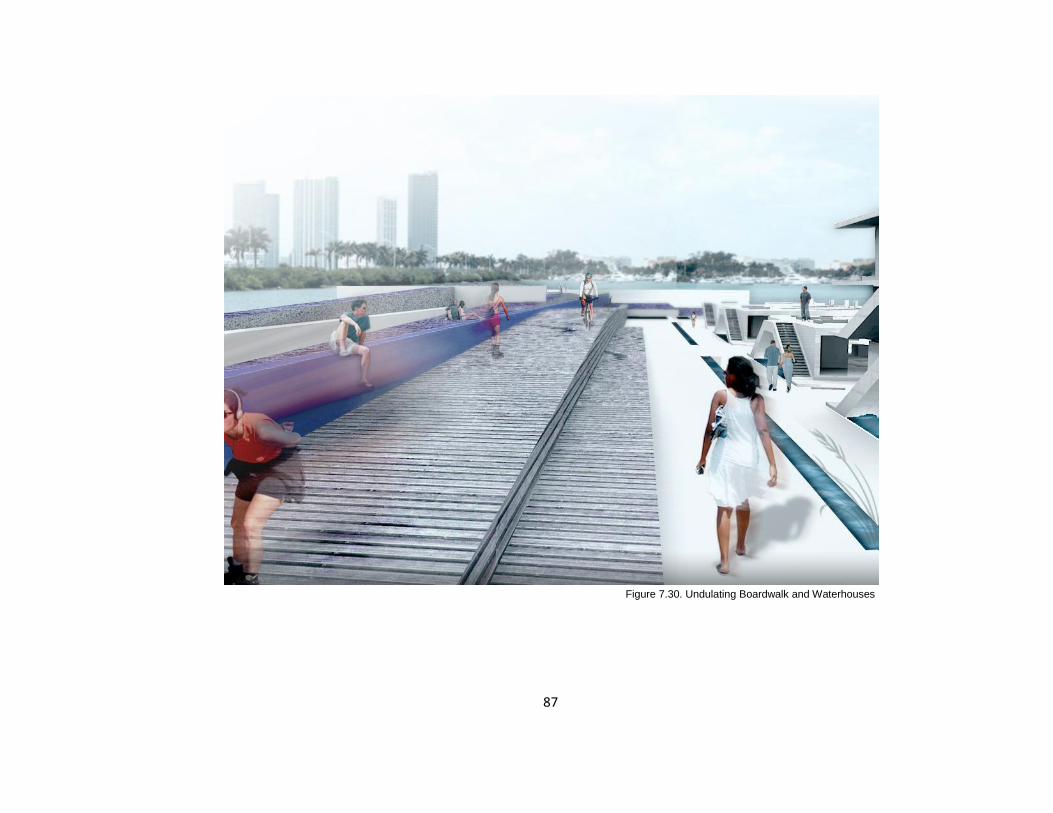
87
Figure 7.30. Undulating Boardwalk and Waterhouses

88
Figure 7.31. Micro-Hydroelectric Power Chamber and Desalination Silo

89
Figure 7.32.Housing Unit Configurations
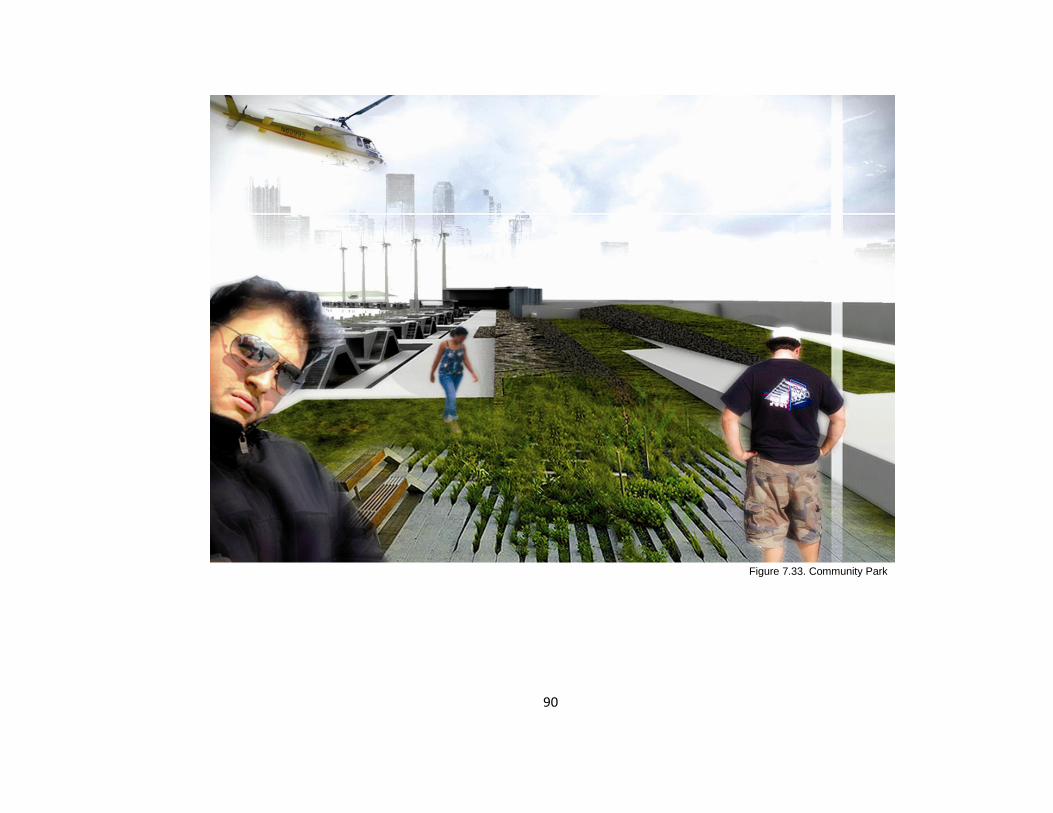
90
Figure 7.33. Community Park

91
Figure 7.34. View of Dock at Night

92
Figure 7.35. Final Model: Water Community View #1

93
Figure 7.36. Final Model: Water Community View #2

94
Figure 7.37. Final Model: Water Community View #3

95
CHAPTER 8: REDEFINING A COASTAL CITY

96
Figure 8.1. Concept Statement: Barnacle Colony Biomimicry

97
LIVING IN AN INNUNDATED CITY
What Happens to Our City Cores?
Water levels will not only impact small homes and towns,
but it will affect coastal city urban cores as well. Instead of
abandoning the city of Miami, adaptive re-use strategies can be
implemented.
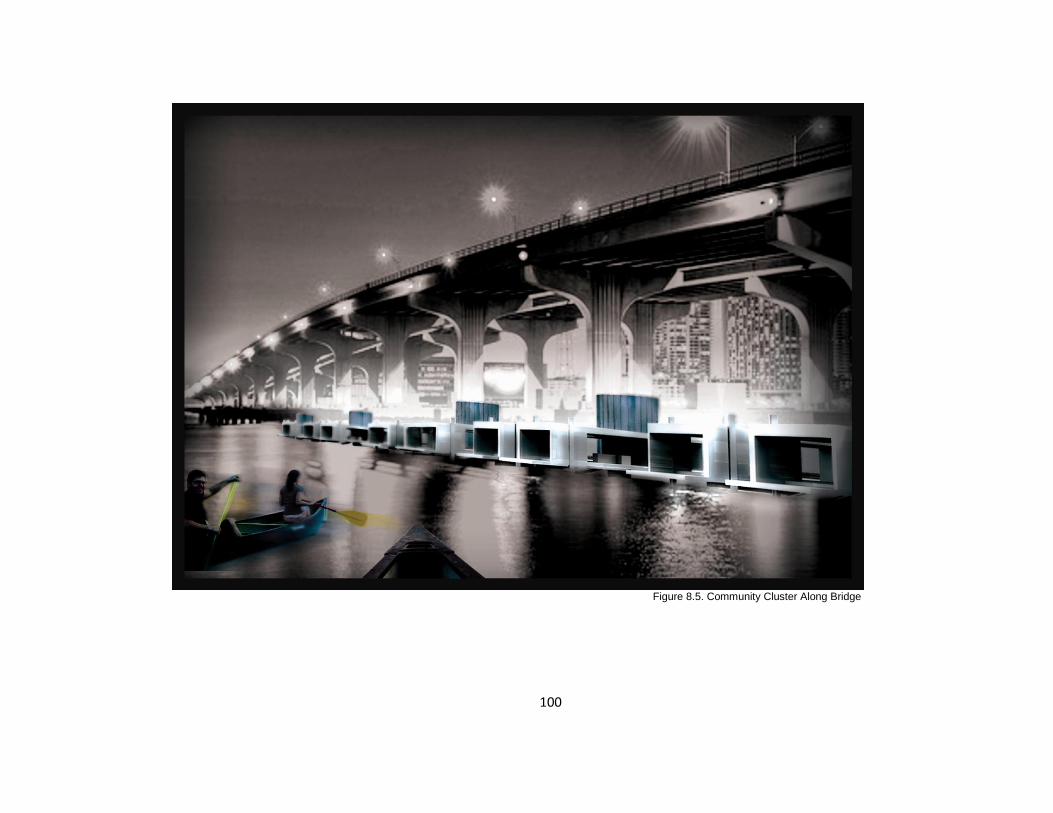
Adaptive Re-Use Strategies
Building envelopes, bridges, and other types of
infrastructure will present opportunities for adaption. In the event,
that the pre-existing buildings, towers, bridges, and other types
of infrastructure become no longer suitable for their intended
use, the barnacle-living adaptive re-use strategy will be
implemented.
For example, housing units, public spaces, farming
spaces and energy production zones can start to use the
foundation, interior, and exterior spaces that that building
envelope provides.
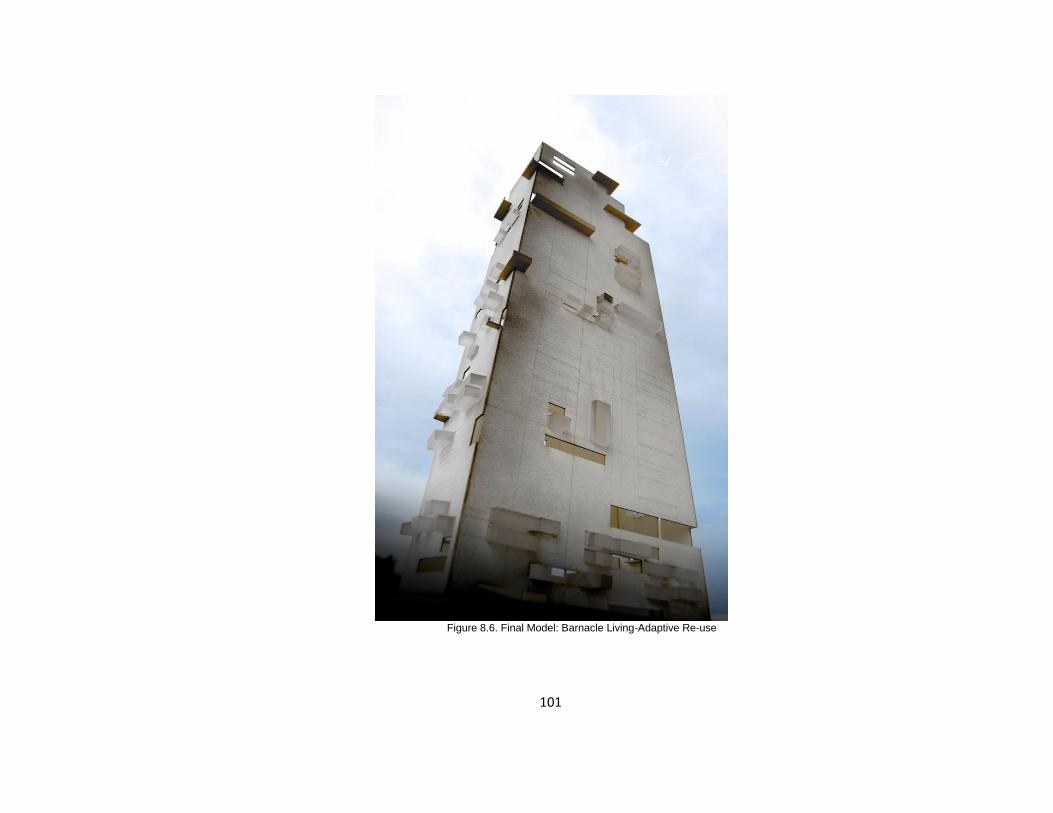
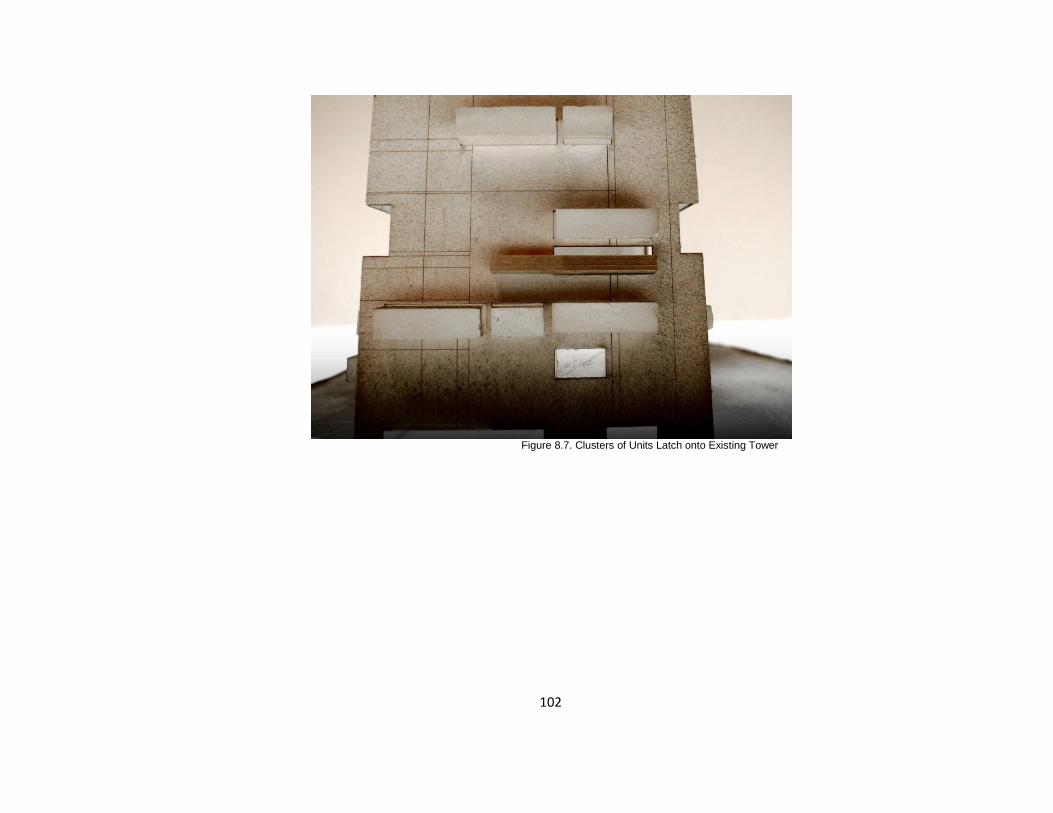
The housing units can start to form community clusters
on the exterior of abandoned residential towers and use their
interior spaces for pedestrian paths, vertical farming and energy
production zones.
Figure 8.2. Housing Units Latch onto Pre-Existing Miami Towers

98
Figure 8.3. Barnacle Living Presentation Board
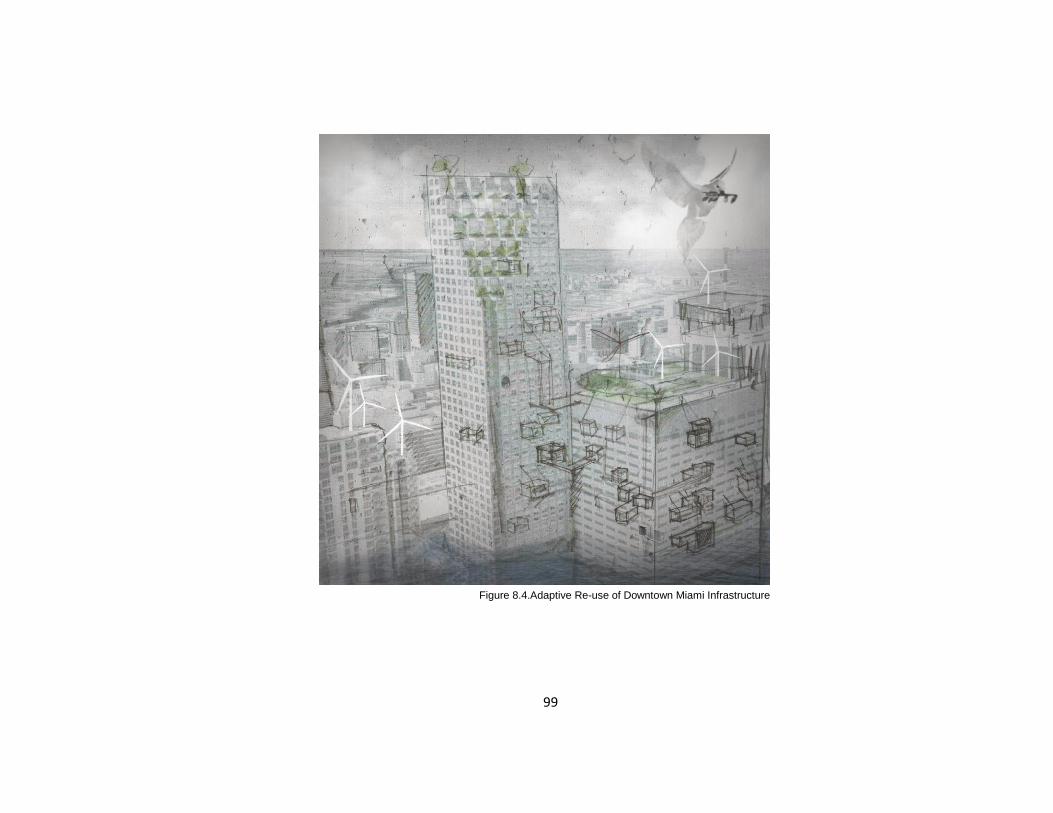
99
Figure 8.4.Adaptive Re-use of Downtown Miami Infrastructure
100
Figure 8.5. Community Cluster Along Bridge
101
Figure 8.6. Final Model: Barnacle Living-Adaptive Re-use
102
Figure 8.7. Clusters of Units Latch onto Existing Tower

103
Figure 8.8. Roof of Existing Towers to be Public Garden Spaces

104
CHAPTER 9: CONCLUSION
105
EXPLORING WORLD-WIDE POSSIBILITIES
Conclusion
With the flexibility of site location, this intervention can
serve as an archetype that can be implemented throughout
coastlines all around the world. The architecture will respond
accordingly to the specific site location, climate, and cultural
identity of the area and/or its inhabitants. For example,
Aquatecture located in a sub-tropical climate will have the
materiality and design to promote passive cooling strategies,
accommodate for heavy rainfall, and grow plants appropriate for
the temperature. Aquatecture located in cooler climates will be
constructed with materials that support passive heating
strategies, and provide varying degrees of enclosure.
Ultimately, it is crucial to understand that as the world
changes, so should architecture. The threats that global warming
presents to our coastlines are severe. In addition to what already
has happened, thousands of cities will be destroyed and billions
of people will lose their homes. If we do not take the precautions
to provide mitigating strategies, the effects on coastlines could
be detrimental. Strategies, such as the implementation of dikes,
dams, and levees have proven to be unsatisfactory solutions.
The inadequacy of such conventional systems should provoke a
comprehensive reconsideration of coastal planning. It is the time
that pro-active efforts are made to improve the quality of life and
safety of coastline communities.
With Aquatecture, we can provide the necessary safe-
guarding of rising sea levels, flooding, and storm surges.
Individuals, families, and communities can continue to inhabit
coastlines, and cities provided these adaptation strategies are
implemented. Through Aquatecture, coastal cities are provided
with new options to mitigate against sea level increase, and have
the opportunities for non-threatening co-habitation with water.
106
CHAPTER 10: REFERENCES

107
REFERENCES
Aquaponics.com. Aquaponics-Hydroponics.
http://www.aquaponics.com (accessed March 9, 2009).
Doake, D.G. Vaughan and C.S.M. "Recent Atmospheric warming
and retreat of ice shelves on the Antarctic Peninsula." Nature,
January 25, 1996: 37: 328-330.
Embassy, Royal Netherlands. "Pioneering Water." 2009: 45.
"Florida Keys Ill Prepared for Rising Sea." Carbon Based:
Climate Change Adaptation. http://carbon-based-
ghg.blogspot.com/2009/06/florida-keys-ill-prepared-for-
rising.html (accessed November 11, 2009).
An Inconvieniant Truth. Directed by Al Gore. 2006.
Harlem, Peter W. "Sea Level Rise in Miami-Dade County and its
Impact on Urban and Natural Recourses." Southeast
Enviornmental Research Center.
http://spacecoastclimatechange.com/images/Harlem_Abstract.pd
f (accessed November 8, 2009).
Hefty, Nichole L. Miami- Dade County's Climate Change
Adaptation Efforts. Powerpont Presentation, Miami: Department
of Enviornmnetal Resouce Management, 2007.
Hurricane Katrina-Livability Statistics. 2009.
http://uspolitics.about.com/od/katrina/l/bl_katrina_stats.htm
(accessed 2 November 2009 (accessed November 2, 2009).
Intergovernmental Panel on Climate Change. The Science of
Climate Change. 1996.
Lydon, Donlyn. "Climate Change and Place." Places, 2008: 3.
Maas, Winy. MVRDV: Excursions on Capacities KMS.
Amsterdam: Actar-D Roca Printing Press: 2005, 2005.
"Mariculture." Water Encyclopedia.
http://www.waterencyclopedia.com (accessed March 10, 2009).
Miami, Eye on. Miami Editorial Recognizes Sea Level Rise and
Threat to Turkey Point.
http://eyeonmiami.blogspot.com/2009/06/miami-herald-editorial-
recognizes-sea.html (accessed November 11, 2009).
Miami.gov. "Floods." http://www.miamidade.gov/oem/floods.asp
(accessed October 12, 2009).
Mitchell, Alanna. "Arctic Ice Melting Much Faster Than Thought."
The Globe and Mail Canada.
http://www.commondreams.org/headlines02/1128-06.htm
(accessed July 8, 2009).
Monthly Averages for Miami Florida. Bar Graph, Miami:
Weather.com, 2009.

108
"Number of People Affected by Climate Disaster up 54 Percent
by 2015." Oxfam America. 2009. http://www.oxfamamerica.org
(accessed August 11, 2009).
OECD. "Ranking of the World‟s Cities Most Exposed to Coastal
Flooding Today and in the Future."
http://www.oecd.org/dataoecd/59/36/39729575.pdf (accessed
November 2, 2009).
Quesada, Miguel, interview by Erica Williams. Resident of Miami
Beach Interview (June 4, 2009).
Reports, IPCC. Intergovernmental Panel on Climate Change.
http://www.ipcc.ch/ipccreports/index.htm (accessed March 9,
2009).
Salt, Dr. J. The Crichton Risk Triangle. The Climate Change for
the Insurance Industry, UK .
Sue Roaf, David Crichton, Fergus Nicol. Adapting Building and
Cities for Climate Change. New York: Architectural Press, 2005.
"The Threat of Sea Level Rise."
http://archive.greenpeace.org/comms/97/arctic/library/climate/se
achange.html (accessed July 8, 2009).
University, Loughborough. "The World According to GaWC
2008." Globalization and World Cities Study Group and Network.
(accessed March 3, 2009).
Yagi, Koji. Indigenous Settlements in Southwest Asia. Tokyo:
Process Architecture Publishing Co. Ltd., 1980.