lean six sigma integration - wyrick enterprises
TRANSCRIPT


2
Getting Lean
LEAN MEANS
NO FAT AND NO WASTE
A lean organization can
produce twice as much
with twice the quality in
half the time and space, at
half the cost, with a
fraction of the normal
work-in-process.
The goal of Lean is to eradicate waste…system-wide.
6LeanP
DC
A
Act Plan
Check Do
P
DC
A
Act Plan
Check Do
P
DC
A
Act Plan
Check Do
P
DC
A
Act Plan
Check Do

3
Value: When a product or service has been perceived or
appraised to fulfill a need or desire…as defined by the
customer—the product or service may be said to have value or
worth.
Value-Adding: The creation of value through waste-free
operations and processes. Any operation or activity that
changes, converts, or transforms material or information into a
product or service the customer is willing to pay for.
Non-Value-Adding: Any operation or activity that takes time
and resources but does not add value to the product or service
sold to the customer.
Value … Non-Value Adding Activities

4
LEAN Enterprise
Old Paradigm
-Focus on Value-adding activities
-Get productivity gains through SPEEDING UP
value-adding processes
New Paradigm
-Focus on Non-value adding activities
-Get productivity gains through ELIMINATINGor MINIMIZING non value adding processes
Lean Concepts
Non-value
adding

5
• Specify Value End-Use Customer’s Perspective
• Identify Value Stream Understand all Activities
• Flow Minimize Interruptions
• Pull Produce to Customer Demand
• Perfection Goal is Zero Waste
Five Fundamental
Concepts
6
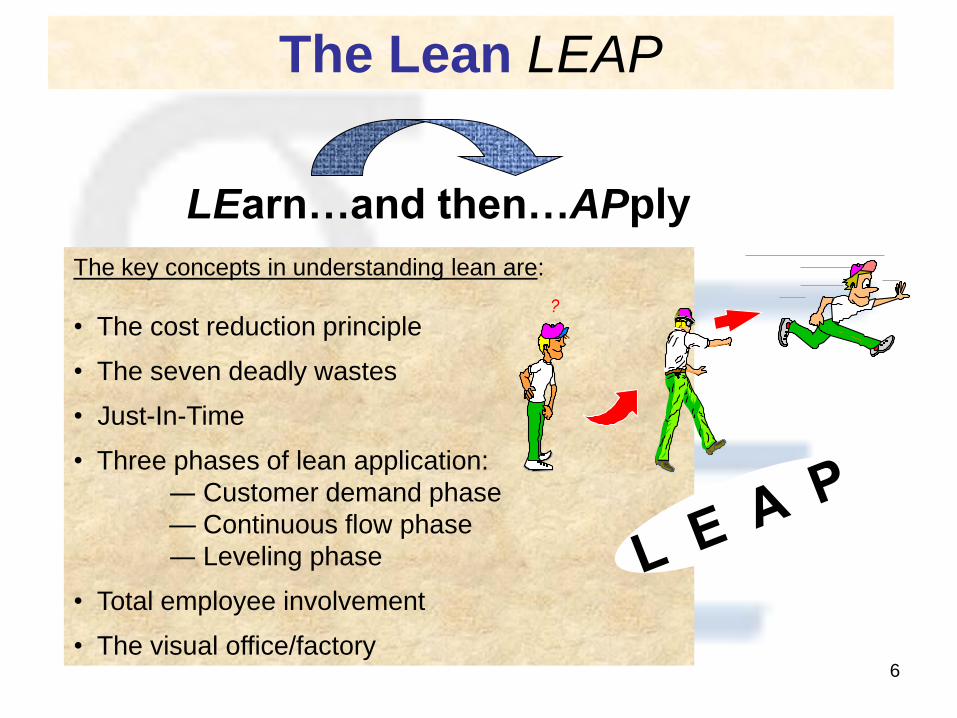
The Lean LEAP
LEarn…and then…APply
The key concepts in understanding lean are:
• The cost reduction principle
• The seven deadly wastes
• Just-In-Time
• Three phases of lean application:
― Customer demand phase
— Continuous flow phase
― Leveling phase
• Total employee involvement
• The visual office/factory
?

7
Traditional thinking:
Cost + Profit = Price
Lean thinking:
Price – Cost = Profit
(where selling price is determined by the market)
Cost Reduction Principle

8
Causes of Waste
Layout (distance)
Long setup time
Incapable processes
Poor maintenance
Poor work methods
Lack of training
Lack of adherence
Inconsistent
performance
measures
Ineffective scheduling
Lack of adequate
workspace
WHAT IS WASTE?
An Activity or Output that Adds Cost but Does Not
Add Value as Perceived by the End-Use Customer
Worker Prepares 100 Page Report
Customer Wants 5 Page Report

9
To Eliminate Overproduction:
• Establish a work flow sequence to satisfy the downstream customer.
• Create workplace norms and standards for each process.
• Create signal devices to prevent early processing.
To Eliminate Defects:
• Establish standardize work
procedures and office forms.
• Create and post job aids.
To Eliminate Excessive Inventory:• Produce only enough to satisfy the
work requirements of your downstream customer.
• Standardize work locations and the number of units per location.
• Ensure that work arrives at the downstream process when it is required and does not sit there.
To Eliminate Excessive Processing:• Review the value-added steps in each
process, and streamline or eliminate steps whenever possible.
• Review all signature requirements and eliminate signatures wherever possible.
To Eliminate Unnecessary Conveyance:• Make the distance over which something is
moved as short as possible.
• Eliminate any temporary storage locations or stocking locations.
Waste Elimination

10
To Eliminate Waiting:• Review and standardize required
signatures to eliminate unnecessary ones.
• Cross-train employees to allow work flow to continue while someone is out.
• Balance the workload throughout the day to ensure that all people are being used optimally.
• Make sure that equipment and supplies are available.
To Eliminate Unnecessary Motion :• Standardize folders, drawers, and
cabinets throughout the area; use color codes as much as possible.
• Arrange your files (desktop and electronic PC) in such a way you can easily reference them.
• Arrange work areas of office equipment in central locations; consider purchasing additional equipment to eliminate multiple trips.
Waste Elimination

11
• Defects Errors in Documents
• Transportation Transport of Documents
• Overproduction Doing Work Not Requested
• Waiting Waiting for the Next Step
• Processing Process Steps & Approvals
• Movement Unnecessary Motion
• Inventory Backlog of Work
The Seven Wastes in the Office

12
Just-In-TimeJust-in-time is at the heart of the lean system. It ensures that, during work,
the next downstream process has:
• Only those work units needed.
• Just when they are needed.
• In the exact amount needed.
OVERPRODUCTION
cartoon copyright © U of M
••Making Making moremore than required by the next processthan required by the next process
••Making Making soonersooner than required by the next processthan required by the next process
••Making Making fasterfaster than required by the next processthan required by the next process
JIT
Helps Eliminate
Overproduction

13
Takt time is the pace of customer demand
Takt Time Volume (Daily production requirement)
Time (Available seconds per working day) =
Cycle Time =Actual time required for a worker to
complete one cycle of his process
Sets pace of production to
match pace of sales.
= obtain the desired result = meet the TAKT time
TAKT = Daily available time
Units required daily
TAKT = Operating rhythm
450 mins
10 units= 45 minutes/unitTAKT =
One unit every 45 minutes
For example:
Ensure Human Work EffectivenessEnsure Human Work Effectiveness
Standard Operations 5

14
Pitch
FormulaTakt time X number of work units
Pitch = 1 minute (takt) X 15 line items per
order = 15 minutes per order
8 orders X 15 minutes = 120 mins
2 hoursPitch =
8 orders produced every 2 hours
For example:
PitchPitch
Pitch is a multiple of takt time that allows you to create, maintain, and sustain a
consistent and practical workflow throughout the value stream.

15
Buffer and Safety Resources
• Buffer resources:
– A means of meeting customer
demand when customer ordering
patterns, or takt times, vary.
• Safety resources :
– A means of meeting customer
demand when internal constraints or
inefficiencies disrupt process flow.
B
B
S
S
◼ “Ability to understand the status of a production area in 5 minutes or less by simple observation without use of computers or speaking to anyone.”
5S Visual Workplace

16
Phases of Lean Application Continuous Flow Phase
Lean Tools:
➢ In-Process Supermarkets
➢Kanban System
➢FIFO
➢Line Balancing
➢ Standardized Work
➢Work Area Design

17
Big Batches of Work / Long Queue Times
- Illusion of Efficiency -
The First Document
Moves to the Next
Step When the Last
Document is Done
DEFINITION
A Method of Producing Goods or Services in Which
Large Quantities of Work Are Processed Before
Moving to the Next Step
What is Batch-And-Queue?

18
TAKT
James Paul Lucy Bill Jane
James Paul Lucy Bill Jane
TAKT
Redistribute
Increase Effectiveness
Two Solutions To Create Flow
Standard Operations 8
Don’t Rock The Boat!

19
RELIABLE PROCESS
* DEPENDABLE
EQUIPMENT
* MISTAKE PROOFED
* MULTI-SKILLED
BALANCE PROCESS
* STABLE SCHEDULE
* LEVEL LOADING
* ONE PIECE FLOW
BALANCED PROCESS
STANDARD WORK
1 2 43
3 MIN.
TAKT
SET-UP
OPERATOR TIME
MACHINE TIME
ORGANIZED PROCESS
* MINIMAL TRAVEL
* NO DELAYS
* ORGANIZATION MATCHES
PROCESS
FROM TO
Necessary Elements to Create Flow

20
21
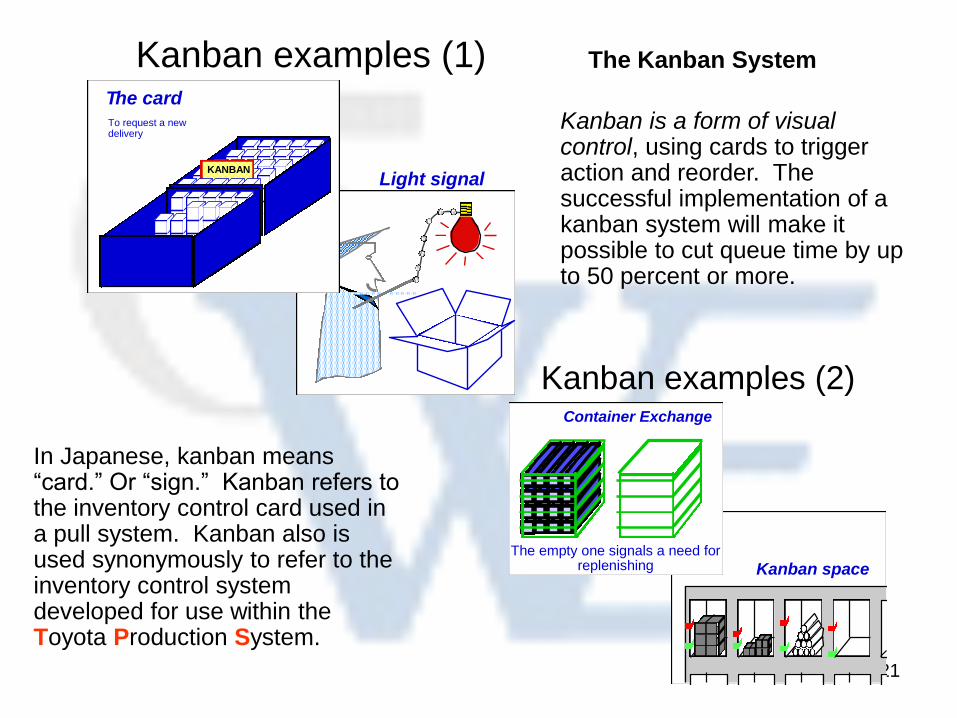
Light signal
The card
KANBAN
To request a new delivery
Kanban examples (1)
Container Exchange
The empty one signals a need for replenishing Kanban space
Kanban examples (2)
Kanban is a form of visual control, using cards to trigger action and reorder. The successful implementation of a kanban system will make it possible to cut queue time by up to 50 percent or more.
The Kanban System
In Japanese, kanban means “card.” Or “sign.” Kanban refers to the inventory control card used in a pull system. Kanban also is used synonymously to refer to the inventory control system developed for use within the Toyota Production System.

22
The customer consumes
The Supplier replaces
The Supermarket
2731 8540122
Computer and bar codes
Kanban examples (3)
KANBAN
JUST IN
TIME
Kanban rules
• The next process (customer) goes to get
material (Pull) in the previous process
(supplier).
• The previous process (supplier) produces or
delivers according to the instructions of the
next process (customer).
• In the absence of a signal no production, no
delivery!
• There is a signal (card) for each container.
• Production/delivery: 100% quality and
quantity.
• Minimum inventory and maximum turnover.

Line Balancing
• Line balancing is the process by which you can evenly distribute the work elements within a value stream in order to meet takt time.
• The best tool to perform line balancing is the Worker Balance Chart.
Rate of Demand
100 Items/Month
20 Days/Month
5 Items/Day
900 Minutes/Day
180 Minutes/Item
Rate of Demand
100 Items/Month
20 Days/Month
5 Items/Day
900 Minutes/Day
180 Minutes/Item
Achieving Balance
Percent Loading Chart
0
50
100
150
200
250
300
A B C D
Activity
Tim
e (
min
ute
s)
TT
Achieving Balance
Percent Loading Chart
0
50
100
150
200
250
300
A B C D
Activity
Tim
e (
min
ute
s)
TT
Process Designed to Meet Customer Demand
Lean Design
23
First In, First Out (FIFO)
A FIFO lane:
• Holds a designated amount of work (or jobs) between two operations.
• Is sequentially loaded.
• Uses a signal to notify the upstream operation to stop loading when the lane if full (to prevent overloading) and has a process in place to react.
• Requires rules and procedures for upstream and downstream operations.
• Uses visual displays and controls to ensure adherence to rules and procedures.
• Requires discipline by the workforce to ensure FIFO integrity.
FIFOFIFO

24
Standardized Work ChartStandard Customer Service Customer Service Team
Work Order Process
Runner Future State
Takt Time = 15 min/order
Operation Sequence
1. Runner picks up orders
from Supervisor
2. Runner delivers orders
to cust. service reps and
picks up finished orders
3. Runner drops off order
acknowledgments at
Central Mail Room
4. Runner returns to Supervisor
and picks up fill-in work
(expedites and returns) to
work on until next run
SupervisorEvery 2 hrs
Expedited
Work Area
Central
Mail Room
1
2
3
4
Cellular Work Areas
RFQRFQRFQ RFQRFQRFQTraditional Layout Lean Work Area
Purchasing
(2)
Engineer
(3)
CustomerService
(1)
Quoting
(4)
2 days
2 days5 days
1 day
RFQ
RFQ =
Request for Quote = Queue time
RFQRFQRFQ
Hours
Hours
MinutesMin.
RFQ
2
3
1
4
= Signifies physical
separation
Principles of Layout Change
• Arrange processes sequentially.
• Arrange computers and equipment according to processing sequence.
• Try to use smaller machines (i.e., fax machines, printers) that fit on worker’s desks.
• Perform as much cross-training as possible.
• When creating cells, place the last process as close to the first as possible.
• Set up a FIFO flow within cells.
25
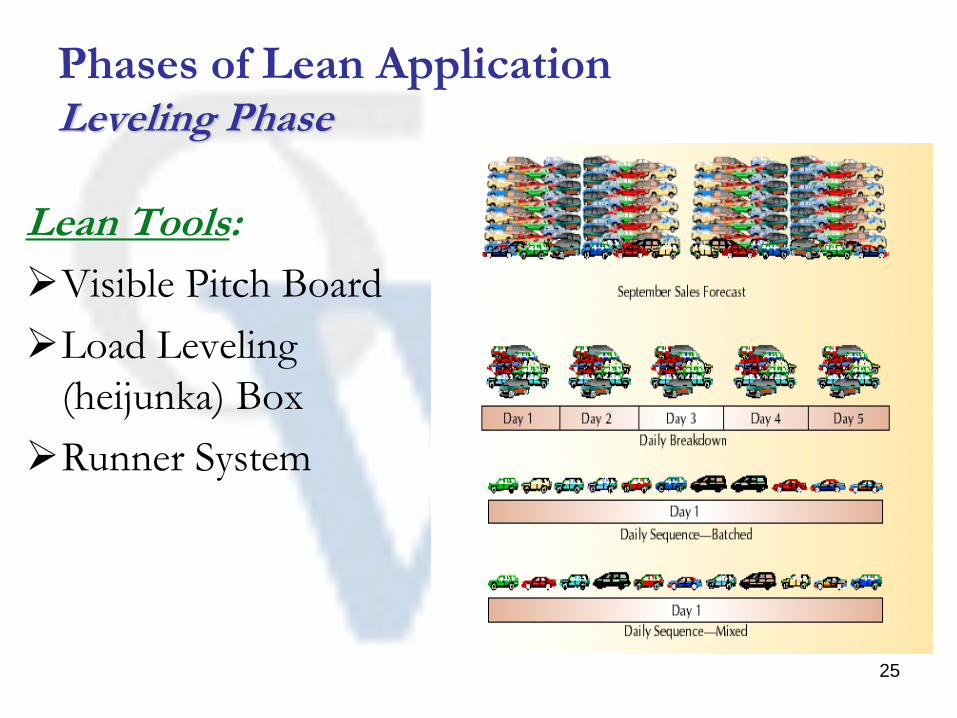
Phases of Lean Application Leveling Phase
Lean Tools:
➢Visible Pitch Board
➢Load Leveling
(heijunka) Box
➢Runner System
26
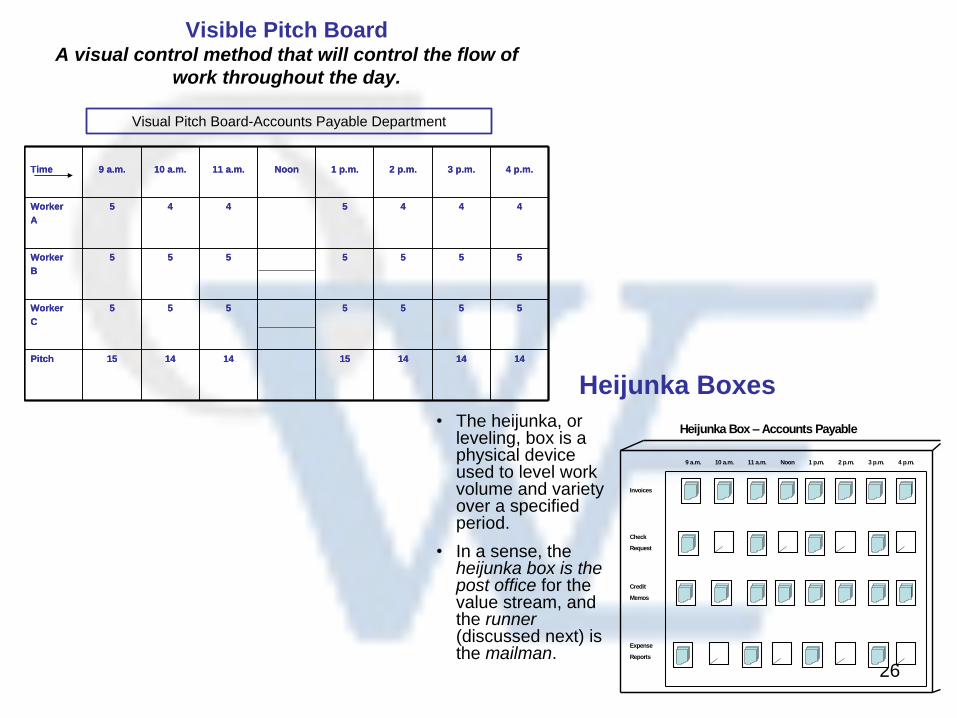
Visible Pitch BoardA visual control method that will control the flow of
work throughout the day.
14141415141415Pitch
5555555Worker
C
5555555Worker
B
4445445Worker
A
4 p.m.3 p.m.2 p.m.1 p.m.Noon11 a.m.10 a.m.9 a.m.Time
14141415141415Pitch
5555555Worker
C
5555555Worker
B
4445445Worker
A
4 p.m.3 p.m.2 p.m.1 p.m.Noon11 a.m.10 a.m.9 a.m.Time
Visual Pitch Board-Accounts Payable Department
Heijunka Boxes
• The heijunka, or leveling, box is a physical device used to level work volume and variety over a specified period.
• In a sense, the heijunka box is the post office for the value stream, and the runner(discussed next) is the mailman.
Heijunka Box – Accounts Payable
9 a.m. 10 a.m. 11 a.m. Noon 1 p.m. 2 p.m. 3 p.m. 4 p.m.
Invoices
Check
Request
Credit
Memos
Expense
Reports

27
The Runner
A worker who ensures that pitch is maintained. The runner covers a designated route within the pitch period, picks up kanban cards or folders and work units, and delivers them to their appropriate destinations.
Runner Qualifications
• Understands value stream process requirements
• Communicates well
• Understands lean concepts
• Understands the importance of takt and pitch
• Works efficiently and precisely
• Is innovative and resourceful

28
In an instant, view the situation
globally or in details
•Resources•Tools & equipment•Materials•Etc.
•Norms•Methods•Etc.
•What's right•What's wrong•What's done•What's left to be done•The delays
Visual Office/Factory... Why ?

29
Types of Visual Displays
Part Desc
Part Number
Job Aids
Stop line
Pick next
Pick now
Color Coding
of Parts
Op # 10 20 50 60
DEPT A
30 40
Status
Process Control Boards
Indicator Lights
SCRAP
Marked Floor
Areas
Return to
Supplier
Work Group Display
Boards Direction
of Flow
Indicators
Direction of
Rotation
for Motors,
Drives, Tables
Heat Sensor
Stickers
Process
Gauges
Showing
Normal
Operating
RangeLube point
Identification
Fluid Level
Markings
ISO/QS-9000
Compliant

30
Lean Eliminates Non-Value Added Activities and Makes Value Added Activities Flow Six Sigma Reduces Variation Of Value Added Activities
31
Some Lean Measurables
➢ Total order cycle time
➢ Order-entry on-time delivery
➢ Total number of errors
A measurable such as these can be broken into many different pieces, such as:
➢ Time spent waiting
➢ Time spent walking
➢ Entering data
➢ Retrieving files
➢ Opening mail
➢ Processing time

www.wyrickenterprises.com [email protected]
WYRICK ENTERPRISES
It is all about Reliability, Sustainability, & Repeatability