leading the value journey: value based purchasing “what should you be focused on?” melinda s....
TRANSCRIPT

Leading the Value Journey: Value Based Purchasing“What should you be focused on?”
Melinda S. Hancock, FHFMA, CPASecretary/TreasurerHFMA
HFMA Western Pennsylvania Chapter Winter Education EventFebruary 18, 2014

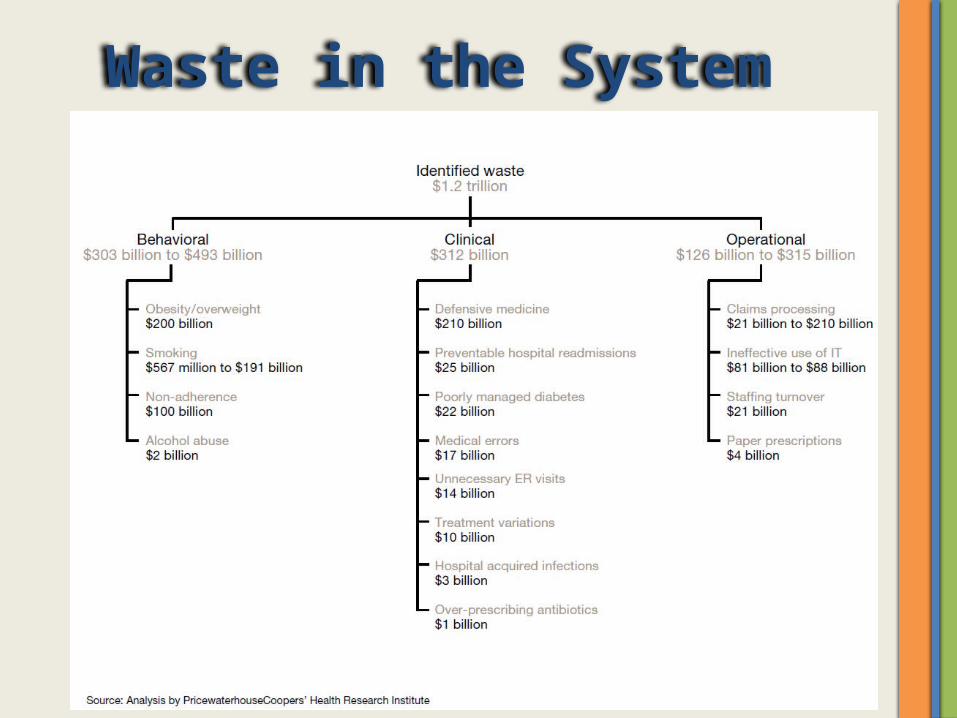
Waste in the System

The New ConstructEvolving Population Health in a Fee for Service Era
Healthcare Reform
4

2 Key Components of Payment Reform
Goals of Payment Reform
This will include establishing measures to (1) establish performance based payment incentives and (2) protecting against unintended consequences of cost containment.
Source: Rand, Payment Reform: Analysis of Models and Performance Measurement Implications, 2011

0.75%
1% 2%
0.1% 0.1%
1.0% 0.7%
TOTAL IMPACT% = % OF MEDICARE INPATIENT OPERATING PAYMENTS
Value-Based Purchasing
30-day readmissions
Hospital-acquired conditions
Market basket reductions
Multifactor Productivity Adj*
Documentation and Coding Adj (DCA)**
Across the board cuts to finance debt ***
OCT2014
OCT2011
OCT2018
OCT2019
OCT2020
OCT2017
OCT2013
OCT2016
OCT2015
OCT2012
1.0% 1.25% 1.5% 1.75% 2.0%
3.0%
1.0%
0.3%
0.5% 0.5% 0.5%
1.9%4.9%
2.0%
6.7% 10.6% 10%6.0%
*The Multifactor Productivity Adjustment is an estimate generated by the CMS Office of the Actuary **DCA, also known as the behavioral offset, shown here does not show the future affects of these cuts on baseline spending. Estimates FY 2014-FY 2017 impact of the American Taxpayer Relief Act of 2012*** If Congress has not adopted the Joint Committee’s report to reduce the deficit by at least $1.2 trillion, the 2% cut will be implemented April 2013
0.2%
8.1% 11.4% 9.4%10.5% 9.3% 8.7%8.9%
1.0% 2.0%
Current Reform Landscape
0.4%
2.1% 2.1% 2.1%2.1%
0.65% 0.9% 0.7%

Timeline of Performance

Reform ReadinessAmount at Risk
2013 2014 2015 2016 2017
Readmission Program (a) 1.0% 2.0% 3.0% 3.0% 3.0%
Value Based Purchasing (b) 1.0% 1.25% 1.5% 1.75% 2.0%
Hospital Acquired Conditions (a) 1.0% 1.0% 1.0%
Total Potential Rates at Risk 2.0% 3.25% 5.5% 5.75% 6.0%
a: Represents a worst case scenario and a ceiling of the maximum penaltiesb: Represents a withhold of payment that can be earned back based on quality metrics

The Medicare DRG FormulaStandard Federal Rate
9
Labor PortionX Wage Index
Non Labor Portion
Adjusted Base Rate
Case Mix/DRG Weight
Generic Base Rate
DSH Adjustment + IME Adjustment
Payment

Facts about FY 14 VBP
Bonuses
Pennsylvania Average
.24%
US Average,24%
Penalties
Pennsylvania Average
-.20%
US Average-.26%
% With Bonuses
Pennsylvania Average
45%
LESS REIMBURSEMENTA total of 1,451 hospitals got paid less in FY 14 vs FY 13 for VPB. 1,231 got
paid more.
$1.1B at play in FY 14
VBP Largest increase .88%
Largest Decrease 1.14%Change from FY 13 VBP

Pennsylvania Hospital Performance
-0.80% -0.60% -0.40% -0.20% 0.00% 0.20% 0.40% 0.60% 0.80% 1.00%
-1.60%
-1.40%
-1.20%
-1.00%
-0.80%
-0.60%
-0.40%
-0.20%
0.00%Value Based Purchasing
Read
mis
sion
s
For FFY 2014

VBP Shifting of Domain Weights
70%
30%
FY 2013
45%
25%
30%
FY 2014
10%
25%
40%
25%
FY 2016
20%
20%
30%
30%
FY 2015
• Outcomes
• Patient Experience
• Efficiency (MSPB)
• Core Measures
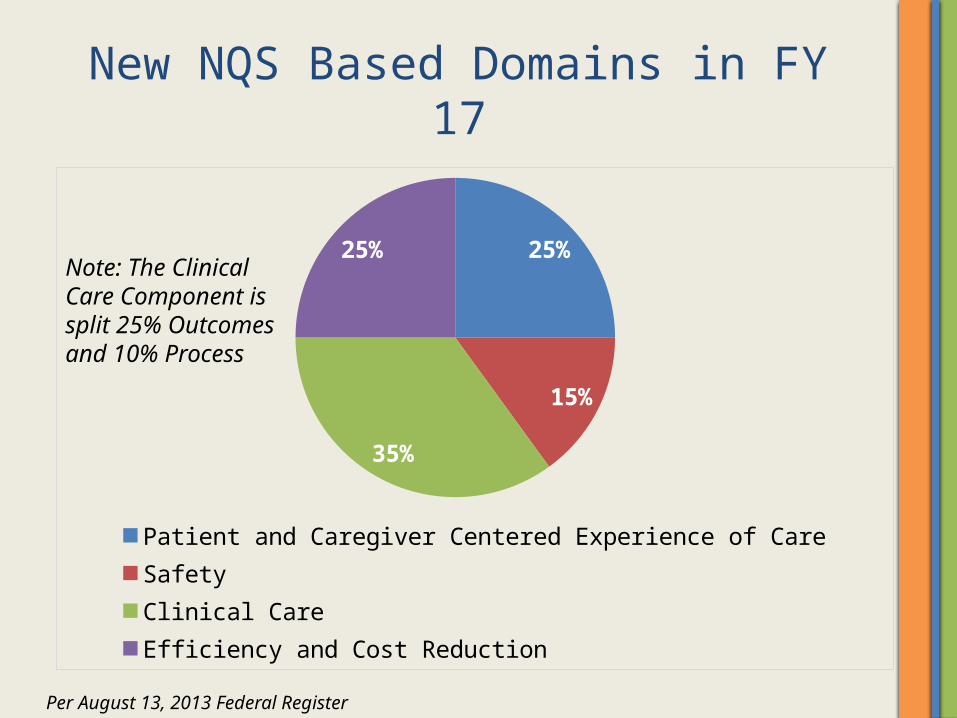
New NQS Based Domains in FY 17
25%
15%
35%
25%
Patient and Caregiver Centered Experience of CareSafetyClinical CareEfficiency and Cost Reduction
Note: The Clinical Care Component is split 25% Outcomes and 10% Process
Per August 13, 2013 Federal Register

What Determines Reimbursement?• Reimbursement Determined Two Ways
– Improvement– Achievement
• Improvement– How we measure against ourselves
• Did we do better than last year
• Achievement– How we compare to Top Decile
• Must Meet or Exceede the Mean Scores of Top Decile Performers (350 Hospitals)
14

Clarification of Definitions
• In the Final Rule: August 19, 2013– “Achievement Threshold (or achievement performance standard)
means the median (50th percentile) of hospital performance on a measure during a baseline period with respect to a fiscal year, for Hospital VBP Program measures other than the Medicare Spending Per Beneficiary measure and the median (50th percentile) of hospital performance on a measure during the performance period with respect to a fiscal year, for the Medicare Spending per Beneficiary measure”
– “Benchmark means the arithmetic mean of the top decile of hospital performance on a measure during the baseline period with respect to a fiscal year, for Hospital VBP Program measures other than the Medicare Spending per Beneficiary measure, and the arithmetic mean of the top decile of hospital performance on a measure during the performance period with respect to a fiscal year, for the Medicare Spending Per Beneficiary measure” Per August 13, 2013 Federal Register

Scenario on ScoringAMI 7a- Fibrinolytic Therapy
.6548Achievement Threshold
.9191Benchmark
Baseline
Performance
Score.4287
Score.8163
Achievement Range (1-10)
Improvement Range (0-9)
Sourced: 2010 August Federal Register

FY 16 Clinical Process of Care 10%Measure ID Description
Achievement Threshold Benchmark
AMI-7a Fibrinolytic Therapy received within 30 min of hospital arrival
.91154 1.0000
IMM-2 Influenza Immunization .90607 .98875
PN-6 Initial antibiotic selection for CAP in Immunicompetent pt
.96552 1.0000
SCIP-Inf-2 Prophylatic Antibiotic Selection for Surgical Pts .99074 1.0000
SCIP-Inf-3 Prophylatic Antibiotics discontinued 24 hrs after surgery end time
.98086 1.0000
SCIP- Inf-9 Urinary catheter removed on post op day 1 or 2 .97059 1.0000
SCIP- Card-2 Surgery patients on beta blocker therapy prior to arrival who received a beta blocker during perioperative period
.97727 1.0000
SCIP-VTE-2 Surgery patients who received appropriate VTE prophylaxes within 24 hours prior to surgery to 24 hours after surgery
.98225 1.0000
Per August 13, 2013 Federal Register
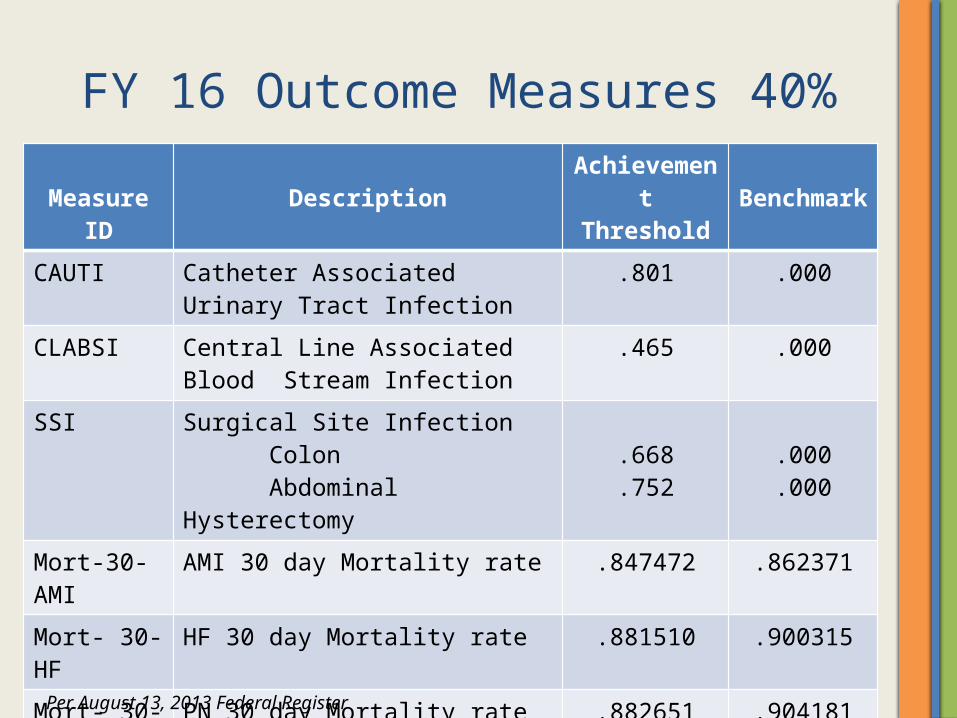
FY 16 Outcome Measures 40%Measure ID Description
Achievement Threshold Benchmark
CAUTI Catheter Associated Urinary Tract Infection
.801 .000
CLABSI Central Line Associated Blood Stream Infection
.465 .000
SSI Surgical Site Infection Colon Abdominal Hysterectomy
.668
.752.000.000
Mort-30-AMI AMI 30 day Mortality rate .847472 .862371
Mort- 30-HF HF 30 day Mortality rate .881510 .900315
Mort- 30-PN PN 30 day Mortality rate .882651 .904181
PSI-90 Complication/patient safety for selected indicators (composite)
.622879 .451792
Per August 13, 2013 Federal Register

FY 16 Patient Experience of Care 25%
DescriptionFloor
Achievement Threshold Benchmark
Communication with Nurses 53.99 77.67 86.07
Communications with Doctors 57.01 80.40 88.56
Responsiveness of Hospital Staff 38.21 64.71 79.76
Pain Management 48.96 70.18 78.16
Communication about Medicines 34.61 62.33 72.77
Hospital Cleanliness & Quietness 43.08 64.95 79.10
Discharge Information 61.36 84.70 90.39
Overall Rating of Hospital 34.95 69.32 83.97
Per August 13, 2013 Federal Register
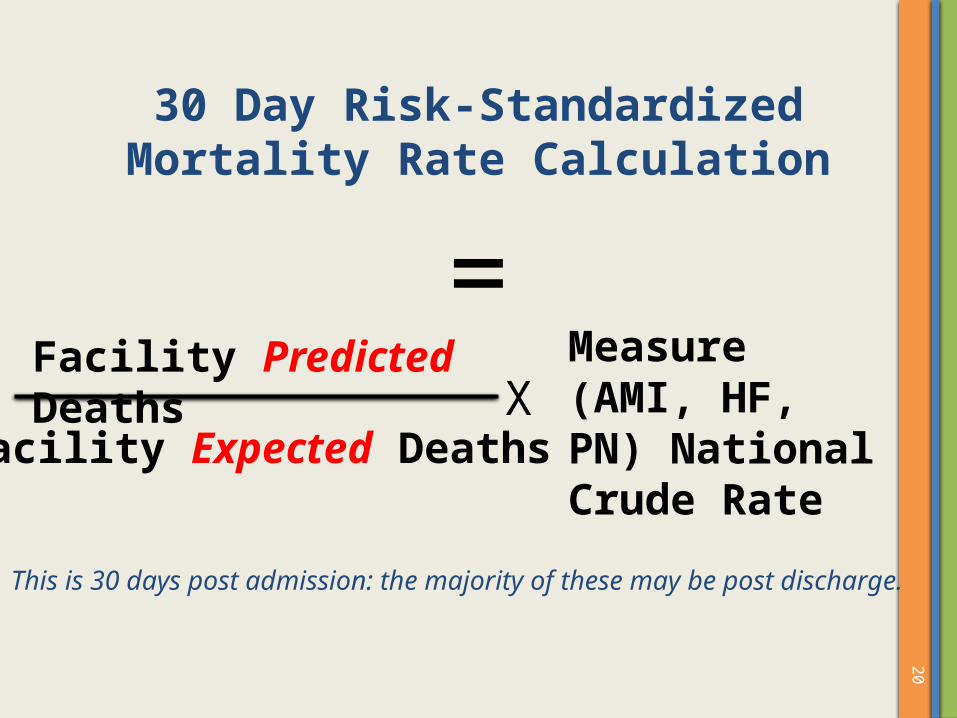
30 Day Risk-Standardized Mortality Rate Calculation
20
Facility Predicted Deaths
Facility Expected DeathsX
Measure (AMI, HF, PN) National Crude Rate
=
This is 30 days post admission: the majority of these may be post discharge.

HF Mortality FormulaNumerator & Denominator Description The measure cohort consists of admissions for Medicare Fee-for-Service (FFS) and Veterans Health Administration (VA) beneficiaries aged 65 years and older discharged from non-federal acute care hospitals or VA hospitals, respectively, having a principal discharge diagnosis of heart failure (HF). The hospital-specific risk-standardized mortality rate (RSMR) is calculated as the ratio of the number of "predicted" deaths to the number of "expected" deaths, multiplied by the national unadjusted mortality rate. The "denominator" is the number of deaths expected on the basis of the nation's performance with that hospital's case mix.The "numerator" of the ratio component is the number of deaths within 30 days predicted on the basis of the hospital's performance with its observed case mix.
It conceptually allows for a comparison of a particular hospital's performance given its case mix to an average hospital's performance with the same case mix. Thus, a lower ratio indicates lower-than-expected mortality or better quality, and a higher ratio indicates higher-than-expected mortality or worse quality.
Source: http://www.qualitymeasures.ahrq.gov/content.aspx?id=35573

Heart Failure Risk Adjustments
Demographics •Age-65 (years above 65, continuous) •Male
Cardiovascular •History of percutaneous transluminal coronary angioplasty (PTCA) •History of coronary artery bypass grafting (CABG) •Congestive heart failure •Acute myocardial infarction (AMI) •Other acute/subacute forms of ischemic heart disease •Chronic atherosclerosis •Cardio-respiratory failure and shock •Valvular and rheumatic heart disease
Comorbidity •Hypertension •Stroke •Renal failure •Chronic obstructive pulmonary disease (COPD) •Pneumonia •Diabetes and diabetes mellitus (DM) complications •Protein-calorie malnutrition •Dementia and senility •Hemiplegia, paraplegia, paralysis, functional disability •Peripheral vascular disease •Metastatic cancer, acute leukemia, and other severe cancers •Trauma in the last year •Major psychiatric disorders •Chronic liver disease
The final set of risk-adjustment variables included:
Source: http://www.qualitymeasures.ahrq.gov/content.aspx?id=35573
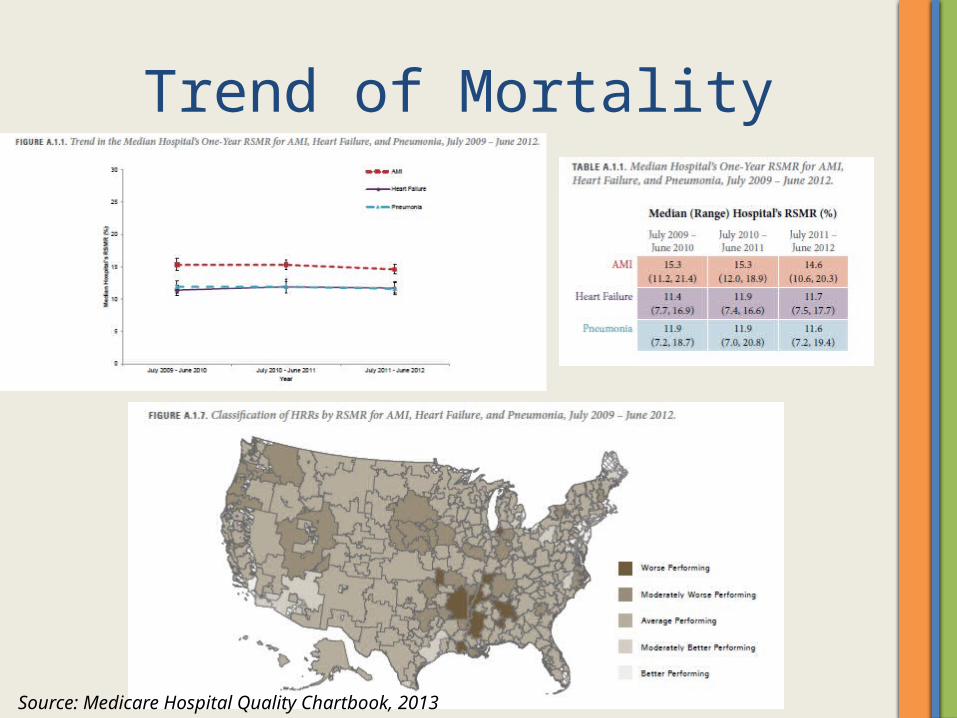
Trend of Mortality
Source: Medicare Hospital Quality Chartbook, 2013

Distribution of Mortality
Source: Medicare Hospital Quality Chartbook, 2013

Efficiency Definition• Medicare Spending Per Beneficiary (MSPB)
– Captures total Medicare spending per beneficiary, relative to a hospital stay, bundling hospital sources (Part A) with post acute care (Part B).
– Bundles the cost of care delivered to a beneficiary for an episode of care across the continuum of care.
• 3 days prior to admission and 30 days post discharge• Indexed by the discharging hospital regardless of who
provides services in the 3 days prior and 30 days post
– The first performance period ended 12/31/13 for FFY 15 and the second one started 1/1/14 for FFY 16.

26
Medicare Spending Per Beneficiary
Lists percent of spending for the hospital vs. state
and national statistics by
provider type.

By MDC for each Hospital27
Lists all 25 MDCs with state and national averages
Three additional reports along with the summary on Qnet: index admission file, beneficiary risk score file and an
MSPB episode file.

What should I be looking for next?
Watch for the flags…
On Hospital Compare

Heads Up: Stroke
Source: Medicare Hospital Quality Chartbook, 2013

Timeline of Performance

Reform ReadinessAmount at Risk
2013 2014 2015 2016 2017
Readmission Program (a) 1.0% 2.0% 3.0% 3.0% 3.0%
Value Based Purchasing (b) 1.0% 1.25% 1.5% 1.75% 2.0%
Hospital Acquired Conditions (a) 1.0% 1.0% 1.0%
Total Potential Rates at Risk 2.0% 3.25% 5.5% 5.75% 6.0%
a: Represents a worst case scenario and a ceiling of the maximum penaltiesb: Represents a withhold of payment that can be earned back based on quality metrics

Hospital Acquired Conditions: Final Rule for FFY 2015
First Domain 35% : PSIsPerformance Period: 7/1/11-6/30/13
Second Domain 65%: CDCPerformance Period: CY 2012 & 2013
Pressure Ulcer Rate CLABSI
Foreign Object Left in Body CAUTI
Iatrogenic Pneumothorax Rate
Postoperative Physiologic and Metabolic Derangement Rate
Postoperative Pulmonary Embolism and Deep Vein Thrombosis Rate
Accidental Puncture and Laceration Rate
1% Medicare Reimbursement at riskLowest performing quartile will be penalized

HAC Domain Weightings33
CLABSI: 32.5%
CAUTI: 32.5%
Pressure Ulcer Rate: 8.33%
Foreign Object LeftIn Body: 8.33%
DOMAIN 1: 35% DOMAIN 2: 65%

Proposed Future Measures: Domain 2
First Domain: PSIs Second Domain: CDC
Pressure Ulcer Rate CLABSI
Foreign Object Left in Body CAUTI
Iatrogenic Pneumothorax Rate SSI Following Colon Surgery (FY 2016)
Postoperative Physiologic and Metabolic Derangement Rate
SSI Following Abdominal Hysterectomy (FY 2016)
Postoperative Pulmonary Embolism and Deep Vein Thrombosis Rate
Methicillin-Resistant Staphylococcus Aureus (MRSA) Bacteremia (FY 2017)
Accidental Puncture and Laceration Rate Clostridium Difficile (FY 2017)

35

36
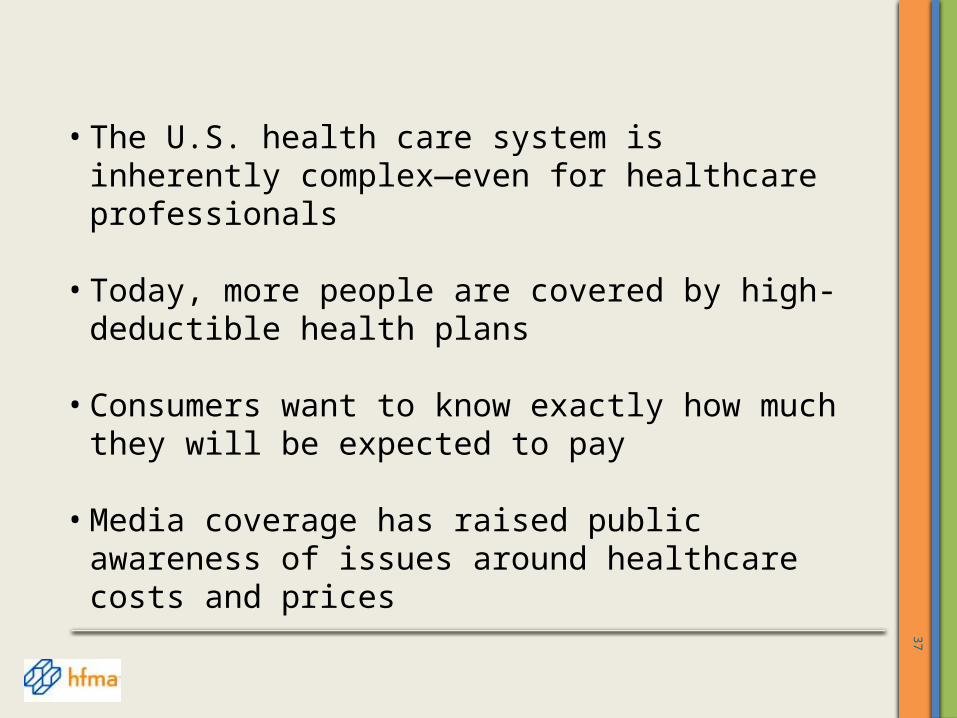
Why is patient financial communication important now?
37
• The U.S. health care system is inherently complex—even for healthcare professionals
• Today, more people are covered by high- deductible health plans
• Consumers want to know exactly how much they will be expected to pay
• Media coverage has raised public awareness of issues around healthcare costs and prices

Donna ShalalaFormer U.S. Secretary of Health and Human ServicesOctober 2013
“There’s never been a more important time in our history for very clear communication between healthcare professionals and our patients.”

39
What do the best practices cover?
• Where and when to have financial discussions• Who participates• What topics to address• Discussion parameters• Assessment framework

40
How were the best practices developed?
These best practices reflect the consensus of a steering committee of experts across many fields, including
• Patients• Hospitals• Physicians• Payers
…advised by a team of leading national policymakers

41
How can we demonstrate our commitment to excellence in patient financial communication?
• Adopters receive acknowledgement on the HFMA website and in hfm magazine.
• Adopters may use the phrase “Supporter of the Patient Financial Communications Best Practices” in marketing materials.
• No fees involved• All healthcare provider organizations are eligible.
Become an Adopter of the best practices.

42
hfma.org/communications

43
Price Transparency Task Force

44
Medical Debt Collection Task Force
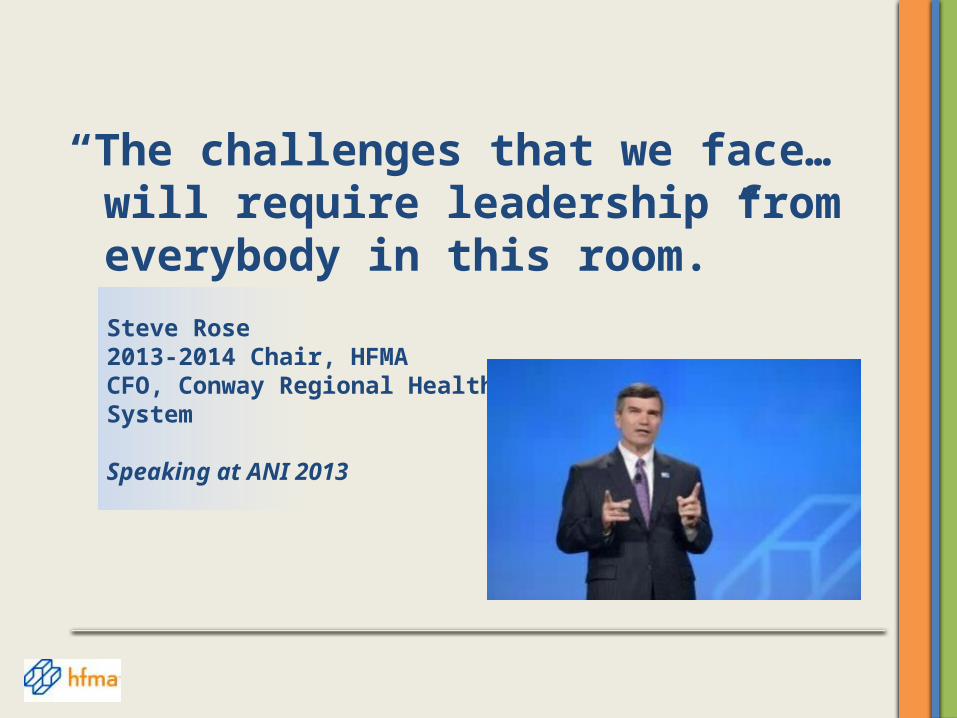
“The challenges that we face… will require leadership from everybody in this room.”
Steve Rose2013-2014 Chair, HFMACFO, Conway Regional Health System
Speaking at ANI 2013

Thank you!