leadership style of turkish middle level managers in private
TRANSCRIPT

LEADERSHIP STYLE OF TURKISH MIDDLE LEVEL MANAGERS IN PRIVATE SECTOR AND ITS RELATIONSHIP WITH SUBORDINATE
PERFORMANCE, SATISFACTION, AND COMMITMENT
A THESIS SUBMITTED TO THE GRADUATE SCHOOL OF SOCIAL SCIENCES
OF MIDDLE EAST TECHNICAL UNIVERSITY
BY
NURSEL İPEK ÖZMEN
IN PARTIAL FULFILLMENT OF THE REQUIREMENTS FOR
THE DEGREE OF MASTER OF SCIENCE IN
INDUSTRIAL AND ORGANIZATIONAL PSYCHOLOGY
DECEMBER 2005

ii
Approval of the Graduate School of Social Sciences
Prof. Dr. Sencer Ayata Director
I certify that this thesis satisfies all the requirements as a thesis for the degree of Master of Arts.
Prof. Dr. Nebi Sümer Head of Department
This is to certify that we have read this thesis and that in our opinion it is fully adequate, in scope and quality, as a thesis for the degree of Master of Arts.
Assoc. Prof. Dr. H. Canan Sümer Supervisor
Examining Committee Members
Prof. Dr. Canan Ergin (Hacettepe U., PSY)
Assoc. Prof. Dr. H. Canan Sümer (METU, PSY)
Assoc. Prof. Dr. Reyhan Bilgiç (METU, PSY)
iii
I hereby declare that all information in this document has been obtained and presented in accordance with academic rules and ethical conduct. I also declare that, as required by these rules and conduct, I have fully cited and referenced all material and results that are not original to this work. Name, Last name : Özmen, Nursel İpek
Signature :

iv
ABSTRACT
LEADERSHIP STYLE OF TURKISH MIDDLE LEVEL MANAGERS IN PRIVATE SECTOR AND ITS RELATIONSHIP WITH SUBORDINATE
PERFORMANCE, SATISFACTION, AND COMMITMENT
Özmen, N. İpek
M.S., Department of Psychology
Supervisor: Assoc. Prof. Dr. H. Canan Sümer
December 2005, 126 pages
The main purpose of the present study was to examine the leadership
styles of Turkish middle-level managers and leadership prototypes of Turkish
employees in terms of task-oriented and people-oriented behaviours. The
secondary purpose was to investigate the effects of incongruence between actual
and ideal manager perceptions on three important work outcomes: performance
(task and contextual performance), job satisfaction, and organizational
commitment (affective, continuance, and normative commitment).
A total of 320 people working in a wide range of organizations (71
managers and 239 employees) filled out the questionnaire. Employees rated their
actual managers’ leadership style and also their ideal manager’s leadership style
(i.e., leader prototype) in the same questionnaire, while the managers rated their
own leadership style as well as their leadership style as perceived by their
subordinates. Additionally, supervisory-rated performance and self-rated job
satisfaction and organizational commitment levels of employees were obtained.
Results indicated that self-reported leadership styles of Turkish managers
were consisting of more people-oriented behaviours than task-oriented
behaviours. On the contrary, employees perceived their managers as being more
v
task-oriented than people-oriented. Ideal leadership style for the employees were
comprised of higher levels of both task- and people-oriented behaviours than their
actual managers. Incongruence between the actual and ideal manager perceptions
of employees predicted job satisfaction levels of the employees only.
The results are discussed together with the implications, strengths and
limitations of the study. Some suggestions for future research are made.
Keywords: Leadership, Leadership Prototype, Task vs. People Orientation,
Performance, Job Satisfaction, Organizational Commitment.

vi
ÖZ
TÜRKİYE’DE ÖZEL SEKTÖRDE ÇALIŞAN ORTA KADEME YÖNETİCİLERİN LİDERLİK TARZLARI VE ÇALIŞANLARIN
PERFORMANSI, İŞ DOYUMU VE ÖRGÜTSEL BAĞLILIĞI İLE İLİŞKİSİ
Özmen, N. İpek
Yüksek Lisans, Psikoloji Bölümü
Tez yöneticisi: Doç. Dr. H. Canan Sümer
Aralık 2005, 126 sayfa
Çalışmanın temel amacı Türkiye’deki orta kademe yöneticilerin liderlik
tarzlarını ve çalışanların ideal yönetici prototiplerini işe odaklılık ve insana
odaklılık boyutlarında araştırmaktı. Diğer bir amaç da çalışanların mevcut
yöneticileri ve ideal yöneticilerinin arasındaki uyum veya farkın çalışan
performans, iş tatmini ve bağlılığına olan etkisini incelemekti.
Çalışmaya farklı sektörlerden toplam 320 kişi (71 yönetici ve 239 çalışan)
katılmıştır. Çalışanlardan, mevcut yöneticilerinin liderlik tarzları ile kendileri için
ideal yöneticilerin liderlik tarzlarını değerlendirmeleri istenmiştir. Yöneticilerden
ise, kendi liderlik tarzlarını ve çalışanların onların liderlik tarzlarını nasıl
algıladıklarını değerlendirmeleri istenmiştir. Ayrıca, çalışanların iş tatmini ve
organizasyonel bağlılık düzeylerine ilişkin özdeğerlendirmeleri ile yöneticileri
tarafından yapılan performans değerlendirmeleri alınmıştır.
Analiz sonuçları, yöneticilerin liderlik tarzlarının ağırlıklı olarak ne insana
yönelik ne de işe yönelik olduğunu, ancak insana yönelik olma yönünde daha
belirgin bir eğilimin var olduğunu göstermiştir. Diğer taraftan, çalışanların,
mevcut yöneticilerinin işe yönelik yönlerini, insana yönelik yönlerinden daha
yüksek olarak algıladıkları gözlenmiştir. Çalışanların ideal yöneticilerini
değerlendirmelerinde ise bu iki liderlik tarzı arasında anlamlı bir fark olmadığı,
vii
çalışanların ideal yönetici şemalarında hem işe yönelik hem de insana yönelik
davranışların mevcut yöneticilerde olandan daha fazla olduğu tespit edilmiştir.
Çalışanların mevcut yöneticileri ile ideal yönetici algılamaları arasındaki
farkın ve yöneticilerin kendilerine ilişkin algılamaları ile çalışanların bu
yöneticilere ilişkin algılamaları arasındaki farkın çalışanların performansı, iş
doyumu ve örgütsel bağlılığı üzerindeki etkileri hiyerarşik regresyon tekniği ile
incelenmiştir. İdeal yönetici ve mevcut yönetici algıları arasındaki farkın yalnızca
iş doyumu üzerinde anlamlı ve aynı zamanda negatif bir etkisi olduğu
bulunmuştur. Özellikle insana yönelik liderlik davranışlarında ideal ve mevcut
yöneticiler arasındaki fark (ve de yöneticilerin kendi değerlendirmeleriyle
çalışanların onları algılaması arasındaki fark) arttıkça, iş doyumunun azaldığı
gözlenmiştir.
Elde edilen verilerin kuramsal ve uygulamaya yönelik doğurguları ele
alınmıştır. Çalışmanın güçlü olan yönleri ve sınırlılıkları ile birlikte ileriki
çalışmalar için bazı önerilerde bulunulmuştur.
Anahtar Kelimeler: Liderlik, Lider Prototipi, İşe ve İnsan Yönelik Olma,
Performans, İş Doyumu, Örgütsel Bağlılık

viii
To my parents &
Barış
ix
ACKNOWLEDGMENTS
First of all, I would like to express my deepest appreciation to my
supervisor Assoc. Prof. Dr. H. Canan Sümer for her patience, guidance, advice,
criticism, and motivation in all stages of this study. I would also like to thank for
the insight and theoretical information she provided me during my graduate study.
I would like to present special thanks to Prof. Dr. Canan Ergin for providing
theoretical background about the subject of this study in her course and to Assoc.
Prof. Dr. Reyhan Bilgiç for her valuable suggestions and comments.
I can never forget the support provided by Dr. S. Arzu Wasti, Dr. Robert
House, and Dr. John Antonakis in gathering the relevant scales used in this study.
I would like to thank to all of the participating companies of this study,
which cannot be named here. Special thanks will go to Ayça Oyal and Müge
Karakurum for their sincere support and friendship, together with H. Tuğba Erol,
Başak Ok, and Bahar Öz for their technical assistance and help throughout this
study.
I would also like to express my greatest gratitude to my family for their
trust and support and my love Umut Barış Ayhan for his presence in my life.

x
TABLE OF CONTENTS
PLAGIARISM……………………………………………………………………iii
ABSTRACT………………………………………………………………………iv
ÖZ………………………………………………………………………………...vi
DEDICATION…………………………………………………………………..viii
ACKNOWLEDGEMENTS………………………………………………………ix
TABLE OF CONTENTS………………………………………………………….x
LIST OF TABLES ……………………………………………………………...xiii
LIST OF FIGURES……………………………………………………………..xvi
CHAPTER
1. INTRODUCTION…………………………………………………………......1
1.1. Overview ………………………………………………….……………...1
1.2. Leadership Theories ………………………………………………..…….1
1.3 Leadership and Work Outcomes: Job Satisfaction, Organizational
Commitment, and Subordinate Performance………………………….…10
1.3.1. Job Satisfaction …………………………………………………...10
1.3.2. Organizational Commitment ……………………………………...11
1.3.3. Performance ………………………………………………………12
1.3.4 The Relationships between Leadership and Work Outcomes …….13
2. LEADERSHIP AND PERCEPTION OF THE LEADER …...…………......15
2.1 Employee Perceptions and Leadership Prototypes ……………………...15
2.2 Culture and Leadership ………………………………………………….18
2.3. Leadership in the Turkish Context ……………………………………..23
2.4. Implications and Hypotheses …………………………………………...27
3. METHOD …………………………………………………………………...31
3.1 Sample …………………………………………………………………..31
3.2 Measures ………………………………………………………………...32
xi
3.2.1 Measurement of Leadership Styles………………………………...33
3.2.2 Measurement of Job Satisfaction ……………………………….....35
3.2.3 Measurement of Organizational Commitment …………………....36
3.2.4 Measurement of Performance …………………………………..…36
3.3 Procedure ………………………………………………………………...37
3.4 Analyses …………………………………………………………………37
4. ANALYSIS ………………………………………………………………….40
4.1 Sample Characteristics …………………………………………………..40
4.2 Exploratory and Confirmatory Factor Analyses………………………....42
4.3 Descriptive Statistics ................................................................................43
4.4 Hypotheses Testing ...................................................................................49
4.4.1 Leadership Style of Managers and Leadership Prototypes of
Employees ........................................................................................50
4.4.2 Effects of Incongruence between Actual and Ideal
Leadership Style on Organizational Outcomes ................................56
4.4.2.1 Calculation of Congruence/Incongruence ............................56
4.4.2.2. Regression Analyses ...........................................................58
4.4.2.2.1 Prediction of Task and Contextual Performance ………58
4.4.2.2.2 Prediction of Job Satisfaction ………………………….64
4.4.2.2.3 Prediction of Affective, Continuance, and Normative
Commitment …………………………………………...67
4.4.2.2.4 Prediction of Work Outcomes by Incongruences
based on Transformational, Transactional, and
Instrumental Leadership .................................................72
4.4.2.2.5 Most and Least Preferred Leadership Behaviours:
An Item-based Analysis...................................................77
4.4.2.2.6 Effects of Order of the Ideal vs. Actual Leader Items….77
5. DISCUSSION ………………………………………………………………...81
5.1 Overview ………………………………………………………………...81
5.2. Demographic Variables and Correlations among the Variables ………..81
5.3 Results of Hypothesis Testing …………………………………………...83

xii
5.3.1. Leadership Style of the Managers ………………………………...83
5.3.2. Leadership Style of Ideal Managers ………………………………84
5.3.3. Congruence of Leadership Style Perceptions and
Work Outcomes ..............................................................................86
5.3.4. A General Discussion of Actual and Ideal Managers’ Leadership
Styles and Relationship Between Congruence of Leadership Style
Perceptions and Work Outcomes ..........................................................87
5.4. Implications of the Findings......................................................................89
5.5 Strengths of the Study ...............................................................................89
5.6 Limitations of the Study and Suggestions for Future Research ................90
REFERENCES…………………………………………………………………...92
APPENDICES ………………………………………………………………….103
A. QUESTIONNAIRE INFORMATION FORM ……………………………..103
B. TASK-ORIENTATION ITEMS (LOQ) ……………………………………106
C. PEOPLE-ORIENTATION ITEMS (LOQ) …………………………………108
D. TRANSFORMATIONAL LEADERSHIP ITEMS (LPI) ………………….110
E. TRANSACTIONAL LEADERSHIP ITEMS (LPI) …………......................112
F. INSTRUMENTAL LEADERSHIP ITEMS …………………...............114
G. MINNESOTTA SATISFACTION QUESTIONNAIRE (MSQ)……………116
H. ORGANIZATIONAL COMMITMENT QUESTIONNAIRE ……………..118
I. PERFORMANCE ITEMS …………………………………….......................121
J. DEMOGRAPHIC QUESTIONS (Subordinates) ……………………………123
K. DEMOGRAPHIC QUESTIONS (Managers) ………………………………125
xiii
LIST OF TABLES
TABLES
3.1. Scales/Measures used in Manager and Incumbent Questionnaires …….…34
4.1. Descriptives for Participants…………………………………………...…..41
4.2. Results of the Confirmatory Factor Analyses and Model Comparisons.….42
4.3. Means, Standard Deviations and Reliabilities Concerning
the Variables of Interest (Employee Data) ……………………………......44
4.4. Means, Standard Deviations, and Reliabilities Concerning
the Variables of Interest (Manager Data) ………………………………....45
4.5. Means, Standard Deviations, and Correlations Between
Variables Obtained From / Concerning Employees ……………………....46
4.6. Means, Standard Deviations, and Correlations Between
Variables Obtained From / Concerning Managers ………………………..48
4.7. Manager Self-Ratings on Task and People Orientation:
Means and Standard Deviations …………………………………………..50
4.8. Subordinate Ratings of Actual and Ideal Managers’ Task and People
Orientation: Means and Standard Deviations ……………………………..50
4.9. Results of Paired-Sample t-tests …………………………………………..52
4.10. Manager Self Ratings and Subordinate Evaluation as Presumed by
Managers on Task- and People-Orientation: Means and
Standard Deviations ……………………………………………………….54
4.11. Means and Standard Deviations of Incongruence Scores …………………57
4.12. Predicting Task Performance from Incongruence between
Actual and Ideal Manager Evaluations of Subordinates:
Summary of Hierarchical Regression Analysis ...........................................60
xiv
4.13. Predicting Task Performance from Incongruence between
Perceptions of Managers and their Subordinates: Summary of
Hierarchical Regression Analysis ................................................................61
4.14. Predicting Contextual Performance from Incongruence between
Actual and Ideal Manager Evaluations of Subordinates:
Summary of Hierarchical Regression Analysis ...........................................62
4.15. Predicting Contextual Performance from Incongruence between
Perceptions of Manager and their Subordinates: Summary of
Hierarchical Regression Analysis ................................................................63
4.16. Predicting Job Satisfaction from Incongruence between
Actual and Ideal Manager Evaluation of Subordinates:
Summary of Hierarchical Regression Analysis ...........................................65
4.17. Predicting Job Satisfaction from Incongruence between
Perceptions of Managers and their Subordinates: Summary of
Hierarchical Regression Analysis …………………………………………67
4.18. Predicting Affective Commitment from Incongruence between
Actual and Ideal Manager Evaluations of Subordinates:
Summary of Hierarchical Regression Analysis …………………………...68
4.19. Predicting Affective Commitment from Incongruence between
Perceptions of the Managers and Their Subordinates: Summary of
Hierarchical Regression Analysis …………………………………………69
4.20. Predicting Continuance Commitment from Incongruence between
Actual and Ideal Manager Evaluations of Subordinates:
Summary of Hierarchical Regression Analysis …………………………...70
4.21. Predicting Continuance Commitment from Incongruence between
Perceptions of Managers and their Subordinates: Summary of
Hierarchical Regression Analysis …………………………………………71
4.22. Predicting Normative Commitment from Incongruence between
Actual and Ideal Manager Evaluations of Subordinates:
Summary of Hierarchical Regression Analysis …………………………...71

xv
4.23. Predicting Normative Commitment from Incongruence between
Perceptions of the Managers and their Subordinates: Summary of
Hierarchical Regression Analysis …………………………………………72
4.24. Subordinate Evaluations of Actual and Ideal Managers on
Transformational, Transactional, and Instrumental Leadership:
Means and Standard Deviations …………………………………………..73
4.25. Predicting Job Satisfaction from Incongruence between Actual and
Ideal Manager Perceptions of Subordinates on Transformational
Leadership: Summary of Hierarchical Regression Analysis ……………...74
4.26. Predicting Job Satisfaction from Incongruence between Actual and
Ideal Manager Perceptions of Subordinates on Transactional
Leadership: Summary of Hierarchical Regression Analysis ……………...75
4.27. Predicting Job Satisfaction from Incongruence between Actual and
Ideal Manager Perceptions of Subordinates on Instrumental
Leadership: Summary of Hierarchical Regression Analysis ……………...76
4.28. Items with Highest Ratings for Subordinates’ Actual and Ideal
Managers and for Managers’ Self-Ratings ………………………………..78
4.29. Items with Lowest Ratings for Subordinates’ Actual and Ideal
Managers and for Managers’ Self-Ratings ………………………………..78
4.30. Difference in Subordinates’ Ratings Depending on Questionnaire
Order: Means and Standard Deviations …………………………………...79
4.31. Difference in Managers’ Ratings Depending on Questionnaire
Order: Means and Standard Deviations …………………………………...80
xvi
LIST OF FIGURES
FIGURES 1. Plot of the Interaction between Task- and People-Orientation of Actual
and Ideal Manager as Evaluated by Subordinates …………………………53
2. Plot of the Interaction between Task- and People-Orientation of Self
Evaluations and Subordinate Evaluations as Perceived by Managers …….55

1
CHAPTER I
INTRODUCTION
1.1 Overview
The main objective of this study was first to examine the leadership styles
of Turkish middle level managers as perceived by their subordinates and by
themselves and then to examine the effects of incongruence between ideal and
actual manager’s leadership styles, as perceived by subordinates, on employee
performance, job satisfaction, and organizational commitment. This introduction
is organized into three parts: In the first part, theoretical and empirical literature
on leadership and leadership effectiveness are explored. More specifically,
different models of leadership and the effects of leadership style on subordinate
performance, job satisfaction, and organizational commitment are examined. In
the second part, leadership perceptions of subordinates and cultural perspectives
on leadership are investigated using both cross-cultural studies and studies on
Turkish culture. Finally, the hypotheses of the study are presented.
1.2 Leadership Theories
Many researchers have attempted to define leadership using different
terms like traits, behaviour, influence, interaction patterns, and role relationships
(Bass, 1990; Yukl, 1998). We can define leadership as “an ability to influence,
motivate, and enable others to contribute towards the effectiveness and success of
the organization” (House, Javidan, Hanges, & Dorfman, 2002, pp. 5). Leadership
can also be defined as a social influence process in which one person can enlist
2
the help and support of others in the accomplishment of a common task (Chemers,
1997). These definitions reveal that leadership is both an ability and an influence
process. It is a two-way relationship between the leader and the follower(s) in
terms of leader behaviours and outcomes, and interpretation of these behaviour
and outcomes by the follower(s). This is the reason why leadership research
includes followers/subordinates.
Definition of an effective leader or effective leadership style can change
depending on the culture of the organization and/or country, as well as the
outcome variables of interest (e.g., Lord & Maher, 1991). However, despite the
variance associated with specific situations, the most commonly used criteria to
measure leader effectiveness are the degree to which the group or organization
successfully attains its goals and how the leader satisfies the followers’ needs and
expectations (Yukl, 1998). Not surprisingly, subordinate performance,
satisfaction, and commitment are among the outcome variables to be used in
measuring leader effectiveness. (Yukl, 1998)
Leadership has been approached from quite distinct and different points of
view by different researchers. Some researchers grounded their leadership theory
to the specific personal characteristics of managers, some to the attitudes toward
subordinates, job-related facets, and so. Of those leadership theories, major ones
(i.e., traits approach, behavioural approach, path-goal theory, situational
leadership, and transformational-transactional leadership) are briefly reviewed
below.
Trait approach. One of the most widely used predictors or antecedents of
managerial effectiveness is the personality characteristics of the managers. As
stated by a literature survey by Stogdill (cited in Pierce & Newstorm, 2003), five
factors have been found to be associated with leadership in the majority of
leadership studies: capacity (i.e., intelligence, alertness, and originality),
achievement (i.e., knowledge, scholarship), responsibility (i.e., dependability,
initiative, self-confidence), participation (i.e., activity, sociability, adaptability),
and status (i.e., socioeconomic position, popularity). Stogdill found that the
average leader exceeded the average member of his/her group to some degree in

3
those respects. Kirkpatrick and Locke (2003) investigated core leadership traits
and came up with the result that there were six traits (i.e., drive, desire to lead,
integrity, self-confidence, cognitive ability, and knowledge of the business)
differentiating leaders from nonleaders. They concluded that leaders did not have
to be geniuses or wonders but they needed to have the “right stuff.”
To go one step further, certain traits were described for effective leaders
by several authors. Research conducted by Silverthorne (2001) suggested that
personality factors had significant relationship with managerial effectiveness.
Silverthorne argued that effective managers in the United States, Thailand, and
Taiwan described themselves as more extraverted, more agreeable, more
conscientious, and less neurotic than less effective managers. Managers of the
United States also described themselves as more open to experience. Similarly,
Yukl (1998) reviewed literature and summarized most relevant aspects of
personality for effective leadership. These traits were high energy level and stress
tolerance, self-confidence, emotional maturity, integrity, socialized power
motivation, internal locus of control, high achievement motivation, and low need
for affiliation. Besides these traits, personal charisma was considered to be an
important component of effective leadership.
Although charismatic leadership was accepted as a component of
transformational leadership (Bass & Avolio, 1994), it is a popular and much
researched topic/attribute in the leadership literature. Sociologist Max Weber
described charismatic individuals as possessing magical abilities and supernatural
power of the mind speech (Etzioni, 1961). A number of researchers have
produced several conceptualizations of charismatic leadership (e.g., House, 1977;
Shamir, House, & Arthur, 1993). One of the most useful and well-researched
models for studying the behaviours of charismatic leaders and how followers
attribute charisma to leader is Conger and Kanungo’s (1994) theory that focuses
on six behavioural factors exhibited by a charismatic leader: strategic vision and
communication behaviour, sensitivity to the environment, unconventional
behaviour, personal risk, sensitivity to organizational members’ needs, and a
deviation from the status quo. Conger and Kanungo’s model focuses on the

4
behavioural aspects of charismatic leadership that the followers base their
attribution of charisma.
Szabo, Reber, Weibler, Brodbeck, and Wunderer (2001) investigated two
concepts that would lead to leadership action: values and behavioural intentions.
Values were called “far-from-action” concepts, while intended behaviours were
called “close-to-action” concepts. The authors introduced a model differentiating
and investigating the relationship between these concepts with a cross-cultural
perspective in three German-speaking countries (Austria, Germany, and
Switzerland). They found not much evidence for cultural differences and
suggested that cognitive/information processing concepts and habits mediated the
relationship between far-from-action and close-to-action concepts. In other words,
it was not possible to differentiate values and behaviour intentions of leaders
without taking the situational variables and the individual characteristics of
leaders into consideration.
Behavioural approach (People-orientation vs. task-orientation). One of
the outputs of the search for effective leader behaviours is the distinction between
people-oriented and task-oriented behaviours. While the Ohio State Leadership
Studies used categories of “consideration” and “initiating structure,” Michigan
Leadership Studies used categories of “task-oriented,” “relations-oriented,” and
“participative” leadership (Yukl, 1998). Moreover, Ekvall and Arvonen (1991)
described effective leader behaviours with categories of “employee-centered” and
“change-centered” behaviours. Employee-centeredness involves concentrating on
the employee needs and development, while change-centeredness is defined as
adapting to change, making changes, and persuading people about the change.
Skogstad and Einarsen (1999) found significant positive correlations between
change-centred leadership style and job satisfaction, organizational commitment,
and evaluations of the leader's competence.
Consideration or relations/people oriented behaviours include mutual trust
and respect, warm personal relationships, and open communication between the
leader and the subordinate(s). On the other hand, task or production oriented
behaviours include organizing, structuring, planning, and are directed toward task

5
accomplishment (Yukl, 1998). Blake and Mouton (1964) presented the
managerial grid theory and proposed that effective leaders have high concern for
both behaviour patterns. That is, high task-oriented and high relations-oriented
behaviours are considered to be the best behavioural condition for effective
leadership. Similarly, in Performance-Maintenance (PM) leadership theory
formulated by Misumi and Peterson (1985), effective leaders are described to be
high in both performance and the maintenance behaviours.
Different approaches to the consideration and task-oriented behaviour
distinction were investigated by the researchers like Casimir (2001), who studied
the timing of exposition of consideration and task-oriented behaviours. He found
that combinative aspects of leadership style had a major impact on participants’
perceptions of pressure and support, and also that it was difficult for leaders to
provide pressure in a manner that is acceptable to subordinates. Findings also
suggested that subordinates preferred their leader to psychologically cushion them
with support immediately before providing them with pressure or instruction and
they disliked receiving pressure or instruction on its own. Evidence also indicated
that leaders who behaved in a manner that was regarded as appropriate by
subordinates received higher ratings on competence and affect than do leaders
who were regarded as behaving inappropriately (Giannantonio, Olian, & Carroll,
1995). These findings reveal that how followers perceive their leader has great
importance in understanding leadership.
Behavioural approach is one of the oldest and also most widely used tool
for examining leadership. Task- and people-orientation distinction is still a widely
used taxonomy that has made an important contribution to the study of leadership
(Yukl, 1998).
Path-goal theory. One of the most important theories of leadership is the
path-goal theory of House (1971), who tried to explain how the behaviour of a
leader can affect the performance and satisfaction of his/her subordinates. The
theory has its roots in expectancy theory of motivation (Vroom, 1964). Four
leader behaviours were identified in Path-goal theory: supportive, directive,
participative, and achievement-oriented leadership.

6
According to the path-goal theory, the influence of a leader’s behaviour
depends on situational and intervening variables like task characteristics and
subordinate expectancies, and valences. In other words, the same behaviour of the
leader in different contexes with respect to task or the subordinate characteristics,
would not lead to the same effects on the subordinate satisfaction and/or
performance levels. For example, when the task is mundane and stressful,
supportive leadership is expected to lead to increased subordinate performance by
minimizing the unpleasant aspects of the task and increasing self-confidence.
However, supportive leadership may be ineffective when subordinates are self-
confident and the tasks are already pleasant. Different leadership behaviours can
be displayed depending on the very conditions of the task and subordinate
characteristics, and an effective leader should possess all four styles in his/her
disposal. As Yukl (1998) stated, research conducted for testing path-goal theory
revealed mixed results, despite the fact that most studies stated a positive effect of
supportive behaviours of leaders on employee satisfaction. Nevertheless, there is
no doubt that path-goal theory had an undeniable contribution to the leadership
literature by emphasizing the importance of situational variables.
Situational leadership theory. Another leadership theory that attracted
attention is situational leadership theory of Hersey and Blanchard (1982) and
Hersey, Blanchard, and Johnson (2001). Similar to the path-goal theory,
situational leadership theory also focuses on situational variables. The theory was
based on leader directive (task) behaviour, leader socio-emotional behaviour, and
follower maturity for performing a task. According to the theory, employee
maturity is a critical moderator of the relationship between leader style and
efficacy. Optimal leader behaviour is assumed to shift according to the changes in
follower maturity (e.g., less structuring is needed as employee’s maturity
increases or high consideration is needed when employee has moderate maturity).
Vecchio and Boatwright (2002) studied how employee maturity and
gender would be associated with preferences for idealized styles of supervision by
using situational leadership theory (SLT) and gender-based role theory. Generally,
the results were in alignment with SLT’s core principle that highly mature

7
employees need less supervisory involvement. Younger, more educated, and more
experienced employees were found to be less likely to prefer structuring than
other employees. Furthermore, females had a stronger preference for
considerateness than males, but males did not express a greater preference for
structuring.
Situational leadership theory was criticized for taking subordinate maturity
into account as the only situational variable and for not differentiating and
examining the characteristics of job or task, subordinate motivation, and
subordinate competency (Yukl, 1998).
Leader-member exchange (LMX) theory. Another situational theory is
LMX theory, which is simply based on the interaction between the leader and the
subordinate (Graen & Cashman, 1975). Leaders are considered to have different
exchange relationships with their subordinates. Subordinates can be members of
the in-group or out-group (Graen & Uhl-Bien, 1995). Out-group members are
treated differently from in-group members by their manager; they are likely to
have more formal relationships and low level of mutual influence with their
managers. On the other hand, manager treats the in-group subordinates much
more favourable in terms of the tasks assigned, benefits, support, and bonuses
provided, and the two parties have feelings of mutual trust and respect against
each other. Managers view the subordinates in the in-group as more capable and
motivated than the out-group members, and the in-group members have similar
values and attitudes with their manager, and have more loyalty toward the
manager. Significant positive relationships between the quality of manager-
subordinate relationship and commitment level and organizational citizenship
behaviours of subordinates were found (Truckenbrodt, 2000). In other words, if
the relationship between the leader and subordinates was positive, close, or
favourable, these subordinates had higher organizational commitment levels and
also they had more organizational citizenship behaviours than the ones with poor
or negative relationships with their leaders. Similarly, Dunegan, Duchon, and Uhl-
Brien, (1992) suggested a correlation between high quality leader-member
exchange with high performance in very high or very low challenging tasks.

8
In general, research on LMX theory suggests that desirable exchange
relationships between the manager and the subordinate would lead to higher levels
of job satisfaction, organizational commitment, and subordinate performance
(e.g., Graen & Cashman, 1975; Graen & Uhl-Bien, 1995; Scandura & Graen,
1984). In other words, subordinate satisfaction, commitment, and performance
seem to be critical consequences of the quality of the relationship between leaders
and managers (Dunegan, Duchon, & Uhl-Brien, 1992; Scandura & Graen, 1984;
Truckenbrodt, 2000).
Transformational and transactional leadership. Another distinction about
leadership styles is transformational versus transactional leadership, introduced by
Burns (1978) and later on developed by Bass (1985). According to Bass (1985),
the leader transforms and motivates followers by making them more aware of the
importance of task outcomes, inducing them to transcend their self interest for the
sake of organization or team, and activating their higher order needs.
Transformational behaviours are defined as idealized influence (charisma),
individualized consideration, inspirational motivation, and intellectual
stimulation. Transactional behaviours, on the other hand, are defined as
contingent rewards, active management by exception, passive management by
exception, and laissez-faire leadership.
Transformational leadership was found to affect organizational
performance both directly (Howell & Avolio, 1993) and indirectly through its
effects on subordinates’ satisfaction with their leader (Hater & Bass, 1988).
Furthermore, performance is considered to be affected indirectly through the
effects of transformational leadership on subordinates’ affective commitment and
performance outcomes (Barling, Weber, & Kelloway, 1996).
As mentioned in the study by Hater and Bass (1988), subordinates’
perception of transformational leadership significantly differentiates outstanding
managers from the others. Consistently, transformational leadership directly and
positively predicted organizational performance of Russian companies over and
beyond the impact of transactional leadership (Elenkov, 2002). Russian managers
who displayed more transactional-leadership behaviours also made a positive

9
contribution to the achievement of organizational goals. McColl-Kennedy and
Anderson (2002) examined whether the emotions of frustration and optimism
mediated the relationship between leadership style and subordinate performance,
and found that transformational leadership had a significant direct influence on
frustration and optimism, with frustration having a stronger effect on performance
than optimism. Furthermore, transformational leadership behaviours correlated
more strongly with leadership effectiveness than did transactional leadership
behaviours (Burns, 1978). However, according to many researchers, both of the
leadership behaviours tend to coexist in effective leaders (e.g., Bass, 1985; Yukl,
1998).
In evaluating transformational, charismatic, and transactional leadership
theories, it would be proper to say that these theories provide important insights,
on ideal leadership behaviours or the leader behaviours that would lead to higher
employee performance, satisfaction, and commitment. However, there is a serious
criticism about the conceptual power of the theories. The underlying influence
processes and the way the leader behaviours are related to these processes may
require further explanation, and there is also considerable ambiguity about the
essential behaviours for charismatic and transformational leadership (Yukl, 1999).
As presented in the overview by Conger and Hunt (1999), critical weaknesses of
these approaches include ambiguous constructs, insufficient descriptions of
mediating variables and explanatory processes, and insufficient specification of
situational variables.
Despite these limitations or problems, research indicates that no matter
how leadership is conceptualized (i.e., whatever taxonomy is used), effective
leadership is associated with positive outcomes, such as increased performance,
satisfaction, and commitment levels of the subordinates. In the following sections,
work outcomes and their relationship with leadership effectiveness is reviewed.
10
1.3 Leadership Effectiveness and Work Outcomes: Job Satisfaction,
Organizational Commitment, and Subordinate Performance
Leadership effectiveness can be evaluated in terms of work outcomes since
work outcomes are usually considered to be consequence of leader behaviours. In
other words, one could understand the success or effectiveness of a leader by
looking at the several reference points like the performance, motivation, and
satisfaction levels of subordinates and their intention to stay in the organization.
1.3.1. Job Satisfaction
Job satisfaction is one of the most commonly used variables in
industrial/organizational psychology literature (Pinder, 1998). Hawthorne studies
in 1920s and 1930s (Mayo, cited in Katzell & Austin, 1992) resulted in an
increased awareness of and interest in the human side of producing goods and
services. Job satisfaction was described by Locke (1976) as an emotional reaction
stemming from the perception that the job allows fulfilment of employee’s job
values and the degree of congruence between these job values and the needs of the
employee. Ilgen (1971) claimed that job satisfaction results from the size of the
discrepancy between what he/she perceives he/she is receiving and expects to
receive; hence satisfaction is a function of expectancies, values, and perceptions.
There are different components or facets of job satisfaction like
satisfaction with work, job conditions, co-workers, pay, or supervision (Locke,
1976). Those components provide a broader understanding on the concept of
satisfaction with different perspectives. Different facets may have different level
of influence for different tasks and for different employees, depending on the
characteristic of the tasks and on the values and needs of the employees. For
example, Bilgiç (1998) reported that monthly payment was the best predictor of
satisfaction of Turkish workers. On the other hand, despite the situational
characteristics, some demographical properties affected levels of job satisfaction,
such as older employees having higher job satisfaction levels (Pinder, 1998).

11
Many studies (e.g., Katzell, Thompson, & Guzzo, 1992; Locke & Latham,
1990) found no direct and reliable relationship between job satisfaction and job
performance. On the other hand, findings of meta-analyses stated a relationship
between job satisfaction and job performance of the employees when there were
contingent rewards on productivity, and promotion and pay were not tied with
each other (Podsakoff & Williams, 1986). Indeed, Katz (1964) suggested that
when defined in a broader manner to include prosocial and citizenship behaviours,
or contextual performance, performance can be expected to have a significant
relationship with job satisfaction.
1.3.2. Organizational Commitment
Another frequently studied work outcome is organizational commitment,
which can be defined as an identification or attachment with an organization
(Mathieu & Zajac, 1990). Moreover, it consists of a will for staying in the
organization, loyalty to the organization, identification or internalization of the
rules, norms, and goals of the organization (Benkhoff, 1997; Mathieu & Zajac,
1990).
Allen and Meyer (1990) proposed a three-component model of
organizational commitment: affective, continuance, and normative commitment.
Affective commitment expresses strong emotional ties and identification with the
organization. Continuance commitment is a relationship between the employee
and the organization based on an exchange relationship, in other words, based on
the cost of leaving the organization. Lastly, normative commitment refers to a
feeling of obligation to the stay in the organization.
Mathieu and Zajac (1990) reported that affective commitment had a strong
relation with satisfaction, and also that high commitment would be associated
with lower levels of mobility (intention to stay in the organization) and greater
national productivity. Randal and O’Driscoll (1997) found that employees with
high calculative commitment scores had weaker links with the organization, and
lower agreement with organizational policies and values. Wasti (2003) proposed
that affective commitment was a strong predictor of turnover intentions. Similarly,

12
a meta analysis done by Cohen (1993) revealed significant inverse correlations
between commitment and lateness and turnover intentions.
Regarding the relationship between organizational commitment and other
work outcomes, Meyer, Paunonen, Gellatly, Goffin, and Jackson (1989) reported
that affective commitment was positively correlated with performance, while
continuance commitment had a negative correlation with performance. However,
in their meta-analysis, Mathieu and Zajac (1990) did not find significant
relationship between organizational commitment and performance.
1.3.3. Performance
Performance is the most widely studied topic in management science
because of its use in decisions concerning employees like pay and benefits,
promotion, and development. Campbell, McCloy, Oppler, and Sager (cited in
Schmitt, Borman, & associates, 1993) claimed that job performance was a
multidimensional construct and had eight-factor latent structure: job-specific task
proficiency, non-job-specific task proficiency, written and oral communication
task proficiency, demonstrating effort, maintaining personal discipline, facilitating
peer and team performance, supervision/leadership, and management/
administration.
With the changes in the nature of work, the shift from relatively stable job
contexts to more dynamic work environment, the role of the individual employees
increased. Definition of job performance was expanded from merely execution of
specific tasks to a broader content with many additional and different activities.
Borman and Motowidlo (1993) argued that not only task related activities, but
also some other activities, called contextual activities, were important for the
organizational effectiveness. Contextual performance is defined in five categories:
volunteering to carry out task activities that are not formally a part of the job,
persisting with extra enthusiasm or effort when necessary to complete own task
activities successfully, helping and cooperating with others, following
organizational rules and procedures even when personally inconvenient, and
endorsing, supporting, and defending organizational objectives. On the other
13
hand, task performance includes behaviours that are part of formal job description
(Motowidlo & Schmit, 1999).
Motowidlo and Van Scotter (1994) reported that task performance and
contextual performance contributed independently to overall performance, and
that task performance had a higher correlation with experience, and contextual
performance had a higher correlation with personality variables of the employees.
1.3.4 The Relationships between Leadership and Work Outcomes
The relationships between leadership effectiveness and important work
outcomes (i.e., job satisfaction, organizational commitment, and performance)
were investigated in a number of studies. Loke (2001) found that 29% of job
satisfaction, 22% of organizational commitment, and 9% of productivity were
explained by use of leadership behaviours. Mullen et al. (1988) suggested that the
more a manager engaged in leadership behaviours, the more satisfied were the
subordinates.
Ehrhart and Klein (2001) suggested that followers’ perceptions of leaders
were based on two mechanisms: First is similarity attraction or the extent of
sharing similar values with the leader, and the second one is need satisfaction or
the extent of leaders’ meeting the needs of the followers. The results of their study
revealed that values and personality are useful predictors of leadership preferences
of the followers. Specifically, eight follower attributes and values [i.e.,
achievement orientation, self-esteem, need for structure, extrinsic rewards
(relationship-oriented), intrinsic rewards, interpersonal relations, security (task-
oriented), and worker participation (charismatic)] significantly correlated with
followers’ preferences for leadership styles. In addition, the authors suggested that
the more attracted a follower by a leader, the more likely he/she is satisfied to
work with that leader, and the more likely that he/she perform well under the
supervision of that leader. Therefore, it seems plausible to assert that as the
subordinates’ perceptions of leader behaviours becomes positive/favourable,
subordinates can be expected to perform better and have more positive work
attitudes.

14
Moreover, according to the Leadership Categorization Theory (Lord &
Maher, 1991), the better the match between the leader and leadership concept held
by the subordinate, the more likely it is that the subordinate sees the leader as a
leader. Managers who display congruent/same behaviours with the prototypes of
the employees would be recognized as effective/successful leaders by their
subordinates. They would then have more legitimate social power, would more
easily influence the employees, and their leadership style would be perceived as
being more positively. Also, if the leadership prototypes of the subordinates
match with the actual behaviours of the leader, the subordinates can be expected
to display better performance.

15
CHAPTER II
LEADERSHIP AND PERCEPTION OF THE LEADER
In this chapter, leadership perceptions and cultural differences in
leadership perceptions are explored. First, subordinate perceptions of leadership
and formation of these perceptions are examined. Cultural differences in
leadership perceptions together with findings of research on Turkish culture and
Turkish leaders are provided next. In the final section of this chapter, hypotheses
of this study are presented.
2.1 Employee Perceptions and Leadership Prototypes
In order to understand how subordinates perceive their leaders, it is
important to know the way subordinates process and interpret information related
with their leader. Recent approaches to leadership suggest that leadership is a
social process produced by the interaction of a variety of factors, like context,
tasks, histories, and the personal qualities of the leader and the followers (Graen
& Cashman, 1975). In other words, the followers’ perceptions and the leader’s
behaviours are both inputs and outputs of the leadership process (Lord & Smith,
1999).
Leadership perception can be based on two types of processes: inference-
based and recognition-based processes (Lord & Maher, 1991). Inference-based
processing involves making attributions for the leader’s characteristics based on
outcomes of salient events (Lord, 1985; Lord & Maher, 1991; Phillips & Lord,
1981). Rush, Phillips, and Lord (1981) showed that participants, who were told
that group performance was good, provided higher leadership ratings than those

16
who were told that performance was poor. Similarly, a leader is perceived to be
charismatic when the business is successful (Shamir, 1992). Business failures are
usually attributed to a lack of leadership of the executives, and moreover these
failures can detract from the executives’ perceived leadership qualities (Lord &
Maher, 1991).
Recognition-based processing, on the other hand, involves categorization
of the leader’s characteristics into relevant stereotypes process. Categorization
theory describes leadership perception as a two-stage matching process in which
relevant prototypes are activated, and then target stimulus configurations are
compared to the activated pattern (Lord, Foti, & De Vader, 1984). A prototype of
a leader is accessed from long-term memory when triggered by a stimulus in the
environment (Mischel, 1979). Firstly, a stimulus person is categorized as a leader
by the follower, then the follower activates his/her leader prototype and try to
attend, encode, and retrieve information consistent with his/her schema (Phillips
& Lord, 1981). Lord, Foti, and Philips (1982) found evidence that the observers
categorized leaders according to their similarity to a relevant leadership prototype
and then relied heavily on this categorization, or general leadership impression,
when recalling information or making judgments about these leaders.
Cronshaw and Lord (1987) investigated the effects of categorization and
attribution processes on the formation of leadership perceptions. The findings of
the study presented categorization as the primary process and suggested that
categorization could precede attributions. Encoding of prototypical and
antiprototypical stimulus information was found to be the predictor of leadership
perceptions. We can say that employees may rely on cognitive heuristics like
categorization in forming leadership impressions. When there is a good fit
between the leader’s characteristics and the abstract ideas of what leaders are, then
the leader is categorized into the relevant category (Lord & Maher, 1991), can be
perceived as more powerful and charismatic, and can be given more credit for
work outcomes (Lord, Foti, & De Vader, 1984). Studies conducted by Cronshaw
and Lord (1987) and Lord et al. (1984) indicated that categorization affects
perceptions of leaders and descriptions of their actual behaviour.

17
As stated by Lord, Brown, Harvey, and Hall (2001), both external
constraints, like culture and task characteristics, and internal constraints, like
followers’ values and goals (i.e., affect, self-schema, self-identity, etc.) would lead
to creation of leadership prototypes. Hall and Lord (1995) stated that affective
processing in leadership perceptions may lead to the rapid formation of a general
liking/disliking, and may produce an internal constraint on leadership perceptions.
Similarly, different self-schema of the followers may result in different leadership
perceptions of the followers, since self-schema are organized collections of
information about some aspect of the self. For example, followers with an
independent self-schema will be likely to include more participative leadership
expectations, whereas dependent followers will include more directive leadership
expectations (Lord et al., 2001). Moreover, as stated by Lord and his colleagues,
self-identity may lead to different perceptions in the followers. When a follower
has individual-level identities, leader traits would determine the leadership
perceptions; when the self is defined at the interpersonal level, role relations
would determine the perceptions of the followers; and when collective identities
are salient, traits that show an orientation toward the entire group would constrain
leadership perceptions.
What factors may affect the followers’ perceptions of leadership? Xin and
Pelled (2003) studied the relationship between supervisor–subordinate conflict
and perceptions of leadership behaviour. Both pure emotional conflict and mixed
conflict (a combination of emotional and task conflict) were found to have a
negative effect on perceptions of supervisors’ leadership behaviours, but pure
emotional conflict had stronger negative effect than mixed conflict. This finding
can be interpreted as relationships or emotions being more important than task-
relevant issues in the perceptions of leadership.
Leadership perceptions of the followers may demonstrate differences
depending on the very characteristics of their culture. In the next section, cultural
perspectives on leadership theory are reviewed together with specific findings on
Turkish culture.

18
2.2 Culture and Leadership
Culture has a primary role in leadership studies since it specifies what
behaviours are appropriate or inappropriate for leaders (Schein, 1992). It is
important to note that a significant body of theory and research on leadership has
been developed in North America or continental Europe (Aycan & Kanungo,
2000; Boyacıgiller, 2000; Sargut, 1996, 2001). Having completely different
historical, social, and economical conditions, it is difficult to claim that leadership
styles of the managers/leaders of any two countries would be the same. Similarly,
cultural groups may vary in their conceptions of the most important characteristics
of effective leadership. As such, different leadership prototypes would be
expected to emerge naturally in societies with differing cultural profiles (Bass,
1990; Hofstede 1993). In some cultures, one might need to take strong decisive
action in order to be seen as a leader, whereas in other cultures a democratic
approach may be required. About consideration and initiating structure
behaviours, there seems to be an agreement that effective leaders should display
both types of behaviours (e.g., Blake & Mouton, 1964); however, depending on
the specific characteristics of each culture, task- or people-oriented leadership
behaviours can be expected to be relatively more effective than the other. In the
following section, first cross-cultural studies on leadership styles or subordinate
perceptions of leader behaviours and then the studies on culture and leadership in
the Turkish context are presented.
Cross-cultural studies. When describing the leadership style of managers
of a country, comparative or cross-cultural studies are conducted in general. These
studies reveal the differences along with the similarities across/between cultures.
The most widely recognized culture dimensions are undoubtedly the ones
proposed by Hofstede (1980, 1991). Hofstede’s (1980) well-known original study
was conducted in more than 40 countries and the participants were IBM
employees in those countries. Hofstede suggested four global dimensions of
culture: individualism–collectivism; masculinity–femininity; uncertainty
avoidance; and power distance, and in later work, a fifth dimension (future

19
orientation) was added. Power distance is the extent to which a society accepts the
fact that power in institutions and organizations is distributed unequally. In
cultures with large differences in power between individuals, organizations will
typically have more layers and more hierarchy, and the chain of command is felt
to be more important. Uncertainty avoidance is defined as the degree to which
members in a society feel uncomfortable with, even threatened by, ambiguous and
uncertain situations, and take steps to avoid them.
The distinction between individualism and collectivism stems from to the
priority given to the person or to the group or collective.
Individualism pertains to societies in which the ties between individuals are loose: everyone is expected to look after himself or herself and his or her immediate family. Collectivism as its opposite pertains to societies in which people from birth onwards are integrated into strong, cohesive in-groups, which throughout people's lifetime continue to protect them in exchange for unquestioning loyalty (Hofstede, 1994, pp.51).
The fourth dimension is called masculinity versus femininity. According to
Hofstede (1980), masculinity implies dominant values in a society that stress
assertiveness and being tough, the acquisition of material things, not caring for
others, and the quality of life or people. In feminine cultures, values such as warm
social relationships, quality of life, and care of the weak are stressed.
A cross-cultural study called GLOBE (Global Leadership and
Organizational Behaviour Effectiveness) Research Program (House, Hanges,
Ruiz-Quintanilla, Dorfman, Javidan, Dickson, & 170 co-authors, 1999) was
conducted in order to investigate the cultural differences regarding leadership.
GLOBE was a long-term, multiphase, and multimethod project directed toward
the development of systematic knowledge concerning how societal and
organizational cultures affect leadership and organizational practices. Over 150
researchers from 61 countries, including Turkey, from all major regions of the
world have participated in this project. The dimensions assessed in the GLOBE
Project are: power distance, uncertainty avoidance, in-group collectivism,
institutional collectivism, gender egalitarianism, assertiveness, humane
orientation, performance orientation, and future orientation. For each of the nine

20
dimensions, items were developed at two levels: societal and organizational. In
addition, for all dimensions two measures were used, one tapping the institutional
practices (as it is), and the other tapping the values (should be). The leadership
questionnaire items of the GLOBE study consisted of 112 behavioural and
attribute descriptors that were hypothesized to either facilitate or impede
outstanding leadership. Responses from 17,000 middle managers of
approximately 825 organizations in 62 nations were obtained. Those nations were
grouped into clusters which shared historical, geographical, or religious
commonalities: South Asia, Anglo, Arabic, Germanic Europe, Eastern Europe,
and Latin Europe.
As part of the GLOBE Project, culturally endorsed implicit theories of
leadership (CLTs) were investigated in the study of Hartog, House, Hanges, Ruiz-
Quintanilla, Dorfman, and associates (1999). The results suggested that specific
aspects of charismatic/transformational leadership were strongly and universally
endorsed across cultures. More specifically, charismatic/transformational, team
oriented, and participative leadership dimensions were found to be prototypical
for outstanding leadership in all cultures. In the Turkish sample, prototypical
leadership dimensions were listed from the most prototypical to the least
prototypical as follows: team-oriented, charismatic/transformational, participative,
humane, autonomous, and self-protective (only the autonomous and self-
protective dimensions had a mean below 4 on a 7-point scale). Additionally,
universally endorsed attributes for charismatic leadership included motive
arouser, foresight, encouraging, communicative, trustworthy, dynamic, positive,
confidence builder, and motivational. Culturally contingent charismatic attributes
were enthusiastic, risk taking, ambitious, self-effacing, unique, self-sacrificial,
sincere, sensitive, compassionate, and willful. Dorfman and associates (1997)
compared leadership in Western and Asian countries. They reported cultural
universality for supportive, contingent reward, and charismatic leader behaviours,
and cultural specificity for directive, participative, and contingent punishment
leader behaviours.
Jung and Avolio (1999) found that subordinates from Eastern cultures
were more responsive to transformational leadership than subordinates from

21
Western cultures, who performed better under transactional leaders. Similarly,
Jung, Bass, and Sosik (1995) argued that transformational leadership emerged
more easily and was more effective in collectivistic cultures than in individualistic
cultures.
Brodbeck et al. (2000) investigated leadership prototypes in 22 European
countries including Turkey (a European subsample of GLOBE) and found that the
leadership prototypes were culturally endorsed. Of the 21 leadership
prototypicality scales (i.e., autocratic, procedural, inspirational, team
collaborative, decisive, diplomatic, modesty, face saving, humane orientation,
autonomous, integrity, performance orientation, administrative, self-centered,
status conscious, visionary, malevolent, participative, conflict inducer, team
integrator, and self sacrificial), team integrator, decisive, visionary, integrity,
inspirational, administrative, diplomatic, team collaborative, and performance
orientation were found to be facilitating outstanding leadership, while self-
centered and malevolent were found to impede outstanding leadership in the
Turkish sample. The results suggested that Turkish subordinates had preference
for team-focused, decisive, performance-oriented, and non self-centred leadership
attributes.
In a cross-cultural study, Ensari and Murphy (2003) examined the
interactive effects of the categorization and attribution processes of leadership
perceptions on attributions of charisma with participants from a collectivistic
culture (Turkey) and an individualistic culture (United States). In this study,
participants were given vignettes including prototypical and antiprototypical
leader descriptions. Prototypical leader behaviours for collectivist culture were
presented in the following sentences: “He/She explains what the goal of the group
should be,” “He/She assigns specific tasks to the group members,” “He/She asks
his subordinates to work harder,” “He/She talks to his subordinates frequently.”
Antiprototypical leader behaviours for collectivist culture were presented as
follows: “He/She lets everyone work at their own pace,” “He/She usually requests
his subordinates’ approval on issues at hand,” “He/She admits it when he makes a
mistake,” “He/She usually lets his subordinates decide what to do.” Prototypical
leader behaviours for individualistic culture were presented with the following

22
statements: “He/She (the leader) exercises great influence on his subordinates,”
“He/She wants his own way on issues at hand,” “He/She asks his subordinates to
work harder,” and “He/She talks to his subordinates frequently.” Antiprototypical
leader behaviours for individualistic culture were as follows: “He/She tends not to
change established and comfortable practices of his workgroup,” “He/She usually
requests his subordinates’ approval on issues at hand,” “He/She admits it when he
makes a mistake,” and “He/She usually lets his subordinates decide what to do.”
The results of the study showed that the co-occurrence of the
categorization and attribution processes produced optimal attribution of charisma
to the leader. Moreover, leadership perceptions of the followers were moderated
by the culture: the leaders’ prototypical characteristics were more effective in
forming a leadership impression in an individualistic culture, whereas
collectivistic people made attributions based on the inferences about the success
or the performance of their leaders.
A different perspective to cultural approaches to leadership was brought
along by House, Wright, and Aditya (1997). They found that slight deviations of
leader behaviour from dominant cultural values would encourage innovation and
performance improvement because of being non-traditional and unexpected. In
other words, when the leader’s behaviour was somewhat different from the
commonly accepted behaviour styles, this would encourage growth and
development, as long as the deviation from the norms was not disruptive. Parallel
to those findings of House and his colleagues, Conger and Kanungo (1987)
argued that unconventional behaviour by the leader was an important component
of charismatic leadership.
Cross-cultural studies have been criticized for being based on Western
cultural values in investigating the cultural differences (e.g., Ralston, Gustafson,
Cheung, & Terpstra, 1993; Ralston, Gustafson, Elsass, Cheung, & Terpstra,
1992). However, there are also studies examining leadership across cultures
without using the Western-based instruments. Ralston et al. (1992) assessed the
differences and similarities in values among managers in the U.S., Hong Kong,
and China by using an instrument based on Eastern cultural values. According to
the findings, integration (being in harmony), Confucian work dynamism (social

23
hierarchy, protecting status quo), and human heartedness (felt need to be
kind/people-oriented), but not moral discipline (personal control) discriminated
among the three cultures.
In a recent article by Tsui, Wang, Xin, Zhang, and Fu (2004), CEO
leadership behaviours in the Chinese transitional economy were studied. They
identified six behavioural dimensions of leaders (i.e., articulating vision,
monitoring operations, being creative and risk taking, relating and
communicating, showing benevolence, and being authoritative) and four
leadership styles that represented different combinations of the six behavioural
dimensions (i.e., advanced leadership, authoritative leadership, progressing
leadership, and invisible leadership). According to the authors, behavioural
dimensions shared some similarities with Western cultures, but the people-related
dimensions reflected some Chinese cultural roots. It was claimed that many
Chinese leaders experimented with different approaches to management, leading
to the emergence of different leadership styles. That interpretation was explained
with a quotation from Deng Xiao- Ping (Tsui et al., 2004, pp.17), “Black cat,
white cat, any cat that catches mice is a good cat.”
2.3. Leadership in the Turkish Context
Turkey has very unique characteristics stemming from her geographically
being the motherland of several different civilizations throughout the history,
being established over the trashes of Ottoman Empire, having an unconventional
Muslim majority culture origins, struggling for sustaining a secular state with
parliamentarian democracy, trying to realize the course of Westernization (or
modernization) for more than two centuries, and still having an economy based
more on agriculture than industry (Imamoğlu & Karakitapoğlu-Aygün, 2002;
Sargut, 2001).
Among the 40 countries included in the original Hofstede (1980) study,
Turkey was found to have a hierarchic, moderately feminine culture with low
individualism and a relatively low threshold for ambiguity. Implications of these
cultural dimensions for leadership were also suggested in that study. According to

24
Hofstede (1980), managers in countries characterized by high individualism,
cultural autonomy, egalitarianism, and low power distance tended to favour more
participative sources of guidance. However, managers in cultures characterized by
collectivism, cultural embeddedness, hierarchy, power distance, and mastery
tended toward a reliance on supervisors and rules.
Sargut (2001) demonstrated several facets of Turkish culture and claimed
the presence of feminine values, vertical collectivism [defined by Triandis (2001,
pp. 910) as “culture where people submit to the authorities of the in-group and are
willing to sacrifice themselves for their in-group”], high power distance, and
uncertainty avoidance. He suggested that attempts for decreasing uncertainty
would lead to increased power distance, and consecutively, attempts to smooth the
effects of high power distance would lead to increased people-oriented leadership
behaviours. In the distinction between broad contextual (indirect, emotional
communication - collectivist) and narrow contextual (direct, concise
communication - individualist) cultures, Turkey was considered to be a broad
contextual culture, meaning that communication is itself is taken as an objective
instead of a tool (Sargut, 2001). Moreover, followers seek for kindness and
compassion together with some guidance from their leaders, and avoid conflicts
with them.
Research conducted with Turkish participants in conflict management
provided important findings in terms of cultural characteristics and also
managerial behaviours: Turkish people were found to have a preference for
avoiding in conflicts with coworkers (Kozan, 1989); compared to U.S. subjects,
they had higher preference for third party involvement in managing conflicts than
for direct contact (Kozan & Ergin, 1998). Avoidance from conflict and also direct
contact with the other party, together with a preference for a third party help in
conflict management, could well be nourished by the collectivism and tolerance
for ambiguity characterizing Turkish culture, as suggested by Kozan and Ergin
(1998). That is, not being able to tolerate ambiguity may result in lack of conflict
management skills and also avoidance from conflict situations. Similarly, possible
uncertainties in direct contact and fear of being rejected by the other party in the
conflict situation may be stemming from the tendency of uncertainty avoidance.

25
Presence of a third party intervention may provide sustainability of the good
relationships in the group, community, or collective, and fulfill the desire for
harmony.
Regarding the role of the manager in conflict management, Kozan and İlter
(1994) found that Turkish managers relied more on their authority when they
confronted conflict with their subordinates or other managers, while they avoided
such an autocratic style when they were in a third party role. Therefore, it can be
claimed that Turkish managers are likely to exhibit authoritarian behaviours in
conflicts in which they are one of the parties. Additionally, they may undertake a
negotiator’s role, by staying neutral and mediating. Kozan and İlter explained this
with managers’ perception of conflict as a threat for their authority when they
were one of the two parties of the conflict, contrary to the situation in which
manager are in a third party role, which can actually bring them personal prestige.
Sargut and Özen (2000) investigated the expectancies of Turkish
employees about leader behaviours and found that majority of employees gave
more importance to the process rather than the result when they were performing a
task. Moreover, they had a greater expectation for maintenance from leaders
rather than indifference, and this resulted in preference for attention, protection,
and paternal attitudes of the leaders. The authors concluded that despite the
observed preference of employees for process and maintenance, there was also a
low but important tendency of employees in favour of result and indifference,
which was generally observed in individualistic cultures. This situation was
explained by the effects of modernization displayed as a shift from a collectivist
orientation to an individualistic one. On the other hand, Sargut (2001) stated that
every society would follow different pathways in their struggle for
industrialization and modernization; therefore, at the end of modernization
process all societies would not necessarily resemble each other.
Kabasakal and Bodur (2002) focused on the GLOBE’s Arabic cluster
consisting of five countries in the Middle East (Egypt, Morocco, Turkey, Kuwait,
and Qatar) with historical, economical, religious, and socio-cultural
commonalities. They found that these societies were low in future orientation, but
highly group-oriented (collectivism), hierarchical (power distance), and that team-

26
oriented and charismatic attributes were presented as characteristics of
outstanding leadership. Additionally, the leadership attributes listed from the most
preferred to the least were as follows: team-oriented, charismatic, participative,
humane, autonomous, and self-protected. Similarly, Aycan and Pasa (2003)
suggested that charismatic leadership was found to be the most preferred style by
Turkish university students followed by participative, paternalistic, and
bureaucratic styles.
Aycan et al. (2000) investigated and compared the impact of culture on
human resource management practices in 10 countries including Turkey. Four
socio-cultural dimensions (i.e., power distance, paternalism, loyalty towards
community, and fatalism), five internal work culture dimensions (i.e.,
malleability, proactivity, obligation towards others, responsibility seeking, and
participation), and three human resource management practices (i.e., job
enrichment, supervision, and reward allocation) were examined. Turkey was
among the highest scorers on paternalism, power distance, and loyalty towards
community dimensions, and among the lowest scorers on fatalism dimension. The
results revealed that managers who did not characterized their socio-cultural
environment as fatalistic assumed that their subordinates were malleable and they
provided empowering supervision, job enrichment, or rewards to their employees.
Managers who valued loyalty assumed that their subordinates should carry out
their obligations towards others, and they provided empowering supervision.
Lastly, managers who perceived paternalism and high power distance in their
socio-cultural environment assumed that their employees were reactive, and they
did not provide empowering supervision and job enrichment. Moreover, high
paternalism predicted more obligation towards others and fostered employee
participation; proactivity and obligation towards others led to empowering
supervision. Additionally, performance-reward contingency was positively
influenced by responsibility seeking, malleability, and proactivity.
In the Turkish context, dimensions of paternalism, respect to the authority,
and loyalty to the group and group members together suggest a cultural
environment highly depending on relationships (Aycan et al., 2000; Kabasakal &
Bodur, 2002). Communication or relationship is not a tool but a goal for the

27
individuals (Sargut, 2001). Therefore, hierarchy can be expected to be a very
important element of the culture, and authorities can have unquestionable
legitimate power with them. Besides, loyalty and considerate relationships can be
considered as among the other elements of the culture with respect to the
collectivist characteristics of the culture.
2.4. Implications and Hypotheses
Cross cultural literature (e.g., Aycan & Kanungo, 2000; Pasa, 2000;
Hofstede, 1980; House et al., 1999, 2002; Wasti, Bergman, Glomb, & Drasgow,
2000; Sargut & Özen, 2000) suggests that Turkish culture is a collectivist and
paternalist one, with great power distance and a relatively little tolerance for
ambiguity. Of these dimensions, the most controversial one is the collectivism
dimension. Yet, it was claimed by several researchers that Turkish culture can not
be considered either individualistic or collectivistic (Göregenli, 1995, 1997;
Imamoglu, 1998; Kagitcibasi, 1990, 1994). Moreover, Triandis (1988, 1995)
claimed that individualism and collectivism are not two different dimensions, but
the two ends of a single dimension. Indeed, he claimed that one could also think
individualism as ice, and collectivism as water, since cultures are similar to lakes
containing bits of floating ice. He added that “as cultures become modern,
complex, and dynamic …, they become more individualistic” (Triandis, 1995, pp.
16).
At this point it is important to discuss the transitions or developments
currently taking place in Turkey. As cited by Kağıtçıbaşı (1994), Turkey has
experienced dramatic socioeconomic changes like the decrease of the population
living in rural areas from 80 % to 40 % since 1950. Even at the present date,
continuous attempts for becoming a member of the European Union bring Turkey
to the centre of modernization movement. Turkey is believed to be passing
through a transition period; and naturally, the cultural characteristics of the
society are also changing (Aycan & Pasa, 2003; Imamoğlu & Karakitapoğlu-
Aygün, 1999; Göregenli, 1997). Imamoğlu and Karakitapoğlu-Aygün examined
the changes in values and priorities of Turkish university students from the 1970s

28
to the 1990s and showed that there was a trend to attribute more importance to
individualistic values in the 1990s. Besides, human relations were still found to be
highly emphasized in the Turkish society when compared to Sweeden (İmamoğlu,
Küller, İmamoğlu, & Küller, 1993).
As suggested by Sargut (2001), Turkey, like every other country, has her
own dynamics in the road to modernization stemming from the specific
characteristics of the country and her history and culture. Relatively high power
distance, an emphasis on hierarchy, and uncertainty avoidance bring together an
unquestionable authority of superiors. Yet, paternalistic and moderately feminine
characteristics of the culture require close relations and communication with
subordinates. Based on the reviewed literature, leadership style of Turkish
managers can be expected to be more people-oriented than task-oriented. Hence,
Hypothesis 1a. Self-reported leadership style of Turkish middle level managers is more likely to be people-oriented than task-oriented.
Parallel to the observed cultural characteristics, employees can also be
expected to have a preference for people-oriented behaviours rather than task-
oriented behaviours in the leaders. Yet, it may be rather harder to fulfil their
relatively higher relationship needs. Hence, they may tend to perceive their
leaders as being higher on task-orientation than people-orientation. Thus,
Hypothesis 1b. As perceived by the incumbents, leadership style of Turkish middle level managers is more likely to be task-oriented than people-oriented.
According to leadership categorization theory, subordinates have their own
schemas/prototypes about leadership, and they use these labels when perceiving
and interpreting their leader’s behaviours (Cronshaw & Lord, 1987). Cultural
characteristics affect the formation of those schemas/prototypes through the
expectancies and values of the subordinates.
Similar to the leadership styles of Turkish managers, Turkish subordinates
will also have preference for people-oriented, supportive behaviours from their
managers, resulting from the very characteristics of the culture. Pasa (2000)

29
revealed parallel findings in her investigation of the leadership characteristics in
Turkey. The desired leadership characteristics identified were being proactive,
just, well-informed, visionary, planned, having good relationships with people,
being loved by people, participating for the leaders, and having good relationships
with people, being well-informed, humane, and just, for the subordinates. The
scores of the leaders and subordinates differed much for team-oriented (higher in
leaders) and hierarchic and task-oriented (higher in subordinates) behaviours,
meaning that subordinates perceived their leaders as more hierarchic and task-
oriented, and less team-oriented than did the leaders saw themselves. The findings
may be interpreted as suggesting that Turkish subordinates favour less hierarchic
and less task-oriented leader behaviours. Also, subordinates preferred more
supportive leaders with better communication skills and warmer relationships
with them, which could only be provided through people-oriented behaviours of
the leaders. Therefore, the leadership prototypes of Turkish employees can be
expected to develop around protective, supportive, and people-oriented
behaviours.
Hypothesis 2. Ideal leadership prototype of job incumbents is more likely to be people-oriented than task-oriented.
There have been significant positive correlations between leadership style
and job satisfaction, organizational commitment, and evaluations of the leader's
competence, as claimed by Skogstad and Einarsen (1999). Although leadership
style, in itself affects work outcomes, the perceptions of leadership style could be
expected to have a similar or even a greater influence. Also, it is important to have
a match or congruence between the actual and ideal leadership styles of the
manager as perceived by the subordinates, and a match or congruence between the
self-reported leadership style of managers and subordinates’ perceptions
concerning the leadership styles of their managers.
According to the Leadership Categorization Theory (Lord & Maher,
1991), if there is a match between the leader behaviours demonstrated by the
manager and the leadership concept of the subordinate, the subordinate will accept
his/her leader as a leader. Managers who display congruent/same behaviours with
30
the prototypes of the employees would be recognized as (effective/successful)
leaders by their employees. They then would have more legitimate social power,
would more easily influence their subordinates, and their leadership style would
be perceived more positively. If the leadership prototype of the subordinates
matches with the actual behaviours of the leader as perceived by the subordinates,
then subordinates can be expected to display better performance, be more
satisfied, and committed to his/her organization. It is expected that congruence
between actual and ideal leadership styles of managers as reported by
subordinates will have an effect on several work outcomes, since congruence
presents a desirable situation for the employees, by commonsense. To summarize,
the smaller the difference between the actual and the ideal manager perceptions
for the employees, the more satisfied, committed, and better performer will be the
employees.
Hypothesis 3a. Congruence between subordinate perception of leader’s style and subordinate prototype of leadership leads to higher subordinate task and contextual performance. Hypothesis 3b. Congruence between subordinate perception of leader’s style and subordinate prototype of leadership leads to higher subordinate satisfaction. Hypothesis 3c. Congruence between subordinate perception of leader’s style and subordinate prototype of leadership leads to higher commitment levels in subordinates. To summarize, in Hypothesis 3 it was hypothesized that the difference
between actual and ideal leader perceptions of the subordinates had a significant
effect on subordinate performance, satisfaction, and commitment levels. Smaller
difference between actual leader perceptions and ideal leader prototype of the
subordinates was expected to lead to more desirable outcomes. In addition, the
effects of the difference between managers’ self-reported leadership styles and
subordinates’ perceptions of their managers’ leadership style on work outcomes
were also investigated for mainly exploratory purposes.

31
CHAPTER III
METHOD
This study investigated the leadership styles of Turkish middle level
managers as perceived by the employees and managers themselves, ideal manager
image of employees along with the effects of congruence between ideal and actual
leadership styles on important organizational outcomes. In this chapter, sample
characteristics, measures used, procedure followed, and the analyses conducted
are presented.
3.1 Sample
A total of 28 companies from different sectors and different geographical
locations were contacted and informed about the study. Out of the total number
contacted, 21 responded positively to the request. Of these companies five were in
hotels, one in construction, two in textile, two in cement production, one in
mining, one in packaging and paper, three in food, two in electric-electronics, two
in chemistry, one in aerospace, and one in manufacturing industries.
From a total of 784 questionnaires (203 managers and 581 subordinates);
320 questionnaires (71 managers and 249 subordinates) returned, with a response
rate of 40.8% (35% for managers and 42.9% for subordinates). Resulting from the
specific design of the study, the questionnaires of managers and subordinates were
matched. That is, leadership style of a given manager was investigated by using
two sources: manager himself/herself and his/her subordinates. A total of four
ratings were obtained from those two sources: Self-evaluations of managers,
subordinate evaluations as perceived by managers, subordinate evaluations of
32
their current managers, and lastly subordinate evaluations of ideal managers.
Subordinate ratings on leadership style of their actual and ideal managers were
aggregated for every specific manager, in the manager data set.
Six questionnaires from managers and 15 questionnaires from
subordinates were excluded from analyses since they had not been paired. The
final sample of the study consisted of 65 middle level managers and 324
subordinates.
Eighty six percent of the managers were male and 14% were female; the
majority (78.2) of the managers were between 31 and 50 years old range.
Concerning the educational levels of managers, 75% of them had a 4 year college
degree or above. Sixty five percent of the managers had less than 10 years of
tenure in their current company and 57% of the managers had less than 10 years
of overall tenure.
Seventy two percent of the employees were male and 28% were female,
the majority (80.7) of the employees were between 20 and 40 years old range.
Majority of the employees were university graduates (42.2%), but the next
greatest group was the high school graduates (36.9%). Approximately half of the
employees (55.2%) had less than 5 years of experience in their current companies,
the majority (77.1%) had two to 10 years of tenure in general, and lastly, 84.2% of
the employees were working with their current managers for five years or less.
3.2 Measures
There were two different questionnaire packages one for managers and one
for subordinates printed as booklets, differentiated with the colour of the cover
pages, grey and yellow, respectively. Contents of these two packages are
summarized in Table 3.1. In both packages, a brief explanation of the study was
given to participants (Appendix A). Last section of both packages was consisting
of demographic information (Appendix J and K, for subordinate and manager
questionnaires, respectively).

33
3.2.1 Measurement of Leadership Styles
Leadership styles of managers were basically investigated in terms of task-
and people-orientation. Transformational, transactional, and instrumental
leadership styles scales were also added to the questionnaire for mainly
exploratory purposes. The same scales were used in the manager and incumbent
packages, however, the subjects/possessive pronouns of the items were changed
depending on the party making the evaluation. For example, employees evaluated
their actual and ideal managers with items such as “My manager does personal
favours for people in the work group.” On the other hand, managers evaluated
their own leadership styles with items such as “I do personal favour for people in
the work group.” Additionally, all items in the scales used for measuring
leadership style were presented in a mixed order. Furthermore, the order of the
two scales measuring leadership styles (i.e., actual and ideal manager evaluations
for employees, and self-evaluation and self-perception as seen by subordinates for
managers) in each of the questionnaires was changed. Mean scores of the relevant
scales, (i.e., task-orientation, people-orientation, transformational, transactional,
and transformational leadership) were used to represent leadership style scores.
Subordinates’ ratings on actual and ideal manager were aggregated by taking
average scores of all the ratings done for every manager, separately. Also,
managers’ self-ratings regarding their own leadership style and also their
leadership style were placed in their subordinates, separately.
Task Orientation and People Orientation: Leadership Opinion
Questionnaire (LOQ) of Fleishman (1953) was used to measure the leadership
orientation of the managers. The LOQ consists of 40 items (20 items measuring
task-oriented behaviours and 20 items measuring people-oriented behaviours).
The ratings are done on a five-point Likert-type scale (“1” for “Never”, “2”” for
“Seldom”, “3” for “Sometimes”, “4” for “Frequently”, and “5” for “Always”).
Alpha coefficients of the LOQ for people-orientation were found to be .70 and .89
for foremen and workers, respectively, and .79 and .88 for foremen and workers,
respectively, for task-orientation (Fleishman, 1953). The questionnaire was

34
translated into Turkish by Bilgiç and Sümer in an unpublished work. In the
present study, alpha coefficients were found to be ranging from .80 to .84 for task-
orientation in subordinate ratings, and ranging from .73 to .74 in manager ratings.
For people-orientation, alpha coefficients ranging from .80 to .83 in subordinate
ratings and from to .72 to .76 in manager ratings. Task- and People-Orientation
scales are displayed in Appendix B and C, respectively.
Table 3.1. Scales/Measures used in Manager and Incumbent Questionnaires
Manager Questionnaire Incumbent Questionnaire
Scales measuring leadership style of the manager as perceived by himself/herself 1
Task-oriented leadership People-oriented leadership Transformational leadership* Transactional leadership* Instrumental leadership*
Scales measuring leadership style of the actual manager 1
Task-oriented leadership People-oriented leadership Transformational leadership* Transactional leadership* Instrumental leadership*
Job satisfaction measure
Job satisfaction measure
Organizational commitment measure Affective commitment Continuance commitment Normative commitment
Scales measuring manager’s own perception of his/her leadership style as seen by the subordinates 1
Task-oriented leadership People-oriented leadership Transformational leadership* Transactional leadership*
Performance ratings of subordinates Task performance Contextual performance General performance Instrumental leadership*
Scales measuring leadership style of ideal manager 1
Task-oriented leadership People-oriented leadership Transformational leadership* Transactional leadership* Instrumental leadership*
Demographic info Name Sex Age Education Occupation Company Department Number of people work under his/her direct supervision Tenure in the company Tenure in general
Self-rated performance measure* Task performance Contextual performance General performance
Demographic info
Name Sex Age Education Occupation Company Department Tenure in the company Tenure with the current manager Tenure in general
Note. 1 The order of these two scales was changed. * Included for exploratory purposes only.

35
Transformational, Transactional, and Instrumental Leadership:
Leadership Practices Inventory (LPI) was used to measure transformational and
transactional leadership styles (Posner & Kouzes, 1988). Transformational
leadership is measured with 18 items, whereas transactional leadership is
measured by 12 items, using a rating on a five-point Likert-type scale (“1” for
“Never”, “2”” for “Seldom”, “3” for “Sometimes”, “4” for “Frequently”, and “5”
for “Always”). Instrumental leadership was measured using Antonakis’s (2004)
measure with 16 items rated on a five-point Likert-type scale (“1” for “Never”,
“2”” for “Seldom”, “3” for “Sometimes”, “4” for “Frequently”, and “5” for
“Always”). Alpha coefficients were found to be .81 and .89 for transformational
leadership, in self-evaluations and multiple observer evaluations, respectively; .81
and .90 for transactional leadership in self-evaluations and multiple observer
evaluations, respectively. This inventory was translated into Turkish and its
reliability was established by Ergin and Kozan (2004), with alpha coefficients of
.82 for transformational and .80 for transactional leadership. Alpha coefficients of
.87 for instrumental leadership (Antonakis, 2004). The questions of these scales
are presented in Appendix D, E, and F, respectively.
3.2.2 Measurement of Job Satisfaction
Minnesota Satisfaction Questionnaire (MSQ), developed by Weiss, Dawis,
England, and Lofquist (1967) was used to measure job satisfaction. The
instrument consists of 20 items each of which measure a different aspect of job
satisfaction. Respondents are required to rate each item based on the extent to
which the respondent is satisfied with that aspect of the job (satisfaction
associated with the task and non-task characteristics of the job and the overall job
satisfaction level) on a five-point Likert-type scale (“1” for “very dissatisfied”,
“2” for “dissatisfied”, “3” for “neutral”, “4” for “satisfied”, and “5” for “very
satisfied”). Mean score of the items were calculated for the evaluation of job
satisfaction. Reliability coefficients for MSQ ranged from .87 to .92 (Weiss et al.,
1967). Bilgiç (1998) adapted the questionnaire to Turkish culture, reported alpha

36
coefficients as above .80. In this study, alpha coefficients were .92 for employee
data and .89 for manager data. Job satisfaction items are given in Appendix G.
3.2.3 Measurement of Organizational Commitment
Subordinate organizational commitment level was measured in three
dimensions: affective, continuance, and normative commitment. The
questionnaire used in this study was developed by Meyer, Allen, and Smith
(1993) and translated into Turkish by Wasti (1999). A total of 33 items are
included in this measure (9 for affective commitment; 10 for continuance
commitment, and 14 for normative commitment). Respondents are required to rate
each item based on their degree of agreement on a five-point Likert-type scale
(“1” for “strongly disagree”, “2” for “disagree”, “3” for “neither agree nor
disagree”, “4” for “agree”, and “5” for “strongly agree”). Mean scores of the three
dimensions of organizational commitment were used in the analyses. The internal
reliability coefficients of the continuance, and normative commitment scales were
reported to be .84, .82, and .70, respectively (Wasti, 2003). Results of reliability
analyses in this study revealed alpha coefficients of .86 for affective, .81 for
continuance, .89 for normative, and .92 for overall organizational commitment.
Organizational commitment scale is presented in Appendix H.
3.2.4 Measurement of Performance
Performance of managers and subordinates were measured in three
dimensions: task performance, contextual performance, and general performance.
For task performance, five items were developed by the author, which were
related with the job duties, quality of the job done, efficiency in using time, and
job-related knowledge. Contextual performance is measured with five items by
using the definitions made by Borman and Motowidlo (1993) as the framework
(showing extra effort and desire, voluntary action, collaboration, obeying
procedures, and following the organizational targets). For overall/general
performance, one item was developed, directly asking about general performance

37
level of the manager/subordinate. The rating was done using a five-point
frequency scale (“1” for “never”, “2” for “seldom”, “3” for “sometimes”, “4” for
“frequently”, and “5” for “always”). Mean scores of the relevant items were used
in measuring task performance and contextual performance, and mean of all 11
items were used as a measure of general performance. In this study, alpha
coefficients of supervisory-rated task, contextual, and general performance were
.49, .51, and .75, respectively. All performance items are given in Appendix I.
3.3 Procedure
Firstly, Human Resources or Personnel Departments of the companies
were contacted by phone and with a brief explanation of the study, appointments
were requested. With the companies expressing a positive interest toward the
study, the author herself arranged meetings with the heads of Human Resources or
Personnel Departments of those companies, explained the aim of the study, and
left a number of questionnaires with them. In some of the companies, the author
had the opportunity to meet the participants individually (explained the purpose of
the study and the way they needed to fill out the questionnaires) and collected the
questionnaires back from the participants themselves. In some companies,
questionnaires were collected by the contact persons and sent to the author by
mail.
Personal identification information was collected from the participants
together with the demographic information because of the purpose of matching
the manager and subordinate data sets.
3.4 Analyses
In order to find the leadership styles of Turkish middle-level managers as
perceived by themselves and their subordinates (Hypotheses 1a and 1b); mean
task- and people-orientation scores were compared against each other using
dependent t-tests. Similarly, ideal leader prototype of the subordinates
(Hypothesis 2) was directly tested by comparing mean ideal manager task- and

38
people-orientation scores against each other with a dependent t-test. Additionally,
as an indirect test of Hypotheses 1a, 1b, and 2, 2 x 2 repeated measures ANOVA
(actual and ideal manager versus people-orientation and task-orientation) were
conducted to be able to investigate complex interactions.
In testing hypotheses 3a, 3b, and 3c (Congruence between subordinate
perception of leader’s style and subordinate prototype of leadership leads to
higher subordinate performance, satisfaction, and organizational commitment),
congruence scores were calculated at the first step. There are three possible ways
to calculate the congruence between two perceptions: correlations, polynomial
regression, and difference scores (Kristof-Brown, Zimmerman, & Johnson, 2005).
a. Correlation: In this method of congruence, two scores are compared by
computing the correlation between them. Specifically, correlation between actual
and ideal manager perceptions of employees would be taken as an index of
congruence if this method was employed. Greater correlation would indicate a
greater congruence between the two scores. Westerman and Cyr (2004) used this
method to investigate different congruences, and came up with the result that it
was a “flawed measure of congruence” as Edwards (1994) suggested. Edwards
criticized correlation method since it yielded low reliability and inability of
explaining additional variance.
b. Polynomial regression: Edwards (1993; 1994) suggested using
polynomial regression for measuring individual effects of the relevant scores and
their congruence. In this method, instead of reducing two scores of comparison
into one congruence score, both the scores (X and Y) and associated higher-order
terms (X2, X x Y, and Y2) are used as the predictors (Kristof-Brown et al., 2005).
Edwards found that in this method, the proportion of variance explained in the
dependent variable is increased when compared to the other two methods and this
method provided a more precise way of examining the influence of congruence/fit
and incongruence/misfit (1993; 1994).

39
c. Difference scores: In this method, the difference between two different
ratings was calculated using either algebraic (X – Y), absolute (IX–YI), or squared
differences (X –Y)2 (Kristof, 1996). In algebraic difference, positive and negative
differences are distinguished; in absolute value of difference, equal weight is
assigned to differences regardless of the direction. When the differences are
squared, the difference is not directional and also larger differences have greater
weights.
Difference score calculation was criticized by Edwards (1993; 1994) on
several grounds. According to Edwards, the effects of positive and negative
differences are different; when two scores are obtained from the same individuals,
the reliability of difference score is reduced, and that difference scores often fail
to explain outcome variance beyond the one explained by component measures
individually.
In order not to be effected by the direction of difference and also to make
greater use of larger differences, squared differences was used in this study. Two
different congruences (actually incongruence) were calculated: Incongruence of
actual and ideal manager perceptions on task-orientation, and incongruence of
actual and ideal manager perceptions on people-orientation. For exploratory
purposes, two other incongruences were also computed: Incongruence of manager
perceptions of what subordinates think of his/her leadership style and manager’s
self-evaluation of his/her leadership style on task-orientation, and incongruence of
manager perceptions of what subordinates think of his/her leadership style and
manager’s self-evaluation of his/her leadership style on people-orientation.
Multiple regression analyses were carried out for testing hypotheses 3a,
3b, and 3c, with SPSS 11.5. In these multiple regression analyses, each outcome
variable was regressed on incongruence scores, after controlling for some critical
variables.

40
CHAPTER IV
ANALYSIS
The purpose of the present study was to test the hypotheses regarding the
leadership behaviours of Turkish middle level managers, ideal leadership
prototypes of the employees, and the effects of congruence/incongruence between
actual and ideal leadership perceptions of the employees. In the following
sections, first sample characteristics are presented. Second, results of exploratory
and confirmatory factor analyses are given. Descriptive statistics concerning the
variables of interest are presented next. And finally, findings related to the
analyses concerning the test of the hypotheses are presented.
4.1 Sample Characteristics
Demographic information concerning the participants of the study is
summarized in Table 4.1. Majority of both the manager (86 %) and subordinate
(71 %) participants of this study were male. As expected, in general, managers
were older (Mean = 39.31 years) and more educated than their subordinates
(Mean = 33.8 years). While 46 % of the managers were between 31 to 40 years
old, majority of the subordinate participants were between 20 to 30 years old (46
%). There were no primary or secondary school graduates among the managers,
and majority of the managers were with a 4-year college degree (62 %). Majority
of the subordinates had either a 4-year college degree (42 %) or a high school
degree (37 %). Majority of the subordinate participants had worked with their
managers not more than 5 years (84.2%), and nearly half of them (46%) had a
work period of 1 year or less with their current managers. Managers had a longer

41
experience in their current companies than their subordinates (8.4 vs. 6.5 years,
respectively).
Table 4.1. Descriptives for Participants
Manager (N = 65) Subordinate (N = 234) Variable
Frequency % Frequency %
Gender Male 56 86.2 165 71.7 Female 9 13.8 65 28.3 Age 20-30 8 12.5 104 46.6 31-40 30 46.9 76 34.1 41-50 20 31.3 32 14.3 Above 51 6 9.4 11 4.9 Mean = 39.3 SD = .35 Mean = 33.8 SD = 8.38 Education (range between 0 and 6) Primary School - - 5 2.2 Secondary School - - 5 2.2 High School 10 15.6 83 36.9 2-year College 6 9.4 28 12.4 4-year College 40 62.5 95 42.2 Master’s Degree 7 10.9 9 4 Doctoral Degree 1 1.6 - - Tenure in the company 0-1 year 6 10.3 41 19.5 2-5 years 17 29.3 75 35.7 6-10 years 15 25.9 46 21.9 11-15 years 7 12.1 18 8.6 16-20 years 10 17.2 22 10.5 More than 21 years 3 5.2 8 3.8 Mean = 8.44 SD = 6.67 Mean = 6.5 SD = 6.26 Tenure in general* 0-1 year 7 11.1 1 0.5 2-5 years 15 23.8 35 16 6-10 years 21 33.3 74 33.8 11-15 years 5 7.9 45 20.5 16-20 years 12 19 29 13.2 More than 21 years 3 4.8 35 16 Mean = 9.29 SD = 6.74 Mean = 12.6 SD = 8.05 Tenure with the manager 0-1 year - - 95 46.8 2-5 years - - 76 37.4 6-10 years - - 18 8.9 11-15 years - - 7 3.4 16-20 years - - 5 2.5 More than 21 years - - 2 1 Mean = 3.19 SD = 3.98
Note. * Tenure “as a manager” for managers
.
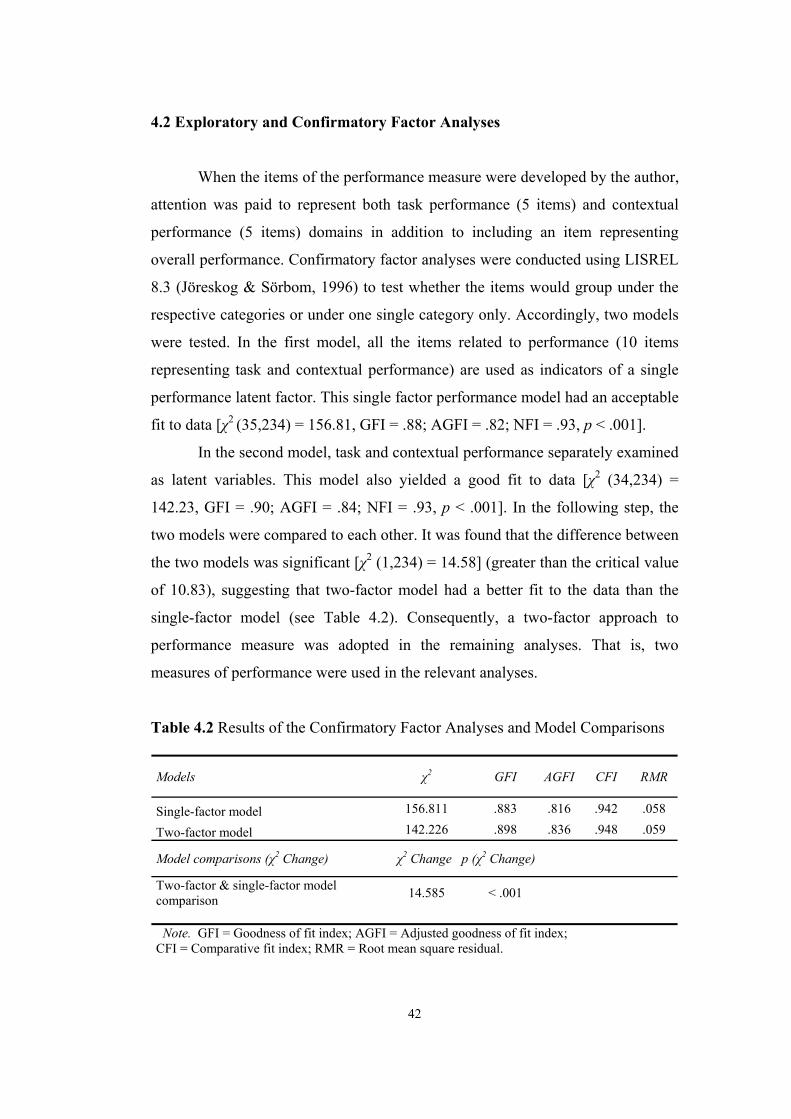
42
4.2 Exploratory and Confirmatory Factor Analyses
When the items of the performance measure were developed by the author,
attention was paid to represent both task performance (5 items) and contextual
performance (5 items) domains in addition to including an item representing
overall performance. Confirmatory factor analyses were conducted using LISREL
8.3 (Jöreskog & Sörbom, 1996) to test whether the items would group under the
respective categories or under one single category only. Accordingly, two models
were tested. In the first model, all the items related to performance (10 items
representing task and contextual performance) are used as indicators of a single
performance latent factor. This single factor performance model had an acceptable
fit to data [χ2 (35,234) = 156.81, GFI = .88; AGFI = .82; NFI = .93, p < .001].
In the second model, task and contextual performance separately examined
as latent variables. This model also yielded a good fit to data [χ2 (34,234) =
142.23, GFI = .90; AGFI = .84; NFI = .93, p < .001]. In the following step, the
two models were compared to each other. It was found that the difference between
the two models was significant [χ2 (1,234) = 14.58] (greater than the critical value
of 10.83), suggesting that two-factor model had a better fit to the data than the
single-factor model (see Table 4.2). Consequently, a two-factor approach to
performance measure was adopted in the remaining analyses. That is, two
measures of performance were used in the relevant analyses.
Table 4.2 Results of the Confirmatory Factor Analyses and Model Comparisons
Models χ2 GFI AGFI CFI RMR
Single-factor model 156.811 .883 .816 .942 .058
Two-factor model 142.226 .898 .836 .948 .059
Model comparisons (χ2 Change) χ2 Change p (χ2 Change)
Two-factor & single-factor model comparison 14.585 < .001
Note. GFI = Goodness of fit index; AGFI = Adjusted goodness of fit index; CFI = Comparative fit index; RMR = Root mean square residual.
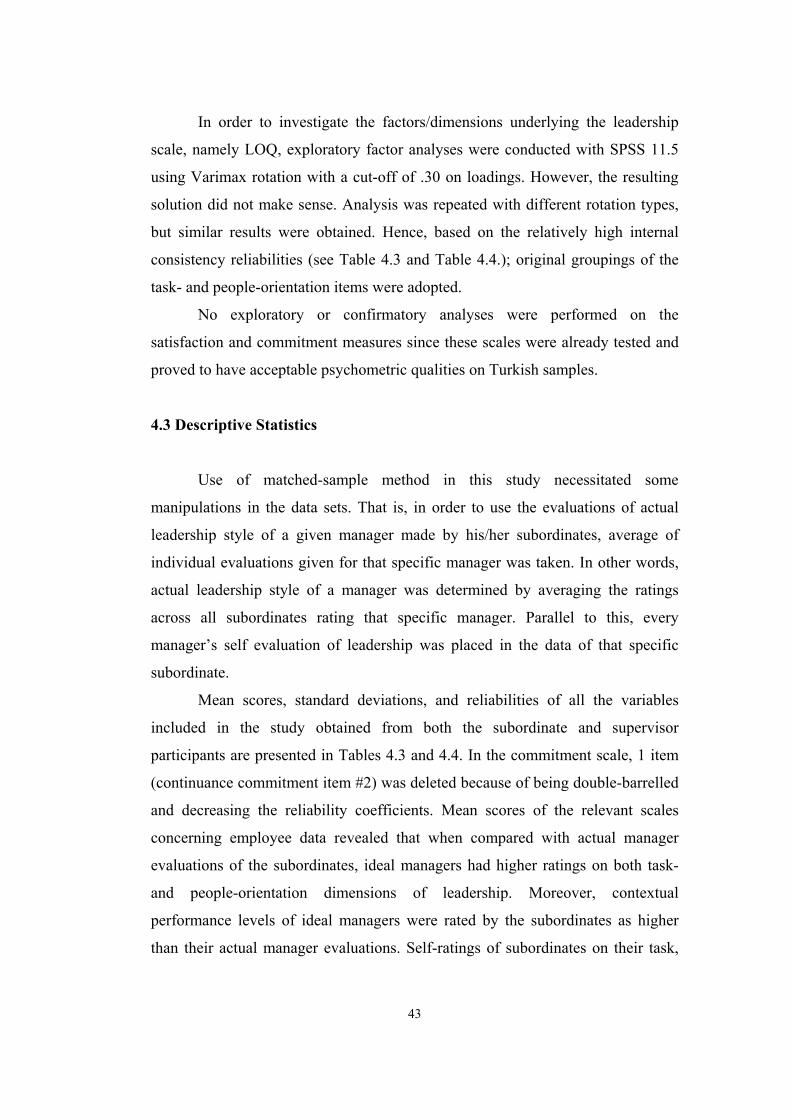
43
In order to investigate the factors/dimensions underlying the leadership
scale, namely LOQ, exploratory factor analyses were conducted with SPSS 11.5
using Varimax rotation with a cut-off of .30 on loadings. However, the resulting
solution did not make sense. Analysis was repeated with different rotation types,
but similar results were obtained. Hence, based on the relatively high internal
consistency reliabilities (see Table 4.3 and Table 4.4.); original groupings of the
task- and people-orientation items were adopted.
No exploratory or confirmatory analyses were performed on the
satisfaction and commitment measures since these scales were already tested and
proved to have acceptable psychometric qualities on Turkish samples.
4.3 Descriptive Statistics
Use of matched-sample method in this study necessitated some
manipulations in the data sets. That is, in order to use the evaluations of actual
leadership style of a given manager made by his/her subordinates, average of
individual evaluations given for that specific manager was taken. In other words,
actual leadership style of a manager was determined by averaging the ratings
across all subordinates rating that specific manager. Parallel to this, every
manager’s self evaluation of leadership was placed in the data of that specific
subordinate.
Mean scores, standard deviations, and reliabilities of all the variables
included in the study obtained from both the subordinate and supervisor
participants are presented in Tables 4.3 and 4.4. In the commitment scale, 1 item
(continuance commitment item #2) was deleted because of being double-barrelled
and decreasing the reliability coefficients. Mean scores of the relevant scales
concerning employee data revealed that when compared with actual manager
evaluations of the subordinates, ideal managers had higher ratings on both task-
and people-orientation dimensions of leadership. Moreover, contextual
performance levels of ideal managers were rated by the subordinates as higher
than their actual manager evaluations. Self-ratings of subordinates on their task,

44
contextual and overall performance levels were higher than supervisory-ratings on
those performance measures.
Table 4.3. Means, Standard Deviations and Reliabilities Concerning the Variables
of Interest (Employee Data)
Measure / Variable # of items
Mean SD St. Alpha
Actual Manager
Task orientation 20 3.54 .50 .84 People orientation 20 3.43 .53 .83 Task performance* 5 4.28 .62 .81 Contextual performance* 5 4.03 .63 .73 Overall performance* 11 4.17 .60 .89
Ideal Manager
Task orientation 20 3.63 .43 .80 People orientation 20 3.62 .46 .80 Task performance* 5 4.29 .52 .76 Contextual performance* 5 4.45 .52 .67 Overall performance* 11 4.38 .47 .87
Subordinate Self-Evaluations
Job Satisfaction 20 3.65 .63 .92 Affective Commitment 9 3.84 .75 .86 Calculative Commitment 8 3.11 .74 .81 Normative Commitment 14 3.56 .72 .89 Overall Organizational Commitment 32 3.52 .60 .92 Self-Rated Task Performance* 5 4.56 .41 .75 Self-Rated Contextual Performance* 5 4.37 .45 .69 Self-Rated Overall Performance* 11 4.47 .39 .85
Manager Evaluations
Supervisor-Rated Task Performance 5 3.73 .35 .49 Supervisor-Rated Contextual Performance 5 3.83 .38 .51 Supervisor-Rated Overall Performance 11 3.82 .65 .75
Note. A five-point Likert-type scale was used for all scales/measures, 1 = “Never” and 5 = “Always” for leadership and performance-related items; 1 = “Very dissatisfied” and 5 = “Very satisfied” for job satisfaction items; 1 = “Strongly disagree” and 5 = “Strongly agree” for organizational commitment items. * Measures included for exploratory purposes only.
Mean scores of the relevant scales concerning manager data revealed
parallelness in ratings between self-ratings of the managers and subordinate
evaluations as perceived by the managers on both task- and people-orientation

45
Table 4.4. Means, Standard Deviations, and Reliabilities Concerning the
Variables of Interest (Manager Data)
Measure / Variable # of items
Mean SD St. Alpha
Self Evaluation
Task orientation 20 3.56 .39 .73 People orientation 20 3.65 .34 .72 Task performance* 5 4.35 .44 .62 Contextual performance* 5 4.35 .43 .66 Overall performance* 11 4.36 .37 .77 Job Satisfaction* 20 3.74 .49 .89
Subordinate Evaluation as Perceived by Managers
Task orientation 20 3.55 .40 .74 People orientation 20 3.64 .67 .76 Task performance* 5 4.37 .46 .80 Contextual performance* 5 4.21 .48 .67 Overall performance* 11 4.30 .43 .86 Note. A five-point Likert-type scale was used for all scales/measures, 1 = “Never” and 5 = “Always” for leadership and performance-related items; 1 = “Very dissatisfied” 5 = “Very satisfied” for job satisfaction items. * Measures included for exploratory purposes only.
dimensions. Ratings concerning performance levels of the managers were similar
in general; however, managers evaluated their contextual performance levels
higher in self-ratings, and claimed that their subordinates would provide lower
ratings on their contextual performance level.
Intercorrelations of the variables concerning both subordinates and
managers are presented in Tables 4.5 and 4.6, respectively. In general, the pattern
of correlations is as expected. For example, the correlations between job
satisfaction and both affective and normative commitment were positive and
significant. Moreover, job satisfaction was significantly positively correlated with
all three self-rated performance measures. Satisfaction was also positively
correlated with people- and task-orientation of both actual and ideal manager
perceptions. Satisfaction was negatively correlated with incongruences between
actual and ideal manager perceptions on both task- and people-orientation. That
is, satisfaction tended to increase as incongruence increased.

46
Table 4.5. Means, Standard Deviations, and Correlations Between Variables Obtained From / Concerning Employees
Variables Mean SD N 1 2 3 4 5 6 7 8 9 10 11
1. Job Satisfaction 3.65 .63 233 - 2. Affective Commitment 3.84 .75 234 .549** - 3. Continuance Commitment 3.11 .74 234 .104 .207** - 4. Normative Commitment 3.57 .72 234 .526** .766** .435** - 5. Supervisory-rated Task Perf. 4.17 .58 164 .094 .174* -.063 .074 - 6. Supervisory-rated Contextual Perf. 4.08 .62 164 .113 .204** -.106 .089 .744** - 7. Supervisory-rated General Perf. (11) 4.14 .57 164 .111 .206** -.072 .095 .931** .931** - 8. Self-rated Task Perf. 4.55 .42 231 .348** .313** .103 .248** .043 .010 .036 - 9. Self-rated Contextual Perf. 4.37 .46 231 .359** .441** .168* .389** -.033 .051 .023 .678** - 10.Self-rated General Perf. (11) 4.46 .40 231 .382** .400** .143* .342** -.005 .018 .019 .914** .908** - 11. Actual People Orient. 3.42 .53 234 .508** .223** -.100 .160* .097 .106 .110 .085 .157* .123 - 12. Actual Task Orient. 3.55 .50 234 .376** .262** .085 .265** .185* .229** .223** .272** .366** .344** .068 13. Ideal People Orient. 3.62 .46 234 .288** .228** -.027 .103 .106 .098 .102 .044 .058 .050 .485** 14. Ideal Task Orient. 3.64 .43 234 .238** .267** .146* .232** .115 .165* .156* .365** .420** .426** -.083 15. Incongruence btw. Actual-Ideal People Orient.1 .29 .59 234 -.238** -.020 -.006 -.071 -.005 .063 .026 -.021 -.081 -.052 -.506** 16. Incongruence btw. Actual-Ideal Task Orient.2 .21 .39 234 -.269** -.121 .051 -.050 -.159* -.134 -.164* .001 -.076 -.037 -.358** 17. Age 33.81 .37 223 .008 .033 .210** .049 -.167* -.210** -.208** .036 .052 .056 .017 18. Gender (O = male; 1 = female) - - 230 -.128 -.014 .007 -.092 .082 .155* .125 -.042 .035 -.020 -.056 19. Education - - 225 -.099 -.141* -.312** -.300** .012 -.073 -.050 -.106 -.140* -.129 .081 20. Tenure 12.60 8.05 222 .058 .095 .256** .150* -.091 -.136 -.124 .076 .090 .096 -.011 21. Tenure with manager 3.19 3.98 218 -.060 -.026 .139* -.017 -.124 -.268** -.216** -.039 -.076 -.061 -.152* 22. Tenure in the firm 6.50 6.26 224 -.063 .038 .250** .027 -.132 -.234** -.198* .016 -.011 .012 -.139* 23. Sector (1 = manuf., 2 = service) - - 234 -.218** -.245** -.078 -.145* -.085 -.114 -.101 .028 .080 .071 -.082 24. Questionnaire type (1 = actual first 2 = ideal first) - - 234 -.174** -.188** -.087 -.128 -.128 -.157* -.148 -.177** -.130* -.151* -.094
Note. A five-point Likert-type scale was used for all leadership, job satisfaction, performance, and commitment related items, 1 = “Never” and 5 = “Always” for leadership and performance items; 1 = “Very dissatisfied” and 5 = “Very satisfied” for job satisfaction items; 1 = “Strongly disagree” and 5 = “Strongly agree” for organizational commitment items. 1 Incongruence had a range between 0 and 5.08. 2 Incongruence had a range between 0 and 2.72. *p < .05. **p < .01.
46

47
Table 4.5. continued.
Variables Mean SD N 12 13 14 15 16 17 18 19 20 21 22 23 24
12. Actual Task Orient. 3.55 .50 234 - 13. Ideal People Orient. 3.62 .46 234 -.029 - 14. Ideal Task Orient. 3.64 .43 234 .552** -.135* - 15. Incongruence btw. Actual-Ideal People Orient.1 .29 .59 234 -.010 .139* -.017 - 16. Incongruence btw Actual-Ideal Task Orient.2 .21 .39 234 -.371** -.011 -.067 .429** -
17. Age 33.81 .37 223 -.200** .127 -.145* -.050 -.023 - 18. Gender (O = male; 1 = female) - - 230 .097 .123 -.017 .089 .064 -.150* -
19. Education - - 225 -.254** .226** -.182** .078 .029 .023 -.004 - 20. Tenure 12.60 8.05 222 -.079 .039 -.037 -.056 -.074 .889** -.182** -.201** - 21. Tenure with manager 3.19 3.98 218 -.058 -.105 -.050 .038 .060 .369** -.066 -.105 .364** - 22. Tenure in the firm 6.50 6.26 224 -.189** -.040 -.112 -.010 .092 .679** .000 -.184** .675** .565** - 23. Sector (1 = manuf., 2 = service) - - 234 -.123 -.124 -.078 -.017 .126 .132* .085 .041 .147* -.149* -.037 - 24. Questionnaire type (1 = actual first, 2 = ideal first) - - 234 -.101 -.107 -.242** -.016 .054 -.076 -.002 .140* -.139* -.167* -.144* .113 -
Note. A five-point Likert-type scale was used for all leadership, job satisfaction, performance, and commitment related items, 1 = “Never” and 5 = “Always” for leadership and performance items; 1 = “Very dissatisfied” and 5 = “Very satisfied” for job satisfaction items; 1 = “Strongly disagree” and 5 = “Strongly agree” for organizational commitment items. 1 Incongruence had a range between 0 and 5.08. 2 Incongruence had a range between 0 and 2.72. *p < .05. **p < .01.
47
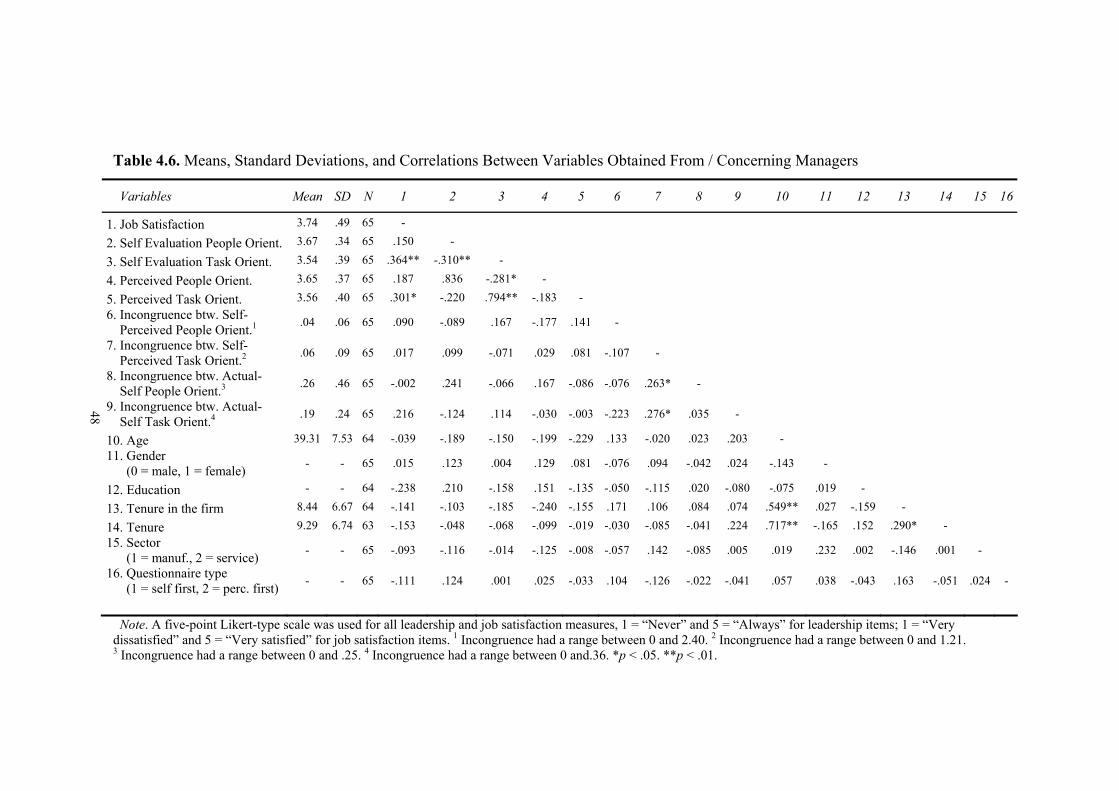
48
Table 4.6. Means, Standard Deviations, and Correlations Between Variables Obtained From / Concerning Managers
Variables Mean SD N 1 2 3 4 5 6 7 8 9 10 11 12 13 14 15 16
1. Job Satisfaction 3.74 .49 65 -
2. Self Evaluation People Orient. 3.67 .34 65 .150 -
3. Self Evaluation Task Orient. 3.54 .39 65 .364** -.310** -
4. Perceived People Orient. 3.65 .37 65 .187 .836 -.281* -
5. Perceived Task Orient. 3.56 .40 65 .301* -.220 .794** -.183 - 6. Incongruence btw. Self- Perceived People Orient.1 .04 .06 65 .090 -.089 .167 -.177 .141 -
7. Incongruence btw. Self- Perceived Task Orient.2 .06 .09 65 .017 .099 -.071 .029 .081 -.107 -
8. Incongruence btw. Actual- Self People Orient.3 .26 .46 65 -.002 .241 -.066 .167 -.086 -.076 .263* -
9. Incongruence btw. Actual- Self Task Orient.4 .19 .24 65 .216 -.124 .114 -.030 -.003 -.223 .276* .035 -
10. Age 39.31 7.53 64 -.039 -.189 -.150 -.199 -.229 .133 -.020 .023 .203 - 11. Gender (0 = male, 1 = female) - - 65 .015 .123 .004 .129 .081 -.076 .094 -.042 .024 -.143 -
12. Education - - 64 -.238 .210 -.158 .151 -.135 -.050 -.115 .020 -.080 -.075 .019 -
13. Tenure in the firm 8.44 6.67 64 -.141 -.103 -.185 -.240 -.155 .171 .106 .084 .074 .549** .027 -.159 -
14. Tenure 9.29 6.74 63 -.153 -.048 -.068 -.099 -.019 -.030 -.085 -.041 .224 .717** -.165 .152 .290* - 15. Sector (1 = manuf., 2 = service) - - 65 -.093 -.116 -.014 -.125 -.008 -.057 .142 -.085 .005 .019 .232 .002 -.146 .001 -
16. Questionnaire type (1 = self first, 2 = perc. first) - - 65 -.111 .124 .001 .025 -.033 .104 -.126 -.022 -.041 .057 .038 -.043 .163 -.051 .024 -
Note. A five-point Likert-type scale was used for all leadership and job satisfaction measures, 1 = “Never” and 5 = “Always” for leadership items; 1 = “Very dissatisfied” and 5 = “Very satisfied” for job satisfaction items. 1 Incongruence had a range between 0 and 2.40. 2 Incongruence had a range between 0 and 1.21. 3 Incongruence had a range between 0 and .25. 4 Incongruence had a range between 0 and.36. *p < .05. **p < .01.
48

49
Affective commitment had significant correlations with normative
commitment, supervisory- and self-rated performance dimension, actual and ideal
manager perceptions on task- and people-orientation, education, sector, and
questionnaire type. Continuance commitment was correlated with normative
commitment, self-rated contextual and general performance dimensions, ideal
manager task-orientation, age, education, and all variations of tenure. Normative
commitment had significant correlations with self-rated performance dimensions,
actual manager people- and task-orientation, ideal manager task-orientation,
education, tenure in general, and sector.
Regarding variables concerning manager participants, significant
correlations between self evaluation of managers on task orientation and
employee perceptions on task-orientation as presumed by managers; self
evaluation of managers on task-orientation and employee perceptions on people-
orientation as presumed by managers; and self evaluation of managers on task-
and people-orientation were observed.
4.4 Hypotheses Testing
In this study, subordinates provided ratings of task- and people-oriented
leadership styles of both their actual and ideal managers. Managers themselves,
on the other hand, evaluated their task and people-oriented leadership behaviours
both as how they see themselves and as how they think they are perceived by their
subordinates. The hypotheses of this study are concentrated firstly on the
leadership styles of the managers (Hypotheses 1a and 1b), then to the ideal
leadership perceptions of the subordinates (Hypothesis 2), and lastly on the effects
of incongruences between actual and ideal task- and people-oriented leadership
styles of the managers on subordinate satisfaction, commitment, and performance
levels (Hypotheses 3a, 3b, and 3c).
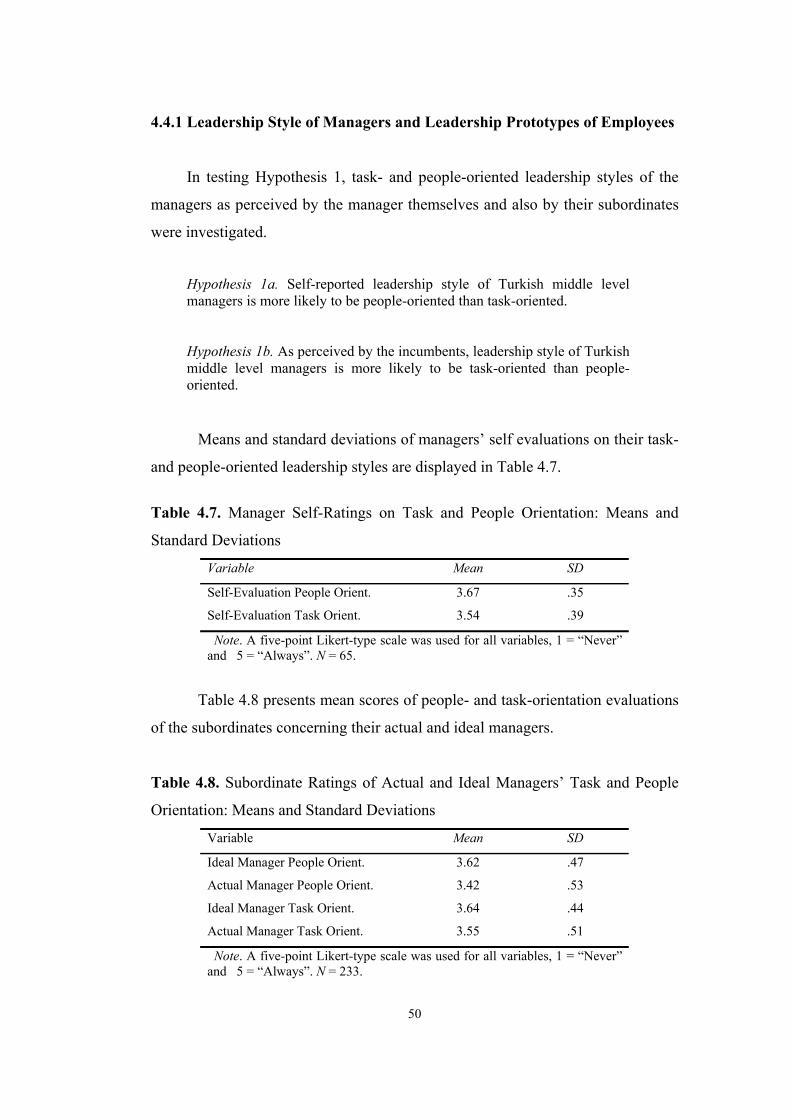
50
4.4.1 Leadership Style of Managers and Leadership Prototypes of Employees
In testing Hypothesis 1, task- and people-oriented leadership styles of the
managers as perceived by the manager themselves and also by their subordinates
were investigated.
Hypothesis 1a. Self-reported leadership style of Turkish middle level managers is more likely to be people-oriented than task-oriented. Hypothesis 1b. As perceived by the incumbents, leadership style of Turkish middle level managers is more likely to be task-oriented than people-oriented.
Means and standard deviations of managers’ self evaluations on their task-
and people-oriented leadership styles are displayed in Table 4.7.
Table 4.7. Manager Self-Ratings on Task and People Orientation: Means and
Standard Deviations
Variable Mean SD
Self-Evaluation People Orient. 3.67 .35
Self-Evaluation Task Orient. 3.54 .39
Note. A five-point Likert-type scale was used for all variables, 1 = “Never” and 5 = “Always”. N = 65.
Table 4.8 presents mean scores of people- and task-orientation evaluations
of the subordinates concerning their actual and ideal managers.
Table 4.8. Subordinate Ratings of Actual and Ideal Managers’ Task and People
Orientation: Means and Standard Deviations
Variable Mean SD
Ideal Manager People Orient. 3.62 .47
Actual Manager People Orient. 3.42 .53
Ideal Manager Task Orient. 3.64 .44
Actual Manager Task Orient. 3.55 .51
Note. A five-point Likert-type scale was used for all variables, 1 = “Never” and 5 = “Always”. N = 233.

51
Firstly, for testing Hypothesis 1a, mean scores of task- and people-
orientation scores were compared against each other with a paired-sample t-test.
Examination of results revealed that means of the self-evaluations of managers on
their task- and people-orientation were not different from each other (t = 1.71, p >
.05). Difference between self-reported task- and people-oriented leadership
behaviours of managers was not significant. Meaning that Hypothesis 1a was not
supported. However, examination of the means suggested that, although not
significant, the difference between task- and people-oriented behaviours was in
the expected direction. That is, managers tended to report themselves as being
relatively more people-oriented.
Similarly, Hypothesis 1b was tested with a paired-sample t-test, and the
results revealed that the mean of actual manager perceptions of employees on
task-orientation was different from the mean of actual manager perceptions of
employees on people-orientation (t = 2.67, p < .01). Specifically, it was found that
leadership style of Turkish managers as perceived by subordinates were more
task-oriented than people-oriented. Hence, Hypothesis 1b was supported.
For testing Hypothesis 2, leadership prototypes of the employees were
investigated through the ideal leadership evaluations made by the employees.
Hypothesis 2. Ideal leadership prototype of job incumbents is more likely to be people-oriented than task-oriented.
For examining whether the ideal manager perceptions of the employees
consisted of people-oriented rather than task-oriented behaviours, a paired-sample
t-test was executed. Results indicated that the mean of task- and people-
orientation of the ideal manager for the employees was not significantly different
(t = -.498, p > .62). Hence, Hypothesis 2 was not supported. Results of paired-
sample t-tests are shown in Table 4.9.
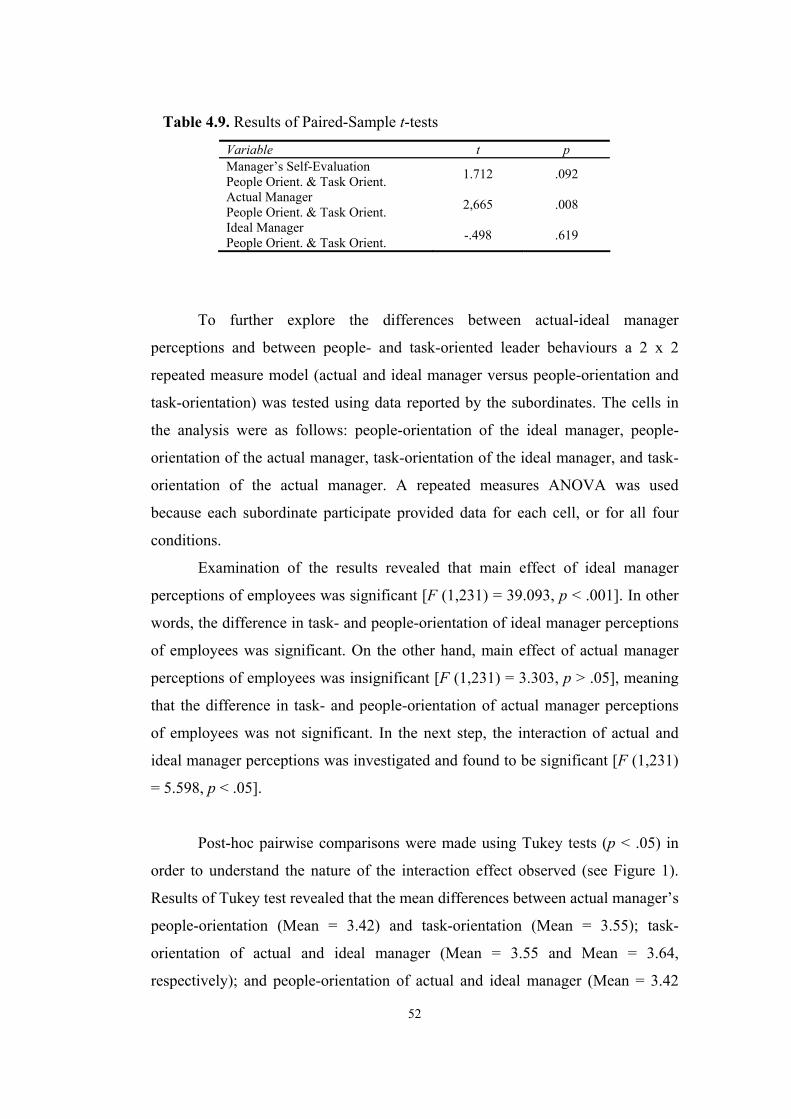
52
Table 4.9. Results of Paired-Sample t-tests
Variable t p Manager’s Self-Evaluation People Orient. & Task Orient. 1.712 .092
Actual Manager People Orient. & Task Orient. 2,665 .008
Ideal Manager People Orient. & Task Orient. -.498 .619
To further explore the differences between actual-ideal manager
perceptions and between people- and task-oriented leader behaviours a 2 x 2
repeated measure model (actual and ideal manager versus people-orientation and
task-orientation) was tested using data reported by the subordinates. The cells in
the analysis were as follows: people-orientation of the ideal manager, people-
orientation of the actual manager, task-orientation of the ideal manager, and task-
orientation of the actual manager. A repeated measures ANOVA was used
because each subordinate participate provided data for each cell, or for all four
conditions.
Examination of the results revealed that main effect of ideal manager
perceptions of employees was significant [F (1,231) = 39.093, p < .001]. In other
words, the difference in task- and people-orientation of ideal manager perceptions
of employees was significant. On the other hand, main effect of actual manager
perceptions of employees was insignificant [F (1,231) = 3.303, p > .05], meaning
that the difference in task- and people-orientation of actual manager perceptions
of employees was not significant. In the next step, the interaction of actual and
ideal manager perceptions was investigated and found to be significant [F (1,231)
= 5.598, p < .05].
Post-hoc pairwise comparisons were made using Tukey tests (p < .05) in
order to understand the nature of the interaction effect observed (see Figure 1).
Results of Tukey test revealed that the mean differences between actual manager’s
people-orientation (Mean = 3.42) and task-orientation (Mean = 3.55); task-
orientation of actual and ideal manager (Mean = 3.55 and Mean = 3.64,
respectively); and people-orientation of actual and ideal manager (Mean = 3.42
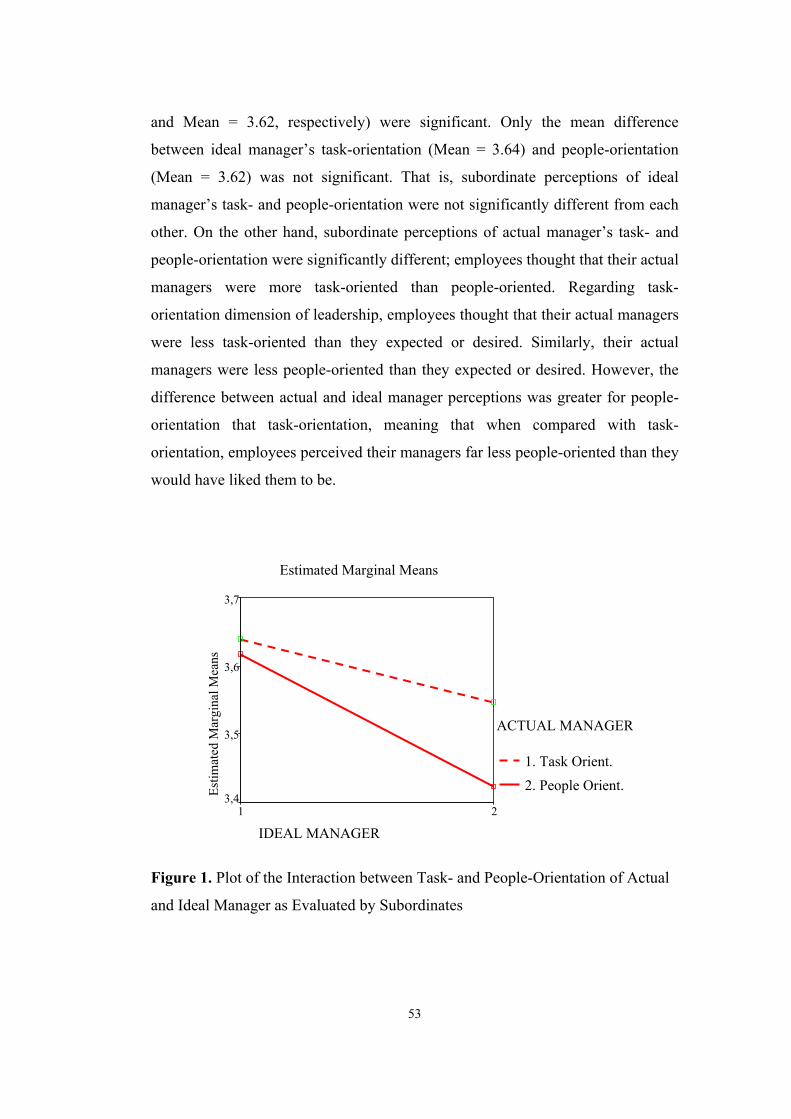
53
and Mean = 3.62, respectively) were significant. Only the mean difference
between ideal manager’s task-orientation (Mean = 3.64) and people-orientation
(Mean = 3.62) was not significant. That is, subordinate perceptions of ideal
manager’s task- and people-orientation were not significantly different from each
other. On the other hand, subordinate perceptions of actual manager’s task- and
people-orientation were significantly different; employees thought that their actual
managers were more task-oriented than people-oriented. Regarding task-
orientation dimension of leadership, employees thought that their actual managers
were less task-oriented than they expected or desired. Similarly, their actual
managers were less people-oriented than they expected or desired. However, the
difference between actual and ideal manager perceptions was greater for people-
orientation that task-orientation, meaning that when compared with task-
orientation, employees perceived their managers far less people-oriented than they
would have liked them to be.
Figure 1. Plot of the Interaction between Task- and People-Orientation of Actual
and Ideal Manager as Evaluated by Subordinates
Estimated Marginal Means
IDEAL MANAGER21
Estim
ated
Mar
gina
l Mea
ns
3,7
3,6
3,5
3,4
ACTUAL MANAGER
1. Task Orient. 2. People Orient.

54
Although it is not a part of hypotheses of the study, for exploratory
purposes mainly, the data obtained from managers were analyzed for investigation
of leadership styles of managers as perceived by themselves. Mean scores of
managers’ self evaluations and subordinate evaluations as presumed by managers
on people and task orientation are presented in Table 4.10.
Table 4.10. Manager Self Ratings and Subordinate Evaluation as Presumed by
Managers on Task- and People-Orientation: Means and Standard Deviations
Variable Mean SD
Manager Self Evaluation People Orient. 3.67 .34
Subordinate Evaluation as Presumed by Manager - People Orient.
3.65 .37
Manager Self Evaluation - Task Orient. 3.54 .39
Subordinate Evaluation as Presumed by Manager - Task Orient.
3.56 .40
Note. A five-point Likert-type scale was used for all variables, 1 = “Never” and 5 = “Always”.
The differences between managers’ self evaluations and subordinate
evaluations as perceived by managers on people- and task- orientation were
explored with a 2 x 2 repeated measures model, with the following four
conditions: manager self evaluation on people-orientation, subordinate evaluations
as perceived by managers on people-orientation, manager self evaluation on task-
orientation, and subordinate evaluations as perceived by managers on task-
orientation.
Examination of the results revealed that main effect of self-evaluations
was insignificant [F (1,64) =.001, p > .05]. In other words, there was no
statistically significant difference in task- and people-orientation in self-
evaluations of the managers. Similarly, main effect of subordinate evaluations as
perceived by managers was not significant [F (1,64) = 2.365, p > .05]. That is,
there was not a significant difference in task- and people-orientation in
subordinate evaluations as presumed by managers. Interaction of self-evaluations
of managers and subordinate evaluations as perceived by managers was
55
investigated next, and not found to be significant either [F (1,64) = .733 and p >
.05]. Despite insignificance of both the main effects and the interaction effect,
means are plotted in Figure 2.
Figure 2. Plot of the Interaction between Task- and People-Orientation of Self
Evaluations and Subordinate Evaluations as Perceived by Managers
Examination of Figure 2 suggested that the difference between self
evaluations of managers on people- and task-orientation was noticeable. Managers
perceived themselves to be more people-oriented than task-oriented. Actually,
despite the insignificance of the interaction term, a post-hoc comparison indicated
that the difference between self-rated people-orientation (Mean = 3.67) and task-
orientation (Mean = 3.54) was significant. Furthermore, the difference between
employee evaluation of manager’s task-orientation (Mean = 3.56) and people-
orientation (Mean = 3.65) as presumed by the managers was also significant. That
is, managers tended to think that their subordinates presumed their leadership
style as being more people-oriented than task-oriented.
All told, the findings of analyses suggested that while employees thought
that their actual managers were more task-oriented than people-oriented, their
managers thought that they displayed more people-oriented behaviours than task-
Estimated Marginal Means
SELF EVALUATIONS OF MANAGERS
21
3,7
3,6
3,5
3,4Estim
ated
Mar
gina
l Mea
ns
1 People Orient.
2 Task Orient.
SUBORDINATE EVALUATION AS PERCEIVED BY MANAGERS

56
oriented behaviours. And also managers thought that their subordinates perceived
them to be more people-oriented than task-oriented.
4.4.2 Effects of Incongruence between Actual and Ideal Leadership Style on
Organizational Outcomes
In this section, Hypotheses 3a, 3b, and 3c which are about effects of
incongruence of actual and ideal leadership style on organizational outcomes are
tested.
Hypothesis 3a. Congruence between subordinate perception of leader’s style and subordinate prototype of leadership leads to higher subordinate task and contextual performance. Hypothesis 3b. Congruence between subordinate perception of leader’s style and subordinate prototype of leadership leads to higher subordinate satisfaction. Hypothesis 3c. Congruence between subordinate perception of leader’s style and subordinate prototype of leadership leads to higher commitment levels in subordinates.
Before presenting the relevant analyses, first calculation of congruence (in
fact, incongruence) is described below.
4.4.2.1 Calculation of Congruence/Incongruence
In order to test Hypotheses 3a, 3b, and 3c, which were based on the
differences in perceptions and their effect on work outcomes of the employees,
two congruence scores were calculated using the procedure described in the
method section. Following Kristof’s (1996) suggestions, incongruences were
computed by calculating the squared differences of the relevant mean scores. In
this approach incongruence is simply the squared difference between the two
scores. High values of congruence (i.e., incongruence) indicated greater difference
in the compared variables. For example, if the two means to be compared were
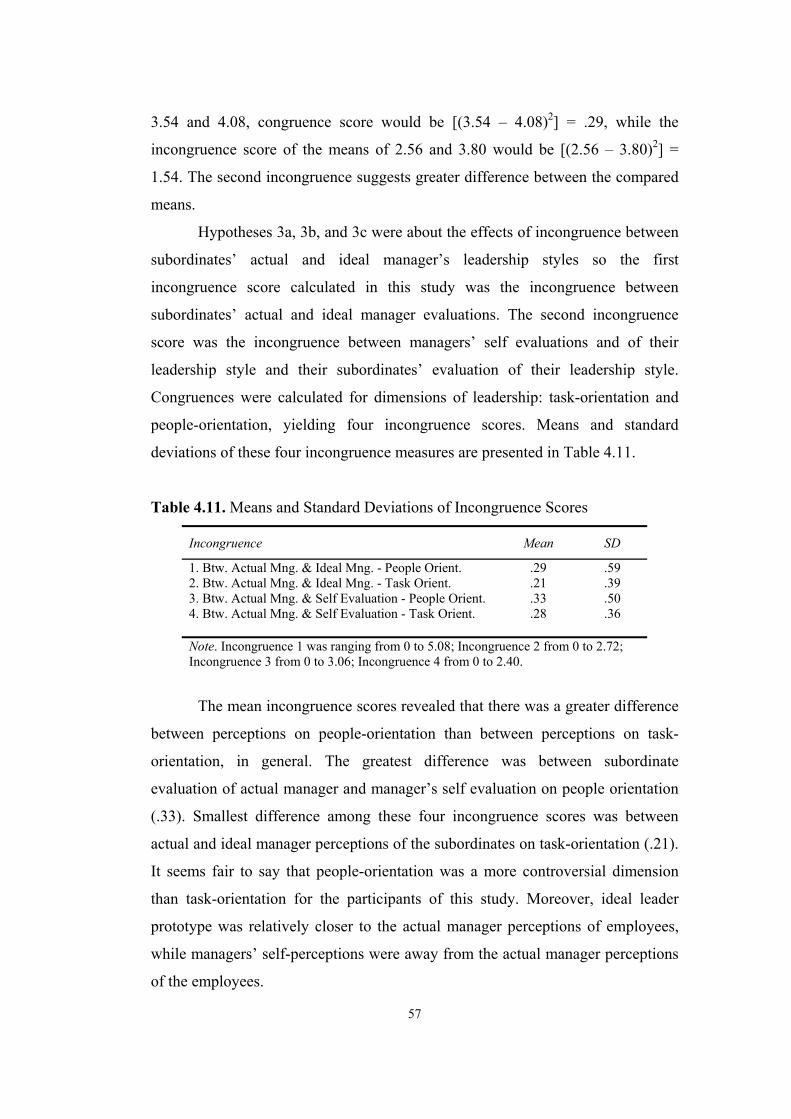
57
3.54 and 4.08, congruence score would be [(3.54 – 4.08)2] = .29, while the
incongruence score of the means of 2.56 and 3.80 would be [(2.56 – 3.80)2] =
1.54. The second incongruence suggests greater difference between the compared
means.
Hypotheses 3a, 3b, and 3c were about the effects of incongruence between
subordinates’ actual and ideal manager’s leadership styles so the first
incongruence score calculated in this study was the incongruence between
subordinates’ actual and ideal manager evaluations. The second incongruence
score was the incongruence between managers’ self evaluations and of their
leadership style and their subordinates’ evaluation of their leadership style.
Congruences were calculated for dimensions of leadership: task-orientation and
people-orientation, yielding four incongruence scores. Means and standard
deviations of these four incongruence measures are presented in Table 4.11.
Table 4.11. Means and Standard Deviations of Incongruence Scores
Incongruence Mean SD
1. Btw. Actual Mng. & Ideal Mng. - People Orient. .29 .59 2. Btw. Actual Mng. & Ideal Mng. - Task Orient. .21 .39 3. Btw. Actual Mng. & Self Evaluation - People Orient. .33 .50 4. Btw. Actual Mng. & Self Evaluation - Task Orient. .28 .36 Note. Incongruence 1 was ranging from 0 to 5.08; Incongruence 2 from 0 to 2.72; Incongruence 3 from 0 to 3.06; Incongruence 4 from 0 to 2.40.
The mean incongruence scores revealed that there was a greater difference
between perceptions on people-orientation than between perceptions on task-
orientation, in general. The greatest difference was between subordinate
evaluation of actual manager and manager’s self evaluation on people orientation
(.33). Smallest difference among these four incongruence scores was between
actual and ideal manager perceptions of the subordinates on task-orientation (.21).
It seems fair to say that people-orientation was a more controversial dimension
than task-orientation for the participants of this study. Moreover, ideal leader
prototype was relatively closer to the actual manager perceptions of employees,
while managers’ self-perceptions were away from the actual manager perceptions
of the employees.

58
4.4.2.2. Regression Analyses
For testing hypotheses 3a, 3b, and 3c, which were based on investigation
of the effect of the incongruences (incongruence between actual and ideal
manager perceptions of employees on task- and people-oriented leadership styles)
on subordinate performance, satisfaction, and organizational commitment levels,
respectively, a series of multiple regression analyses were conducted using SPSS
11.5.
To identify potential covariates or variables that needed to be controlled
for, initially a series of multiple regression analyses were done in which each
outcome variable (i.e., job satisfaction, organizational commitment, and
performance) was separately regressed on a number of potential covariates (i.e.,
age, gender, education, tenure in general, tenure in the company, and tenure with
the current manager, sector type of the company -manufacturing or service sector-
, and the order of the questions in the questionnaires –first asking about actual or
ideal manager first). Results of the analyses are presented in Appendix B. These
analyses indicated age, education, tenure in general, tenure with the manager,
sector type, and questionnaire order as important variables to be controlled for in
testing the hypotheses 3a, 3b, and 3c.
Incongruence scores were treated as independent variables and each work
outcome (task and contextual performance, job satisfaction, affective,
continuance, and normative commitment) was taken as the dependent variable in
each regression analysis. The dependent variables (i.e., task and contextual
performance, job satisfaction, affective, continuance, and normative commitment)
were separately regressed on incongruences after controlling for the effects of
covariates.
4.4.2.2.1 Prediction of Task and Contextual Performance
A series of hierarchical multiple regression analyses were performed in
order to determine the predictive ability of different incongruence measures (i.e.,
incongruence of actual and ideal manager perceptions of subordinates and
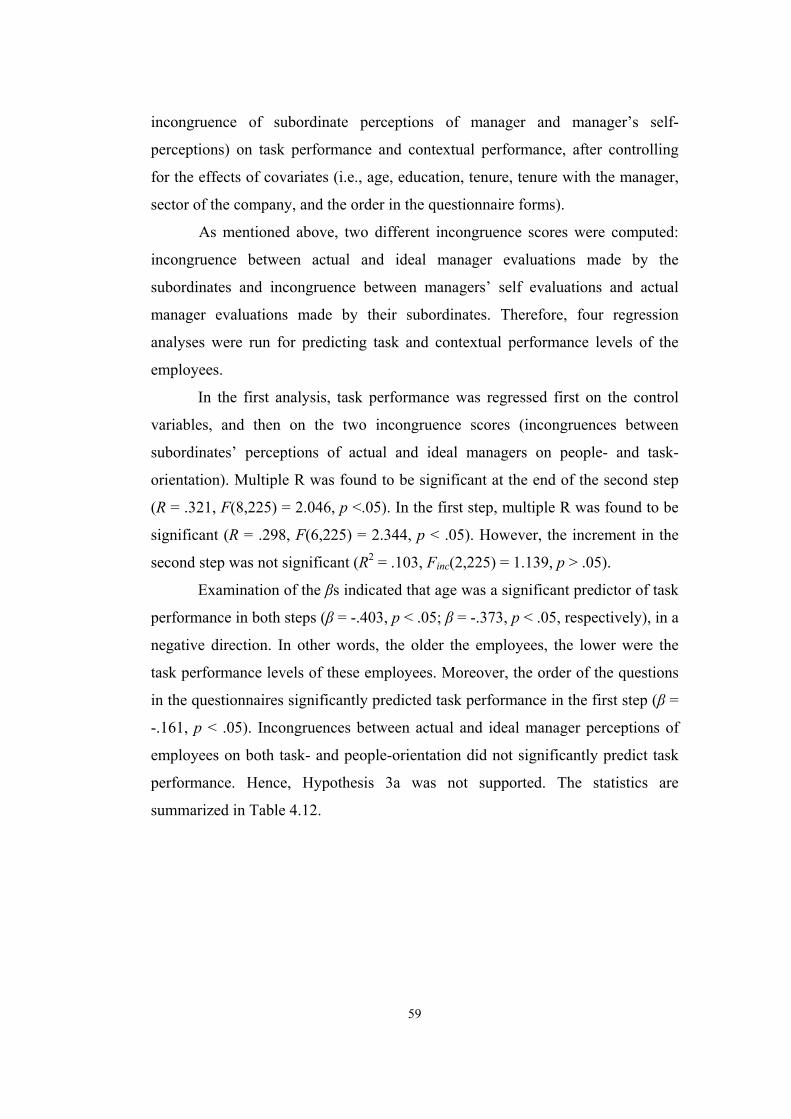
59
incongruence of subordinate perceptions of manager and manager’s self-
perceptions) on task performance and contextual performance, after controlling
for the effects of covariates (i.e., age, education, tenure, tenure with the manager,
sector of the company, and the order in the questionnaire forms).
As mentioned above, two different incongruence scores were computed:
incongruence between actual and ideal manager evaluations made by the
subordinates and incongruence between managers’ self evaluations and actual
manager evaluations made by their subordinates. Therefore, four regression
analyses were run for predicting task and contextual performance levels of the
employees.
In the first analysis, task performance was regressed first on the control
variables, and then on the two incongruence scores (incongruences between
subordinates’ perceptions of actual and ideal managers on people- and task-
orientation). Multiple R was found to be significant at the end of the second step
(R = .321, F(8,225) = 2.046, p <.05). In the first step, multiple R was found to be
significant (R = .298, F(6,225) = 2.344, p < .05). However, the increment in the
second step was not significant (R2 = .103, Finc(2,225) = 1.139, p > .05).
Examination of the βs indicated that age was a significant predictor of task
performance in both steps (β = -.403, p < .05; β = -.373, p < .05, respectively), in a
negative direction. In other words, the older the employees, the lower were the
task performance levels of these employees. Moreover, the order of the questions
in the questionnaires significantly predicted task performance in the first step (β =
-.161, p < .05). Incongruences between actual and ideal manager perceptions of
employees on both task- and people-orientation did not significantly predict task
performance. Hence, Hypothesis 3a was not supported. The statistics are
summarized in Table 4.12.

60
Table 4.12 Predicting Task Performance from Incongruence between Actual and Ideal Manager Evaluations of Subordinates: Summary of Hierarchical Regression Analysis
Variable R2 R2 Change
F Change B SE B β
Step 1 .089* .089* 2.344 Age -.030* .013 -.403* Education .053 .046 .103 Tenure .029* .014 .375* Tenure with the manager -.021 .012 -.154 Sector -.150 .100 -.122 Questionnaire type -.191* .096 -.161*
Step 2 .103 .014 1.139 Age -.028* .013 -.373* Education .051 .046 .098 Tenure .026 .014 .338 Tenure with the manager -.019 .012 -.140 Sector -.120 .102 -.097 Questionnaire type -.177 .097 -.150 Incongruence btw.
Actual - Ideal People Orient. .042 .078 .049
Incongruence btw. Actual - Ideal Task Orient. -.186 .124 -.138
Note. R = .298, p < .05; F = 2.344, p <.05 in the first step, R = .321, p >.05; F = 2.046, p <.05 in the second step; *p < .05, **p < .01.
In the second regression analysis, task performance was regressed firstly
on the control variables, and then on the two incongruence between managers’
self evaluations and employees’ evaluations regarding managers’ people- and
task-orientation. According to the results as displayed in Table 4.13, multiple R
was not found to be significant at the end of second step (R = .307, F(8,225) =
1.853, p > .05). Multiple R in the first step was found to be significant (R = .298,
F(6,225) = 2.344, p < .05). The increment in the second step was not significant
(R2 = .095, Finc(2,225) = .435, p > .05).
Among the control variables and independent variables, age and
questionnaire type significantly predicted employee task performance. Age was a
significant predictor of task performance in both the first and the second steps (β =
-.403, p < .05; β = -.388, p < .05, respectively). The younger the employees, the
higher their task performance levels are. Order of the questions in the
questionnaires was also significant predictor of task performance in both steps (β
= -.161, p < .05; β = -.162, p < .05, respectively). Incongruence between actual

61
manager perception of the employees and managers’ self perceptions about
themselves on task and people orientation dimensions did not appear to
significantly predict task performance levels of the employees. Hence, Hypothesis
3a was not supported.
Table 4.13. Predicting Task Performance from Incongruence between Perceptions of Managers and their Subordinates: Summary of Hierarchical Regression Analysis
Variable R2 R2 Change
F Change B SE B β
Step 1 .089* .089* 2.344 Age -.030* .013 -.403* Education .053 .046 .103 Tenure .029* .014 .375* Tenure with the manager -.021 .012 -.154 Sector -.150 .100 -.122 Questionnaire type -.191* .096 -.161*
Step 2 .095 .006 .435 Age -.029* .013 -.388* Education .052 .046 .100 Tenure .027 .014 .353 Tenure with the manager -.020 .012 -.142 Sector -.130 .103 -.106 Questionnaire type -.192* .097 -.162* Incongruence btw.
Actual - Self People Orient. -.024 .099 -.019
Incongruence btw. Actual - Self Task Orient. -.115 .137 -.071
Note. R = .298, p <.05; F = 2.344, p <.05 in the first step; R =.307, p >.05; F =1.853, p >.05 in the second step; *p < .05, **p < .01.
For the third analysis, contextual performance was regressed firstly on the
control variables, and then on the two incongruence scores (incongruence between
subordinates’ perceptions of actual and ideal managers on people- and task-
orientation). Results displayed in Table 4.14 revealed that multiple R was not
significantly different from zero at the end of the second step (R = .425, F(8,225)
= 3.913, p > .05). Multiple R in the first step was found to be significant (R =
.397, F(6,225) = 4.489, p < .01). The increment in the second step was not
significant (R2 = .181, Finc(2,225) = 1.999, p > .05).
Tenure with the manager appeared to be a significant negative predictor of
contextual performance in both the first and the second steps (β = -.317, p < .01; β

62
= -.308, p < .01, respectively), meaning that the longer working period with the
current manager, the lower was the contextual performance level of those
employees. Similarly, order of the measures in the booklets had a significant
negative effect on contextual performance in both steps (β = -.191, p < .05; β = -
.181, p < .05, respectively). Contrary to the expectations (Hypothesis 3a),
incongruences between actual and ideal manager perceptions of the employees on
task- and people-orientation dimensions were not significant predictors of
contextual performance. Table 4.14. Predicting Contextual Performance from Incongruence between Actual and Ideal Manager Evaluations of Subordinates: Summary of Hierarchical Regression Analysis
Variable R2 R2 Change
F Change B SE B β
Step 1 .158** .158** 4.489 Age -.017 .014 -.213 Education -.028 .047 -.051 Tenure .013 .015 .165 Tenure with the manager -.047** .013 -.317** Sector -.191 .103 -.145 Questionnaire type -.241* .099 -.191*
Step 2 .181 .023 1.999 Age -.013 .014 -.166 Education -.037 .047 -.066 Tenure .010 .015 .120 Tenure with the manager -.046** .013 -.308** Sector -.158 .104 -.120 Questionnaire type -.229* .099 -.181* Incongruence btw.
Actual - Ideal People Orient. .132 .080 .142
Incongruence btw. Actual - Ideal Task Orient. -.221 .126 -.153
Note. R = .397, p < .001, F = 4.489, p < .001 in the first step; R = .425, p > .05, F = 3.913, p < .001 in the second step; *p < .05, **p < .01.
Lastly, contextual performance was regressed on the control variables, and
followed by the two incongruence scores (i.e., incongruence between managers’
self evaluations and employees’ evaluations regarding their managers’ people-
and task-orientation). The results revealed that multiple R was not significantly
different from zero at the end of the second step (R = .409, F(8, 225) = 3.568, p >
.05). Multiple R in the first step was found to be significant (R = .397, F(6,225) =

63
4.489, p < .01). The increment in the second step was not significant (R2 = .167,
Finc(2,225) = .837, p > .05).
Tenure with the manager significantly predicted employee contextual
performance level in the first and second steps (β = -.317, p < .01; β = -.304, p <
.01, respectively). Similarly, order of the measures significantly predicted
contextual performance in both steps (β = -.191, p < .05; β = -.197, p < .05,
respectively). Incongruence between actual manager perception of the employees
and managers’ self perceptions about themselves on task and people orientation
dimensions did not appear to significantly predict contextual performance levels.
Therefore, no support for Hypothesis 3a was found. The statistics are summarized
in Table 4.15.
Table 4.15. Predicting Contextual Performance from Incongruence between Perceptions of Manager and their Subordinates: Summary of Hierarchical Regression Analysis
Variable R2 R2 Change
F Change B SE B β
Step 1 .158** .158** 4.489 Age -.017 .014 -.213 Education -.028 .047 -.051 Tenure .013 .015 .165 Tenure with the manager -.047** .013 -.317** Sector -.191 .103 -.145 Questionnaire type -.241* .099 -.191*
Step 2 .167 .010 .837 Age -.016 .014 -.197 Education -.031 .047 -.055 Tenure .012 .015 .146 Tenure with the manager -.045** .013 -.304** Sector -.169 .105 -.129 Questionnaire type -.249* .099 -.197* Incongruence btw.
Actual - Self People Orient. .080 .102 .061
Incongruence btw. Actual - Self Task Orient. -.163 .140 -.094
Note. R =.397, p < .001, F = 4.489, p < .001 in the first step; R = .409, p > .05; F = 3.568, p <.01 in the second step; *p < .05, **p < .01.

64
4.4.2.2.2 Prediction of Job Satisfaction
Two hierarchical multiple regression analyses were conducted to
determine the predictive ability of different incongruence measures on job
satisfaction, after controlling for the effects of covariates.
Similar to prediction of performance, the incongruences measured used
were: incongruence between actual and ideal manager evaluations (on both task-
and people-orientation) made by employees and incongruence between managers’
self evaluations and actual manager evaluations made by subordinates (on both
task- and people-orientation).
In the first analyses, job satisfaction was regressed first on the control
variables, and then on the two incongruence scores (incongruences between
subordinates’ perceptions of actual and ideal managers on people- and task-
orientation). As seen in Table 4.16, multiple R was significantly different from
zero at the end of the second step (R = .440, F(8,225) = 6.135, p < .001). Multiple
R in the first step was found to be significant (R = .359, F(6,225) = 5.073, p <
.001), and also the increment in the second step was significant (R2 = .194,
Finc(2,225) = 8.248, p < .01).
Tenure significantly predicted job satisfaction in the first and the second
steps (β = .337, p < .05; β = .303, p < .05, respectively), meaning that, the longer
the period of experience, the more satisfied were the employees. Length of
working period with the current manager significantly predicted job satisfaction in
the first step in a negative direction (β = -.158, p < .05). In other words,
employees who worked for a longer time period with their managers were less
satisfied.
Sector of the company significantly predicted job satisfaction in the first
and the second steps (β = -.271, p < .01; β = -.250, p < .01, respectively). That is,
employees working in manufacturing organizations were more satisfied than the
ones working in the service sector organizations. Order of the measures in the
booklet also significantly predicted job satisfaction in both steps (β = -.137, p <
.05; β = -.135, p < .05, respectively).

65
Incongruence between actual and ideal manager perceptions of the
employees on people-orientation dimension was a significant predictor of job
satisfaction (β = -.179, p < .05), as expected. That is, the higher difference
between subordinate perception of actual and ideal manager on people-oriented
leadership behaviours, the less satisfied were the subordinates. Unlike people-
orientation, incongruence between actual and ideal manager perceptions of
employees on task-orientation did not significantly predict job satisfaction.
Therefore, Hypothesis 3b was partially supported.
Table 4.16. Predicting Job Satisfaction from Incongruence between Actual and Ideal Manager Evaluation of Subordinates: Summary of Hierarchical Regression Analysis
Variable R2 R2 Change
F Change B SE B β
Step 1 .129** .129** 5.073 Age -.021 .012 -.265 Education -.022 .041 -.040 Tenure .027* .013 .337* Tenure with the manager -.024* .011 -.158* Sector -.343** .085 -.271** Questionnaire type -.169* .083 -.137*
Step 2 .194** .065** 8.248 Age -.020 .012 -.256 Education -.017 .040 -.031 Tenure .025* .012 .303* Tenure with the manager -.020 .011 -.130 Sector -.316** .084 -.250** Questionnaire type -.167* .080 -.135* Incongruence btw.
Actual - Ideal People Orient. -.182* .072 -.179*
Incongruence btw. Actual - Ideal Task Orient. -.188 .110 -.123
Note. R = .359, p < .001, F = 5.073, p < .001 in the first step; R = .440, p < .001, F = 6.135, p < .001 in the second step; *p < .05, **p < .01.
In the second regression analysis for job satisfaction, job satisfaction was
regressed first on the control variables, and then on the two incongruence scores
(i.e., incongruences between actual manager perceptions of subordinates and
managers’ self evaluations on people-orientation and task-orientation). Results are
displayed in Table 4.17, and as can be seen, multiple R was significantly different

66
from zero at the end of the second step (R = .475, F(8,225) = 7.424, p < .001).
Multiple R in the first step was found to be significant (R = .359, F(6,225) =
5.073, p < .001). The increment in the second step was also significant (R2 = .225,
Finc(2,225) = 12.742, p < .01).
Tenure was a significant predictor of job satisfaction in both steps of the
analysis (β = .337, p < .05; β = .298, p < .05), meaning that employees having
relatively short work experience on the total were less satisfied than the more
experienced ones. Tenure with the current manager significantly predicted general
performance in the first step and the second step (β = -.158, p < .05; β = -.163, p <
.05). Employees working with their managers for longer periods were less
satisfied. Sector of the company significantly predicted job satisfaction in both
steps (β = -.271, p < .01; β = -.262, p < .01, respectively). Specifically, employees
working in service sector organizations were found to be less satisfied than their
counterparts in manufacturing organizations. Order of the measures also
significantly predicted job satisfaction in both steps (β = -.137, p < .05; β = -.133,
p < .05, respectively).
Parallel to the expectations, incongruence between perceptions of
subordinates and managers’ self evaluations on people-orientation was found to
be significantly predicting job satisfaction levels of the employees (β = -.306, p <
.01). More specifically, as the managers’ self evaluations and employees’
perceptions of their managers on people-orientedness diverged, employees were
less likely to be satisfied with their jobs. On the contrary, incongruence between
actual manager perceptions of subordinates and managers’ self evaluations on
task-orientation did not significantly predict job satisfaction.
Findings suggested that the greater the difference in perceptions of
managers and perceptions of employees regarding people-orientation of the
managers, the less satisfied were the employees. That is, as the difference between
subordinate perceptions of managers and managers’ self perception on people-
oriented leadership behaviours increased, subordinates became less satisfied. The
discrepancy on task-orientation perceptions did not have such an effect. Hence,
Hypothesis 3b was partially supported.

67
Table 4.17. Predicting Job Satisfaction from Incongruence between Perceptions of Managers and their Subordinates: Summary of Hierarchical Regression Analysis
Variable R2 R2 Change
F Change B SE B β
Step 1 .129** .129** 5.073 Age -.021 .012 -.265 Education -.022 .041 -.040 Tenure .027* .013 .337* Tenure with the manager -.024* .011 -.158* Sector -.343** .085 -.271** Questionnaire type -.169* .083 -.137*
Step 2 .225** .097** 12.742 Age -.018 .011 -.225 Education -.025 .039 -.045 Tenure .024* .012 .298* Tenure with the manager -.025* .011 -.163* Sector -.332** .082 -.262** Questionnaire type -.164* .078 -.133* Incongruence btw.
Actual - Self People Orient. -.366** .075 -.306**
Incongruence btw. Actual - Self Task Orient. -.040 .106 -.024
Note. R = .359, p < .01, F = 5.073, p < .001 in the first step; R = .475, p < .001, F = 7.424, p < .001 in the second step; *p < .05, **p < .01.
4.4.2.2.3 Prediction of Affective, Continuance, and Normative Commitment
A series of hierarchical multiple regression analysis was performed to
examine the effects of different types of incongruences on the three commitment
measures. The aim was to find the predictive ability of different incongruence
measures on affective, continuance, and normative commitment, after controlling
for the effects of the covariates.
Incongruence measures used in predicting each commitment measure were
incongruence between actual and ideal manager perceptions of subordinates (on
both task- and people-orientation) and incongruence between managers’ self
evaluations and evaluations made by their subordinates (on both task- and people-
orientation). Hence, six regression analyses were conducted for predicting the
three dimensions of organizational commitment (affective, continuance, and
normative commitment).

68
Affective commitment was regressed first on the control variables and on
the two incongruence scores (i.e., incongruences between actual and ideal
manager perceptions of subordinates on people-orientation and task-orientation).
Multiple R was not significantly different from zero at the end of the second step
(R = .361, F(8,225) = 3.849, p > .05). Multiple R in the first step was found to be
significant (R = .358, F(6,225) = 5.069, p < .001). The increment in the second
step was not significant (R2 = .131, Finc(2,225) = .295, p > .05).
Among the control variables and independent variables, only sector was a
significant predictor of affective commitment in the first and the second steps (β =
-.267, p < .01; β = -.257, p < .01, respectively). This suggests that manufacturing
sector organizations had more affectively committed employees than service
sector organizations. Incongruences between actual and ideal manager perceptions
of employees on people- and task-orientation did not have a significant effect on
affective commitment. Therefore, Hypothesis 3c was not supported. Results are
presented in Table 4.18.
Table 4.18. Predicting Affective Commitment from Incongruence between Actual and Ideal Manager Evaluations of Subordinates: Summary of Hierarchical Regression Analysis
Variable R2 R2 Change
F Change B SE B β
Step 1 .128** .128** 5.069 Age -.019 .015 -.196 Education -.060 .050 -.089 Tenure .028 .015 .286 Tenure with the manager -.025 .014 -.131 Sector -.410** .103 -.267** Questionnaire type -.196 .100 -.131
Step 2 .131 .003 .295 Age -.018 .015 -.182 Education -.063 .050 -.094 Tenure .026 .016 .267 Tenure with the manager -.024 .014 -.126 Sector -.395** .106 -.257** Questionnaire type -.193 .100 -.129 Incongruence btw.
Actual - Ideal People Orient. .032 .090 .026
Incongruence btw. Actual - Ideal Task Orient. -.107 .139 -.057
Note. R = .358, p < .001; F = 5.069, p < .001 in the first step; R = .361, p > .05, F = 3.849, p < .001 in the second step; *p < .05, **p < .01.

69
Secondly, affective commitment was regressed first on the control
variables, and then on the two incongruence scores (i.e., incongruences between
actual manager perceptions of subordinates and managers’ self evaluations on
people-orientation and task-orientation). As presented in Table 4.19, multiple R
was not significantly different from zero at the end of the second step (R = .358,
F(8,225) = 3.769, p > .05). Multiple R in the first step was found to be significant
(R = .358, F(6,225) = 5.069, p < .001). The increment in the second step was not
significant (R2 = .128, Finc(2,225) = .015, p > .05).
Among the control variables and independent variables, again only sector
was the significant predictor of affective commitment in the first and the second
steps (β = -.267, p < .01; β = -.268, p < .01, respectively), meaning that employees
working in manufacturing organizations had greater affective commitment.
Contrary to Hypothesis 3c, incongruences between perceptions of subordinates
and managers’ self evaluations on both people-orientation and task-orientation did
not predict affective commitment levels of employees.
Table 4.19. Predicting Affective Commitment from Incongruence between Perceptions of the Managers and Their Subordinates: Summary of Hierarchical Regression Analysis
Variable R2 R2 Change
F Change B SE B β
Step 1 .128** .128** 5.069 Age -.019 .015 -.196 Education -.060 .050 -.089 Tenure .028 .015 .286 Tenure with the manager -.025 .014 -.131 Sector -.410** .103 -.267** Questionnaire type -.196 .100 -.131
Step 2 .128 .000 .015 Age -.019 .015 -.196 Education -.060 .050 -.088 Tenure .028 .015 .287 Tenure with the manager -.025 .014 -.132 Sector -.411** .105 -.268** Questionnaire type -.196 .100 -.131 Incongruence btw.
Actual - Self People Orient. -.016 .096 -.011
Incongruence btw. Actual - Self Task Orient. .011 .136 .006
Note. R = .358, p < .001, F = 5.069, p < .001 in the first step; R = .358, p > .05, F = 3.769, p < .001 in the second step; *p < .05, **p < .01.

70
The pattern of results was quite similar for both continuance and
normative commitment. Specifically, results in general revealed that
incongruences (i.e., both actual-ideal perceptions discrepancy and self-subordinate
perceptions discrepancies on both task- and people-oriented behaviours) had no
significant effects on affective, continuance (Tables 4.20, 4.21), and normative
commitment (Tables 4.22, 4.23).
Table 4.20. Predicting Continuance Commitment from Incongruence between Actual and Ideal Manager Evaluations of Subordinates: Summary of Hierarchical Regression Analysis
Variable R2 R2 Change
F Change B SE B β
Step 1 .152** .152** 6.166 Age .015 .014 .161 Education -.212** .048 -.320** Tenure .003 .015 .035 Tenure with the manager .003 .013 .016 Sector -.111 .100 -.074 Questionnaire type -.007 .096 -.005
Step 2 .156 .004 .541 Age .014 .014 .145 Education -.209** .048 -.315** Tenure .006 .015 .058 Tenure with the manager .001 .013 .008 Sector -.130 .102 -.087 Questionnaire type -.011 .097 -.007 Incongruence btw.
Actual - Ideal People Orient. -.013 .087 -.011
Incongruence btw. Actual - Ideal Task Orient. .132 .134 .073
Note. R = .389, p < .001, F = 6.166, p < .001 in the first step; R = .395, p > .05, F = 4.739, p < .001 in the second step; *p < .05, **p < .01.
There were a few noticeable findings concerning the effects of control
variables on continuance and normative commitment. First, among the control
variables, only education was a significant predictor of both continuance and
normative commitment in the first and the second steps, meaning that the more
educated are the employees, the less continuance and normative commitment they
felt.

71
Table 4.21. Predicting Continuance Commitment from Incongruence between Perceptions of Managers and their Subordinates: Summary of Hierarchical Regression Analysis
Variable R2 R2 Change
F Change B SE B β
Step 1 .152** .152** 6.166 Age .015 .014 .161 Education -.212** .048 -.320** Tenure .003 .015 .035 Tenure with the manager .003 .013 .016 Sector -.111 .100 -.074 Questionnaire type -.007 .096 -.005
Step 2 .156 .004 .509 Age .016 .014 .172 Education -.214** .048 -.323** Tenure .002 .015 .022 Tenure with the manager .003 .013 .018 Sector -.104 .101 -.070 Questionnaire type -.006 .097 -.004 Incongruence btw.
Actual - Self People Orient. -.078 .092 -.055
Incongruence btw. Actual - Self Task Orient. -.051 .131 -.026
Note. R = .389, p < .001, F = 6.166, p < .001 in the first step; R = .395, p > .05, F = 4.730, p < .001 in the second step; *p < .05, **p < .01.
Table 4.22. Predicting Normative Commitment from Incongruence between Actual and Ideal Manager Evaluations of Subordinates: Summary of Hierarchical Regression Analysis
Variable R2 R2 Change
F Change B SE B β
Step 1 .159** .159** 6.532 Age -.022 .014 -.235 Education -.170** .047 -.260** Tenure .032* .014 .336* Tenure with the manager -.021 .013 -.114 Sector -.241* .098 -.163* Questionnaire type -.064 .095 -.044
Step 2 .161 .002 .257 Age -.023 .014 -.246 Education -.166** .048 -.254** Tenure .033* .015 .347* Tenure with the manager -.021 .013 -.114 Sector -.249* .100 -.168* Questionnaire type -.066 .095 -.046 Incongruence btw.
Actual - Ideal People Orient. -.061 .086 -.051
Incongruence btw. Actual - Ideal Task Orient. .055 .132 .031
Note. R = .399, p < .001, F = 6.532, p < .001 in the first step; R = .402, p > .05, F = 4.928, p < .001 in the second step; *p < .05, **p < .01.
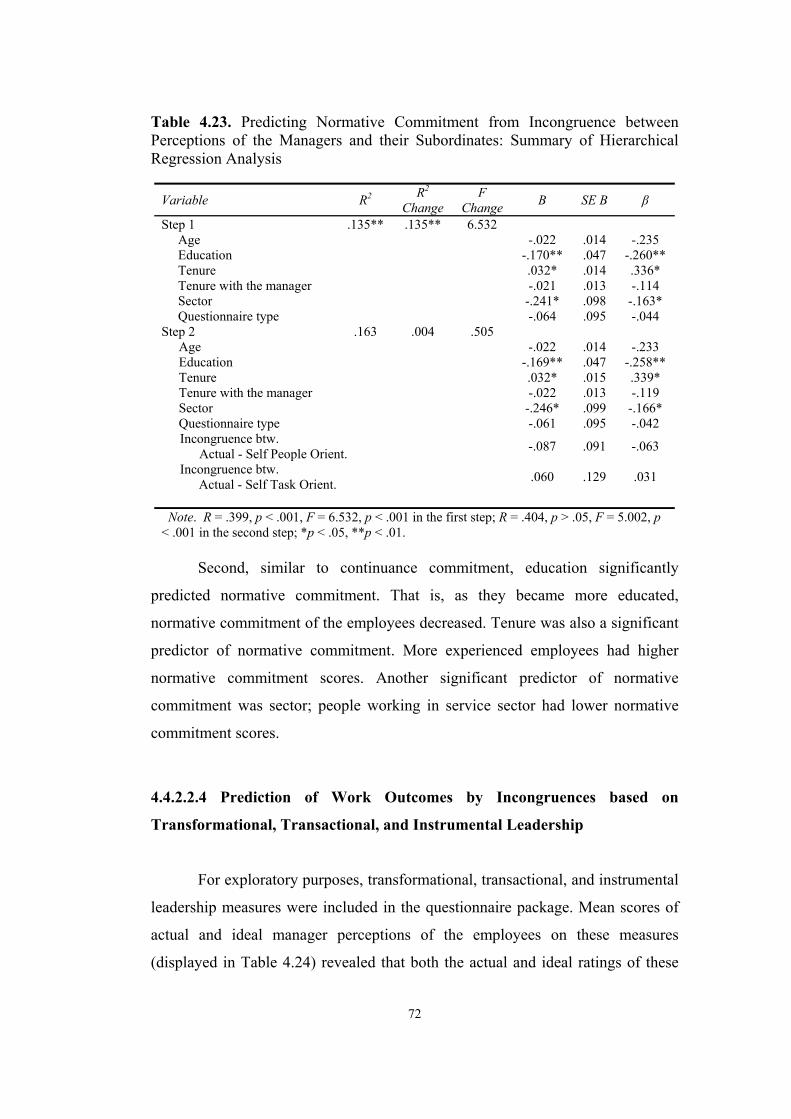
72
Table 4.23. Predicting Normative Commitment from Incongruence between Perceptions of the Managers and their Subordinates: Summary of Hierarchical Regression Analysis
Variable R2 R2 Change
F Change B SE B β
Step 1 .135** .135** 6.532 Age -.022 .014 -.235 Education -.170** .047 -.260** Tenure .032* .014 .336* Tenure with the manager -.021 .013 -.114 Sector -.241* .098 -.163* Questionnaire type -.064 .095 -.044
Step 2 .163 .004 .505 Age -.022 .014 -.233 Education -.169** .047 -.258** Tenure .032* .015 .339* Tenure with the manager -.022 .013 -.119 Sector -.246* .099 -.166* Questionnaire type -.061 .095 -.042 Incongruence btw.
Actual - Self People Orient. -.087 .091 -.063
Incongruence btw. Actual - Self Task Orient. .060 .129 .031
Note. R = .399, p < .001, F = 6.532, p < .001 in the first step; R = .404, p > .05, F = 5.002, p < .001 in the second step; *p < .05, **p < .01.
Second, similar to continuance commitment, education significantly
predicted normative commitment. That is, as they became more educated,
normative commitment of the employees decreased. Tenure was also a significant
predictor of normative commitment. More experienced employees had higher
normative commitment scores. Another significant predictor of normative
commitment was sector; people working in service sector had lower normative
commitment scores.
4.4.2.2.4 Prediction of Work Outcomes by Incongruences based on
Transformational, Transactional, and Instrumental Leadership
For exploratory purposes, transformational, transactional, and instrumental
leadership measures were included in the questionnaire package. Mean scores of
actual and ideal manager perceptions of the employees on these measures
(displayed in Table 4.24) revealed that both the actual and ideal ratings of these

73
measures were higher than task- and people-orientation measures. Among the
three measures, instrumental leadership was the most observed in the current
manager and also the most desirable one for the employees. Ideal manager
prototype of the employees consisted more instrumental leadership behaviors,
than presented by their current managers.
Table 4.24. Subordinate Evaluations of Actual and Ideal Managers on Transformational, Transactional, and Instrumental Leadership: Means and Standard Deviations
Variable Mean SD
Actual Manager Transformational L. 3.73 .76
Actual Manager Transactional L. 3.72 .80
Actual Manager Instrumental L. 3.86 .70
Ideal Manager Transformational L. 4.07 .57
Ideal Manager Transactional L. 4.09 .63
Ideal Manager Instrumental L. 4.19 .54
Note. A five-point Likert-type scale was used for all variables, 1 = “Never” and 5 = “Always”.
A series of multiple regression analyses were run in order to find the effect
of incongruence between actual and ideal manager perceptions of employees on
transformational, transactional, and instrumental leadership styles over employee
work outcomes (performance, satisfaction, and commitment). The same control
variables used in the multiple regression analyses on task-and people-orientation
were added to the analyses. The results, as displayed in Tables 4.25, 4.26, and
4.27 revealed a significant predictive ability of those incongruences only on job
satisfaction. In the following paragraphs, results of regression analyses testing the
effects of incongruence of actual and ideal manager perceptions on
transformational, transactional, and instrumental leadership are presented.
Predictive Ability of Transformational Leadership on Job Satisfaction
Job satisfaction was regressed first on the control variables, and then on
the incongruence between actual and ideal manager perceptions of subordinates

74
on transformational leadership. Multiple R was significantly different from zero at
the end of the second step (R = .500, F(7,212) = 9.766, p < .001). Multiple R in
the first step was found to be significant (R = .359, F(6,212) = 5.073, p < .001).
The increment in the second step was also significant (R2 = .250, Finc(1,212) =
.121, p < .001).
Incongruence between actual and ideal manager perceptions of employees
on transformational leadership predicted job satisfaction levels of employees (β =
-.356, p < .01). The closer the actual and ideal manager perceptions of the
employees on transformational leadership, the more satisfied they were. The
results are presented in Table 4.25.
Table 4.25. Predicting Job Satisfaction from Incongruence between Actual and Ideal Manager Perceptions of Subordinates on Transformational Leadership: Summary of Hierarchical Regression Analysis
Variable R2 R2 Change
F Change B SE B β
Step 1 .129** .129** 5.073 Age -.021 .012 -.265 Education -.022 .041 -.040 Tenure .027* .013 .337* Tenure with the manager -.024* .011 -.158* Sector -.343** .085 -.271** Questionnaire type -.169* .083 -.137*
Step 2 .250** .121** 33.166 Age -.014 .011 -.172 Education -.004 .039 -.007 Tenure .019 .012 .235 Tenure with the manager -.020 .010 -.129 Sector -.318** .080 -.251** Questionnaire type -.190* .077 -.154*
Incongruence btw. Actual - Ideal Transformational L. -.146** .025 -.356**
Note. R = .359, p < .001, F = 5.073, p < .001 in the first step; R = .500, p < .001, F = 9.766, p < .001 in the second step; *p < .05, **p < .01.
Predictive Ability of Transactional Leadership on Job Satisfaction
As a second analysis, job satisfaction was regressed first on the control
variables, and then on the incongruence between actual and ideal manager
perceptions of subordinates on transactional leadership. According to the results
(displayed in Table 4.26), multiple R was significantly different from zero at the
end of the second step (R = .493, F(7,212) = 9.406, p < .001). Multiple R in the

75
first step was found to be significant (R = .359, F(6,212) = 5.073, p < .001). The
increment in the second step was also significant (R2 = .243, Finc(1,212) = 30.977,
p < .001).
Incongruence between actual and ideal manager perceptions of employees
on transactional leadership predicted job satisfaction levels of employees (β = -
.374, p < .01). The closer the actual and ideal manager perceptions of the
employees on transactional leadership, the more satisfied they were.
Table 4.26. Predicting Job Satisfaction from Incongruence between Actual and Ideal Manager Perceptions of Subordinates on Transactional Leadership: Summary of Hierarchical Regression Analysis
Variable R2 R2 Change
F Change B SE B β
Step 1 .129** .129** 5.073 Age -.021 .012 -.265 Education -.022 .041 -.040 Tenure .027* .013 .337* Tenure with the manager -.024* .011 -.158* Sector -.343** .085 -.271** Questionnaire type -.169* .083 -.137*
Step 2 .243** .114** 30.977 Age -.015 .011 -.193 Education -.001 .039 -.001 Tenure .021 .012 .254 Tenure with the manager -.020 .010 -.128 Sector -.302** .080 -.239** Questionnaire type -.197* .078 -.159* Incongruence btw.
Actual - Ideal Transactional L. -.144** .026 -.347**
Note. R = .359, p < .001, F = 5.073, p < .001 in the first step; R = .493, p < .001, F = 9.406, p < .001 in the second step; *p < .05, **p < .01.
Predictive Ability of Instrumental Leadership on Job Satisfaction
Lastly, job satisfaction was regressed first on the control variables, and
then on the incongruence between actual and ideal manager perceptions of
subordinates on instrumental leadership. Multiple R was significantly different
from zero at the end of the second step (R = .474, F(7,212) = 8.506, p < .001). As
can be seen in Table 4.27, multiple R in the first step was found to be significant
(R = .359, F(6,212) = 5.073, p < .001). The increment in the second step was also
significant (R2 = .225, Finc(1,212) = 25.482, p < .001).
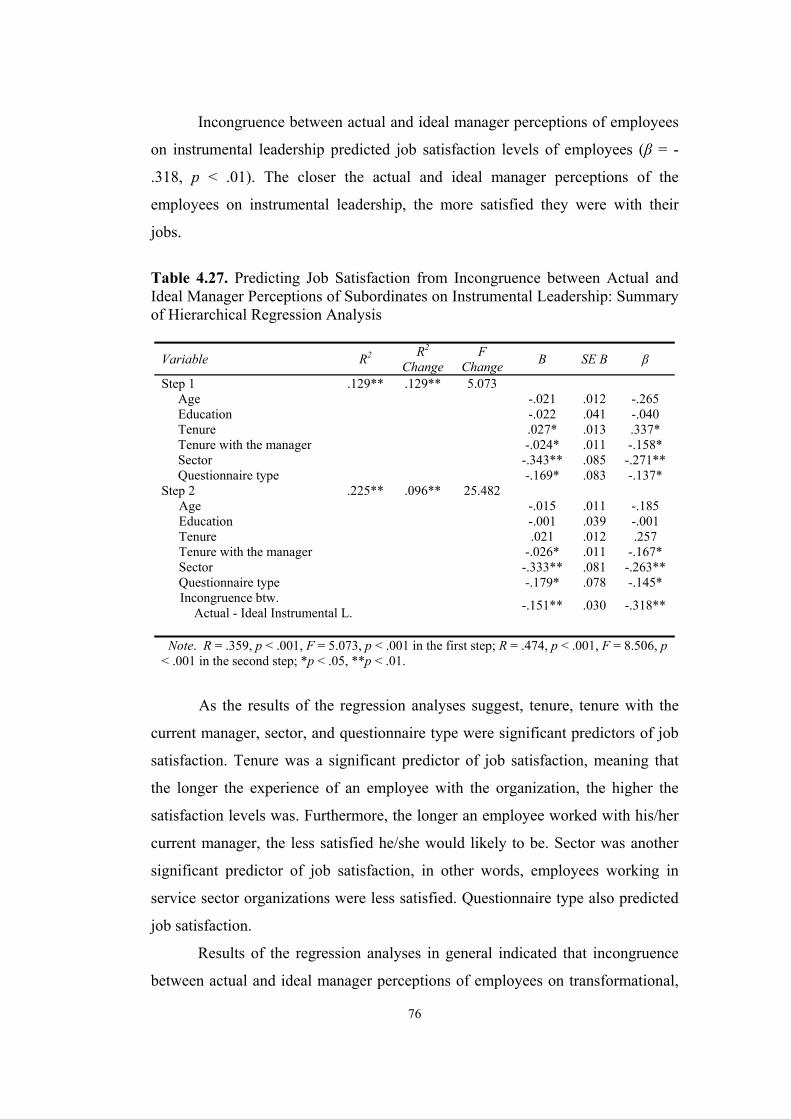
76
Incongruence between actual and ideal manager perceptions of employees
on instrumental leadership predicted job satisfaction levels of employees (β = -
.318, p < .01). The closer the actual and ideal manager perceptions of the
employees on instrumental leadership, the more satisfied they were with their
jobs.
Table 4.27. Predicting Job Satisfaction from Incongruence between Actual and Ideal Manager Perceptions of Subordinates on Instrumental Leadership: Summary of Hierarchical Regression Analysis
Variable R2 R2 Change
F Change B SE B β
Step 1 .129** .129** 5.073 Age -.021 .012 -.265 Education -.022 .041 -.040 Tenure .027* .013 .337* Tenure with the manager -.024* .011 -.158* Sector -.343** .085 -.271** Questionnaire type -.169* .083 -.137*
Step 2 .225** .096** 25.482 Age -.015 .011 -.185 Education -.001 .039 -.001 Tenure .021 .012 .257 Tenure with the manager -.026* .011 -.167* Sector -.333** .081 -.263** Questionnaire type -.179* .078 -.145* Incongruence btw.
Actual - Ideal Instrumental L. -.151** .030 -.318**
Note. R = .359, p < .001, F = 5.073, p < .001 in the first step; R = .474, p < .001, F = 8.506, p < .001 in the second step; *p < .05, **p < .01.
As the results of the regression analyses suggest, tenure, tenure with the
current manager, sector, and questionnaire type were significant predictors of job
satisfaction. Tenure was a significant predictor of job satisfaction, meaning that
the longer the experience of an employee with the organization, the higher the
satisfaction levels was. Furthermore, the longer an employee worked with his/her
current manager, the less satisfied he/she would likely to be. Sector was another
significant predictor of job satisfaction, in other words, employees working in
service sector organizations were less satisfied. Questionnaire type also predicted
job satisfaction.
Results of the regression analyses in general indicated that incongruence
between actual and ideal manager perceptions of employees on transformational,

77
transactional, and instrumental leadership had significant negative predictive
ability on job satisfaction levels of the employees. In other words, as the
discrepancy between perceptions of actual manager’s leadership style and ideal
manager’s leadership style increased, employees became less satisfied with their
jobs.
4.4.2.2.5. Most and Least Preferred Leadership Behaviours: An Item-based
Analysis
Subordinates’ ratings of “actual” and “ideal” manager and managers’ self-
reported leadership ratings were further examined at the item level in order to be
able to grasp the qualitative differences in these perceptions/evaluations. Table
4.28 presents the items with the highest five ratings for actual and ideal managers
as evaluated by subordinates as well as the highest rating five items as reported by
managers themselves. An inspection of the Table 4.28 suggests that managers and
employees had similar ideas regarding leadership in general.
Regarding the least preferred characteristics (presented in Table 4.29),
again similar ideas of employees and managers were observed.
4.4.2.2.6. Effects of Order of the Ideal vs. Actual Leader Items
Both the correlations and regression analyses revealed that the order of the
scales in the questionnaire forms filled by subordinates did make a difference.
That is, it was found that asking about actual manager’s leadership style or asking
about ideal manager’s leadership style first influenced the way subordinate
participants responded the whole questionnaire. This is why the order of the scales
(or the questionnaire type) was used as one of the control variables in the
regression analyses. More specifically, as can be seen in Table 4.28, subordinates
who rated their actual manager first and then their ideal manager had greater job
satisfaction and organizational commitment levels than the ones who rated their
ideal manager first and then their actual manager. Again, employees who rated
their actual manager first had greater ratings on their actual and ideal managers’

78
Table 4.28 Items with Highest Ratings for Subordinates’ Actual and Ideal Managers and for Managers’ Self-Ratings
Subordinate Evaluations Manager Evaluations
Actual Manager Ideal Manager Self-Rating
Being aware of the strengths of the organization (Mean = 4.43)
Being conscious about the problems of the organization (Mean = 4.59)
Appreciating and showing respect to the people (Mean = 4.74)
Being conscious about the problems of the organization (Mean = 4.36)
Appreciating and showing respect to the people (Mean = 4.58)
Being conscious about the problems of the organization (Mean = 4.69)
Expecting his/her subordinates to inform him/her about the decisions made (Mean = 4.35)
Being aware of the strengths of the organization (Mean = 4.57)
Being aware of the strengths of the organization (Mean = 4.60)
Appreciating and showing respect to the people (Mean = 4.34)
Expecting his/her subordinates to inform him/her about the decisions made (Mean = 4.44)
Behaving in accordance with the values he/she has (Mean = 4.53)
Emphasizing meeting of deadlines (Mean = 4.21)
Following the recent developments day by day, which may affect the organization (Mean = 4.43)
Expecting subordinates to be more assertive in their jobs (Mean = 4.49)
Note. All the evaluations were done with a five-point Likert-type scale
Table 4.29 Items with Lowest Ratings for Subordinates’ Actual and Ideal Managers and for Managers’ Self-Ratings
Subordinate Evaluations Manager Evaluations
Actual Manager Ideal Manager Self-Rating
Letting others do their work in the way they think best (Mean = 2.07)
Letting others do their work in the way they think best (Mean = 1.97)
Doing personal favours for people in the work group (Mean = 1.95)
Doing personal favours for people in the work group (Mean = 2.26)
Waiting for people in the work group to push new ideas (Mean = 2.20)
Letting others do their work in the way they think best (Mean = 2.03)
Waiting for people in the work group to push new ideas (Mean = 2.51)
Doing personal favours for people in the work group (Mean = 2.18)
Waiting for people in the work group to push new ideas (Mean = 2.49)
Insisting that everything be done his/her way (Mean = 2.83)
Encourage overtime work (Mean = 2.84)
Encourage overtime work (Mean = 2.65)
Encourage overtime work (Mean = 2.84)
Insisting that everything be done his/her way (Mean = 3.02)
Giving in to others in discussions with the workgroup (Mean = 2.74)
Note. All the evaluations were done with a five-point Likert-type scale

79
people- and task-orientation dimensions than their counterparts who rated made
ratings in the reverse order, the greatest difference was on ideal manager’s task-
orientation.
Table 4.30. Difference in Subordinates’ Ratings Depending on Questionnaire Order: Means and Standard Deviations
First actual manager (N = 122)
First ideal manager (N = 112) Variables
Mean SD Mean SD
Job Satisfaction 3.75 .61 3.53 .64
Affective Commt. 3.97 .69 3.69 .79
Continuance Commt. 3.17 .80 3.04 .67
Normative Commt. 3.66 .69 3.47 .75
Actual Mng. People-Orient. 3.47 .52 3.37 .53
Actual Mng. Task-Orient. 3.59 .49 3.49 .52
Ideal Mng. People-Orient. 3.66 .44 3.56 .48
Ideal Mng. Task-Orient. 3.74 .39 3.53 .45
Note. A five-point Likert-type scale was used for all leadership, job satisfaction, and commitment related items, 1 = “Never” and 5 = “Always” for leadership items; 1 = “Very dissatisfied” and 5 = “Very satisfied” for job satisfaction items; 1 = “Strongly disagree” and 5 = “Strongly agree” for organizational commitment items.
As shown in Table 4.30, managers who rated their own leadership style as
presumed by their subordinates first and then evaluated their own leadership style
had greater job satisfaction levels. The greatest difference was in between the self-
ratings on people-orientation level, meaning that managers who rated their own
leadership style first and then made ratings concerning their subordinates’
perceptions rated themselves as being less people-oriented.

80
Table 4.31. Difference in Managers’ Ratings Depending on Questionnaire Order: Means and Standard Deviations
First as perceived (N = 32)
First self-rating (N = 33) Variables
Mean SD Mean SD
Job Satisfaction 3.80 .42 3.69 .55
Self-rating People-Orient. 3.62 .32 3.71 .36
Self-rating Task-Orient. 3.54 .38 3.54 .40
As Perc. People-Orient. 3.64 .34 3.66 .40
As Perc. Task-Orient. 3.57 .40 3.54 .41
Note. A five-point Likert-type scale was used for all leadership and job satisfaction items, 1 = “Never” and 5 = “Always” for leadership items, and 1 = “Very dissatisfied” and 5 = “Very satisfied” for job satisfaction items.
81
CHAPTER V
DISCUSSION
5.1 Overview
The aim of the present study was to investigate the leadership styles of
Turkish middle-level managers, ideal leadership style for the employees by using
the task- and people-orientation taxonomy, and also to examine the effects of
incongruence between actual and ideal manager perceptions of employees on
work outcomes. In the following sections, after briefly reviewing the sample
characteristics and descriptive statistics, findings concerning the hypotheses are
discussed. Implications of the findings are followed by the strengths and
weaknesses of the present study.
5.2. Sample Characteristics and Descriptive Findings
Sample characteristics were investigated in terms of their relation with
work outcomes and leadership perceptions. Majority of the manager participants
had less than 10 years of experience as a manager, and also, majority of them had
less than 10 years of experience in their current companies. It seems fair to say
that majority of the managers had built their managerial careers in the companies
they were currently working for.
With regard to the tenure of the subordinates, it was observed that majority
of the incumbents had a job tenure of six to 15 years in general; two to 10 years of
tenure in their current company, and up to five years with their current manager,
suggesting that employees had worked in other companies, and with other
82
managers considerably before they worked in and with their current organization
and manager, respectively. Information regarding tenure of the subordinates can
be interpreted as a relative lack of work experience with the current manager,
which may have resulted in somewhat deficient information about the manager’s
leadership style.
As reported by Wasti (2003), in the present study, there were positive
significant correlations between the three organizational commitment dimensions.
This study also revealed consistent results with the findings of Meyer et al. (1989)
in that there was a positive correlation between affective commitment and
supervisory-rated performance. Consistent with the findings of Mathieu and Zajac
(1990), except for affective commitment, there was no significant relationship
between organizational commitment and performance; and also there was a
significant relationship between job satisfaction and affective commitment.
Regarding the relationship between job satisfaction and performance, no
significant relationship was observed as parallel with the literature (Katzell,
Thompson, & Guzzo, 1992; Locke & Latham, 1990). Additionally, more satisfied
and more committed (affective and normative) incumbents perceived themselves
as being higher performers (in terms of task, contextual, and general
performance). Furthermore, employees with high continuance commitment levels
perceived themselves as high performers not in task performance but in contextual
and overall performance.
It was found that task performance had a relatively higher correlation with
age and contextual performance had a high correlation with age, gender and
tenure in the company and tenure with the manager. Employees who were older
and had shorter working experience in the company and with the manager were
rated as poor performers by their managers. In terms of contextual performance,
managers evaluated females more favorable than males. This may be resulted
from an association of contextual performance and feminine attributes, such as an
overemphasis on relationships (as described by Hofstede, 1991). Regarding self-
ratings, less educated employees evaluated themselves as being relatively low on
contextual performance. This may have resulted from these employees’

83
perception of contextual performance as being irrelevant to performance,
unnecessary/unimportant, or as something negative.
Finally, contrary to the findings in Employment Outlook 2001 (OECD,
2001), in which job satisfaction was reported to be higher in the service-sector
than in the goods-producing sectors in European Union countries, in the present
study, employees working in the service sector companies were found to be less
satisfied than ones in the manufacturing sector. They also had lower affective and
normative commitment than their counterparts in the manufacturing sector.
Moreover, these incumbents had longer job tenure in general but shorter work
experience with their current managers. This can be interpreted as an indication
that employees in the service sector have greater intention to leave/change their
jobs more easily than the ones in manufacturing sector.
5.3 Results of Hypothesis Testing
Three main hypotheses of this study, regarding leadership styles of actual
and ideal managers and predictive ability of the difference between perceptions on
task- and people-orientation taxonomy in terms of employee work outcomes were
investigated separately in the present study. In the following sections, results from
hypotheses testing are discussed.
5.3.1. Leadership Style of the Managers
The first hypothesis of this study had two parts as managers’ leadership
styles were examined by using two sources: managers themselves and their
subordinates. The first part of the hypothesis (Hypothesis 1a) stated that the self-
reported leadership styles of the managers would be more people-oriented than
task-oriented. The second part of the hypothesis (Hypothesis 1b) stated that
leadership styles of the managers would be more task-oriented than people-
oriented as perceived by their job incumbents.
Direct support for Hypothesis 1a was not obtained in the present study. Yet,
as a tendency, managers perceived themselves as more people-oriented than task-

84
oriented. Results of the analyses provided support for Hypothesis 1b, that is,
employees perceived their managers’ leadership style as more task-oriented than
people-oriented. Studies indicated that Turkey is a paternalistic culture (Aycan &
Kanungo, 2000), relatively high on power distance and collectivism (Aycan &
Kanungo, 2000; Hofstede, 1980; Pasa, 2000; İmamoğlu & Karakitapoğlu-Aygün,
1999), with a great importance attributed to relationships and support from
supervisors (Sargut & Özen, 2000). Under such cultural characteristics, Turkish
managers and subordinates can be expected to place more value on personal
relationships, and mutual trust and respect, instead of having an overemphasis on
planning, organizing, and structuring.
As expected, employees perceived their managers’ leadership styles as
being more task-oriented rather than people-oriented. This can be explained by
higher standards and expectations concerning people-orientation of managers on
the part of the subordinates. That is, subordinates seemed to have quite high
expectations concerning people-orientation, such that, it is almost impossible for
managers to meet these high expectations. This interpretation was also supported
by the significant difference/discrepancy between ideal and actual managers’
people-oriented behaviours.
5.3.2. Leadership Style of Ideal Managers
The second hypothesis of the study was that subordinates would have a
leadership prototype consisting more people-oriented behaviours than task-
oriented behaviours. Based on the cultural characteristics examined in the
literature (e.g., Hofstede, 1980; Aycan & Kanungo, 2000; and Sargut & Özen,
2000), it was expected that ideal managers for the employee participants would be
more people-oriented than task-oriented. This hypothesis was not supported, as
employees evaluated their ideal managers as being high on both people- and task-
orientation, without any significant difference between the two dimensions.
This finding is, in fact, not inconsistent with the literature that effective or
more desirable leaders are high on both people- and task-oriented behaviours

85
(Blake & Mouton, 1964; Misumi & Peterson 1985). That is, employees desire
both people- and task-oriented behaviours from their managers.
Furthermore, in the present study, the difference between actual and ideal
manager perceptions was greater for people-oriented behaviours. In other words,
compared with task-orientation, employees thought that their managers were far
less people-oriented than they wanted them to be. This difference can be
explained with the greater importance attributed by the employees to people-
oriented behaviours.
At the item level, employees and managers considered some leadership
characteristics as being more desirable than others. These were consciousness and
awareness about the weaknesses and strengths of the organization, appreciation
and respect towards people, and expectation of being informed about all the
decisions made. Similarly, the least desirable leadership characteristics for the
employees and managers were letting others do their work in the way they think
best, doing personal favours for people in the work group, waiting for people in
the work group to push new ideas, encouraging overtime work, and insisting that
everything be done manager’s way. When the most and least favourable leader
characteristics were considered together, a strategic, authoritative, and also
considerate or caring, less participative or more decisive leader image together
with a belief in equal treatment of employees and the ability or tendency to show
respect and appreciation towards the employees emerged.
Interestingly, it was found that the order of inquiring about ideal or actual
leader first was found to influence the way subordinate participants responded the
rest of the scales in the questionnaire. That is, the ones, who did not expect that
they would also rate ideal leaders (i.e., the ones who rated their actual managers
first), provided higher ratings on their job satisfaction and organizational
commitment. On the other hand, those who first rated their ideal leaders had lower
job satisfaction and organizational commitment together with lower ratings of
task- and people-orientation levels of their actual and ideal managers. It is
possible that rating ideal managers first could have increased the standards and
expecteations of the subordinate participants concerning their manager, job, and
organization. In other words, subordinates may have felt that their managers were

86
not performing as good as their ideal managers, and this may have resulted in
relatively lower levels of not only job satisfaction and organizational
commitment, but also lower levels of task- and people-oriented behaviours of
their managers.
5.3.3. Congruence of Leadership Style Perceptions and Work Outcomes
The third hypothesis of the study was about the effects of incongruence
between actual and ideal manager perceptions of employees on performance (task
and contextual performance), job satisfaction, and organizational commitment
(affective, continuance, and normative commitment) levels of the employees.
Hypothesis 3 was only partially supported, as only job satisfaction was predicted
by incongruence.
More specifically, the results of the hierarchical regression analyses
revealed that the difference between actual and ideal manager perceptions of
subordinates on people-orientation was a significant predictor of job satisfaction.
Ideal-actual leadership perceptions congruence seemed to be especially critical for
people-orientation dimension rather than task-orientation dimension, providing
further support for the importance of people-oriented behaviours for Turkish
employees. Similarly, the difference between self-perceptions of the managers and
their subordinates’ evaluations regarding their managers on people-orientation
significantly predicted job satisfaction.
All told, the results indicated that perceptual differences (of managers and
employees and of actual and ideal manager) in people-oriented leadership style
had predictive ability in terms of job satisfaction: the closer the actual and ideal
manager perceptions of the employees regarding people-oriented leadership
behaviours, the more satisfied were the employees. Similarly, the smaller the
difference between managers’ self-evaluations and subordinates’ evaluations
concerning the people-oriented leadership behaviours, the more satisfied were the
employees.

87
5.3.4. A General Discussion of Actual and Ideal Managers’ Leadership Styles
and Relationship between Congruence of Leadership Style Perceptions and
Work Outcomes
The findings of the present study indicated that actual leadership style of
the managers (as perceived by themselves) was somewhat more people-oriented
(although not significant) than task-oriented, while subordinate perceptions
concerning their managers’ leadership style was the opposite. The ideal leadership
schema of the employees consisted of higher levels of both people- and task-
oriented leadership behaviours, than possessed by their actual managers.
The findings in the literature concerning person-supervisor fit suggest
strong relationships especially between person-supervisor fit and job satisfaction
(.44), and also between person-supervisor fit and organizational commitment, and
overall performance (09, and .11, respectively) as reported by Kristof-Brown,
Zimmerman, and Johnson (2005). Results of the present study were consistent
with the literature to some degree. That is, the incongruence between actual and
ideal manager perceptions of employees on people-orientation and task-
orientation dimensions of leadership was significantly related with job satisfaction
(.24 for people-orientation and .27 for task-orientation). The difference between
actual and ideal manager perceptions of employees on task-orientation was
significantly related with supervisory-rated task and general performance (.16).
Contrary to the expectations, no significant relationship between incongruence
measures and dimensions of organizational commitment was observed in the
present study. Job satisfaction, task performance, and general performance were
associated with the difference between actual and ideal manager perceptions of
employees.
Concerning the predictive ability of incongruence scores, in the current
study, only the perceptual differences regarding people-oriented leadership
behaviours (i.e., incongruence) significantly predicted job satisfaction. The degree
of employee satisfaction was affected negatively by the difference between the
actual and ideal managers’ people-oriented behaviours. When subordinates
perceived a great difference between their actual and ideal managers in terms of
88
people-oriented behaviours, they tended to be less satisfied with their jobs.
Similarly, when managers’ self-evaluations and employees’ evaluations of these
managers differed on people-orientation, employees were again less satisfied.
Additional analyses conducted on transformational, transactional, and
instrumental leadership measures suggested that irrespective of the task- and
people-orientation taxonomy, it can be claimed that the degree of the perceptual
differences between actual and ideal manager evaluations would influence
employee satisfaction or dissatisfaction.
There could be several plausible explanations for observing an effect of
congruence on job satisfaction but not on performance or commitment. In the
present study, congruence between actual and ideal manager leadership
perceptions (as well as between self-reported and subordinate reported actual
leadership behaviours/perceptions) on people-oriented behaviours had a positive
effect on job satisfaction only. It makes sense that fulfillment of expectations,
especially concerning relationships, rather than how the job itself or the tasks are
handled, would have an effect on job satisfaction.
As suggested in the literature, in the Turkish context (Sargut, 2001), the
value attached to establishment and maintenance of good relationships seems
much higher than the value attached to the work or job itself. This interpretation
can explain why incongruence of people-orientation had an effect on satisfaction
but not on performance. Yet, future studies are needed to examine why
incongruence on task-oriented behaviours also failed to have an effect on job
performance.
A plausible explanation for not observing an effect of incongruence on
commitment could be, unlike job satisfaction, which is very likely to be reflected
by immediate work-related factors (such as the leader, coworkers, work load,
etc.), organizational commitment may be less prone to the immediate influence of
the leader or the job-related characteristics.

89
5.4 Implications of the Findings
Findings of the present study have important theoretical and practical
implications. First, results indicated that a significant portion of the variance in
job satisfaction could be explained by the congruence of actual-ideal leadership
perception on people-orientation. More generally, job satisfaction appeared to be a
matter of fulfillment of expectations. This, in itself, seems to be a significant
theoretical contribution. This contribution could be enhanced if the same effects
could also be shown for other outcome variable, such as performance and
commitment. Hence, future studies, using a more sound methodology (in terms of
measures, the leadership taxonomy, and the fit indices used), are needed to further
explore the effects of congruence on other organizational outcomes.
Results of the present study indicated relatively greater importance
attached to people-oriented leader behaviours than task-oriented behaviours. This
information could be used to help managers understand the nature and origins of
some of the problems emerging in the work context between them and their
subordinates as well as to help them understand, and perhaps modify, their
leadership behaviours in a given context.
Along the same lines, results of this study suggested that there was a
significant relationship between employee job satisfaction and congruence
between leadership style perceptions. It can be proposed that in order to sustain
employee job satisfaction, managers should perform leadership behaviours, which
are desirable for the employees. Indeed, programs or interventions could be
developed in which managers are informed about the expectations of their
subordinates on leadership behaviours.
5.5 Strengths of the Study
It is important to note several strengths of the present study. First strength
is associated with the relative representativeness of the participative organizations.
Data were collected from private sector companies in a number of industries like
aerospace, textile, food, construction, and tourism. More importantly, the
90
participating companies were located in a wide range of different geographical
regions of the country, and were not in the metropolitan cities only. In these
regards, the findings are considered quite credible.
Another strength is that the data were collected from multiple sources:
managers and their subordinates. Specifically, not only the self-ratings of
managers on their own leadership styles, but also subordinate ratings on their
manager’s leadership styles were obtained. Furthermore, job performance ratings
of the employees were obtained from their managers.
Also, not only the incongruence between actual and ideal manager
perceptions of the employees, but also the incongruence between self-reported
leadership behaviours and employee evaluations of actual leader behaviours were
compared, providing a broader perspective in perceptual differences. Finally,
besides people- and task-orientation taxonomy, transformational, transactional,
and instrumental leadership were investigated for exploratory purposes.
5.6 Limitations of the Study and Suggestions for Future Research
An important limitation of the present study was the use of a Western-
based taxonomy in interpreting leadership behaviours. Use of a culture-based
taxonomy could have provided results different from the reported ones.
Related to the above concern, results of the factor analyses on leadership
measure used did not provide an interpretable factor structure. Again, the use of a
culture-specific scale may have yielded a more interpretable factor structure and
different results. Future studies using different taxonomies and/or culture specific
measures are needed.
In the present study, a measure of subjective fit was used with the indirect
assessment through comparisons made by the same source (i.e., job incumbents).
Instead of subjective fit, a direct assessment of compatibility between person and
supervisor could have been used. Furthermore, as argued by Kristof-Brown et el.
(2005), similarity between managers’ self descriptions and employee descriptions
of the managers (i.e., perceptual similarity) may not have assessed the fit, but the
accuracy of the perceptions. Additionally, besides the difference score,

91
polynomial regression approach could have been used, since it is reported to
produce qualitative explorations of employees’ cognitive schemas and to be a
more precise tool for investigating the impact of fit. Related to this limitation, the
use of multidimensional congruence measures (i.e., not only person-supervisor fit,
but also person-organization, person-environment, person-group, person-job and
person-vocation fit) can be suggested for future studies. At least, person-group fit
can be investigated with respect to its association with person-supervisor fit,
which was reported by Kristof-Brown and her collegues (2005).
In order to explore the effect of leadership and leadership perceptions and
to differentiate the individual effects of leadership, other possible variables (e.g.,
personalities, values, and coworkers of the participants, job and organizational
characteristics) could have been included in the design of the study. Future
research may include situational variables or characteristics that are likely to
affect or contribute to the relationship between incongruences and work
outcomes.
Finally, the data in this study were collected using a cross-sectional
approach. A longitudinal analysis may allow for a more accurate test of the
present hypotheses.

92
REFERENCES
Allen, N. J. & Meyer, J. P. (1990). The measurement and antecedents of affective,
continuance, and normative commitments to the organization. Journal of Occupational Psychology, 63: 1-8.
Antonakis J., & House R. J. (2004). On instrumental leadership: Beyond transactions and transformations. Paper presented at the Gallup Leadership Institute Conference, University of Nebraska.
Aycan, Z. & Kanungo, R. N. (2000). The impact of societal culture on organizational culture and human resource practices (in Turkish). In Z. Aycan (Ed.), Management, leadership, and human resource practices in Turkey (pp. 25-53). Ankara: Turkish Psychological Association.
Aycan, Z., Kanungo, R. N, Mendonca, M., Yu, K., Deller, J., Stahl, G., &
Kurshid, A. (2000). Impact of culture on human resource management practices: A 10-year comparison. Applied Psychology: An International Review, 49, 192-221.
Aycan, Z. & Pasa, S. (2003). Career choices, job selection criteria, and leadership
preferences in a transitional nation: The case of Turkey. Journal of Carrer Development, 30, 129-144.
Barling, J., Weber, T., & Kelloway, E. K. (1996). Effects of transformational
leadership training and attitudinal and fiscal outcomes: A field experiment. Journal of Applied Psychology, 81, 827–832.
Bass, B. M. (1985). Leadership and performance beyond expectations. New
York: Free Press. Bass, B. M. (1990). Bass & Stodgill’s handbook of leadership: Theory, research,
and applications (3rd ed.). New York: The Free Press. Bass, B. M., & Avolio, B. J. (1994). Increasing organizational effectiveness
through transformational leadership. Thousand Oaks, CA: Sage Publications Inc.
93
Benkhoff, B. (1997). Ignoring Commitment is Costly: New Approaches Establish the Missing Link between Commitment and Performance, Human Relations, 50 (6), 701-726.
Bilgiç, R. (1998). The relationship between job satisfaction and personal
characteristics of Turkish workers. The Journal of Psychology, 132 (5), 549-557.
Blake & Mouton, (1964). The managerial grid. Houston: Gulf Publishing. Borman, W. C., & Motowidlo, S. J. (1993). Expanding the Criterion Domain to
Include Elements of Contextual Performance. In N. Schmitt, W. C. Borman, A. Howard, A. Kraut, D. Ilgen, B. Schneider, & S. Zedeck (Eds.), Personnel Selection in Organizations (pp. 71-98). San Francisco: Jossey-Bass.
Brodbeck, F. J. et al. (2000). Cultural variation of leadership prototypes across 22
European countries. Journal of Occupational and Organizational Psychology, 73, 1-29
Burns, J. M. (1978). Leadership. New York: Harper & Row. Boyacıgiller, N. A. (2000). Lessons for Turkish managers from organizational
science. (in Turkish). In Z. Aycan (Ed.), Management, leadership, and human resource practices in Turkey (pp. 25-53). Ankara: Turkish Psychological Association.
Casimir, G. (2001). Combinative aspects of leadership style The ordering and
temporal spacing of leadership behaviours. The Leadership Quarterly, 12, 245–278.
Chemers, M. M. (1997). An integrative theory of leadership. Mahwah, NJ:
Lawrence Erlbaum Associates.
Cohen, A. (1993). Organizational commitment and turnover: A meta-analysis. Academy of Management Journal, 36, 1140-1157.
Conger, J. & Hunt, J. G. (1999). Charismatic and transformational leadership: taking stock of the present and the future. Leadership Quarterly, 10:2, 121-128.
Conger, J. A., & Kanungo, N. (1987). Toward a behavioral theory of charismatic
leadership in organizational settings. Academy of Management Review, 12, 637–647.
Conger, J. A., & Kanungo, N. (1994). Charismatic leadership in organizations:
Perceived behavioral attributes and their measurement. Journal of Organizational Behavior, 15, 439–452.
94
Cronshaw, S. F., & Lord, R. G. (1987). Effects of categorization, attribution, and
encoding processes on leadership perceptions. Journal of Applied Psychology, 72, 97–106.
Dorfman, P. W., Howell, J. P., Hibino, S., Lee, J. K., Tate, U., & Bautista, A.
(1997). Leadership in Western and Asian countries: Commonalities and differences in effective leadership processes across cultures. Leadership Quarterly, 8, 233-274.
Dunegan, K. J., Duchon, D., & Uhl-Brien, M. (1992). Examining the link between
leader-member exchange and subordinate performance: The role of task analyzability and variety as moderators. Journal of Management, 18, 59-76.
Edwards, J. R. (1993). Problems with the use of profile similarity indices in the
study of congruence in organizational research. Personnel Psychology, 46, 641–665.
Edwards, J. R. (1994). Alternatives to difference scores as dependent variables in
the study of congruence in organizational research. Organizational Behavior and Human Decision Processes, 64, 307–324.
Ekvall, G., & Arvonen, J. (1991). Change-centred leadership: An extension of the
two-dimensional model. Scandinavian Journal of Management, 7, 17-26. Elenkov, D. S. (2002). Effects of leadership on organizational performance in
Russian companies. Journal of Business Research, 55, 467– 48. Ensari, N., & Murphy, S. E. (2003). Cross-cultural variations in leadership
perceptions and attribution of charisma to the leader. Organizational Behavior and Human Decision Processes, 92, 52–66.
Ergin, C. & Kozan, K. (2004). Çalışanların Temel Değerleri ve Dönüşümsel ve Etkileşimsel Liderlerin Çekiciliği. Türk Psikoloji Dergisi, 19 (54), 37-51. Erthart, M. G., & Klein, K. J. (2001). Predicting followers’ preferences for
charismatic leadership: The influence of follower values and personality. The Leadership Quarterly, 12, 153-179.
Etzioni, A. (1961). A comparative analysis of complex organizations. New York:
Free Press. Fleishman, E. A. (1953) The description of supervisory behaviour. Journal of
Applied Psychology, 37 (1), 1-6.

95
Giannantonio, C. M., Olian, J. D., & Carroll, S. J. (1995). An experimental study of gender and situational effects in a performance evaluation of a manager. Psychological Reports, 76, 1004–1006.
Göregenli, M. (1995). Kültürümüz açısından bireycilik-toplulukçuluk eğilimleri:
Bir başlangıç çalışması [Individualism–collectivism orientations in the Turkish culture: A preliminary study]. Türk Psikoloji Dergisi, 10, 1–14.
Göregenli, M. (1997). Individualist and collectivist tendencies in a Turkish
sample. Journal of Cross-Cultural Psychology, 28, 787–794. Graen, G., & Cashman, J. F. (1975). A role-making model of leadership in formal
organizations: A developmental approach. In James G. Hunt & Lars L. Larson (Eds.). Leadership frontiers (pp. 143-165). Kent, OH: Kent State University Press.
Graen, G. B., & Uhl-Bien, M. (1995). Relationship-based approach to leadership:
Development of leader-member exchange (LMX) theory of leadership over 25 years: Applying a multi-level multi-domain perspective. Leadership Quarterly, 6 (2), 219-247.
Hall, R. J., & Lord, R. G. (1995). Multi-level information-processing explanations
of followers’ leadership perceptions. The Leadership Quarterly, 6, 265–287. Hartog, N. D., House, R. J., Hanges, P.J., Ruiz-Quintanilla, S. A., Dorfman, P.
W., & GLOBE Associates (1999). Culture specific and cross-culturally generalizable implicit leadership theories: Are attributes of charismatic/transformational leadership universally endorsed? Leadership Quarterly, 10, 219–256.
Hater, J. J., & Bass, B. M. (1988). Superiors’ evaluations and subordinates’
perceptions of transformational and transactional leadership. Journal of Applied Psychology, 73, 695–702.
Hersey, P., & Blanchard, K. (1982). Management of organizational behavior:
utilizing human resources (4th ed.). Englewood Cliffs, NJ: Prentice-Hall. Hersey, P., Blanchard, K., & Johnson, D. E. (2001). Management of
organizational behavior: leading human resources (8th ed.). Englewood Cliffs, NJ: Prentice-Hall.
Hofstede, G. (1980). Culture’s consequences: International differences in work
related values. Beverly Hills, CA: Sage. Hofstede, G. (1991). Cultures and organizations: software of the mind. London:
MacGraw-Hill.

96
Hofstede G. (1993). Cultural constraints in management theories. Academy of Management Executive, 7, 81–94.
House, R. J. (1971). A path–goal theory of leader effectiveness. Administrative
Science Quarterly, 16, 321–338. House, R. J. (1977). A 1976 theory of charismatic leadership. In: J. G. Hunt, & L.
L. Larson (Eds.), Leadership: the cutting edge (pp. 189–207). Carbondale: Southern Illinois Univ. Press.
House, R. J., Hanges, P. J., Ruiz-Quintanilla, S. A., Dorfman, P. W., Jaivdan, M.,
Dickson, M., Gupta, V., and 170 co-authors (1999). Cultural influences on leadership and organizations: Project GLOBE. In W. Mobley (Ed.), Advances in Global Leadership (Vol. l, pp. 171–233). San Francisco: JAI Press.
House, R. J., Javidan, M., Hanges, P., & Dorfman, P. (2002). Understanding
cultures and implicit leadership theories: An introduction to project GLOBE. Journal of World Business, 37, 3-1.
House, R. J., Wright, N. S., & Aditya, R. N. (1997). Cross-cultural research on
organizational leadership: A critical analysis and a proposed theory. In P. C. Early, & M. Erez (Eds.), New perspectives in international industrial organizational psychology (pp. 535-625). San Francisco: New Lexington.
Howell, J. M., & Avolio B. J. (1993). Transformational leadership, transactional
leadership, locus of control and support for innovation. Journal of Applied Psychology, 78, 891–902.
Ilgen, D. R. (1971). Satisfaction with performance as a function of the initial level
of expected performance and the deviation from expectations. Organizational Behavior and Human Performance, 6, 345-361.
İmamoğlu, E. O. (1998). Individualism and collectivism in a model and scale of
balanced differentiation and integration. The Journal of Psychology, 132, 95–105.
İmamoğlu, E. O., & Karakitapoğlu-Aygün, Z. (1999). 1970’lerden 1990’lara
değerler: Üniversite düzeyinde gözlenen zaman, kuşak ve cinsiyet farklılıkları [Value preferences from 1970s to 1990s: Cohort, generation and gender differences at a Turkish university].Türk Psikoloji Dergisi, 14, 1–22.
İmamoğlu, E. O., & Karakitapoğlu Aygün, Z. (2002). Value domains of Turkish
adults and university students. Journal of Social Psychology, 14, 333-351. İmamoğlu, E. O., Küller, R., Imamoğlu, V., & Küller, M. (1993).The social
psychological worlds of Swedes and Turks in and around retirement. Journal of Cross-Cultural Psychology, 24, 26–41.
97
Jöreskog, K. G. & Sörbom, D. (1996). LISREL 8.3 User’s reference guide.
Chicago: Scientific Software International, Inc. Jung, D. I., & Avolio, B. J. (1999). Effects of leadership style and followers’
cultural orientation on performance in group and individual task conditions. Academy of Management Journal, 42, 208–218.
Jung, D. I., Bass, B. M., & Sosik, J. J. (1995). Bridging leadership and culture: A
theoretical consideration of transformational leadership and collectivistic cultures. Journal of Leadership Studies, 2, 3–18.
Kabasakal, H. & Bodur, M. (2002). Arabic cluster: A bridge between east and
west. Journal of World Business, 37, 40-54. Kağıtçıbaşı, Ç. (1990). Family and socialization in cross-cultural perspective: A
model of change. In J. Berman (Ed.) Nebraska Symposium on Motivation: Cross-cultural perspectives (pp. 135–200). Lincoln: University of Nebraska Press.
Kağıtçıbaşı, Ç. (1994). A critical appraisal of individualism and collectivism:
Toward a new formulation. Individualism and collectivism: Theory, method, and applications. In: Kim, Uichol (Ed); pp. 52-65. Thousand Oaks, CA, US:
Katz, D. (1964), The motivational basis of organizational behaviour. Behavioral
Science, 9,131-133. Katzell, R. A. & Austin, J. T. (1992). From then to now: The development of
industrial-organizational psychology in the United States. Journal of Applied Psychology, 77 (6), 803-835.
Katzell, R. A., Thompson, D. E., & Guzzo, R. A. (1992). How job satisfaction and
job performance are and are not linked. In C. J. Cranny, P. C. Smith, & E. F. Stone (Eds.) Job satisfaction, 195-218. New York: Lexington Books.
Kirkpatrick, S. A. & Locke, E. A. (2003). Leadership: do traits matter? In: J. L.
Pierce & J. W. Newstorm (Eds.), Leaders & the leadership process: readings, self-assessments & applications (pp. 76-81). New York: McGraw-Hill/Irwin.
Kozan, M. K. (1989). Cultural influences on styles of handling interpersonal
conflicts: Comparisons among Jordanian, Turkish, and U.S. managers. Human Relations, 42, 787-789.
Kozan, M. K. & İlter, S. S. (1994). Third-party roles played by Turkish managers
in subordinates’ conflicts. Journal of Organizational Behavior, 15, 453-466.

98
Kozan, M. K. & Ergin, C. (1998). Preference for third party-help in the United States and Turkey. Journal of Cross-Cultural Psychology, 29, 525-539.
Kristof, A. L. (1996). Person-organization fit: An integrative review if its
conceptualisations, measurement, and implications. Personnel Psychology, 49, 1-49.
Kristof-Brown, A. L., Zimmerman, R. D. & Johnson, E. C. (2005). Consequences
of Individuals’ fit at work: A meta-analysis of person-job, person-organization, person-group, and person-supervisor fit. Personnel Psychology, 58, 281-342
Locke, E. A. (1976). Nature and causes of job satisfaction. pp.1297-1349 in M. D. Dunnette (Ed.), Handbook of industrial and organizational psychology. Chicago: Rand McNally.
Locke, E. A., & Latham, G. P. (1990). A theory of goal setting and task performance. Englewood Cliffs, NJ: Prentice Hall.
Loke, J. C. F. (2001). Leadership behaviours: Effects on job satisfaction,
productivity and organizational commitment. Journal of Nursing Management, 9 (4), 191-204.
Lord, R. G. (1985). An information processing approach to social perceptions,
leadership, and behavioral measurement in organizations. Research in Organizational Behavior, 7, 87–128.
Lord, R. G., Brown, D. J., & Harvey, J. L. (2001). System constraints on
leadership perceptions, behavior and influence: an example of connectionist level processes. In: M. A. Hogg, & R. S. Tindale (Eds.), Blackwell handbook of social psychology: group processes (pp. 283–310). Oxford, UK: Blackwell.
Lord, R. G., Brown, D. J., Harvey, J. L., & Hall, R. J. (2001). Contextual
constraints on prototype generation and their multilevel consequences for leadership perceptions. The Leadership Quarterly, 12, 311–338.
Lord, R. G., Foti, R. G., & De Vader, C. (1984). A test of leadership
categorization theory: Internal structure, information processing, and leadership perceptions. Organizational Behavior and Human Performance, 34, 343–378.
Lord, R. G., Foti, R. J., & Phillips, J. S. (1982). A theory of leadership
categorization. In: J. G. Hunt, U. Sekaran, & C. A. Schriesheim (Eds.), Leadership: beyond establishment views (pp. 104–121). Carbondale: Southern Illinois Univ. Press.

99
Lord, R. G., & Maher, K. J. (1991). Leadership and information processing. Boston: Routledge.
Lord, R. G., & Smith, W. G. (1999). Leadership and the changing nature of work
performance. In: D. R. Ilgen, & E. D. Pulakos (Eds.), The changing nature of performance: implications for staffing, motivation, and development (pp. 192–239). San Francisco: Jossey-Bass.
Mathieu, J. E. & Zajac, D. M. (1990). A review and meta-analysis of the
antecedents, correlates, and consequences of organizational commitment. Psychological Bulletin, 108, 171-194.
Meyer, J. P., Paunonen, S. V., Gellatly, I. R., Goffin, R. D. & Jackson, D. N.
(1989). Organizational commitment and job performance: It’s the nature of the commitment that counts. Journal of Applied Psychology, 74, 152-156.
McColl-Kennedy, J. R. & Anderson, R. D. (2002). Impact of leadership style and
emotions on subordinate performance. The Leadership Quarterly, 13, 545–559.
Mischel, W. (1979). On the interface of cognition and personality: Beyond the
person/situation debate. American Psychologist, 34, 740–754. Misumi, J., & Peterson, M. (1985). The performance-maintenance (PM) theory of
leadership: Review of a Japanese research program. Administrative Science Quarterly, 30, 198-223.
Motowidlo, S. J., & Schmit, M. J. (1999). Performance assessment in unique jobs.
In D. R. Ilgen & E. D. Pulakos (Eds.), The changing nature of performance (pp. 56-86). San Francisco: Jossey-Bass.
Motowidlo, S. J.& Van Scotter, J. R. (1994). Evidence that task performance
should be distinguished from contextual performance. Journal of Applied Psychology, 74 (4), 475-480.
Mullen, B., Symons, C., Hu, L-T. & Salas, E.. (1988). Group size, leadership
behaviour, and subordinate satisfaction. The Journal of General Psychology, 116 (2), 155-169.
OECD (2001). The characteristics and quality of service sector jobs. In
Employment Outlook. Pasa, S. F. (2000). Leadership characteristics in Turkey (in Turkish). In Z. Aycan
(Ed.), Management, leadership, and human resource practices in Turkey (pp. 25-53). Ankara: Turkish Psychological Association.

100
Pasa, S. F., Kabasakal, H. E., & Bodur, M. (2001). Society, organisations, and leadership in Turkey. Applied Psychology: An International Review, 50 (4), 559-589.
Phillips, J. S., & Lord, R. G. (1981). Causal attributions and perceptions of
leadership. Organizational Behavior and Human Performance, 28, 143–163. Pinder, C. C. (1998). Work motivation in organizational behavior. New Jersey:
Prentice- Hall. Podsakoff, P. M. & Williams, L. J. (1986). The relationship between job
performance and job satisfaction. In E.A. Locke (Ed.), Generalizing from laboratory to field settings (pp.207-254). Lexinton, MA: Lexington Books.
Posner, B. Z. & Kouzes, J. M. (1988). Development and validation of the
Leadership Practices Inventory. Educational and Psychological Measurement, 48, 483-496.
Ralston, D. A., Gustafson, D. J., Cheung, F. M., & Terpstra, R. H. (1993). Differences in managerial values: A study of U.S., Hong Kong, and PRC managers. Journal of International Business Studies, 24, 249-275.
Ralston, D. A., Gustafson, D. J., Elsas, P. M., Cheung, F., & Terpstra, R. H.
(1992). Eastern values: a comparison of managers in the United States, Hong Kong, and the People’s Republic of China. Journal of Applied Psychology, 77, 664-671.
Randal, D. M., & O’Driscoll, M. P. (1997). Affective versus calculative
commitment: Human resource implications. The Journal of Social Psychology, 137 (5), 606-617.
Rush, M. C., Phillips, J. S., & Lord, R. G. (1981). Effects of temporal delay in
rating on leader behavior descriptions: A laboratory investigation. Journal of Applied Psychology, 66, 442–45.
Sargut, S. A. (1996). Liderlik kuramları için bağlamsal bir çerçeve: Kültürler arası
bir yaklaşım. Amme İdaresi Dergisi, 29, 3-17. Sargut, S. A. (2001). Kültürler arası farklılaşma ve yönetim. (Ikinci baskı). İmge
Kitabevi: Ankara. Sargut, S. A. & Özen, Ş. (2000). Çalışanların lider davranışlarına ilişkin
beklentileri: Türkiye üzerine görgül bir araştırma. 8. Ulusal Yönetim ve Organizasyon Kongresi, Nevşehir.

101
Scandura, T. A., & Graen, G. B. (1984). Moderating effects of initial leader- member exchange status on the effects of a leadership intervention. Journal of Applied Psychology, 69, 428-436.
Schein, E. H. (1992). Organizational culture and leadership. (2nd ed.). San
Francisco: Jossey-Bass. Schmitt, N., Borman, W. C., Associates, eds. (1993). Personnel selection in
organizations. San Francisco: Jossey-Bass. Shamir, B. (1992). Attribution of influence and charisma to the leader: The
Romance of Leadership revisited. Journal of Applied Social Psychology, 22, 386–407.
Shamir, B., House, R. J., & Arthur, M. B. (1993). The motivational effects of
charismatic leadership: A self-concept based theory. Organizational Science, 4, 577–594.
Silverthorne, C. (2001). Leadership effectiveness and personality: a cross cultural
evaluation. Personality and Individual Differences, 30, 303-309. Skogstad, A. &, Einarsen, S. (1999). The importance of a change-centred
leadership style in four organizational cultures. Scandinavian Journal of Management, 15, 289-306.
Stogdill, R. M. (1948). Personal factors associated with leadership: A survey of
the literature. In: J. L. Pierce & J. W. Newstorm (Eds.), Leaders & the leadership process: readings, self-assessments & applications (2003, pp. 70-75). New York: McGraw-Hill/Irwin.
Szabo, E., Reber, G., Weibler, J., Brodbeck, F. C., and Wunderer, R. (2001).
Values and behavior orientation in leadership studies: reflections based on findings in three German-speaking countries. The Leadership Quarterly, 12, 219-244.
Triandis, H. C. (1988). Collectivism v. individualism: A reconceptualization of a
basic concept of cross-cultural social psychology. In G. K. Verma & C. Bagley (Eds.), Cross-cultural studies of personality, attitudes and cognition (pp.60-95). London: Macmillan.
Triandis, H. C. (1995). Individualism and collectivism. Westview Press, Inc. Triandis, H. C. (2001). Individualism-collectivism and personality, Journal of Personality, 69: 6, 907-924.

102
Truckenbrodt, Y. B. (2000). The relationship between leader-member exchange and commitment and organizational citizenship behaviour. Acquisition Review Quarterly, 233-244.
Tsui, A. S. et al. (2004). Variation of Leadership Styles Among Chinese CEOs.
Organizational Dynamics, 33, 5–2. Vecchio, R. P. & Boatwright, K. J. (2002). Preferences for idealized styles of
supervision. The Leadership Quarterly, 13, 327–342. Vroom, V. H. (1964). Work and motivation. New York: Wiley. Wasti, S.A.(1999). Organizational commitment in a collectivist culture: The case
of Turkey. Doctoral Dissertation. Illinois At Urbana-Champaign, US. Wasti, A. S. (2003). Organizational commitment, turnover intentions and the
influence of cultural values. Journal of Occupational and Organizational Psychology, 76, 303-321.
Wasti, A. S., Bergman, M. E., Glomb, T. M. & Drasgow, F. (2000). Test of the
cross-cultural generalizability of a model of sexual harassment. Journal of Applied Psychology, 85, 766-778.
Weiss, D. J., Dawis, R. V., England, G. W. & Lofquist, L. H. (1967). Manual for
the Minnesota satisfaction questionnaire. Minnesota Studies in Vocational Rehabilitation, XXII.
Westerman, J. W. & Cyr, L. A. (2004). An Integrative analysis of person-
organization fit theories. International Journal of Selection and Assesment, 12 (3), 252-261.
Xin, K. R. & Pelled, L.H. (2003). Supervisor–subordinate conflict and perceptions
of leadership behavior: a field study. The Leadership Quarterly, 14, 25–4. Yukl, G. (1998). Leadership in organizations. (4th ed.). Englewood Cliffs,
NJ:Prentice-Hall. Yukl, G. (1999). An evaluation of conceptual weaknesses in transformational and
charismatic leadership theories. Leadership Quarterly, 10, 285–305.
103
APPENDICES
APPENDIX A
QUESTIONNAIRE INFORMATION FORM

104
YÖNETİCİ DAVRANIŞLARI ANKETİ

105
YÖNETİCİ DAVRANIŞLARI ANKETİ / .....
Sayın katılımcı,
Bu anket, Orta Doğu Teknik Üniversitesi Endüstri ve Örgüt Psikolojisi Bölümü Yüksek Lisans öğrencisi N. İpek ÖZMEN tarafından Doç. Dr. H. Canan SÜMER’in danışmanlığında yürütülen “Türkiye’de Orta Düzey Yöneticilerin Liderlik Tarzları” konulu tez çalışması kapsamında yapılmaktadır.
Anketin amacı, yöneticilerin liderlik tarzlarını ve bu liderlik tarzlarının çalışanlar tarafından nasıl algılandığını belirlemek ve çalışanların algılamaları ile çalışan performansı, iş tatmini ve organizasyona bağlılığı arasındaki ilişkiyi incelemektir. Bu anlamda sizden anketteki sorulara her bölümde verilen açıklamalar doğrultusunda dikkatli ve özenli yanıtlar vermeniz beklenmektedir.
Anketin en son bölümünde sizden kimlik belirtici bazı bilgiler istenmektedir. Bu bilgiler sadece yönetici-çalışan eşleştirmesini yapabilmek amacıyla toplanacaktır. Kimlik bilgileri hiçbir şekilde kurum içinden ya da dışından kişilerle paylaşılmayacak, sadece araştırma amaçlı kullanılacaktır. Buna ek olarak, anket sorularına verilen bütün cevaplar gizli tutulacak ve anketi uygulayan kişi dışında hiçkimse tarafından incelenemeyecektir.
Değerlendirmenin daha sağlıklı yapılabilmesi için tüm maddelerin cevaplandırılması gerekmektedir. Lütfen, tüm maddeleri dikkatlice okuyunuz ve boş bırakmayınız. Katkılarınız ve yardımlarınız için şimdiden teşekkür ederiz.
Çalışma hakkında detaylı bilgi edinmek veya sorularınız için;
N. İpek ÖZMEN e-mail: ....
Telefon: ....

106
APPENDIX B
TASK-ORIENTATION ITEMS
of
LEADERSHIP OPINION QUESTIONNAIRE (LOQ)
by
Fleishman (1953)

107
Aşağıdaki maddelerin tanımladığı davranışları şu anki yöneticinizin (çalışmalarınızı denetlemekten sorumlu olan ve size birebir yönlendirmelerde bulunan kişi) / size göre ideal bir yöneticinin ne sıklıkla gösterdiğini verilen 5 basamaklı ölçeği kullanarak belirtiniz. Her maddenin sonunda uygun gördüğünüz rakamı daire içine alınız.
1 Hiçbir zaman
2 Nadiren
3 Bazen
4 Sıkça
5 Her zaman
1. Az çalışan elemanlarını daha çok çalışmaları için teşvik eder. 1 2 3 4 5 2. Bütün bir birimin/kuruluşun esenliğini elemanlarının tek tek refahından daha üstün tutar. 1 2 3 4 5
3. Elemanlarının neyi nasıl yapmaları konusunda ayrıntılı kararlar verir. 1 2 3 4 5
4. Elemanlarının aldığı kararlardan kendisini haberdar etmelerini ister. 1 2 3 4 5
5. Kötü yapılan işleri eleştirir. 1 2 3 4 5
6. İşte kendi fikirlerini dener. 1 2 3 4 5
7. Kurallarından taviz vermez bir şekilde yönetir. 1 2 3 4 5 8. Bütün bir birimin iyiliği için elemanlarından fedakarlıkta bulunmalarını ister. 1 2 3 4 5
9. Elemanlarını daha fazla çaba harcamaları konusunda “dürtükler”. 1 2 3 4 5 10. Verilen işlerin zamanında bitirilmesi gerektiğini özellikle belirtir. 1 2 3 4 5
11. Elemanlarının her birine ayrı görevler verir. 1 2 3 4 5 12. Elemanlarıyla yalnızca daha önceden tayin edilmiş zamanlarda toplantılar yapar. 1 2 3 4 5
13. Rakip gruplardan daha önde olmaları konusunda elemanlarına baskı yapar. 1 2 3 4 5
14. Elemanlarının bir işi en iyi bildikleri biçimde yapmalarına izin verir. (R) 1 2 3 4 5
15. Elemanlarından varolan standartlara harfi harfine uymalarını ister. 1 2 3 4 5
16. Sorunlara yeni yaklaşımlar getirir. 1 2 3 4 5 17. Elemanlarını normal süreden (mesai dışında) daha fazla çalışmaları konusunda teşvik eder. 1 2 3 4 5
18. Elemanlarının mümkün olduğunca çok çalışmalarını sağlar. 1 2 3 4 5 19. Ne kadar iş yapılması gerektiği konusunda elemanlarına talimatlar verir. 1 2 3 4 5
20. Elemanlarının yeni fikirler üretmeleri için sabırla bekler. (R) 1 2 3 4 5
108
APPENDIX C
PEOPLE-ORIENTATION ITEMS
of
LEADERSHIP OPINION QUESTIONNAIRE (LOQ)
by
Fleishman (1953)

109
Aşağıdaki maddelerin tanımladığı davranışları şu anki yöneticinizin (çalışmalarınızı denetlemekten sorumlu olan ve size birebir yönlendirmelerde bulunan kişi) / size göre ideal bir yöneticinin ne sıklıkla gösterdiğini verilen 5 basamaklı ölçeği kullanarak belirtiniz. Her maddenin sonunda uygun gördüğünüz rakamı daire içine alınız.
1 Hiçbir zaman
2 Nadiren
3 Bazen
4 Sıkça
5 Her zaman
1. Elemanlarıyla konuşmadan onların görevlerini değiştirebilir. (R) 1 2 3 4 5
2. Elemanlarına danışmadan hareket etmez. 1 2 3 4 5
3. Bir konuda geri adım atmaya karşı çıkar. (R) 1 2 3 4 5
4. Elemanlarına ayrıcalıklar yapar. 1 2 3 4 5
5. Değişikliklere açıktır. 1 2 3 4 5
6. Elemanlarının önerilerini hayata geçirir. 1 2 3 4 5 7. Önemli konularda harekete geçmeden önce elemanlarının onayını alır. 1 2 3 4 5
8. Tek tek kişiler yerine bir davranışı eleştirir. 1 2 3 4 5
9. Sorgulanmaya izin vermez bir tarzda konuşur. (R) 1 2 3 4 5
10. Davranışlarının nedenini açıklamayı reddeder. (R) 1 2 3 4 5 11. Elemanlarıyla fikir ayrılıkları olduğunda kendi fikirlerinden vazgeçebilir. 1 2 3 4 5
12. Herşeyin kendi istediği şekilde yapılması için ısrar eder. (R) 1 2 3 4 5
13. Elemanlarının yapabileceklerinden daha fazla iş ister. (R) 1 2 3 4 5
14. Başkalarının hoşuna gitmese de elemanlarının hakkını savunur. 1 2 3 4 5
15. Değişime yönelik önerilerden hoşlanmaz. (R) 1 2 3 4 5
16. Elemanlarına kendisiyle eşitlermiş gibi davranır. 1 2 3 4 5
17. Elemanlarına kişisel problemlerinde yardımcı olur. 1 2 3 4 5
18. Elemanlarının yaptıklarını destekler. 1 2 3 4 5
19. Yeni fikirleri kabul etmekte ağır davranır. (R) 1 2 3 4 5
20. İşlerin alışılmışın dışında yapılmasına karşı çıkar. (R) 1 2 3 4 5

110
APPENDIX D
TRANSFORMATIONAL LEADERSHIP ITEMS
of
LEADERSHIP PRACTICES INVENTORY (LPI)
by
Posner & Kouzes (1988)
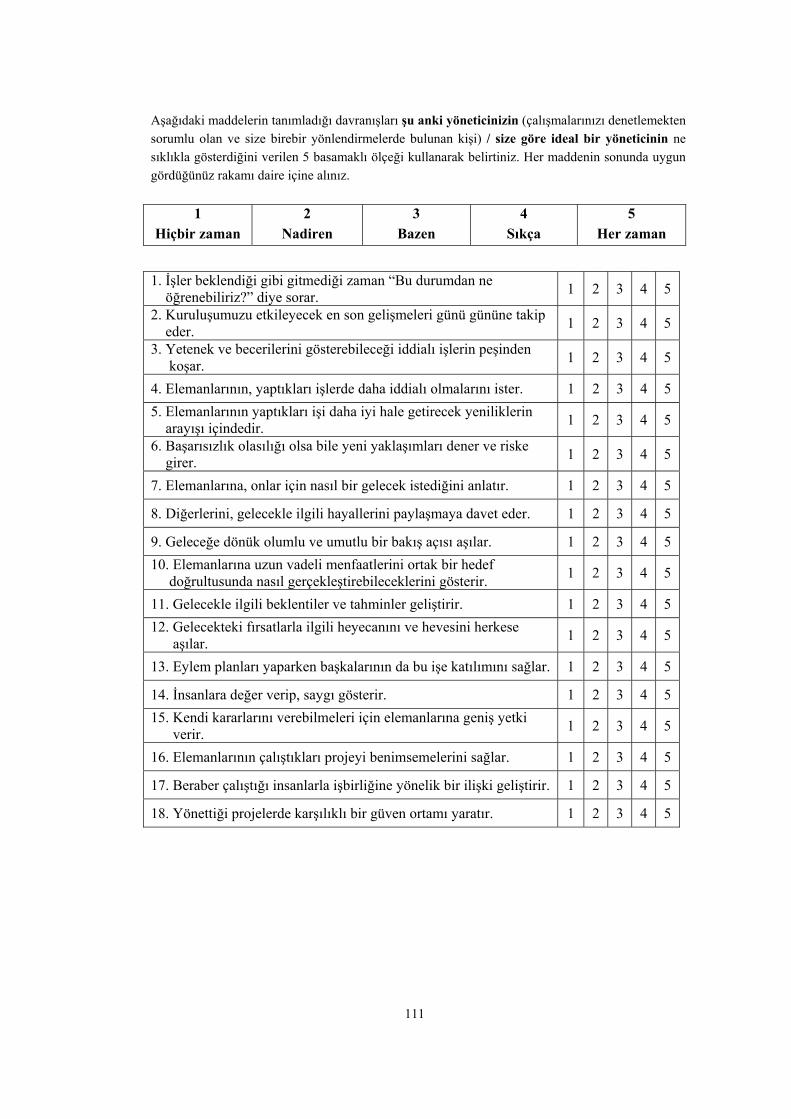
111
Aşağıdaki maddelerin tanımladığı davranışları şu anki yöneticinizin (çalışmalarınızı denetlemekten sorumlu olan ve size birebir yönlendirmelerde bulunan kişi) / size göre ideal bir yöneticinin ne sıklıkla gösterdiğini verilen 5 basamaklı ölçeği kullanarak belirtiniz. Her maddenin sonunda uygun gördüğünüz rakamı daire içine alınız.
1 Hiçbir zaman
2 Nadiren
3 Bazen
4 Sıkça
5 Her zaman
1. İşler beklendiği gibi gitmediği zaman “Bu durumdan ne öğrenebiliriz?” diye sorar. 1 2 3 4 5
2. Kuruluşumuzu etkileyecek en son gelişmeleri günü gününe takip eder. 1 2 3 4 5
3. Yetenek ve becerilerini gösterebileceği iddialı işlerin peşinden koşar. 1 2 3 4 5
4. Elemanlarının, yaptıkları işlerde daha iddialı olmalarını ister. 1 2 3 4 5 5. Elemanlarının yaptıkları işi daha iyi hale getirecek yeniliklerin arayışı içindedir. 1 2 3 4 5
6. Başarısızlık olasılığı olsa bile yeni yaklaşımları dener ve riske girer. 1 2 3 4 5
7. Elemanlarına, onlar için nasıl bir gelecek istediğini anlatır. 1 2 3 4 5
8. Diğerlerini, gelecekle ilgili hayallerini paylaşmaya davet eder. 1 2 3 4 5
9. Geleceğe dönük olumlu ve umutlu bir bakış açısı aşılar. 1 2 3 4 5 10. Elemanlarına uzun vadeli menfaatlerini ortak bir hedef doğrultusunda nasıl gerçekleştirebileceklerini gösterir. 1 2 3 4 5
11. Gelecekle ilgili beklentiler ve tahminler geliştirir. 1 2 3 4 5 12. Gelecekteki fırsatlarla ilgili heyecanını ve hevesini herkese aşılar. 1 2 3 4 5
13. Eylem planları yaparken başkalarının da bu işe katılımını sağlar. 1 2 3 4 5
14. İnsanlara değer verip, saygı gösterir. 1 2 3 4 5 15. Kendi kararlarını verebilmeleri için elemanlarına geniş yetki verir. 1 2 3 4 5
16. Elemanlarının çalıştıkları projeyi benimsemelerini sağlar. 1 2 3 4 5
17. Beraber çalıştığı insanlarla işbirliğine yönelik bir ilişki geliştirir. 1 2 3 4 5
18. Yönettiği projelerde karşılıklı bir güven ortamı yaratır. 1 2 3 4 5

112
APPENDIX E
TRANSACTIONAL LEADERSHIP ITEMS
of
LEADERSHIP PRACTICES INVENTORY (LPI)
by
Posner & Kouzes (1988)

113
Aşağıdaki maddelerin tanımladığı davranışları şu anki yöneticinizin (çalışmalarınızı denetlemekten sorumlu olan ve size birebir yönlendirmelerde bulunan kişi) / size göre ideal bir yöneticinin ne sıklıkla gösterdiğini verilen 5 basamaklı ölçeği kullanarak belirtiniz. Her maddenin sonunda uygun gördüğünüz rakamı daire içine alınız.
1 Hiçbir zaman
2 Nadiren
3 Bazen
4 Sıkça
5 Her zaman
1. Üzerinde anlaşmaya varılmış değerlere bağlı kalınmasını sağlamak için zaman ve enerji harcar. 1 2 3 4 5
2. Kendi liderlik felsefesini çok net bir biçimde ortaya koyar. 1 2 3 4 5 3. Sorumlu olduğu birim/bölümün en iyi nasıl yönetileceği konusundaki inançlarını başkalarına da anlatır. 1 2 3 4 5
4. Sahip olduğu değerlere uygun davranır. 1 2 3 4 5 5. Yönettiği projeleri kolayca halledilebilir parçalara ayırmaya özen gösterir. 1 2 3 4 5
6. Ekibinin kendine açık hedefler saptayıp, planlar yaparak bunların aşamalarını belirlemelerini sağlar. 1 2 3 4 5
7. Önemli aşamalara ulaşıldığında bunları kutlamak için zaman ayırır. 1 2 3 4 5
8. Kendi ekibinin başarılı olduğu işleri, diğer ekiplere de duyurmayı amaçlar. 1 2 3 4 5
9. İyi bir iş çıkarıldığında elemanlarını takdir eder. 1 2 3 4 5 10. Projelerimizin başarısına katkıda bulunanların takdir edilmelerini sağlar. 1 2 3 4 5
11. Kendi ekibindeki kişileri yaptıkları katkılar için destekler ve takdir eder. 1 2 3 4 5
12. Başarıları kutlamanın yollarını bulur. 1 2 3 4 5
114
APPENDIX F
INSTRUMENTAL LEADERSHIP ITEMS
by
Antonakis & House (2004)

115
Aşağıdaki maddelerin tanımladığı davranışları şu anki yöneticinizin (çalışmalarınızı denetlemekten sorumlu olan ve size birebir yönlendirmelerde bulunan kişi) / size göre ideal bir yöneticinin ne sıklıkla gösterdiğini verilen 5 basamaklı ölçeği kullanarak belirtiniz. Her maddenin sonunda uygun gördüğünüz rakamı daire içine alınız.
1 Hiçbir zaman
2 Nadiren
3 Bazen
4 Sıkça
5 Her zaman
1. Hatalardan nasıl kaçınılabileceğine ilişkin olarak elemanlarına gerekli bilgileri verir. 1 2 3 4 5
2. Kendi görüşlerinin kesin ve açık bir şekilde anlaşılmasını sağlar. 1 2 3 4 5
3. Elemanlarının hatalarından ders çıkarmalarına yardım eder. 1 2 3 4 5
4. Bu kuruluşun sorun ve sıkıntılarının bilincindedir. 1 2 3 4 5
5. Dış çevrenin sunduğu fırsatlardan yararlanır. 1 2 3 4 5 6. Elemanlarının hedeflerine ulaşmaları için izlemeleri gereken yolu onlara açıkça anlatır. 1 2 3 4 5
7. Görüşlerini desteklemek için özel politikalar geliştirir. 1 2 3 4 5 8. Elemanlarının hedeflerine ulaşmalarını sağlamak için engelleri ortadan kaldırır. 1 2 3 4 5
9. Kuruluşta nelerin değişmesi gerektiğinin farkındadır. 1 2 3 4 5
10. Elemanlarının hatalarını düzeltmelerine yardım eder. 1 2 3 4 5
11. Bu kuruluşun güçlü yönlerinin farkındadır. 1 2 3 4 5
12. Bir görevin tamamlanabilmesi için detaylı hedefler koyar. 1 2 3 4 5 13. Elemanlarının hedeflerine ulaşmaları için yeterli kaynağa sahip olmalarını sağlar. 1 2 3 4 5
14. Yaptıkları hatalarla ilgili olarak elemanlarına yapıcı geribildirim verir. 1 2 3 4 5
15. Bir görevi belirli hedeflere dönüştürür. 1 2 3 4 5
16. Elemanlarının hedeflerine ulaşmalarını kolaylaştırır. 1 2 3 4 5

116
APPENDIX G
MINNESOTTA SATISFACTION QUESTIONNAIRE (MSQ)
by
Weiss, Dawis, England, & Lofquist (1967)
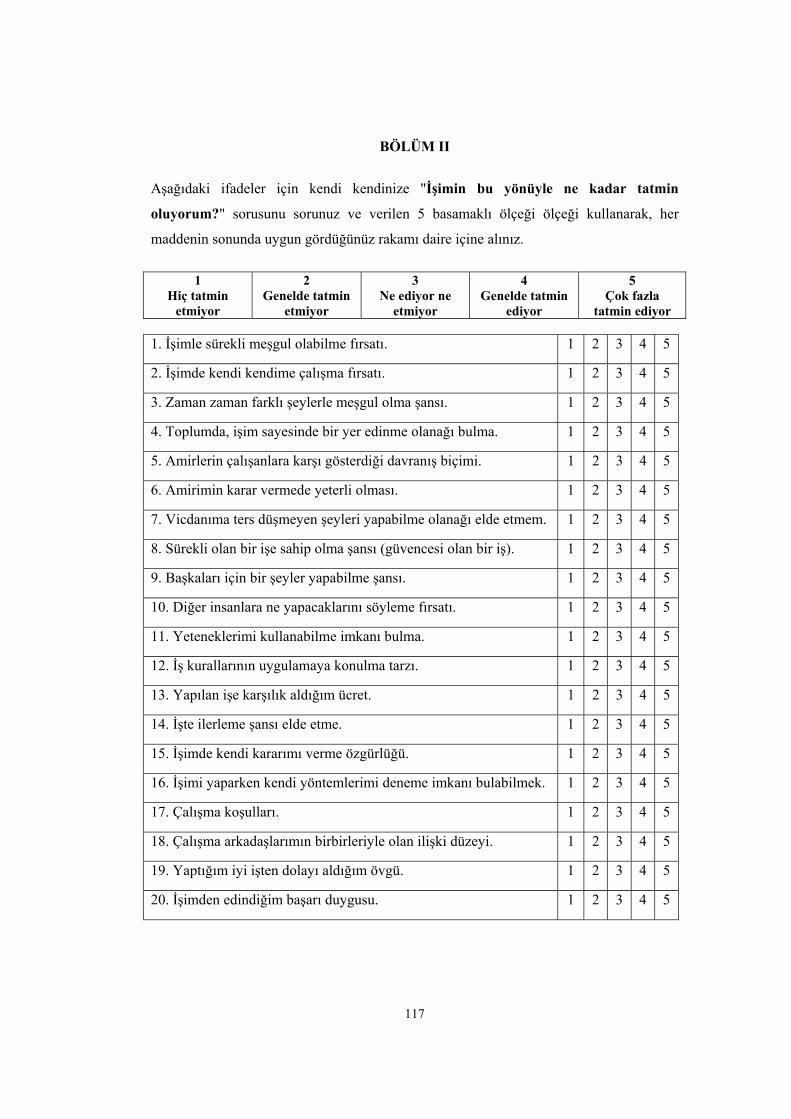
117
BÖLÜM II
Aşağıdaki ifadeler için kendi kendinize "İşimin bu yönüyle ne kadar tatmin
oluyorum?" sorusunu sorunuz ve verilen 5 basamaklı ölçeği ölçeği kullanarak, her
maddenin sonunda uygun gördüğünüz rakamı daire içine alınız.
1. İşimle sürekli meşgul olabilme fırsatı. 1 2 3 4 5
2. İşimde kendi kendime çalışma fırsatı. 1 2 3 4 5
3. Zaman zaman farklı şeylerle meşgul olma şansı. 1 2 3 4 5
4. Toplumda, işim sayesinde bir yer edinme olanağı bulma. 1 2 3 4 5
5. Amirlerin çalışanlara karşı gösterdiği davranış biçimi. 1 2 3 4 5
6. Amirimin karar vermede yeterli olması. 1 2 3 4 5
7. Vicdanıma ters düşmeyen şeyleri yapabilme olanağı elde etmem. 1 2 3 4 5
8. Sürekli olan bir işe sahip olma şansı (güvencesi olan bir iş). 1 2 3 4 5
9. Başkaları için bir şeyler yapabilme şansı. 1 2 3 4 5
10. Diğer insanlara ne yapacaklarını söyleme fırsatı. 1 2 3 4 5
11. Yeteneklerimi kullanabilme imkanı bulma. 1 2 3 4 5
12. İş kurallarının uygulamaya konulma tarzı. 1 2 3 4 5
13. Yapılan işe karşılık aldığım ücret. 1 2 3 4 5
14. İşte ilerleme şansı elde etme. 1 2 3 4 5
15. İşimde kendi kararımı verme özgürlüğü. 1 2 3 4 5
16. İşimi yaparken kendi yöntemlerimi deneme imkanı bulabilmek. 1 2 3 4 5
17. Çalışma koşulları. 1 2 3 4 5
18. Çalışma arkadaşlarımın birbirleriyle olan ilişki düzeyi. 1 2 3 4 5
19. Yaptığım iyi işten dolayı aldığım övgü. 1 2 3 4 5
20. İşimden edindiğim başarı duygusu. 1 2 3 4 5
1 Hiç tatmin
etmiyor
2 Genelde tatmin
etmiyor
3 Ne ediyor ne
etmiyor
4 Genelde tatmin
ediyor
5 Çok fazla
tatmin ediyor

118
APPENDIX H
ORGANIZATIONAL COMMITMENT QUESTIONNAIRE
by
Meyer, Allen, & Smith (1993)

119
BÖLÜM III
Aşağıdaki ifadeler, kişilerin çalıştıkları kuruluşlar hakkında çeşitli duygu ve düşüncelerini yansıtmaktadır. Lütfen bu ifadelere şu anda çalıştığınız kuruluş açısından ne ölçüde katıldığınızı belirtiniz. Her madde için, verilen ölçeği kullanarak katılım derecenizi belirten rakamı daire içine alınız.
AFFECTIVE COMMITMENT ITEMS
1. Meslek hayatımın kalan kısmını bu kuruluşta geçirmek beni çok mutlu eder. 1 2 3 4 5
2. Kuruluşuma karşı güçlü bir aitlik hissim yok. (R) 1 2 3 4 5
3. Bu kuruluşun benim için çok kişisel (özel) bir anlamı var. 1 2 3 4 5 4. Bu kuruluşun meselelerini gerçekten de kendi meselelerim gibi hissediyorum. 1 2 3 4 5
5. Bu kuruluşa kendimi “duygusal olarak bağlı” hissetmiyorum. (R) 1 2 3 4 5
6. Buradaki işimi kendi özel işim gibi hissediyorum. 1 2 3 4 5 7. Kendimi kuruluşumda “ailenin bir parçası” gibi hissetmiyorum. (R) 1 2 3 4 5
8. Bu kuruluşun bir çalışanı olmanın gurur verici olduğunu düşünüyorum. 1 2 3 4 5
9. Bu kuruluşun amaçlarını benimsiyorum. 1 2 3 4 5
CONTINUANCE COMMITMENT ITEMS
1. Şu anda kuruluşumda kalmak istek meselesi olduğu kadar mecburiyetten. 1 2 3 4 5
2. İstesem de, şu anda kuruluşumdan ayrılmak benim için zor olurdu. 1 2 3 4 5
3. Şu anda kuruluşumdan ayrılmak istediğime karar versem, hayatımın çoğu alt üst olur. 1 2 3 4 5
4. Yeni bir işyerine alışmak benim için zor olurdu. 1 2 3 4 5 5. Başka bir işyerinin buradan daha iyi olacağının garantisi yok, burayı hiç olmazsa biliyorum. 1 2 3 4 5
6. Bu işyerinden ayrılıp başka bir yerde sıfırdan başlamak istemezdim. 1 2 3 4 5
7. Bu kuruluştan ayrılmanın az sayıdaki olumsuz sonuçlarından biri alternatif kıtlığı olurdu. 1 2 3 4 5
8. Bu kuruluşu bırakmayı düşünemeyeceğim kadar az seçeneğim olduğunu düşünüyorum. 1 2 3 4 5
9. Eğer bu kuruluşa kendimden bu kadar vermiş olmasaydım, başka yerde çalışmayı düşünebilirdim. 1 2 3 4 5
10. Zaman geçtikçe mevcut kuruluşumdan ayrılmanın gittikçe zorlaştığını hissediyorum. 1 2 3 4 5
1 Hiç
katılmıyorum
2 Katılmıyorum
3Bir parça
katılıyorum
4Katılıyorum
5 Tamamen
katılıyorum

120
NORMATIVE COMMITMENT ITEMS
1. Daha iyi bir imkan çıkarsa, mevcut kuruluşumdan ayrılmamın ayıp olmadığını düşünüyorum. (R) 1 2 3 4 5
2. Bu işyerinden ayrılıp burada kurduğum kişisel ilişkileri bozmam doğru olmaz. 1 2 3 4 5
3. Kuruluşuma çok şey borçluyum. 1 2 3 4 5 4. Buradaki insanlara karşı yükümlülük hissetiğim için kuruluşumdan şu anda ayrılmazdım. 1 2 3 4 5
5. Biraz daha para için mevcut işyerimi değiştirmeyi ciddi olarak düşünmezdim. 1 2 3 4 5
6. Benim için avantajlı olsa da, kuruluşumdan şu anda ayrılmanın doğru olmadığını hissediyorum. 1 2 3 4 5
7. Bu kuruluşa sadakat göstermenin görevim olduğunu düşünüyorum. 1 2 3 4 5
8. Kuruluşum maddi olarak zor durumda olsa bile, sonuna kadar kalırdım. 1 2 3 4 5
9. Bu kuruluşa gönül borcu hissediyorum. (R) 1 2 3 4 5 10. Mevcut işverenimle kalmak için hiçbir manevi yükümlülük hissetmiyorum. 1 2 3 4 5
11. Bu kuruluş sayesinde ekmek parası kazanıyorum, karşılığında sadakat göstermeliyim. 1 2 3 4 5
12. Mevcut kuruluşumdan ayrılıp birlikte çalıştığım insanları yarı yolda bırakmak istemem. 1 2 3 4 5
13. Kuruluşumdan şimdi ayrılsam kendimi suçlu hissederim. 1 2 3 4 5
14. Bu kuruluş benim sadakatimi hakediyor. 1 2 3 4 5

121
APPENDIX I
PERFORMANCE ITEMS

122
1 Hiçbir zaman
2 Nadiren
3 Bazen
4 Sıkça
5 Her zaman
CONTEXTUAL PERFORMANCE ITEMS
1. Çalışma saatleri içerisinde zamanını etken bir biçimde kullanamaz ve iş planlarına uymaz. (R) 1 2 3 4 5
2. İşini belirlenen (kalite) standartlar(ın)a uygun olarak yapar. 1 2 3 4 5 3. İşini yaparken karşılaştığı problemlerin çözümü için öneriler geliştirir. 1 2 3 4 5
4. İşini etkin bir şekilde yapabilmek için gerekli bilgi ve beceriye sahiptir. 1 2 3 4 5
5. İşiyle ilgili sahip olduğu bilgi ve becerileri etkin bir şekilde kullanır. 1 2 3 4 5
TASK PERFORMANCE ITEMS
1. İşimi başarıyla tamamlamak için ekstra istek ve çaba gösterir. 1 2 3 4 5
2. Başkalarına yardım eder ve işbirliğine açıktır. 1 2 3 4 5 3. İşinin bir parçası olmayan görevleri gönüllü olarak yerine getirmez. (R) 1 2 3 4 5
4. Organizasyonun hedeflerini benimser, destekler ve savunur. 1 2 3 4 5
5. Organizasyonel kural ve prosedürlere uyar. 1 2 3 4 5
GENERAL PERFORMANCE ITEM
1. Genel olarak yüksek performans gösterir. 1 2 3 4 5

123
APPENDIX J
DEMOGRAPHIC QUESTIONS
(Subordinates)

124
Son olarak sizden bazı kişisel bilgiler istenmektedir. Bu bilgiler sadece araştırma amaçlı olarak, yönetici-çalışan eşleştirmesinin yapılması aşamasında kullanılacak ve kurum içinden ya da dışından herhangi bir kişi / kişilerle paylaşılmayacaktır. Katılımınız için tekrar teşekkür ederiz. Adınız-Soyadınız:
E K
Yaşınız:
Eğitim durumunuz:
Mesleğiniz:
Çalıştığınız kurum:
Çalıştığınız departman/bölüm:
Yöneticinizin adı:
Kaç yıldır bu kuruluşta çalışıyorsunuz?
Kaç yıldır şimdiki yöneticinizle birlikte çalışıyorsunuz?
Toplamda kaç yıldır çalışma hayatı içindesiniz? (Daha önce çalıştığınız kuruluşlar dahil olmak üzere)
Çalışmamıza sağladığınız değerli katkılarınız için çok teşekkür ederiz…

125
APPENDIX K
DEMOGRAPHIC QUESTIONS
(Managers)

126
Son olarak sizden bazı kişisel bilgiler istenmektedir. Bu bilgiler sadece araştırma amaçlı olarak, yönetici-çalışan eşleştirmesinin yapılması aşamasında kullanılacak ve kurum içinden ya da dışından herhangi bir kişi / kişilerle paylaşılmayacaktır. Katılımınız için tekrar teşekkür ederiz. Adınız-Soyadınız:
E K
Yaşınız:
Eğitim durumunuz:
Mesleğiniz:
Çalıştığınız kuruluş:
Çalıştığınız departman/bölüm:
Halihazırda size bağlı çalışan sayısı: (Çalışmalarını denetlemekten sorumlu olduğunuz çalışanlar)
Kaç yıldır bu kuruluşta çalışıyorsunuz?
Toplamda kaç yıldır yöneticilik yapıyorsunuz? (Şu anda çalışmakta olduğunuz kuruluş dahil olmak üzere)
Çalışmamıza sağladığınız değerli katkılarınız için çok teşekkür ederiz…