lead authors · 2018-05-17 · university of utah: patricia kerig, ph.d. these team partners work...
TRANSCRIPT

THE CITY OF LOS ANGELES
MAYOR’S OFFICE OF GANG
REDUCTION AND YOUTH
DEVELOPMENT (GRYD) RESEARCH
AND EVALUATION TEAM
Lead Authors
Molly Kraus
Kristine Chan
Alfonso Martin
Loraine Park
Jorja Leap
Laura Rivas
Kim Manos
Karen M. Hennigan
Kathy A. Kolnick

GRYD Gang Prevention
2017 Evaluation Report
Acknowledgements This report was made possible by the City of Los Angeles Mayor’s Office of Gang Reduction and Youth
Development (GRYD). The authors would like to acknowledge and thank all those who supported and
contributed to this work. Specifically, we wish to thank GRYD Director Anne Tremblay for her continued
commitment to the evaluation of GRYD and would like to extend our appreciation to all GRYD Office Staff
for their partnership and assistance with coordination and implementation of evaluation efforts.
We also extend a special thank you to the GRYD Prevention Providers for their contributions to on-going
data collection efforts through GRYD’s institutionalized data systems as well as their participation in and
facilitation of qualitative focus groups and interviews held with staff, clients, and client families. We
appreciate the insights that you shared with us throughout the data collection and evaluation process.
We are also grateful to our copyeditor, Margaret Finnegan, for her review and contributions to this report.
This report was funded by the City of Los Angeles contract number C-128086 (“Research Consulting for
GRYD”) with California State University, Los Angeles.
Permission to use these data was provided by the City of Los Angeles Mayor’s Office of Gang Reduction and
Youth Development (GRYD). Any opinions, findings, conclusions or recommendations expressed in this
study, however, are those of the author(s) and do not necessarily reflect the views of the GRYD Office.

GRYD Gang Prevention
2017 Evaluation Report
Contents List of Acronyms ................................................................................................................................................................. i
Introduction ......................................................................................................................................................................... 1
Overview of the GRYD Comprehensive Strategy ................................................................................................... 1
An Overview of GRYD Prevention Services ............................................................................................................ 4
Research Questions ........................................................................................................................................................ 6
Data and Methods .......................................................................................................................................................... 8
Process Evaluation Results .............................................................................................................................................. 12
Referral and Eligibility Process .................................................................................................................................. 12
Referrals and Determining Eligibility for Services .................................................................................................. 17
Client Enrollment in GRYD Prevention Services .................................................................................................. 21
Program Experiences and Services Received .......................................................................................................... 24
Retention in Services.................................................................................................................................................... 30
Outcome Evaluation Results .......................................................................................................................................... 38
Measuring Changes in Client Risk ............................................................................................................................. 38
Summary and Recommendations ................................................................................................................................... 50
Recommendations ........................................................................................................................................................ 53
Appendix ............................................................................................................................................................................ 55
Table of Figures Figure 1. GRYD Zones ..................................................................................................................................................... 2
Figure 2. Overview of the Comprehensive Strategy ..................................................................................................... 3
Figure 3. GRYD Prevention Services Logic Model ...................................................................................................... 5
Figure 4. Client Data Flow Chart, GRYD Prevention Clients .................................................................................. 13
Figure 5. Change in Number of Risk Factors at YSET-I and YSET-R ................................................................... 44
Figure 6. Antisocial Tendencies: Difference in Change Over Time ......................................................................... 45
Figure 7. Critical Life Events: Difference in Change Over Time ............................................................................. 45
Figure 8. Guilt Neutralization: Difference in Change Over Time ............................................................................ 46
Figure 9. Impulsive Risk Taking: Difference in Change Over Time ........................................................................ 46
Figure 10. Weak Parental Supervision: Difference in Change Over Time .............................................................. 47
Figure 11. Peer Delinquency: Difference in Change Over Time .............................................................................. 47
Figure 12. Negative Peer Influence: Difference in Change Over Time ................................................................... 48
Figure 13. Family Gang Influence: Difference in Change Over Time ..................................................................... 48
Figure 14. Self-Reported Delinquency: Difference in Change Over Time ............................................................. 49
GRYD Gang Prevention
2017 Evaluation Report
Table of Tables Table 1. Process Evaluation Questions ........................................................................................................................... 6
Table 2. Outcome Evaluation Questions ........................................................................................................................ 8
Table 4. Completed Client and Family Focus Groups ............................................................................................... 11
Table 5. Referral Source ................................................................................................................................................... 13
Table 6. Demographic Characteristics of Referred Youth ......................................................................................... 17
Table 7. YSET Scales Used to Determine Eligibility .................................................................................................. 18
Table 8. YSET Eligibility Rates ...................................................................................................................................... 19
Table 9. Client Enrollment Rates ................................................................................................................................... 22
Table 10. Client Characteristics: Living Situation ........................................................................................................ 23
Table 11. Client Characteristics: Systems Involvement and School ......................................................................... 24
Table 12. Frequency of Activities Logged .................................................................................................................... 25
Table 13. Activities Logged by Client and Family Attendance .................................................................................. 25
Table 14. Number of Hours of Contact by Completed Activity Type .................................................................... 26
Table 15. Program Completion by Exit Type .............................................................................................................. 31
Table 16. Characteristics Related to Program Completion: Age and Living Situation .......................................... 32
Table 17. Characteristics Related to Program Completion: Systems Involvement and School ........................... 33
Table 18. Enrollment Length by Exit Status ................................................................................................................ 34
Table 19. Dosage Received by Exit Status .................................................................................................................... 35
Table 20. Eligibility Results at YSET-R ........................................................................................................................ 38
Table 21. Changes in Total Number of Risk Factors between Initial and Re-Test YSET ................................... 39
Table 22. Changes in YSET Scale Scores from YSET-I to YSET-R ....................................................................... 39
Table 23. Average YSET Scale Scores at YSET-I and YSET-R ............................................................................... 40
Table 24. Summary of Multiple Regression Analysis Examining Relationship between Client Characteristics
and Changes in the Number of Risk Factors ............................................................................................................... 41
Table 25. Change in Average YSET Scale Scores at YSET-I and YSET-R ............................................................ 42
Table 26. Description of the YSET Comparison Groups ......................................................................................... 43
Table 27. Comparison of Average Scores and Percent Change for GRYD and County Samples ...................... 44
Table 28. Client Characteristics ...................................................................................................................................... 55

i 2017 Evaluation Report
GRYD Gang Prevention
List of Acronyms CBO Community-Based Organization
CSULA California State University, Los Angeles
DCFS Department of Children and Family Services
ETO Efforts to Outcomes
FCM GRYD Intervention Family Case Management
GRYD City of Los Angeles Mayor’s Office of Gang Reduction and Youth Development
IEP Individualized Education Plan
LAPD Los Angeles Police Department
LAUSD Los Angeles Unified School District
MOU Memorandum of Understanding
NIJ National Institute of Justice
YSET Youth Services Eligibility Tool
YSET-I Youth Services Eligibility Tool Intake
YSET-R Youth Services Eligibility Tool Retest
USC University of Southern California

1 2017 Evaluation Report
GRYD Gang Prevention
Introduction he City of Los Angeles Mayor’s Office of Gang Reduction and Youth Development (GRYD)
oversees a Comprehensive Strategy which involves the provision of prevention services, gang
intervention services, violence interruption activities, and involvement in proactive peace-making
activities (see Figure 2). GRYD is committed to evaluating these programs and currently contracts
with California State University, Los Angeles to oversee all research and evaluation activities related to
GRYD.
Denise C. Herz, Ph.D., in the School of Criminal Justice and Criminalistics oversees and directs the GRYD
Research and Evaluation Team, which includes:
California State University, Los Angeles: Molly Kraus, MPL; Kristine Chan, MSW; Carly B.
Dierkhising, Ph.D.; and Akhila Ananth, Ph.D.
Harder + Company Community Research: Loraine Park, MSW and Alfonso Martin, MA
University of California, Los Angeles: Jorja Leap, Ph.D.; Laura Rivas, MSW/MPP; Kim Manos;
P. Jeffrey Brantingham, Ph.D.; and Nick Sundback
University of Southern California: Karen M. Hennigan, Ph.D. and Kathy A. Kolnick, Ph.D.
University of Utah: Patricia Kerig, Ph.D.
These team partners work to evaluate the GRYD Comprehensive Strategy using both qualitative and
quantitative data. Key goals of this work are to assess the impact of GRYD services and to create a “research
to practice” feedback loop for continuous improvement of GRYD services. In addition to providing an
overview of the Comprehensive Strategy and GRYD Prevention Services, this report presents evaluation
results based on GRYD Prevention data collected between September 2011 and March 2016.
Overview of the GRYD Comprehensive Strategy
The City of Los Angeles Mayor’s Office of Gang Reduction and Youth Development (GRYD) was
established in in July of 2007 to address gang violence in a comprehensive and coordinated way throughout
the City. Community-based service provision began in 2009. Over the years, GRYD developed and
implemented a Comprehensive Strategy1 to drive funding and practice decisions across areas designated as
GRYD Zones. As shown in Figure 1, GRYD currently provides services in 23 GRYD Zones throughout the
City of Los Angeles.2
1 Cespedes, G., & Herz, D. C. (2011). The City of Los Angeles Mayor’s Office of Gang Reduction and Youth Development (GRYD) Comprehensive Strategy; Los Angeles: GRYD Office 2 GRYD services began in 2009 in 12 GRYD Zones offering gang prevention, gang intervention, and violence interruption. An additional eight secondary areas offered more limited programming; four implementing only gang prevention and four gang intervention and violence interruption. As of July, 2015 GRYD has expanded to 23 full GRYD Zones in which all prongs of the comprehensive strategy are employed.
T

2 2017 Evaluation Report
GRYD Gang Prevention
Figure 1. GRYD Zones
3 2017 Evaluation Report
GRYD Gang Prevention
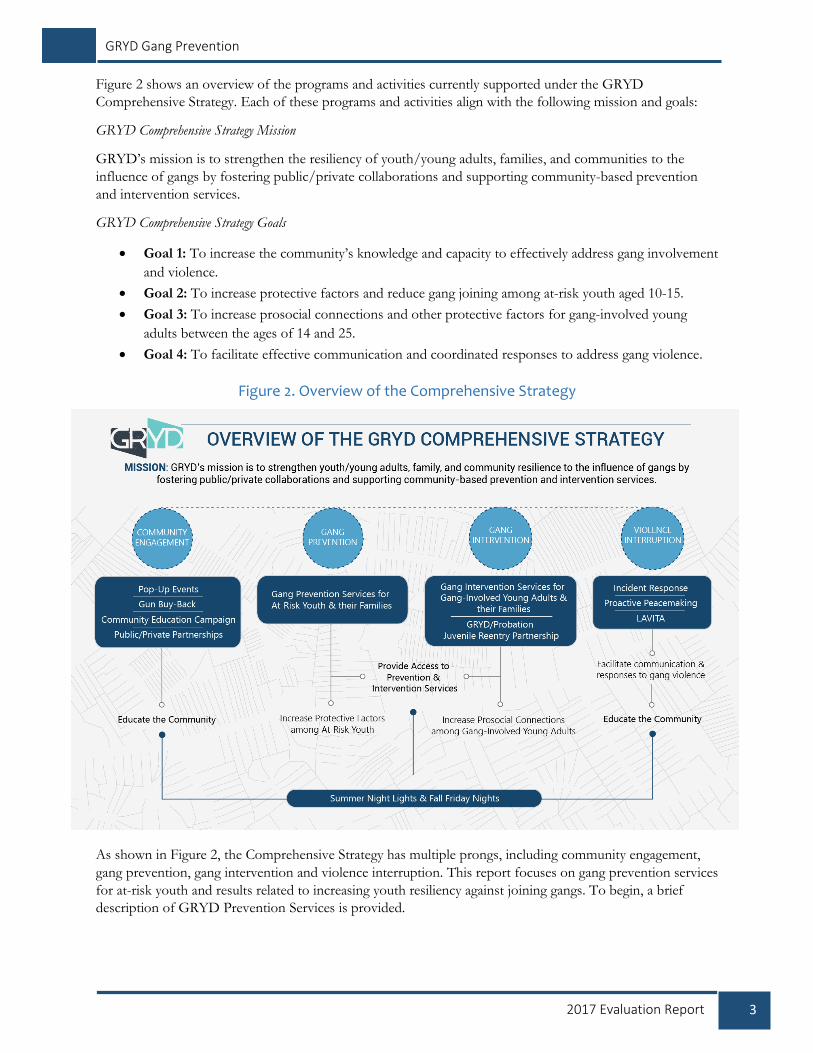
Figure 2 shows an overview of the programs and activities currently supported under the GRYD
Comprehensive Strategy. Each of these programs and activities align with the following mission and goals:
GRYD Comprehensive Strategy Mission
GRYD’s mission is to strengthen the resiliency of youth/young adults, families, and communities to the
influence of gangs by fostering public/private collaborations and supporting community-based prevention
and intervention services.
GRYD Comprehensive Strategy Goals
Goal 1: To increase the community’s knowledge and capacity to effectively address gang involvement
and violence.
Goal 2: To increase protective factors and reduce gang joining among at-risk youth aged 10-15.
Goal 3: To increase prosocial connections and other protective factors for gang-involved young
adults between the ages of 14 and 25.
Goal 4: To facilitate effective communication and coordinated responses to address gang violence.
Figure 2. Overview of the Comprehensive Strategy
As shown in Figure 2, the Comprehensive Strategy has multiple prongs, including community engagement,
gang prevention, gang intervention and violence interruption. This report focuses on gang prevention services
for at-risk youth and results related to increasing youth resiliency against joining gangs. To begin, a brief
description of GRYD Prevention Services is provided.

4 2017 Evaluation Report
GRYD Gang Prevention
An Overview of GRYD Prevention Services
GRYD Prevention Services are directed at youth (ages 10-15) who are identified as high risk for gang joining
and their families. High-risk youth are not identified as members of a gang, but they may have behaviors that
increase the likelihood of gang involvement or gang membership. Therefore, the model is designed to reduce
risk factors and their associated behaviors by addressing the youth at the individual, family, and peer level
while strengthening problem solving skills and the family’s structure and cohesion. Ultimately, GRYD’s goal
is to increase protective factors against gang joining among at-risk youth (see Figure 3 for an overview of
GRYD Prevention programming).
In order for youth to be eligible for GRYD Prevention Services, referrals to the program must meet the
following criteria:
youth must be between ages 10 and 15 years old;
have a significant presence in a GRYD Zone; and,
score at risk for gang membership on the Youth Services Eligibility Tool (YSET).
Youth and their families who are referred to the program are invited to participate in a one-on-one
assessment interview with a case manager. At that time, they also complete the Youth Services Eligibility Tool
(YSET) to determine their eligibility for the services. The YSET is composed of nine scales. Seven of these
scales are attitudinal, two are behavioral, and each scale contains 2 – 17 questions. The scales include:
Attitudinal Scales
Antisocial Tendencies
Weak Parental Supervision
Critical Life Events
Impulsive Risk Taking
Guilt Neutralization
Negative Peer Influence
Peer Delinquency
Behavioral Scales
Family Gang Influence
Self-Reported Delinquency
Youth determined to be at a “high-risk level” on a scale must be equal to or greater than the pre-established
threshold. To be eligible for GRYD Prevention Services, a youth must meet or exceed the risk threshold on
four or more YSET scales3.
Once identified eligible for services by the YSET, the youth and families who enroll in programming receive
services within a cycle comprised of seven phases. Phase 1 is used to complete the referral and intake process.
Phases 2-7 incorporate service delivery. Each phase is described in more detail below.
3 More detailed information on these scales including the number of items scored, maximum scores, and risk thresholds are presented later in the report.

5 2017 Evaluation Report
GRYD Gang Prevention
Figure 3. GRYD Prevention Services Logic Model
The GRYD Prevention Services model consists of the following phases:4
Phase 1: Referral/Collaboration. The GRYD Prevention Provider meets with the referred youth
and family to gather initial information related to the reason for the referral and to begin to define
problems that the youth and family are encountering. At this time, providers administer the initial
YSET (YSET-I), to determine whether the youth meets the eligibility criteria (i.e., is at risk for gang
membership).5
Phase 2: Building Agreements. Eligible youth who enroll begin services in Phase 2. The provider
team works with the family to identify client and family strengths and the key issues to address during
their participation in the program. Case plans for client and family are developed, and the team helps
the family identify individual roles and responsibilities to help the client change behavior. The client
participates in individual and peer program sessions and undertakes the initial steps to build a
strength-based genogram.6
Phase 3: Redefining. The client and family reconvene with the team to discuss progress, obstacles,
and to reflect on experiences throughout the last month. If the problems identified in Phase 2 have
been resolved, new priority problems are identified. If not, new strategies are developed.
Phase 4: Celebrating Changes. The team affirms family efforts to reduce behaviors and issues
identified in the previous phases in order to strengthen the family’s motivation to change. The type
of celebration is defined by the family and client.
4 City of Los Angeles Mayor’s Office of Gang Reduction and Youth Development. (2016). GRYD Prevention Services Policies and Procedures Handbook (v.1.6.2016). Los Angeles: GRYD Office. 5 NOTE: The referral and eligibility determination process are described in more detail later in the report. 6 A strength-based genogram is a visual depiction of family connections and dynamics. In GRYD Prevention Services, it is used as a tool to facilitate identification of positive multigenerational connections that support family and individual development and increased resiliency. The role and use of the genogram is described in greater detail later in the report.
6 2017 Evaluation Report
GRYD Gang Prevention
Phase 5: Mainstreaming. The team works with the client and family to identify social supports in
the community and to facilitate continuing progress. Skills developed and utilized in the program are
put to use and “tested” outside the program.
Phase 6: Next Level Agreements. Building on their success during the previous phases, the team
guides the client and family to take on more difficult problems.
Phase 7: Reassessment. The YSET is re-administered to assess progress (YSET-R). If sufficient
progress is made, the client and family graduate. Graduation includes public recognition of the client
and family accomplishments. If further progress is needed, the client and family remain in the
program and a second program cycle begins.
With the exception of Phase 1, which is to be completed as quickly as possible, each phase is intended to last
roughly a month. Each phase involves the following:
two in-person family meetings of at least an hour in length;
one individual meeting at least an hour in length;
at least one strategy session7 of at least 30 minutes; and,
at least ten group activities (completed over a full cycle) of at least 45 minutes in duration.
Within each of these required meetings/activities, the provider team utilizes multigenerational coaching
through the use of strength-based genograms (e.g., vertical strategy) and the use of problem-solving
techniques (e.g., horizontal strategy). At the end of Phase 7 or six months in services (whichever comes first),
clients retake the YSET, providing a measure of behavior over time.
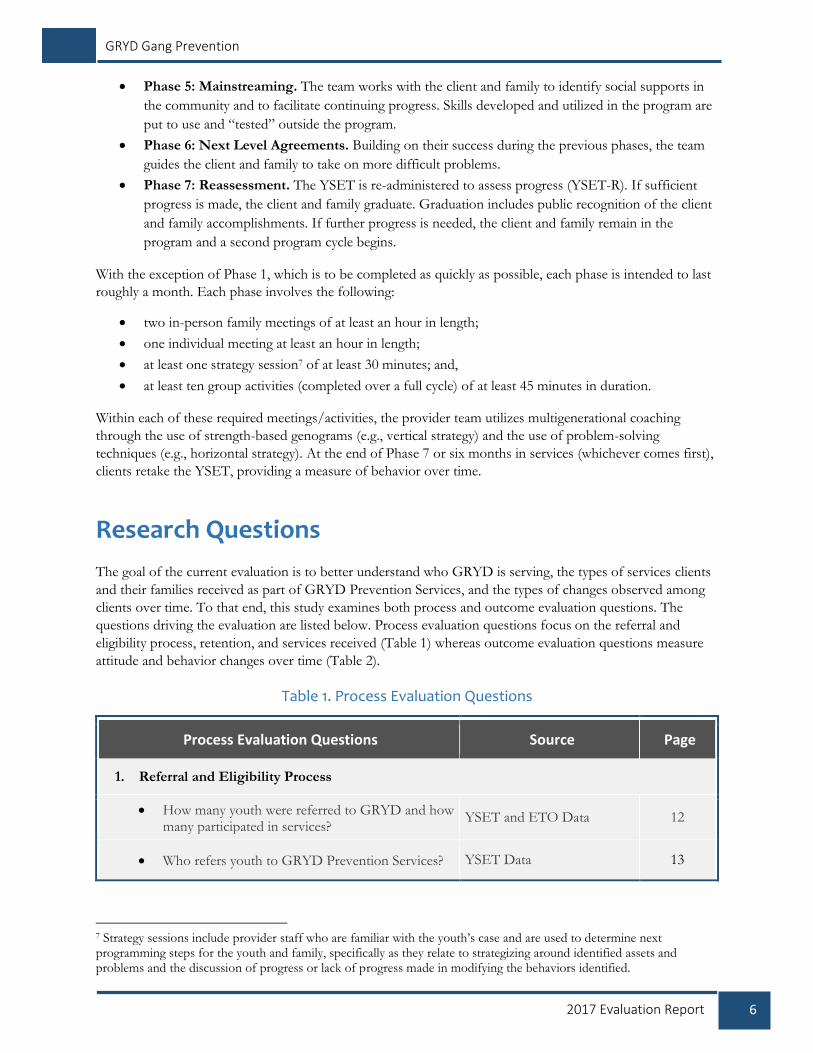
Research Questions
The goal of the current evaluation is to better understand who GRYD is serving, the types of services clients
and their families received as part of GRYD Prevention Services, and the types of changes observed among
clients over time. To that end, this study examines both process and outcome evaluation questions. The
questions driving the evaluation are listed below. Process evaluation questions focus on the referral and
eligibility process, retention, and services received (Table 1) whereas outcome evaluation questions measure
attitude and behavior changes over time (Table 2).
Table 1. Process Evaluation Questions
Process Evaluation Questions Source Page
1. Referral and Eligibility Process
How many youth were referred to GRYD and how many participated in services?
YSET and ETO Data 12
Who refers youth to GRYD Prevention Services? YSET Data 13
7 Strategy sessions include provider staff who are familiar with the youth’s case and are used to determine next programming steps for the youth and family, specifically as they relate to strategizing around identified assets and problems and the discussion of progress or lack of progress made in modifying the behaviors identified.

7 2017 Evaluation Report
GRYD Gang Prevention
Process Evaluation Questions Source Page
What outreach and recruitment strategies are used by GRYD Prevention Providers with referrals?
Ethnographic Observations/ Provider Interviews/Client & Family Focus Groups
14
2. Referrals and Determining Eligibility for Services
What are the demographic characteristics of referred youth who complete the YSET?
YSET Data 17
What are the provider reflections around age eligibility?
Provider Interviews/Client & Family Focus Groups
17
How many referred youth were eligible for services based on the YSET?
YSET and ETO Data 18
What are provider perspectives regarding the administration of the YSET?
Provider Interviews/Client & Family Focus Groups
19
3. Client Enrollment in GRYD Prevention Services
At what rates do eligible youth enroll in services? YSET and ETO Data 21
What are the demographics and other characteristics of GRYD Prevention Services clients?
YSET and ETO Data 23
4. Program Experiences and Services Received
What dosage of services do clients receive? ETO Data 25
What is the nature and content of individual experience with GRYD Prevention Services? What makes individuals stay? What individuals return for more services?
Ethnographic Observations/ Provider Interviews/Client & Family Focus Groups
26
How are genograms used? What occurs in the delivery and experience of genograms as a part of GRYD Prevention Services?
Ethnographic Observations/ Provider Interviews/Client & Family Focus Groups
28
5. Retention in Services
What are program completion rates? YSET and ETO Data 31
How do client characteristics relate to program completion?
YSET and ETO Data 32
How does length in programming differ between clients who completed the program and those who did not?
YSET and ETO Data 33

8 2017 Evaluation Report
GRYD Gang Prevention
Process Evaluation Questions Source Page
How does dosage differ between clients who complete the program and those who do not?
ETO Data 34
What is the nature and content of individual experience with GRYD Prevention Services? How does this relate to staying in/quitting services?
Ethnographic Observations/ Provider Interviews/Client and Family Focus Groups
35
What programmatic strategies are used by GRYD Prevention Providers to deliver services and encourage program completion? What are the primary reasons for dropping out and how does this relate to the "tipping point" for quitting services in the quantitative data?
Ethnographic Observations/ Provider Interviews/Client and Family Focus Groups
36
Table 2. Outcome Evaluation Questions
Outcome Evaluation Questions Source Page
1. Measuring Changes in Client Risk
Are there changes in YSET-based eligibility scales over time for GRYD clients?
YSET Data 38
How did YSET scales change in order to reduce eligibility rates over time?
YSET Data 38
Are some clients more likely to experience change compared to others?
YSET Data 40
How do GRYD clients compare to youth who did not receive GRYD Prevention Services? Do both groups experience similar changes in risk over time?
GRYD and Comparison Group YSET Data
42
Data and Methods
Evaluation of these questions uses data captured through the administration of the Youth Services Eligibility
Tool (YSET); data entered into the GRYD Efforts to Outcomes (ETO) database; and data collected through
focus groups conducted with provider staff, participating families, and participating youth. A description of
each data source is provided below.
YSET Database
As mentioned, all youth referred to GRYD Prevention Services complete the YSET in order to determine
eligibility for services. The YSET database contains the eligibility of the youth at initial assessment (e.g.,
eligible or not eligible), demographic and referral information (without identifying information such as name),

9 2017 Evaluation Report
GRYD Gang Prevention
as well as changes in level of risk over time if the client remains in programming. The YSET is administered
approximately every six months during the reassessment phase of the program for the duration of their
participation in the program (during the reassessment phase), using the date of enrollment as the baseline date
for the re-test timeline. The YSET database tracks data from all initial YSETs (YSET-Is) and reassessments
(YSET-R). Youth who do not enroll or who drop out before completing services are not reassessed.
YSET data collected between September 1, 2011 and March 31, 2016 were used for analysis in the current
report.8 During this period of time, the GRYD Prevention Services model was implemented in 23 GRYD
Zones.9 In total, 10,903 initial YSETs were completed during this period; however, analysis focused on youth
with a record in the GRYD ETO database (N=9,098).10 Analysis of reassessment results were limited to
clients who retook the YSET between four and eight months after their initial YSET.
YSET Comparison Group
The comparison group used in this evaluation consists of a sample of high-risk youth on juvenile probation in
Los Angeles County. These youth were engaged in a recent study funded by the National Institute of Justice
(NIJ)11 and led by the Center for Research on Crime at the University of Southern California (USC). The
study focused on youth in catchment areas in neighborhoods (outside of the city of Los Angeles) where street
gangs were prevalent. Recruitment was conducted with permission from the Los Angeles County Probation
Department and assistance from 28 Deputy Probation Officers. Study participants were largely referred by
Deputy Probation Officers, but 13.0% were referred by other participating youth or their parents.
A total of 428 youth between the ages of 11 and 16 agreed to participate and were enrolled in the NIJ study.
Almost all of the participating youth (n=391; 91.4%) completed both a YSET-I and a YSET-R. Of these, 179
county sample youth were high risk (four or more risk factors) and were used as a comparison group for
GRYD Prevention services clients. They were 70.4% male and 82.7% Latino. The YSET-I was administered
to the county study participants between April 4, 2011 and June 12, 2013, and the YSET-R was completed
between July 5, 2012 and September 16, 2013.
The county sample was compared to a sample of 1,023 GRYD Prevention clients, also youth with four or
more risk factors. The GRYD sample was comprised of 59.5% males and 77.0% Latinos. These interviews
were conducted for the following dates: YSET-I administration took place between April 26, 2013 to April
11, 2016; YSET-R interviews were completed April 29, 2014 to September 7, 2016.12
8 GRYD began prevention programming in January 2009, but the GRYD Prevention Services model did not begin until 2011. Between 2009 and 2011, contracted providers delivered services based on their own policies and procedures, and little to no process data were collected. Beyond the use of the YSET to determine eligibility, there was little to no uniformity in the delivery of services during this time. To ensure appropriate comparisons are made, the current report limits analysis to the data collected under the GRYD Prevention Services model. This includes (1) all youth who completed the initial YSET to determine program eligibility (referred to as YSET-I) after September 1, 2011, and (2) youth who completed their YSET-I prior to September 2011 but completed their first reassessment (referred to as the YSET-R) as of September 2011 and received at least 4 months of services. 9 GRYD has expanded its areas of coverage, increasing from the original 12 GRYD Zones and 4 prevention-only secondary areas of services to 23 GRYD Zones by July 1, 2015; hence, not all Zones contribute to the data collected for the entire time period included in this report. 10 Some youth are referred to the program more than once; therefore, there is a small amount of duplication in the number of cases reported here. In other words, youth who were referred more than once are counted each time they completed a YSET-I. 11 Hennigan, K. M., Kolnick, K. A., Vindel, F., & Maxson, C. L. (2015). Targeting youth at risk for gang involvement: Validation of a gang risk assessment to support individualized secondary prevention. Children and youth services review, 56, 86-96. 12 The present analyses statistically account for the amount of time between baseline and retest visits, meaning the observed differences between the GRYD and LA County samples cannot be attributed to the fact that some participants were assessed at 6 months, while others were assessed at 18 months.
10 2017 Evaluation Report
GRYD Gang Prevention
GRYD ETO Database
The GRYD ETO database houses information (de-identified for evaluation use) about all youth who are
referred to the GRYD program, including demographic information, activities related to programming, as
well as information about the services they receive as part of the GRYD Prevention Services.
Data collected in the GRYD ETO database was matched to the YSET database. The data were cleaned to
address duplicate records and additional variables were created for analysis. Only youth with matched IDs in
both the YSET and GRYD ETO databases were included in the analyses presented in this report. Once
cleaned, the data was restructured and only youth whose first YSET was labeled as YSET-I or YSET-R1 (first
reassessment) were included in the analyses. It is important to note that some youth were re-referred to the
program and completed a YSET-I more than once. These youth were also included in the analyses and
counted every time they completed a YSET-I.
A set of criteria were used to identify youth who enrolled as GRYD Prevention clients including YSET-I
eligibility and completing baseline criteria for data collection in the GRYD ETO database.13 While all
matched youth are included in the referral and outreach analyses presented in this report, only youth meeting
the client criteria were included in all other analyses conducted.
Quantitative analyses included the use of a number of different tests that were used to test for statistical
significance, including Paired Sample T-Test, Multiple Regression Analysis, and Chi-Square Tests.
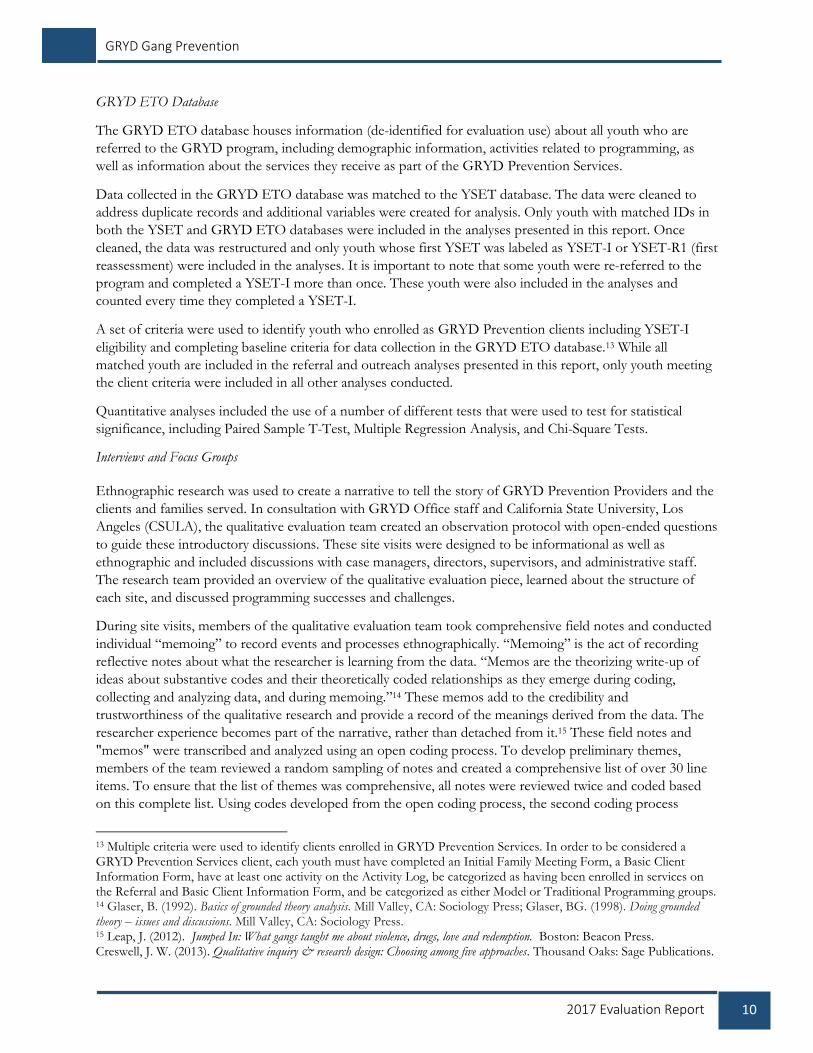
Interviews and Focus Groups
Ethnographic research was used to create a narrative to tell the story of GRYD Prevention Providers and the
clients and families served. In consultation with GRYD Office staff and California State University, Los
Angeles (CSULA), the qualitative evaluation team created an observation protocol with open-ended questions
to guide these introductory discussions. These site visits were designed to be informational as well as
ethnographic and included discussions with case managers, directors, supervisors, and administrative staff.
The research team provided an overview of the qualitative evaluation piece, learned about the structure of
each site, and discussed programming successes and challenges.
During site visits, members of the qualitative evaluation team took comprehensive field notes and conducted
individual “memoing” to record events and processes ethnographically. “Memoing” is the act of recording
reflective notes about what the researcher is learning from the data. “Memos are the theorizing write-up of
ideas about substantive codes and their theoretically coded relationships as they emerge during coding,
collecting and analyzing data, and during memoing.”14 These memos add to the credibility and
trustworthiness of the qualitative research and provide a record of the meanings derived from the data. The
researcher experience becomes part of the narrative, rather than detached from it.15 These field notes and
"memos" were transcribed and analyzed using an open coding process. To develop preliminary themes,
members of the team reviewed a random sampling of notes and created a comprehensive list of over 30 line
items. To ensure that the list of themes was comprehensive, all notes were reviewed twice and coded based
on this complete list. Using codes developed from the open coding process, the second coding process
13 Multiple criteria were used to identify clients enrolled in GRYD Prevention Services. In order to be considered a GRYD Prevention Services client, each youth must have completed an Initial Family Meeting Form, a Basic Client Information Form, have at least one activity on the Activity Log, be categorized as having been enrolled in services on the Referral and Basic Client Information Form, and be categorized as either Model or Traditional Programming groups. 14 Glaser, B. (1992). Basics of grounded theory analysis. Mill Valley, CA: Sociology Press; Glaser, BG. (1998). Doing grounded theory – issues and discussions. Mill Valley, CA: Sociology Press. 15 Leap, J. (2012). Jumped In: What gangs taught me about violence, drugs, love and redemption. Boston: Beacon Press. Creswell, J. W. (2013). Qualitative inquiry & research design: Choosing among five approaches. Thousand Oaks: Sage Publications.

11 2017 Evaluation Report
GRYD Gang Prevention
created more highly refined key themes. The most prominent themes are discussed throughout this report;
these were themes present in at least 40.0% of interviews, with some mentioned in as many as 75.0% of the
interviews.
In total, the qualitative evaluation team conducted preliminary site visits with all 15 providers, covering all 23
GRYD Zones16; completed 31 focus groups with client (16) and family (15) participants, and spoke to 358
additional participants – 187 clients and 171 family members. Two different providers, covering two GRYD
Zones, did not participate in focus groups.17
Table 4. Completed Client and Family Focus Groups
GRYD Prevention Provider GRYD Zone(s) Client Focus
Group (N)
Family Focus
Group (N)
AADAP 77th 1 & 3 20 18
Alma Family Services Hollenbeck 2 & 3 16 14
Barrio Action Hollenbeck 1 8 9
Bresee Foundation Olympic 11 14
Brotherhood Crusade Southwest 2 18 10
Communities in Schools Devonshire-Topanga 0 0
Community Build 77th 2 13 9
Community Build Southwest 1 12 15
El Centro Del Pueblo Northeast 10 12
El Centro Del Pueblo Rampart 1& 2 13 6
El Nido Family Centers Foothill 10 16
Latino Resource Organization Pacific 8 8
New Directions for Youth Mission 13 21
SEA Newton 1 8 0
SEA Newton 2 0 0
Toberman Harbor 10 2
WLCAC Southeast 1, 2, & 3 10 8
Youth Policy Institute Hollywood 7 9
Total 187 171
16 GRYD Regional Program Manager Refugio Valle facilitated this communication. Sites received an introductory email on February 3, 2016 and several follow-up emails after that in order to elicit full participation. 17 Communities in Schools (Devonshire-Topanga) and Soledad Enrichment Action (Newton 2).
12 2017 Evaluation Report
GRYD Gang Prevention
Process Evaluation Results he goal of this evaluation is to better understand who the City of Los Angeles Mayor’s Office of
Gang Reduction and Youth Development (GRYD) is serving, the types of services clients and their
families receive as part of GRYD Prevention Services, and the types of changes observed among
clients over time. Both qualitative and quantitative findings are presented together whenever possible and
appropriate. The first section focuses on the process evaluation results related to the referral and eligibility
process, the programmatic experiences and services that clients and families receive, and program retention.
Referral and Eligibility Process
Since the inception of the GRYD Prevention program, numerous referral sources have identified and
recruited youth between the ages of 10-15 who are perceived to be at risk for gang involvement. This section
begins with findings based on Youth Services Eligibility Tool (YSET) and GRYD Efforts to Outcomes
(ETO) data, which provide a portrait of the youth who were referred and the source of these referrals.
Additionally, qualitative data from provider interviews, focus groups, YSET, and GRYD ETO data are
summarized to better understand the strengths and challenges related to the recruitment and enrollment of
youth and families in GRYD Prevention Services. Next, eligibility rates across all GRYD Zones and
characteristics of those who enroll in programming are presented. Accompanying these findings are provider
views on challenges and concerns related to YSET administration.
How many youth were referred to GRYD and how many participated in services?
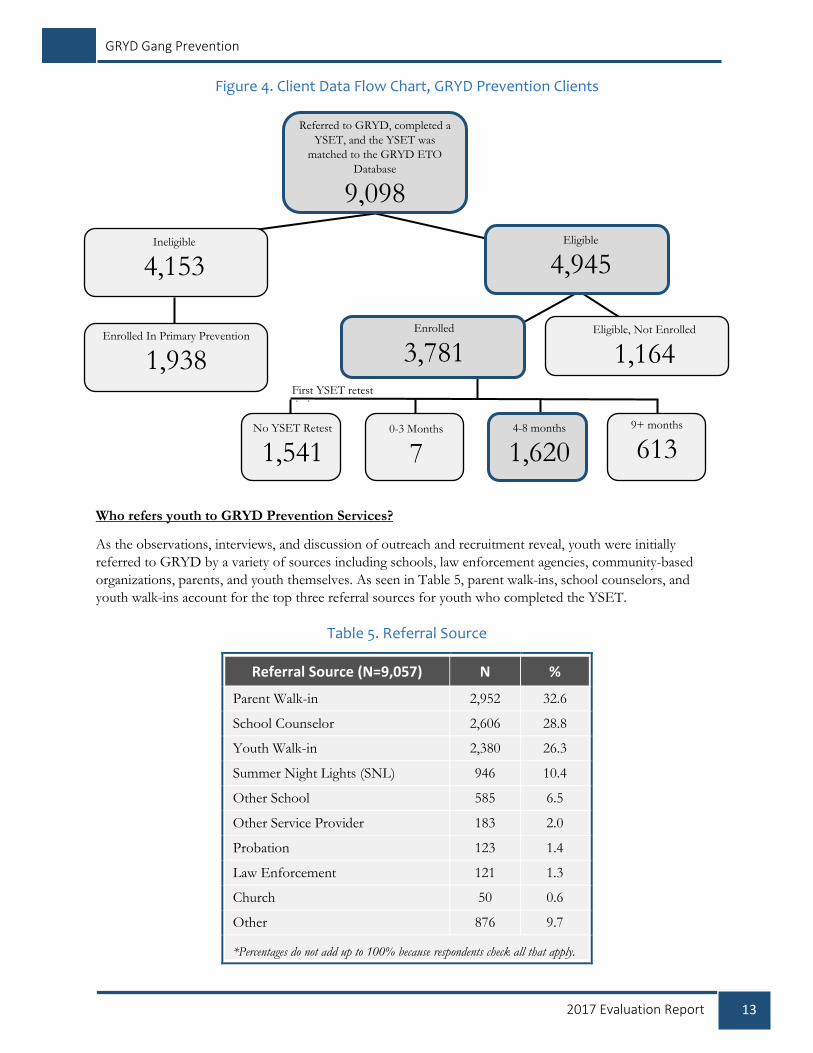
Between September 1, 2011 and March 31, 2016, 9,098 youth were referred to GRYD Prevention Services;
completed the YSET; and had matched records in both the YSET and GRYD ETO database. Figure 4 below
illustrates that flow of youth through the program. For example, 54.4% or 4,945 of those 9,089 youth were
eligible for GRYD Prevention Services. The subsection on client enrollment identifies which GRYD Zones
youth were enrolled in and their demographic characteristics. Seventy-six percent of those who were eligible
for the program enrolled (3,781 out of 4,945). Finally, 42.8% of those who were enrolled completed a YSET
retest 4-8 months after their initial assessment (1,620 out of 3,781).
Also included in Figure 4 are ineligible youth who received GRYD Primary Prevention Services. Primary
Prevention is a less intensive service model that includes fewer monthly contacts and does not include
strategy sessions or the use of genograms. While all youth are included in referral and intake analyses, those
who enroll in Primary Prevention are not included in the following sections of the report.
T
13 2017 Evaluation Report
GRYD Gang Prevention
Figure 4. Client Data Flow Chart, GRYD Prevention Clients
Who refers youth to GRYD Prevention Services?
As the observations, interviews, and discussion of outreach and recruitment reveal, youth were initially
referred to GRYD by a variety of sources including schools, law enforcement agencies, community-based
organizations, parents, and youth themselves. As seen in Table 5, parent walk-ins, school counselors, and
youth walk-ins account for the top three referral sources for youth who completed the YSET.
Table 5. Referral Source
Referral Source (N=9,057) N %
Parent Walk-in 2,952 32.6
School Counselor 2,606 28.8
Youth Walk-in 2,380 26.3
Summer Night Lights (SNL) 946 10.4
Other School 585 6.5
Other Service Provider 183 2.0
Probation 123 1.4
Law Enforcement 121 1.3
Church 50 0.6
Other 876 9.7
*Percentages do not add up to 100% because respondents check all that apply.
Ineligible
4,153
Eligible
4,945
Enrolled In Primary Prevention
1,938
Enrolled
3,781
Eligible, Not Enrolled
1,164
No YSET Retest
1,541
0-3 Months
7
4-8 months
1,620
9+ months
613
First YSET retest
timing
Referred to GRYD, completed a
YSET, and the YSET was
matched to the GRYD ETO
Database
9,098

14 2017 Evaluation Report
GRYD Gang Prevention
What outreach and recruitment strategies are used by GRYD Prevention Providers with referrals?
Across GRYD Prevention Providers, the diversity in years of involvement with GRYD clearly explains the
various strategies, challenges, and successes regarding outreach across GRYD Zones. What emerged from
observations, provider interviews, and group discussions, was the finding that there was no single recruitment
strategy. Providers have similar challenges during outreach and recruitment, and here several key observations
related to successful outreach, including the importance of effective communication, expectation setting, and
the necessity of referral partnerships, are presented.
Use of Vocabulary and Effective Communication
Vocabulary and effective communication were seen as vital to GRYD Prevention Services outreach efforts.
Slightly over half, or 53.3%, of the providers (8 of 15) viewed the word “gang” as a barrier to securing
parental as well as school buy-in. One case manager noted:
“Parents are taken aback by the program title, the word itself has a negative connotation, there’s a certain stigma, and parents become defensive.”
Another case manager captured the dilemma perfectly, observing, “The parents want their kids to get help, but they
don’t want to label them gang members.” During a group discussion, one provider agreed,
“We have to be careful with how we talk to the parents and to their children. We want to be sensitive and we want to be honest.
Good outreach means we have to do both.”
As part of their outreach efforts, providers reported that the term “client” also presented similar dilemmas
and a resulting hesitation – with several sites suggesting that parents respond defensively when staff use this
terminology. Providers attempted to be both thoughtful and sensitive in developing their own vocabulary and
semantics. However, this well-intentioned practice also meant there was sometimes a lack of consistency
across GRYD Zones. One development across GRYD Prevention Providers proved effective in helping
move beyond the barrier of parental hesitation or denial: sites engage in “psychoeducation” around risk factors –
explaining to parents that their children’s behaviors are indicative of future gang involvement and that these
risk factors are why they were referred to the program.18 Other sites referred to the program as a “youth
development initiative,” which carried a more positive connotation and proved to successfully elicit more
participation.
The most consistent finding to emerge in terms of successful outreach and recruitment involved informal
communication within community-based networks. The majority of providers repeatedly delineated “word of
mouth” as one of their primary referral and recruitment sources. One case manager observed, “Families are
satisfied with our services and want to share this with a neighbor or friend who may be in need.” This informal recruitment
strategy includes sibling and cross-generational referrals. Several individuals echoed the words of one case
manager who reported,
“When we do well with one kid – pretty soon the mothers and the fathers or the grandmothers want the other sisters and brothers involved. We don’t even have to
ask, they just come in with the other children or their cousins.”
18 Providers consistently used the term “psychoeducation” that they first learned in training to refer to the education/training/therapy offered to families who are dealing with crisis, trauma, and mental health concerns. Providers seem to approach this model with an emphasis on strengths and ways to overcome these barriers.
15 2017 Evaluation Report
GRYD Gang Prevention
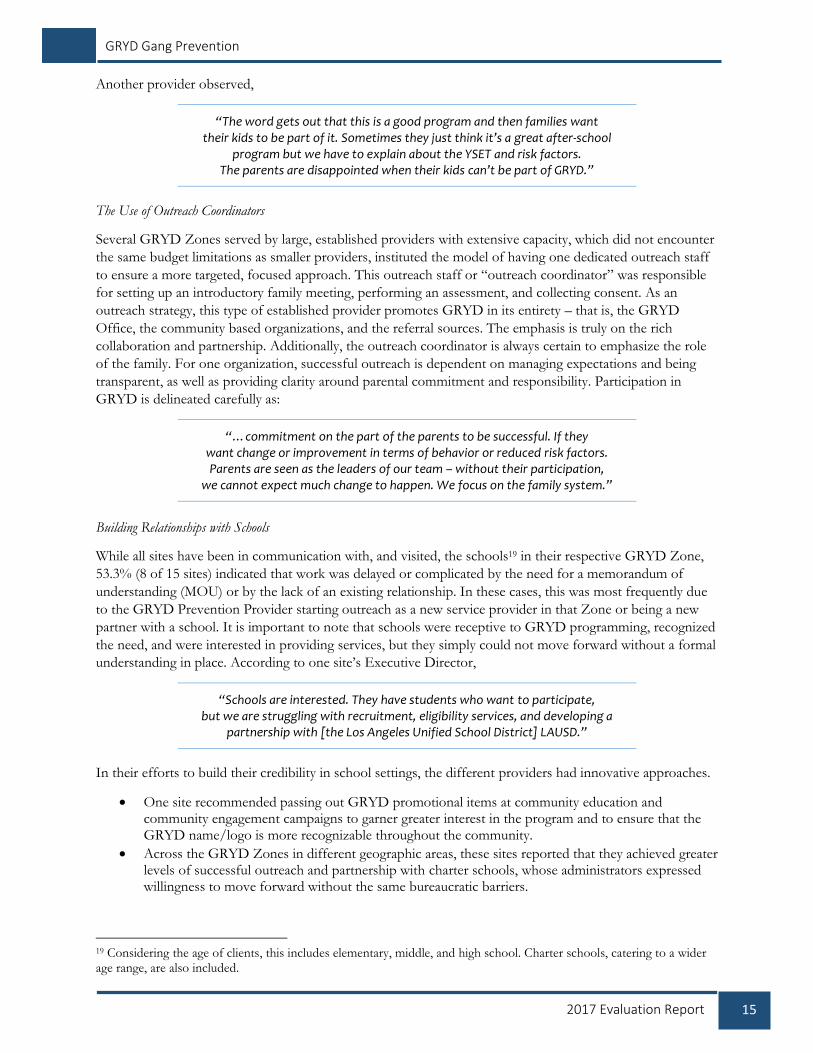
Another provider observed,
“The word gets out that this is a good program and then families want their kids to be part of it. Sometimes they just think it’s a great after-school
program but we have to explain about the YSET and risk factors. The parents are disappointed when their kids can’t be part of GRYD.”
The Use of Outreach Coordinators
Several GRYD Zones served by large, established providers with extensive capacity, which did not encounter
the same budget limitations as smaller providers, instituted the model of having one dedicated outreach staff
to ensure a more targeted, focused approach. This outreach staff or “outreach coordinator” was responsible
for setting up an introductory family meeting, performing an assessment, and collecting consent. As an
outreach strategy, this type of established provider promotes GRYD in its entirety – that is, the GRYD
Office, the community based organizations, and the referral sources. The emphasis is truly on the rich
collaboration and partnership. Additionally, the outreach coordinator is always certain to emphasize the role
of the family. For one organization, successful outreach is dependent on managing expectations and being
transparent, as well as providing clarity around parental commitment and responsibility. Participation in
GRYD is delineated carefully as:
“…commitment on the part of the parents to be successful. If they want change or improvement in terms of behavior or reduced risk factors. Parents are seen as the leaders of our team – without their participation,
we cannot expect much change to happen. We focus on the family system.”
Building Relationships with Schools
While all sites have been in communication with, and visited, the schools19 in their respective GRYD Zone,
53.3% (8 of 15 sites) indicated that work was delayed or complicated by the need for a memorandum of
understanding (MOU) or by the lack of an existing relationship. In these cases, this was most frequently due
to the GRYD Prevention Provider starting outreach as a new service provider in that Zone or being a new
partner with a school. It is important to note that schools were receptive to GRYD programming, recognized
the need, and were interested in providing services, but they simply could not move forward without a formal
understanding in place. According to one site’s Executive Director,
“Schools are interested. They have students who want to participate, but we are struggling with recruitment, eligibility services, and developing a
partnership with [the Los Angeles Unified School District] LAUSD.”
In their efforts to build their credibility in school settings, the different providers had innovative approaches.
One site recommended passing out GRYD promotional items at community education and community engagement campaigns to garner greater interest in the program and to ensure that the GRYD name/logo is more recognizable throughout the community.
Across the GRYD Zones in different geographic areas, these sites reported that they achieved greater levels of successful outreach and partnership with charter schools, whose administrators expressed willingness to move forward without the same bureaucratic barriers.
19 Considering the age of clients, this includes elementary, middle, and high school. Charter schools, catering to a wider age range, are also included.

16 2017 Evaluation Report
GRYD Gang Prevention
To combat the barriers created by the structure within many LAUSD schools, one GRYD Zone has built relationships using safe and accessible community spaces, including a library or recreation center. The provider used these settings to hold meetings and integrate additional services. This is demonstrated by the fact that four sites that report a lengthy partnership with GRYD (some tracing their engagement with Los Angeles City government even further back to LA Bridges) and a more embedded relationship in their GRYD Zone do not struggle with LAUSD barriers. Instead, these sites have successfully leveraged and collaborated with other programs on LAUSD school campuses.
This presents an important opportunity for GRYD. Eight sites were enthusiastic about developing
partnerships with LAUSD and both hoped and recommended that GRYD reinforce program goals and
criteria with LAUSD administration. Providers explained that this “clarification and transparency from the top down”
would help newer GRYD Prevention Providers (whether to GRYD or the respective Zone) to build more
fluid and flexible relationships within the schools. If this relationship were strengthened, sites believe that
referral sources would pay more attention to detail, ensuring that providers receive all pertinent information
about each youth’s case. For example, one site shared that they do not have access to Individualized
Education Plan (IEP) information, which severely hinders service provision. The providers uniformly
believed that having a more formal “GRYD stamp of approval” would improve credibility and validation,
making schools more willing to offer GRYD services on school campus. In addition, several providers
believed that if GRYD requested a dedicated space on campus for onsite activities and engagement, this
formal setting and structural recognition might help to establish service provider presence, build relationships,
and ensure trust.
Partnerships with Government Agencies
Extensive discussion of the importance of ongoing – and successful – partnerships with government agencies
such as the Los Angeles County Probation Department and Los Angeles Police Department (LAPD) were
specifically highlighted. One provider enthusiastically shared, “We are thrilled to see this buy-in,” while another
site echoed this positive stance, explaining, “I never thought we would see that the police were our greatest referral source –
but they are!” Providers in several GRYD Zones referenced the use of LAPD “pocket cards” that have resulted
in increased referrals. The significance of relationships with local police divisions, probation officers, and
other community-based organizations (CBOs) was evident throughout the observations and interviews.
Repeatedly and emphatically, these partnerships were defined as key to successful outreach and enable
GRYD Prevention Providers to serve clients more effectively. One site suggested that GRYD could continue
to build these relationships by hosting trainings for juvenile justice professionals (LAPD, Probation, the
Courts) so that they have a more complete understanding of the program, can address specific community
needs, target hot spots, and discuss potential referrals. Another provider proposed that LAPD and Probation
attend a GRYD training session so that there could be “cross-training.”
The qualitative findings tell us that the significance of community networks and “word of mouth” for GRYD
referrals undergirded the work of multiple providers. It is critical to note that GRYD Prevention Providers
were thoughtful about outreach, wanted to continue to improve, refine terminology, enlarge engagement with
LAUSD, and strengthen the networks that existed. There was a clear appreciation of the relationships that
were established and the partnerships that were functioning well. With this in mind, the next section delves
into eligibility determination since 2011 using YSET data and the demographics of youth completing the
YSET.
17 2017 Evaluation Report
GRYD Gang Prevention
Referrals and Determining Eligibility for Services
What are the demographic characteristics of referred youth who complete the YSET?
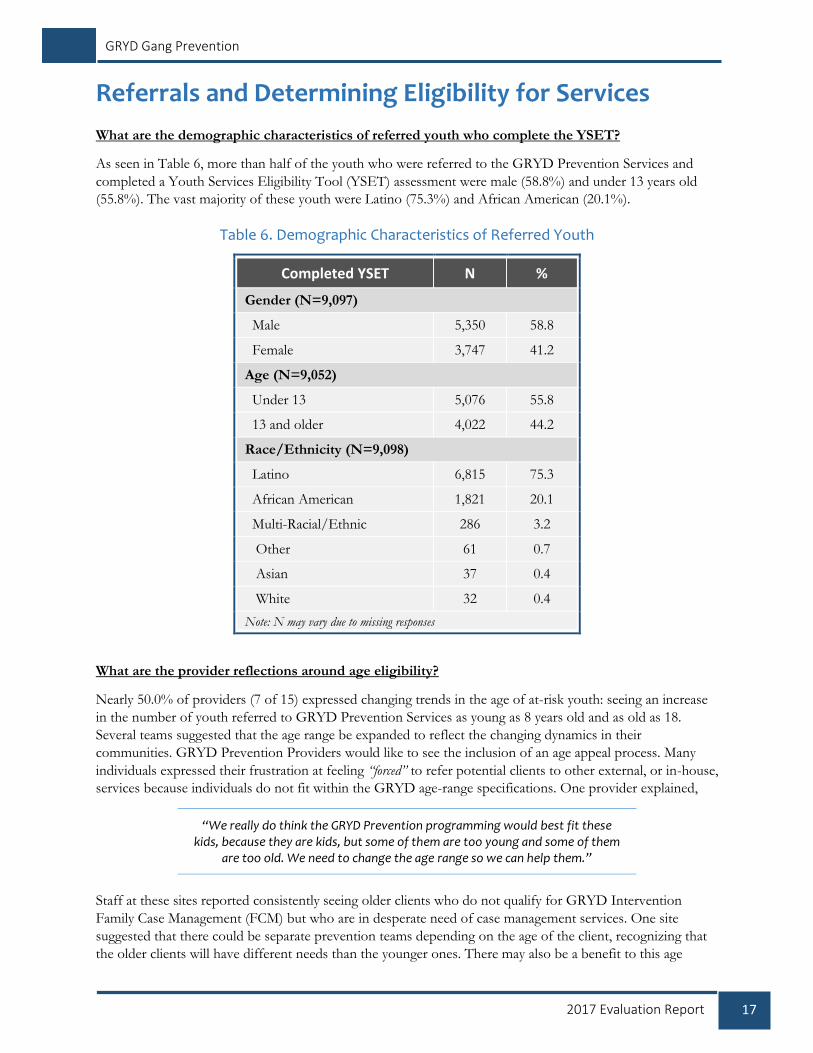
As seen in Table 6, more than half of the youth who were referred to the GRYD Prevention Services and
completed a Youth Services Eligibility Tool (YSET) assessment were male (58.8%) and under 13 years old
(55.8%). The vast majority of these youth were Latino (75.3%) and African American (20.1%).
Table 6. Demographic Characteristics of Referred Youth
Completed YSET N %
Gender (N=9,097)
Male 5,350 58.8
Female 3,747 41.2
Age (N=9,052)
Under 13 5,076 55.8
13 and older 4,022 44.2
Race/Ethnicity (N=9,098)
Latino 6,815 75.3
African American 1,821 20.1
Multi-Racial/Ethnic 286 3.2
Other 61 0.7
Asian 37 0.4
White 32 0.4
Note: N may vary due to missing responses
What are the provider reflections around age eligibility?
Nearly 50.0% of providers (7 of 15) expressed changing trends in the age of at-risk youth: seeing an increase
in the number of youth referred to GRYD Prevention Services as young as 8 years old and as old as 18.
Several teams suggested that the age range be expanded to reflect the changing dynamics in their
communities. GRYD Prevention Providers would like to see the inclusion of an age appeal process. Many
individuals expressed their frustration at feeling “forced” to refer potential clients to other external, or in-house,
services because individuals do not fit within the GRYD age-range specifications. One provider explained,
“We really do think the GRYD Prevention programming would best fit these kids, because they are kids, but some of them are too young and some of them
are too old. We need to change the age range so we can help them.”
Staff at these sites reported consistently seeing older clients who do not qualify for GRYD Intervention
Family Case Management (FCM) but who are in desperate need of case management services. One site
suggested that there could be separate prevention teams depending on the age of the client, recognizing that
the older clients will have different needs than the younger ones. There may also be a benefit to this age

18 2017 Evaluation Report
GRYD Gang Prevention
diversity – one provider suggested that as older youth find themselves “growing” and developing more
prosocial connections and positive attitudes as a result of GRYD services, perhaps they could serve as
mentors for the younger clients. Next, YSET data begin to illustrate the referrals that became clients enrolled
in GRYD Prevention Services.
How many referred youth were eligible for services based on the YSET?
Nine scales in the YSET are used to determine eligibility for GRYD Prevention Services (see Table 7). Risk
thresholds have been identified within each scale that indicate an elevated level of risk and some scales have a
modest upward adjustment in the risk threshold for older youth (13 to 15 years old). In order to be eligible,
youth must meet or exceed the risk thresholds on four or more scales.20
Table 7. YSET Scales Used to Determine Eligibility
Scale Number of Scored
Items Maximum Possible
Score
Risk Threshold Score
13 years or older
Attitudinal Scales
Antisocial Tendencies 6 30 16
Weak Parental Supervision 3 15 7
Critical Life Events 7 7 4
Impulsive Risk Taking 4 20 14
Guilt Neutralization 6 30 19
Negative Peer Influence 5 25 13
Peer Delinquency 6 30 14
Behavioral Scales
Family Gang Influence 2 2 1
Self-Reported Delinquency 17 17 6
During the time period examined, over 9,000 YSETs were administered to determine eligibility for GRYD
Prevention Services. Across all GRYD Zones, a little over half of the completed YSETs (54.4%) were
determined to be eligible for services. However, eligibility rates varied widely across GRYD Zones and ranged
from 67.3% in Southeast 2 to 15.4% in Hollenbeck 2. It is important to note that many of the GRYD Zones
with lower eligibility rates are those that were first established in June 2015 or where there was a change in
provider at that time. New GRYD Zones and those with a new provider serving the area may still be
experimenting with outreach and recruitment strategies; therefore, these eligibility rates may change over
time.
20 There is a process in place that allows provider staff to challenge an ineligible finding if there is sufficient evidence that the extent of the youth’s behavior was not captured as part of the YSET interview. The outcome of YSET challenges are determined by the GRYD Prevention Service Provider Review Committee based on documentation submitted by the provider including letters of support from parents, referral source, etc.; school behavioral charts; and other pertinent items. Due to this process, some youth may enroll in GRYD Prevention Services having met the risk thresholds on fewer than four scales.

19 2017 Evaluation Report
GRYD Gang Prevention
Table 8. YSET Eligibility Rates
GRYD Zone Total YSETs
(N=9,098)
Eligible Not Eligible
N % N %
Southeast 2 382 257 67.3 125 32.7
Southeast 3 762 499 65.5 263 34.5
Newton 1** 619 399 64.5 220 35.5
Harbor* 37 23 62.2 14 37.8
Devonshire-Topanga** 183 113 61.7 70 38.3
77th 2 474 290 61.2 184 38.8
Olympic 306 187 61.1 119 38.9
77th 1 901 549 60.9 352 39.1
Rampart 1 393 239 60.8 154 39.2
Southwest 2 526 312 59.3 214 40.7
Southwest 1 539 302 56.0 237 44.0
Foothill 515 281 54.6 234 45.4
Mission 788 412 52.3 376 47.7
Rampart 2** 208 97 46.6 111 53.4
Hollenbeck 1 322 148 46.0 174 54.0
Hollenbeck 3 731 333 45.6 398 54.4
Northeast** 700 291 41.6 409 58.4
77th 3* 169 66 39.1 103 60.9
Newton 2* 81 30 37.0 51 63.0
Southeast 1* 75 22 29.3 53 70.7
Hollywood** 283 78 27.6 205 72.4
Pacific* 26 5 19.2 21 80.8
Hollenbeck 2* 78 12 15.4 66 84.6
Total 9,098 4,945 54.4% 4,153 45.6%
*New GRYD Zone as of July 2015. **GRYD Zone changed providers as of July 2015.
What are provider perspectives regarding the administration of the YSET?
While the YSET is intended to help ensure that the appropriate youth receive the services they need, it has
traditionally posed several challenges for GRYD Prevention Providers. Based on interviews with staff,
providers supported the use of the YSET and readily accepted the use of the tool as part of their fidelity to
the model, but they provided several areas for improvement.

20 2017 Evaluation Report
GRYD Gang Prevention
One example is the format of the tool. Staff indicated that the newest iteration represents a meaningful
improvement, and overall, providers endorsed the new version, stating, “This one is much better,” and “I think
this really comes closest to what we need.” Still, there were remaining concerns. According to 73.3% (11 of 15) of
sites interviewed, there are still several outstanding problems with the YSET. Key concerns surround the
issue of language comprehension, with some terminology and questions deemed not suitable for younger
youth, the general administration of the tool prior to building rapport and developing a trusting relationship,
and the determination of “Primary Prevention” and “GRYD Prevention Services” clients.
Language and Comprehension
As part of this desire to effectively administer the YSET, many individuals at different sites consistently
expressed their concerns about the language used in certain questions as many potential prevention clients are
young and often have trouble understanding what is being asked. Sites report that they have provided
feedback about language concerns and they truly want their suggestions to be addressed.
There were additional concerns noted by a small number of providers who discussed their wishes to see some
revision in terms of survey length, cultural sensitivity, resistance/fear of disciplinary action, need for more
family-centered questions (or a separate test), invasive questions about criminal involvement, slow turnaround
(makes securing families difficult), and unaddressed feedback (sites make suggestions on terminology and
little is done in response). There was also some general concern across sites that the YSET stay “up to date.”
The provider team at one site raised an important concern about the YSET’s inability to capture the change
in gang culture, to include tagging crews, for instance. For this site’s clients:
“The tool does not address the changing culture. In my day, it was about party crews, and now there are tagging crews, which are distinctly different from the traditional definition of “gang.” The tool needs
to be adapted – and more reflective of the dynamic culture. There are complicated dynamics at play and the YSET is very narrow.”
Administration Challenges
Several staff members at different sites expressed their belief that clients were anxious and apprehensive
about the YSET and often omitted key information. Because the YSET is administered early, staff feel that
youth do not yet trust the provider and due to this, sites feel that YSET results are often misleading. The lack
of honesty may result in an incorrect classification (e.g., the youth is deemed ineligible for services), so that
ultimately, providers feel youth are not receiving the services they actually need. Many staff expressed qualms
about “relying solely on the [dishonest] responses of the youth for qualification.” In order to confront this challenge and
correct the situation, staff requested a space to provide a more comprehensive narrative that is actually
considered when determining eligibility.
Providers also reported a sense of “responsible guilt” on the part of staff. They experience conflict between
“model fidelity vs. responding to families” needs and servicing them appropriately. As indicated by one staff,
“We are ultimately doing them a disservice.” Provider staff shared that they often challenge results, but find that this
process delays services for the youth and family – sometimes over a month – which results in losing the
family completely, creating unnecessary dropouts before enrollment is possible. One case manager shared,
“Parents get turned off because of time lapse in service provision, we try to keep potential clients engaged with various activities.”
Staff at another site explained that it is difficult to get kids to come back after the YSET, with one worker
stating:
21 2017 Evaluation Report
GRYD Gang Prevention
“After such personal questions they are scared away. Families like to keep their lives private. This perceived invasion of privacy impacts people
coming back. People in the community talk...if [a provider] gets [a] reputation for intruding into their lives, people turn away.”
Despite the challenges discussed above, GRYD Prevention Provider staff was focused on finding solutions to
increase the utility and effectiveness of the YSET. Below are recommendations offered by the providers:
Staff suggested that there be several introductory meetings perhaps at the school or a “trusted site”
before the tool is administered.
One site suggested parents also complete a survey regarding the youth’s behavior to validate youth
responses.
Some felt the survey was too long, especially for younger children. Attention is lost and they are less
apt to participate fully. Several sites suggested that the test be administered using a computer or iPad
so that youth would be more engaged, the survey process would be more participatory, and results
could be determined more quickly. This would also address several sites’ concerns about the lack of
quality control with data entry completed by hand.
Many staff indicated that they would like to have a better understanding of the scoring process and
how eligibility is computed.
Staff requested additional training to address emotional outbursts and resistance to the survey.
Staff also indicated a desire to have regular reports of findings from the process evaluation to
reinforce and inform their daily practice.
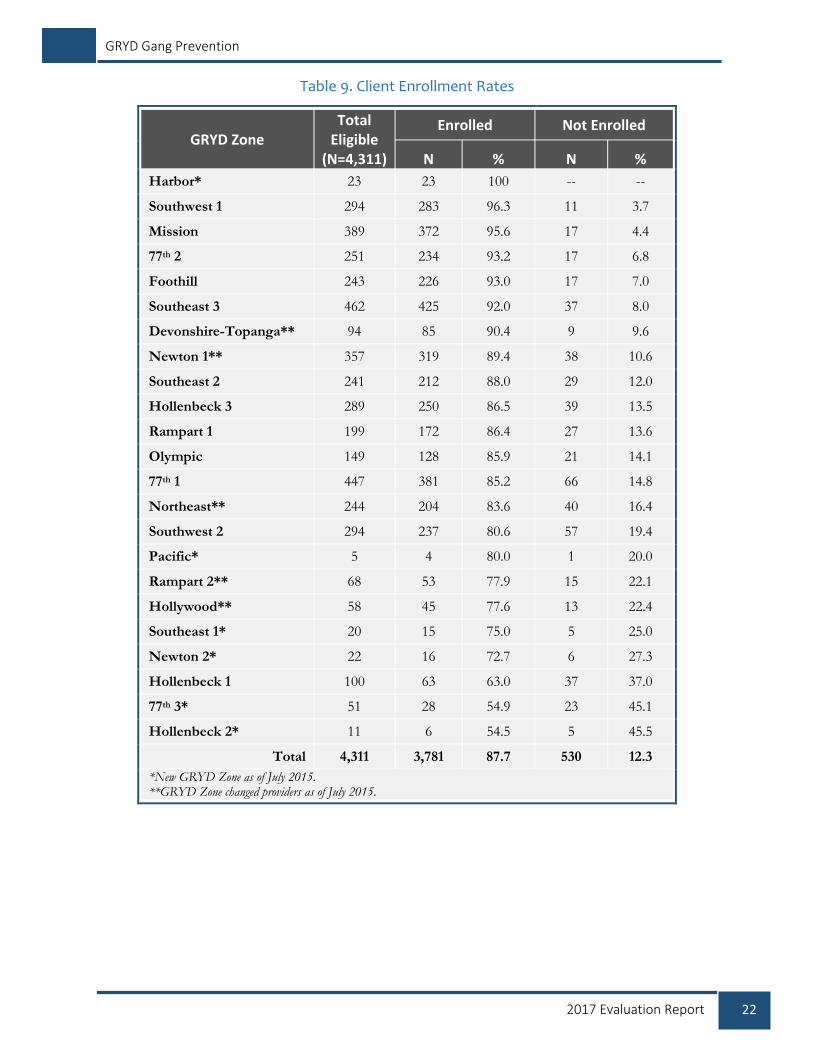
Client Enrollment in GRYD Prevention Services
At what rates do eligible youth enroll in services?
The majority of eligible youth were enrolled in GRYD Prevention Services (87.7%). All GRYD Zones
enrolled over half of those eligible for services and seven GRYD Zones enrolled over 90% of those found
eligible. The Zones with the lowest enrollment rates were 77th 3 (54.9%) and Hollenbeck 2 (54.5%).
22 2017 Evaluation Report
GRYD Gang Prevention
Table 9. Client Enrollment Rates
GRYD Zone Total
Eligible (N=4,311)
Enrolled Not Enrolled
N % N %
Harbor* 23 23 100 -- --
Southwest 1 294 283 96.3 11 3.7
Mission 389 372 95.6 17 4.4
77th 2 251 234 93.2 17 6.8
Foothill 243 226 93.0 17 7.0
Southeast 3 462 425 92.0 37 8.0
Devonshire-Topanga** 94 85 90.4 9 9.6
Newton 1** 357 319 89.4 38 10.6
Southeast 2 241 212 88.0 29 12.0
Hollenbeck 3 289 250 86.5 39 13.5
Rampart 1 199 172 86.4 27 13.6
Olympic 149 128 85.9 21 14.1
77th 1 447 381 85.2 66 14.8
Northeast** 244 204 83.6 40 16.4
Southwest 2 294 237 80.6 57 19.4
Pacific* 5 4 80.0 1 20.0
Rampart 2** 68 53 77.9 15 22.1
Hollywood** 58 45 77.6 13 22.4
Southeast 1* 20 15 75.0 5 25.0
Newton 2* 22 16 72.7 6 27.3
Hollenbeck 1 100 63 63.0 37 37.0
77th 3* 51 28 54.9 23 45.1
Hollenbeck 2* 11 6 54.5 5 45.5
Total 4,311 3,781 87.7 530 12.3
*New GRYD Zone as of July 2015. **GRYD Zone changed providers as of July 2015.

23 2017 Evaluation Report
GRYD Gang Prevention
What are the demographic and other characteristics of GRYD Prevention Services clients?
During the period examined, 3,781 youth were enrolled in GRYD Prevention Services.21 The demographic
characteristics of youth who completed the Youth Services Eligibility Tool (YSET), those referred to the
program, and those who enrolled in services were fairly similar. Over half of those who enrolled in the
program were male (60.6%) and under 13 years old (53.0%). The vast majority of GRYD clients were Latino
(73.4%) or African American (22.6%). For the breakdown of the demographic characteristics GRYD clients,
please refer to the Appendix.
The majority of clients either lived at home with one biological parent only (44.9%) or at home with both
biological parents (34.3%).
Table 10. Client Characteristics: Living Situation
Living Situation (N=3,770) Enrolled
N %
Home with one biological parent only 1,694 44.9
Home with both biological parents 1,293 34.3
Home with biological parent and stepparent 454 12.0
Home of relative (Living with a relative, legal guardian, or grandparent)
266 7.1
Splits time between biological parents and relatives 39 1.0
Out of home placement (Foster care and group home placements)
24 0.6
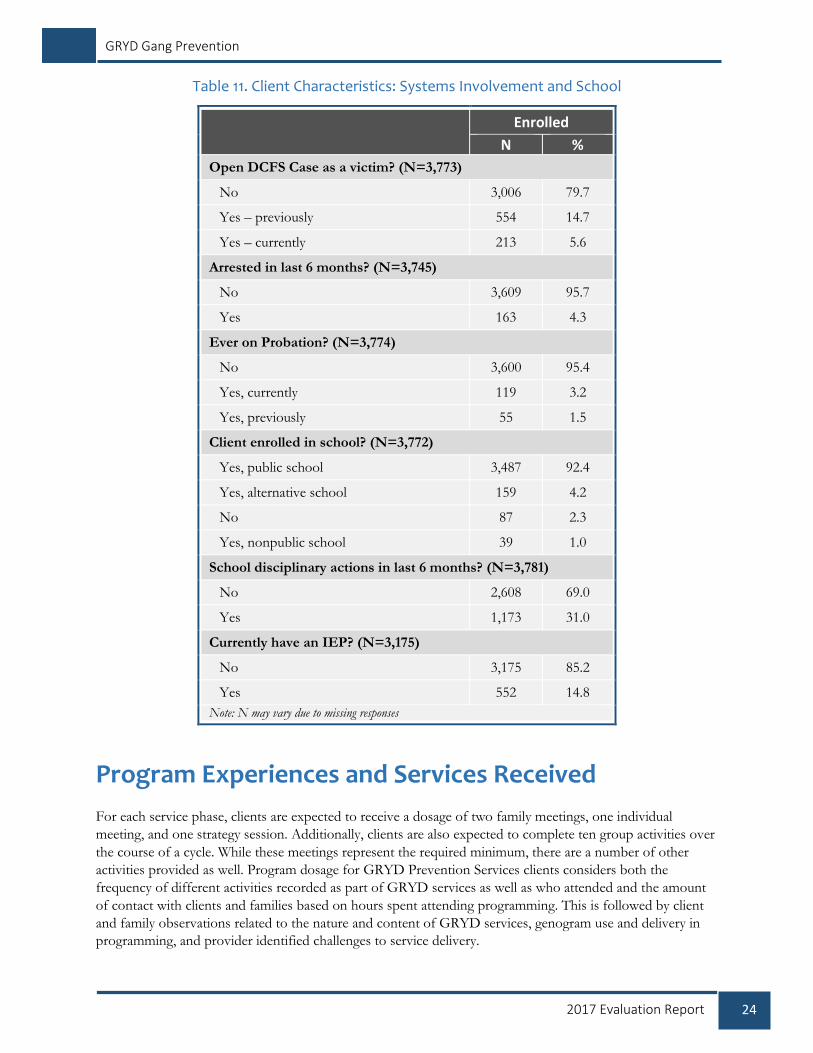
About one in five clients (20.3%) had current or previous Department of Children and Family Services
(DCFS) child welfare involvement. In terms of involvement in the juvenile justice and criminal justice system,
only a small portion reported being arrested in the last 6 months (4.3%) or having ever been on probation
(3.2% currently on probation and 1.5% previously on probation).
The majority of clients were enrolled in public schools (92.4%) and close to one-third (31.0%) reported that
there was some type of disciplinary action taken against them in school within the past 6 months. Close to
15.0% of all clients had an individualized education plan (IEP) indicating a need for special education
services.
21 A small number of clients who leave GRYD Prevention Services return at a later time. If a youth meets eligibility guidelines at both time points, they are allowed to re-enroll in the program. The demographic characteristics presented here represent the number of program enrollments; therefore, youth enrolled in the program twice are counted twice.
24 2017 Evaluation Report
GRYD Gang Prevention
Table 11. Client Characteristics: Systems Involvement and School
Enrolled
N %
Open DCFS Case as a victim? (N=3,773)
No 3,006 79.7
Yes – previously 554 14.7
Yes – currently 213 5.6
Arrested in last 6 months? (N=3,745)
No 3,609 95.7
Yes 163 4.3
Ever on Probation? (N=3,774)
No 3,600 95.4
Yes, currently 119 3.2
Yes, previously 55 1.5
Client enrolled in school? (N=3,772)
Yes, public school 3,487 92.4
Yes, alternative school 159 4.2
No 87 2.3
Yes, nonpublic school 39 1.0
School disciplinary actions in last 6 months? (N=3,781)
No 2,608 69.0
Yes 1,173 31.0
Currently have an IEP? (N=3,175)
No 3,175 85.2
Yes 552 14.8
Note: N may vary due to missing responses
Program Experiences and Services Received
For each service phase, clients are expected to receive a dosage of two family meetings, one individual
meeting, and one strategy session. Additionally, clients are also expected to complete ten group activities over
the course of a cycle. While these meetings represent the required minimum, there are a number of other
activities provided as well. Program dosage for GRYD Prevention Services clients considers both the
frequency of different activities recorded as part of GRYD services as well as who attended and the amount
of contact with clients and families based on hours spent attending programming. This is followed by client
and family observations related to the nature and content of GRYD services, genogram use and delivery in
programming, and provider identified challenges to service delivery.
25 2017 Evaluation Report
GRYD Gang Prevention
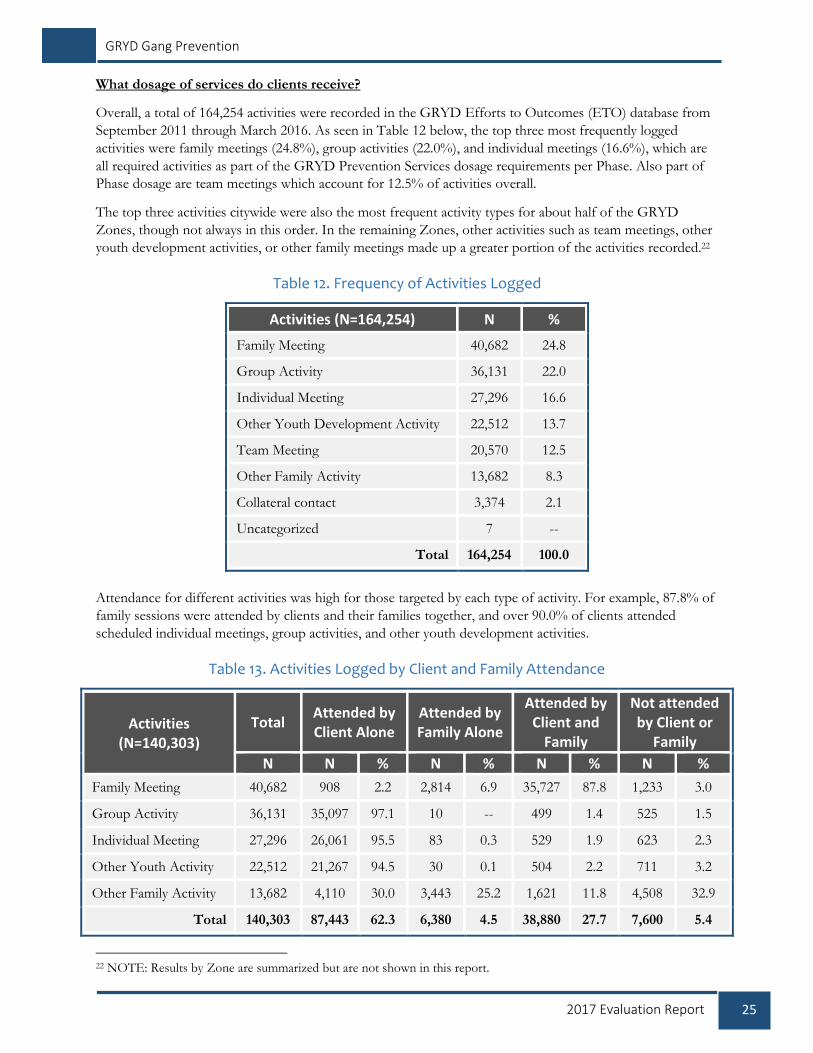
What dosage of services do clients receive?
Overall, a total of 164,254 activities were recorded in the GRYD Efforts to Outcomes (ETO) database from
September 2011 through March 2016. As seen in Table 12 below, the top three most frequently logged
activities were family meetings (24.8%), group activities (22.0%), and individual meetings (16.6%), which are
all required activities as part of the GRYD Prevention Services dosage requirements per Phase. Also part of
Phase dosage are team meetings which account for 12.5% of activities overall.
The top three activities citywide were also the most frequent activity types for about half of the GRYD
Zones, though not always in this order. In the remaining Zones, other activities such as team meetings, other
youth development activities, or other family meetings made up a greater portion of the activities recorded.22
Table 12. Frequency of Activities Logged
Activities (N=164,254) N %
Family Meeting 40,682 24.8
Group Activity 36,131 22.0
Individual Meeting 27,296 16.6
Other Youth Development Activity 22,512 13.7
Team Meeting 20,570 12.5
Other Family Activity 13,682 8.3
Collateral contact 3,374 2.1
Uncategorized 7 --
Total 164,254 100.0
Attendance for different activities was high for those targeted by each type of activity. For example, 87.8% of
family sessions were attended by clients and their families together, and over 90.0% of clients attended
scheduled individual meetings, group activities, and other youth development activities.
Table 13. Activities Logged by Client and Family Attendance
Activities (N=140,303)
Total Attended by Client Alone
Attended by Family Alone
Attended by Client and
Family
Not attended by Client or
Family
N N % N % N % N %
Family Meeting 40,682 908 2.2 2,814 6.9 35,727 87.8 1,233 3.0
Group Activity 36,131 35,097 97.1 10 -- 499 1.4 525 1.5
Individual Meeting 27,296 26,061 95.5 83 0.3 529 1.9 623 2.3
Other Youth Activity 22,512 21,267 94.5 30 0.1 504 2.2 711 3.2
Other Family Activity 13,682 4,110 30.0 3,443 25.2 1,621 11.8 4,508 32.9
Total 140,303 87,443 62.3 6,380 4.5 38,880 27.7 7,600 5.4
22 NOTE: Results by Zone are summarized but are not shown in this report.

26 2017 Evaluation Report
GRYD Gang Prevention
Time spent in these activities is shown in Table 14. For this analysis, family meetings were considered
completed when both the client and family attended while group activities and individual meetings were
considered completed when attended by the client alone. On average, the length of family meetings was
about an hour while individual meetings and group activities were both about two hours.
Table 14. Number of Hours of Contact by Completed Activity Type
Total
Complete Meetings
Hours of Complete Meetings
Total Complete
Family Meetings
Hours of Family
Meetings
Total Complete Individual Meetings
Hours of Individual Meetings
Total Complete
Group Activities
Hours of Group
Activities
Total: 97,913 165,600 35,727 35,643 26,590 60,855 35,596 69,102
What is the nature and content of individual experience with GRYD Prevention Services? What makes individuals stay? What individuals return for more services?
Given the significant amount of time spent in activities with clients and their families, the qualitative team was
interested in obtaining their program experiences directly from their voices. There was significant and
meaningful focus group data regarding client and family experiences.
Client Experience
At the start of each focus group, many of the client participants reported that they “didn’t choose to come to the
program,” and that they were being “forced” to participate in the program. This is perhaps not surprising as they
reported they were referred to GRYD through their school counselor or school principal because of bad
grades, behavioral problems, and/or poor school attendance. While hesitant about their involvement in
GRYD, once the focus groups were underway, client comments softened. As the focus groups continued,
client feelings and experiences of GRYD began to emerge.
The majority of clients who participated in focus groups described how they felt “supported” and “taken care of”
by their “counselors.” Several clients cited tutoring as one of the most useful services, declaring, “[GRYD] helped
me with my behavior at school…and to raise my grades!” Clients said that they also expected that with time, they
would develop trust and build a more solid relationship with their case managers. It is notable that, to date,
many of the client participants were fairly new to GRYD Prevention Services and, in fact, were not even
aware what GRYD stood for – or what the program was intended to provide. This did not affect their
positive response to the program but supports providers’ belief that they want to partner with the GRYD
Office and do more to enhance name recognition in the community.
Along with concerns noted by provider staff regarding the use of the word “gang” the clients also expressed
their feelings about being labeled. One young man insisted, “this program is for gangs…I don’t need to be here because
I didn’t do anything wrong.” Others echoed this sentiment saying, “It scared me at first” and, “I didn’t want to be
known as a gang member. I could wind up on probation.” However, clients reported that once they realized what the
program was for, they moved beyond their initial hesitation. Clients expressed being able to talk to their case
managers about life, school, and problems at home, stating, “They encourage us – they give us strategies. They help us
with things that we are struggling with.” One youth expressed:
“Let’s say I wanted to join a gang and be a gang member…by going to this program it’ll like help me by preventing that – not being a gangster.”
Clients also appreciated that the GRYD staff provided them with supplies for school and sports. There was
an implicit indication that clients would continue to be involved in GRYD programming. The majority of

27 2017 Evaluation Report
GRYD Gang Prevention
young men and women in all of the focus groups talked about what they would like to experience moving
forward, indicating they would like to participate in more group activities that give them time to bond with
one another. At one particular site, clients had a long list of positive program experiences, including but not
limited to, food drives, basketball tournaments, life skills classes, arts and crafts, community parties, and field
trips. One client reminisced, sharing:
“My favorite memory is when we went sailing in San Pedro. We were taught how to sail and we got to help. We got to explore
the boat. I hope we do it again. I’d never done this before.”
When asked about their experience with GRYD and what program aspects they valued, clients came to life
and were articulate about their involvement. One client shared, “It helps minors get ready for life. And be a better
person.” Other enthusiastic comments, heard repeatedly across sites, included:
“A place to come together and get support.”
“[We] trust our case managers and they help us.”
“We want to keep coming back.”
“We get to go on field trips and do a lot of things.”
“A place to come to and talk and get your mind off things.”
Parent Experience
Although youth were initially hesitant to express their feelings about the GRYD experience, this did not
prove to be the case with their parents. The focus groups conducted with parents consisted primarily of
mothers and they were lively and enthusiastic from the onset. All of the parent participants spoke positively
about their involvement with GRYD. They consistently reported that they feel supported by their case
managers and are beginning to notice changes in their children’s behavior and attitude at home and at school,
such as their children getting better grades, exhibiting better behavior, and acting more responsibly and
respectfully as a result of the afterschool tutoring that GRYD provides.
“He’s more respectful. The school has noticed a change. My son is more responsible. He doesn’t tell everyone off. We went from a 0.05 GPA to a 3.75 GPA because of our
Case Manager! Without our Case Manager I couldn’t get across to him.”
Parents agreed that having the chance to meet with and talk to other parents has been invaluable. Many
parents expressed concern about the program coming to an end and hope that they are given the opportunity
to continue services. By and large, they felt that the period of service provision is too short and that they
would benefit from an extended timeline. Some parents mentioned that they have other children who don’t
fit in the age bracket but who could definitely benefit from GRYD Prevention Services. All parent
participants felt that the program met their expectations and, as a result, they would enthusiastically
recommend it to other parents, citing:
“This program helps you immediately; it’s like a family and you’re not alone. There’s always a solution to the problem and it gives you more hope. It’s given my children
and myself more self-esteem. I have more self-esteem than I used to.”
Overwhelmingly, parents noted that in addition to seeing positive changes in their children, they too are
experiencing positive changes in themselves. Their comments reflect this experience, with parents observing:
28 2017 Evaluation Report
GRYD Gang Prevention
“My child has changed a lot. I have changed a lot.”
“The program helped me build trust with him [my son].”
“We receive counseling here.”
“The activities we do with the kids, like art projects, help connect us. I never thought it would help unite us.”
“It’s made me a little more understanding, a little more open.”
“I have changed. Here I’ve learned that we need to support our youth, understand them, and find solutions.”
“We don’t fight anymore. We don’t scream anymore. We talk.”
How are strength-based genograms used? What occurs in the delivery and experience of genograms as a part of GRYD Prevention Services?
A unique aspect of GRYD Prevention Services is the use of strength-based genograms in programming. A
genogram is a visual depiction of family connections and dynamics, and in GRYD Prevention Services, they
are used as a tool to support multigenerational coaching. Construction of the genogram begins in Phase 2 and
continues throughout the length of enrollment. It is considered to be a living document; one that is open to
revision and is never considered to be “complete.” As the clients and family construct the genogram, they are
coached through the process of identifying and establishing relationships with positive familial connections
across three generations. During this process, clients and families also work to identify family strengths and
achievements and become more knowledgeable about their family origin. This component of the GRYD
Prevention Services model draws from the premise that expanded knowledge of family history and positive
emotional connections work to increase the ability of individuals to self-differentiate; resulting in increased
resiliency to gang joining.23
The use of strength-based genograms is apparent across all providers. This was evident throughout
participant observation, when the researchers noted that there were genograms displayed at several sites.
Provider staff were eager to explain its content and talked at length about the child or the family who had
created the genogram. One case manager offered a poignant illustration:
“The young man who created this had never met his father. He was incarcerated. He talked about what his father had done to go to prison but
how he was close to his grandfather, who was like his father. The youth also wanted to include his case manager in his genogram, he felt like she
was an auntie who helped him too. It was great working on this together.”
Many provider staff valued the genogram—or, as it is more commonly referred, the family tree. There was
general consensus that it was a valuable part of GRYD programming and assessment. Many sites said they
were “excited about getting started and using the genogram” and “interested to see how it works with our clients.” Sites
observed that there is undeniable value in locating positive people in the lives of these youth as it creates a
newfound resilience and begins the development of a more positive sense of identity. Displaying and talking
about these strengths and positive linkages helps to highlight important relationships that clients and their
families may have overlooked. However, along with the positive reactions, the providers expressed their
concerns. They described how the genogram proves logistically, and perhaps more importantly, emotionally,
challenging. There was a great deal of hesitation that surfaced among GRYD Prevention Providers on behalf
23 Cespedes, G., & Herz, D. C. (2011). The City of Los Angeles Mayor’s Office of Gang Reduction and Youth Development (GRYD) Comprehensive Strategy; Los Angeles: GRYD Office

29 2017 Evaluation Report
GRYD Gang Prevention
of clients and their families. For several workers across sites, the genogram was far too intrusive and “too
personal too soon.” Several providers elaborated on the issues that arise when, as one case manager explained:
“The genogram opens up a can of worms that pulls us away from our goals and distracts from the task at hand. We are put in a therapeutic
role that we are not prepared to handle.”
With higher-risk clients, the genogram often revealed extensive family trauma, crises, and chaos that staff was
not necessarily equipped to address. Another staff member thoughtfully reported that providers “are not
prepared to handle the difficult feelings and situations that arise with the client nor the secondary trauma [we] deal with.”
Having access to a clinician, whether internally or externally, to provide support during this time was highly
desired. The majority of providers believed this would prove extremely beneficial. A supervisor delineated
this widely held concern:
“Some things are out of our scope, so we have to refer...as first responders, and we need our issues attended to. Our work starts
to reflect these conflicts [that is, the quality of our work is compromised], community is traumatized, family is traumatized, workers
are traumatized...we need more support from the [GRYD Office].”
There was general agreement that is incredibly important that GRYD Prevention Providers be meticulous
and sensitive about how they respond to the trauma that is shared. Providers felt that mandatory debriefing,
counseling, and support should be built into the GRYD model. For several sites, having case managers share
their own genograms has made the process easier and more seamless. Most significantly, several providers
suggested that working on the genogram in stages is also helpful. As one case manager offered, “this way we
don’t overwhelm clients, we can talk about issues and not rush to get the genogram done.”
It is critical to note that the concerns surrounding the administration of the genogram should not be
translated to a rejection of this approach. Virtually all providers agreed that it was a useful component of
GRYD Prevention Services. One site appreciated the opportunity to uncover family history, enthusing:
“[The genogram] reveals history that [the youth] weren’t aware of, helps identify relatives and how lives evolved, barriers that have been broken down, kids are encouraging family discussions, families
are staying connected to those they are close to…”
Along with this appreciation of the genogram, across nearly all sites, staff discussed the need to establish trust
and respect and provide a safe space for the clients and/or families to be vulnerable. In summarizing their
concerns, providers requested additional training around the creation and facilitation of the genogram, which
would increase consistency in administration across sites. One individual observed:
“There’s a real need for consistency, I know there are basic formats, but people are utilizing different versions – we’d benefit from standardization.”
The majority of clients, many of whom were relatively new to GRYD, were unfamiliar with the genogram.
Those who have completed, or were in the process of completing, indicated that the experiences of
constructing their family trees were positive and openly stated that they liked learning more about their
extended families. Client focus group participants were open to working with case managers further on their
genogram as they learned more about their families. One client shared, “we may have never known our other family
members, so this way we can learn about them.” Two others openly enthused that they found “positive relationships”

30 2017 Evaluation Report
GRYD Gang Prevention
and “role models” in their family. What emerged from the client focus groups were their feelings that the
experience of the genogram was useful along with being emotionally meaningful. It was very clear from
participant responses that they gained a great deal from this exercise. As one client offered, “I always thought my
family had nothing but trouble, but there were a lot of good things going on in my family. I can learn from that.”
Family members who learned about the genogram and received the opportunity to participate in the exercise
found it extremely valuable. It was clear that GRYD Prevention Providers worked to include parents in the
construction of the genogram, even when they were initially reluctant or unsure what they needed to do to
participate. One mother mentioned that after completing the exercise, her son was so excited to learn about
their extended family that they planned a trip across country to visit family members whom they’ve never met
before. In addition, another parent shared that while her children had always asked questions about their
relatives and extended family, it had never occurred to her to discuss with them any relationships other than
grandparents. The genogram exercise helped her realize that they could and should be having these
discussions. Yet another woman noted that while she had not kept in touch with “either side” of her family,
because of the genogram she was able to identify family members at her father’s funeral. She also was able to
share the “family tree” with other family members and that it encouraged and helped her kids introduce
themselves to other relatives. Several parents provided helpful insight:
“Because of all the branches my son knows who is family is, who is there to help support him. He knows there are college graduates in our family.
It’s good. It motivated my son and gave him something to look up to.”
“It was great to teach my child about our multicultural heritage.”
“The family tree helped us to see that each person has needs, it helps us talk about things. What does each family member do, what do they like/
not like. We learned about how we can work together – be a better team.”
Retention in Services
At the end of each cycle of services, a reassessment process is completed in order to assist with determining if
a client should continue for another cycle, if they are ready to graduate, or if further review is required (such
as applying for a third cycle or possible transfer to GRYD Intervention Family Case Management (FCM)
Services). Reassessment is intended to be a holistic look at progress made over the course of the cycle and
includes examination of Youth Services Eligibility Tool (YSET) results; progress on identified problem
behaviors; input from the client, family, and provider staff; and other factors. Not all clients remain in
programming long enough to reach reassessment; some formally withdraw and some leave for other reasons.
This section examines the 2,499 GRYD Prevention Services cases for which exit information was available
during the period examined. Exit information was recoded into two categories:
Successful completions: This category included clients who graduated the program successfully.
Unsuccessful completions: This category included cases in which (1) the case was closed due to
long-term non-attendance; (2) client and family formally dropped out or refused services; and (3)
GRYD Prevention Services were no longer appropriate or necessary. It is important to note that this
category may include clients and families that stop attending because they felt they received sufficient
support to be successful on their own.

31 2017 Evaluation Report
GRYD Gang Prevention
This section examines: (1) the percentage of cases that were completed successfully and unsuccessfully, (2)
the relationship between client characteristics and program exit status (i.e., successful or unsuccessful
completion), (3) enrollment length by program exit status, and (4) dosage by program exit status.
What are program completion rates?
Close to two-thirds (62.9%) of clients who were eligible and enrolled in services did not complete the
program successfully, but these rates varied across GRYD Zones and providers (see Table 15). The GRYD
Zone with the highest successful completion rate was Southwest 1 with 61.1% of their clients completing
successfully.
Table 15. Program Completion by Exit Type
GRYD Zone Total Exits
(N=2,499)
Successful Completion of Program
Unsuccessful Completion of Program
N % N %
Southwest 1 193 118 61.1 75 38.9
Foothill 147 83 56.5 64 43.5
Mission 286 151 52.0 135 47.2
Olympic 51 25 49.0 26 51.0
Southeast 3 287 115 40.1 172 59.9
Rampart 2** 30 11 36.7 19 63.3
77th 1 306 108 35.3 198 64.7
77th 2 114 37 32.5 77 67.5
Newton 1** 294 87 29.6 207 70.4
Hollenbeck 3 101 29 28.7 72 71.3
Southeast 2 121 34 28.1 87 71.9
Southwest 2 129 35 27.1 94 72.9
Rampart 1 127 33 26.0 94 74.0
Northeast** 186 45 24.2 141 75.8
Devonshire-Topanga**
73 13 17.8 60 82.2
Hollenbeck 1 11 1 9.1 10 90.9
Hollywood** 41 2 4.9 39 95.1
77th 3* 2 0 -- 2 100
Harbor* -- -- -- -- --
Hollenbeck 2* -- -- -- -- --
Newton 2* -- -- -- -- --
Pacific* -- -- -- -- --
Southeast 1* -- -- -- -- --
Total 2,499 927 37.1 1,572 62.9
*New GRYD Zone as of July 2015. **GRYD Zone changed providers as of July 2015.

32 2017 Evaluation Report
GRYD Gang Prevention
How do client characteristics relate to program completion?
Chi-square tests examined the relationship between a number of client characteristics (e.g., gender, age, living
situation, child welfare involvement, arrests, probation, school status, school disciplinary action, and special
education status) and exit status (i.e., successful and unsuccessful program completion). Results showed
statistically significant differences across the following client characteristics:
Clients under the age of 13 were more likely to successfully complete the program compared to
clients 13 and older. (See Table 16.)
Clients who live with both biological parents had the highest rate of successful program completion
(42.4%), while those in a home care placement had the lowest completion rate at 23.5%. However, it
should be noted that the number of clients living in home care placements is small (n=17). (See
Table 16.)
Clients without an open child welfare (DCFS) case had a higher rate of successful program
completion (38.8%) compared to clients with a current or previous DCFS case (29.7 and 29.8%
respectively). (See Table 17.)
Clients with no arrests in the last 6 months had a higher rate of successful program completion
(37.7%) compared to those who had been arrested (22.9%). (See Table 17.)
Clients with no disciplinary actions at school in the last 6 months had a higher rate of successful
program completion (39.8%) compared to clients who experienced disciplinary action (30.5%). (See
Table 17.)
Table 16. Characteristics Related to Program Completion: Age and Living Situation
Total
Successful Completion of
Program
Unsuccessful Completion of
Program
N % N % Age (N=2,499) X2(1, N=2,499)=5.52, p=.01
Under 13 1,339 525 39.2 814 60.8
13 and older 1,160 402 34.7 758 65.3
Living Situation (N=2,490) X2(5, N=2,490)=18.18, p<.01
Home with both biological parents 864 366 42.4 498 57.6
Home with one biological parent only 1,105 396 35.8 709 64.2
Home of relative (Living with a relative, legal guardian, or grandparent)
171 56 32.7 115 67.3
Home with biological parent and stepparent 309 98 31.7 211 68.3
Splits time between biological parents and relatives 24 7 29.2 17 70.8
Home care placement (Foster care and group home placements)
17 4 23.5 13 76.5
Note: N may vary due to missing responses

33 2017 Evaluation Report
GRYD Gang Prevention
Table 17. Characteristics Related to Program Completion: Systems Involvement and School
Total
Successful Completion of
Program
Unsuccessful Completion of
Program
N % N % Open DCFS Case as a victim? (N=2,493) X2(2, N=2,493)=13.74, p<.01
No 2,012 781 38.8 1,231 61.2
Yes – previously 336 100 29.8 236 70.2
Yes – currently 145 43 29.7 102 70.3
Arrested in last 6 months? (N=2,491) X2(1, N=2,491)=8.65, p<.01
No 2,395 903 37.7 1,492 62.3
Yes 96 22 22.9 74 77.7
School disciplinary actions in last 6 months? (N=2,499) X2(1, N=2,499)=19.27, p<.01
No 1,765 703 39.8 1,062 60.2
Yes 734 224 30.5 510 69.5
Note: N may vary due to missing responses
How does length in programming differ between clients who completed the program and those who
did not?
As shown in Table 18, the longer a client remained in services, the more likely they were to successfully
complete the program. Clients who successfully completed GRYD Prevention Services were enrolled in the
program for an average of 365 days, while those who did not successfully complete the program were
enrolled for an average of 240 days. The percentage of successful exits increased consistently through 21-24
months of service where it peaked for this group. Only two exceptions exist for this pattern: there is a dip in
successful completion clients in the 9-12 months of service (from 44.6% to 37.4%) and a small decrease for
those enrolled for more than 24 months from 65.1% to 63.3%. Conversely, less than one percent of clients
who were enrolled for 1-3 months successfully completed programming.

34 2017 Evaluation Report
GRYD Gang Prevention
Table 18. Enrollment Length by Exit Status
Length in services Total
(N=2,420)
Successful Completion of Program
Unsuccessful Completion of Program
N % N %
1 – 3 months 198 1 0.5 197 99.5
3 – 6 months 434 38 8.8 396 91.2
6 – 9 months 663 296 44.6 367 55.4
9 – 12 months 361 135 37.4 226 62.6
12 – 15 months 379 219 57.8 160 42.2
15 – 18 months 224 134 59.8 90 40.2
18 – 21 months 88 47 53.4 41 46.6
21 – 24 months 43 28 65.1 15 34.9
24+ months 30 19 63.3 11 36.7
Average enrollment (days) 365 240
*Clients with a negative number of enrollment months and those in services for more than 5 years were removed from analysis.
How does dosage differ between clients who complete the program and those who do not?
Clients who successfully exited the program attended an average of 56 activities during their time in
programming while those who exited unsuccessfully attended an average of 26 activities. As can be seen in
Table 19 below, the more activities attended the greater the likelihood that clients will successfully complete
the program. Only a very small percentage of clients (2.7%) who attended 1-10 activities were exited
successfully from programming. For the clients who received the largest dosage of activities (101+), 63.8%
successfully completed the program. Yet, this trend reverses in two instances; 59.5% of clients who attended
between 71-80 activities were successful (a decrease from 68.8% for clients in the 61-70 activity bracket) and
for those who attended more than 100 activities (decreasing to 63.8% from 68.8% for clients who attended
91-100 activities).

35 2017 Evaluation Report
GRYD Gang Prevention
Table 19. Dosage Received by Exit Status
Total Number of Activities
Attended by Clients
All Exits (N=2,499)
Successful Completion of Program
Unsuccessful Completion of
Program
N % N %
0 51 3 5.9 48 94.1
1-10 547 15 2.7 532 97.3
11-20 387 67 17.3 320 82.7
21-30 403 180 44.7 223 55.3
31-40 271 131 48.3 140 51.7
41-50 192 101 52.6 91 47.4
51-60 192 132 68.8 60 31.3
61-70 132 91 68.9 41 31.1
71-80 74 44 59.5 30 40.5
81-90 53 35 66.0 18 34.0
91-100 48 33 68.8 15 31.3
101+ 149 95 63.8 54 36.2
Average number of activities 56 26
What is the nature and content of individual experience with GRYD Prevention Services? How does
this relate to staying in/quitting services?
Across GRYD Zones, client dropout is a specific concern for GRYD Prevention Providers. This was
explored closely in focus groups with clients. There were multiple reasons cited as causing or contributing to
dropout. These included, but were not limited to: client/family have had their needs met and/or have met
their goals. Sites saw these reasons as positive explanations for withdrawal, but in most instances, dropout
reasons include decreased family engagement, relocation (either moving out of the state or, specifically, out of
the GRYD Zone), chronic non-attendance, or economic pressures on family (poverty, unemployment,
immigration, and health/well-being).
One of the main concerns, and reasons clients expressed for considering dropping out surrounded the
GRYD Prevention Providers’ connection with the parents. However, there was a divergence of opinion.
Some clients did not like how involved their parents were; several clients added that it made them
“uncomfortable” that GRYD providers came to their house. The remarks of one young man embody this
sentiment: “It feels weird. Them coming to your house. That you’re in our house and you see some people talking about you. It’s
sort of weird.” But there were clients at another site that believed parental involvement was crucial to their
success. Another young man observed, “It is important for family to be involved…it helps my mom and dad so that they
can help me…at home and at school.” Several of the clients who participated in focus groups expressed their
feelings and opinions that GRYD has helped their relationships with their parents and has increased
communication at home. One young woman highlighted this positive relationship, explaining, “They help work
with family problems…help us have a better bond with family.” Another stressed the importance of good decision-
making strategies instilled by their case manager, “They give me advice…like for high school and family.”

36 2017 Evaluation Report
GRYD Gang Prevention
What programmatic strategies are used by GRYD Prevention Providers to deliver services and encourage program completion? What are the primary reasons for dropping out and how does this relate to the "tipping point" for quitting services in the quantitative data?
Most of the providers felt that it was too early to comment on reasons for dropout or associate it with a
potential phase, but there were five sites (nearly 40%) that indicated that dropout was most frequently seen
early on, within the first month, or, in phase three through phase five. Provider staff expressed:
“Participation level decreases, excitement has worn off, and when we begin to talk more seriously about deep issues, there’s some push back.”
Attrition concentrated early in the program was not surprising, with one worker commenting, “If we can’t capture them in the first month, they aren’t ready...this is why we lose them in the beginning.” Another staff member offered that dropout is related to parental involvement – parents misunderstand the process and “want staff to be miracle workers, without making their own changes.” Providers expressed the belief that the primary reason for drop out could be attributed to the very heavy schedule of family engagement. Overall, all of the sites (with the exception of one) thought that the 30-day dosage of two family sessions, one individual session, and one strategy session proved to be somewhat difficult for family to fulfill. The GRYD Prevention Providers wanted to make it clear that they were not simply complaining. Instead, several sites explained that when coupled with the contractual obligation to hold 10 group activities24 across six months, sites are struggling to meet the defined requirements in a timely manner. Many staff claimed that these activities are crucial to the success of their clients and that they serve as incentives, promote new experiences, enhance education, increase prosocial embeddedness with peers, and support positive family functioning. In actuality, sites felt that they do far more than the minimal GRYD requirements but have trouble compartmentalizing their efforts into the prescribed dosage and the prescribed time period, a time line it was frequently difficult for families to meet. Family sessions, in particular, posed barriers to service provision in terms of scheduling, transportation, and degree of commitment. Providers at two sites offered their observations on the struggle to engage the family:
“Family sessions are a challenge – it’s a real concern...parents make the commitment and then they falter/realize what they are getting into. Parental lack
of participation often results in clients being discharged.”
“Parents don’t want to do the activities, they say, ‘there’s nothing wrong with me, it’s my child.’ They come in to us and say ‘fix my child.’”
It is critical to note that providers in several GRYD Zones have been thoughtful and pro-active in terms of
outreach and retention. Reaching these parents required a great deal of psychoeducation in addition to
creating a foundation of trust, neither of which can be solidified so quickly. One site implemented a parent
committee to appropriately determine their wants and needs and to establish ongoing parental inclusion in
the service delivery process. Another site has created a particularly robust parent engagement component to
their programming, including a commitment form and clearly outlined expectations. This form sets high
standards, ensures transparency, and helps hold parents accountable. This method helps reframe GRYD from
a “fix the kids” model to a model based on parental responsibility. Team members from this site shared:
24 Including, but not limited to: life skills, arts and crafts, leadership skills, college visits, job development, team building, poetry/writing workshops, tutoring, family game nights, food/supply giveaways, resource fairs, or cooking/nutrition demonstrations.
37 2017 Evaluation Report
GRYD Gang Prevention
“Parents need to contribute, participate, monitor, and supervise. Family includes community – the schools, churches, and the coaches – anyone who has an impact on this child. We are expanding the definition of a parent to include caregivers.”
Challenges to Service Delivery
GRYD Prevention Providers reported facing challenges with regards to GRYD Zone boundaries, with some
of the newer Zones expressing their concern that at times those boundaries are confusing, or that Zones are
exceedingly large – making accessibility, and more significantly, safety, a substantial concern. For example, if a
GRYD Zone covers a large territory (e.g. multiple neighborhoods) it could result in a larger than usual
number of program participants. One provider suggested breaking their zone down into more geographically
accessible regions, a strategy used in both Hollenbeck and Southeast Divisions. These larger Zones also
present safety and financial concerns for many clients and parents who may encounter challenges, such as
having to cross rival or outside gang territory or rely on public transportation that is often perceived as
dangerous. In order to get referrals, and meet the demands of their GRYD contracts, providers are doing
duplicate work and repeating activities in order to cater to all interested clients. Great care is taken to make
sure programs and activities are held in different areas (of the same GRYD Zone) in order to protect client
safety and ensure fair service provision across the Zone. One site shared,
“Youth from certain neighborhoods can’t make it to our center. It’s dangerous. It’s a safety hazard. And transportation is also complicated. And the geography – it’s not walkable. We don’t have an accessible office for youth in this part of the Zone yet. Really, the zoning has complicated things. We have to think outside the box
and use community spaces that are safe and convenient for our youth and families.
When considering the GRYD Prevention Services model, the vast majority of sites, 73.3% (11 of 15), report concern over the 6-month timeframe allocated for this one cycle and the transition period between phases. One case manager described their challenges trying to help clients in a short time period, explaining that, “The 6-month timeframe is not realistic—how much can we really expect a youth to change in 6 months? Change takes a long time.” Another echoed this sentiment, “The desired GRYD outcomes simply cannot be measured in 6 months.” This is further reinforced by the high rate of clients who enter into a second cycle. “It takes a second cycle to get the job done,” a provider insisted. At a different provider, one case manager echoed this observation:
“This is when we actually see the changes beginning to take affect... families are reaching out on their own for help as we’ve finally built
a relationship based on communication and trust.”
In reality, all providers are allowed to enter clients into a second 6 month phase cycle if at Cycle 1
reassessment they determine that that is the best course for the client without seeking approval from GRYD.
In order to ensure that sites understand GRYD policies, it appears to be important for policy surrounding
dosage and timeline be reviewed. Based on feedback from staff, as well as interviews with clients and families,
several sites are not aware that they can enter into a second cycle without approval from GRYD. Reiterating
this policy would likely alleviate many of the frustrations with the “short” timeline and clarify the reality that
GRYD policy shows sensitivity to the need to allow adequate time for change to take hold.
Understanding these challenges to their work, GRYD Prevention Providers reported that they always leave
the door open for families to return when/if they are ready. Whether or not they are actual/current clients,
providers do what they can to provide youth with the services they need. One staff member eloquently
summarized, “They may drop out but they don’t leave us.” Another echoed these sentiments, “We never close the door.”

38 2017 Evaluation Report
GRYD Gang Prevention
Outcome Evaluation Results n addition to examining who is served by the City of Los Angeles Mayor’s Office of Gang Reduction
and Youth Development (GRYD) Prevention Services and their experiences in programming, this
evaluation also measured whether client behaviors changed over time. As mentioned earlier, clients
participating in services complete the Youth Services Eligibility Tool (YSET) every six months, which
provides a measure of how their behaviors may have changed during the course of receiving services from
GRYD Prevention Providers. This section examines the impact of programming on the changes in clients’
levels of risk—i.e., the impact of programming on reducing risk and increasing protective factors.
Measuring Changes in Client Risk
Changes in client risk levels and increase in positive factors was measured in two ways. First, eligibility rates
for clients were compared over time, and secondly, changes in each YSET scale were compared at the time of
enrollment and six months after enrollment in services. To determine whether any attitude and/or behavioral
changes were due to GRYD programming, the YSET scale results for GRYD Prevention Services clients
were compared to YSET results for probation-involved youth who were part of a separate study.
Are there changes in the YSET-based eligibility over time for GRYD clients?
To be eligible for GRYD Prevention Services, a youth’s YSET must indicate an elevated level of risk on four
or more of the nine scales used to determine eligibility. All GRYD Prevention Services clients were eligible at
their initial YSET, but as Table 20 shows, only 42.5% of clients were still eligible after receiving six months of
GRYD services. Youth eligibility status can only change if there has been a reduction in the number of risk
factors that exceed the threshold for “high risk.”
Table 20. Eligibility Results at YSET-R
Total N
Remained Eligible at Six Months
No Longer Eligible at Six Months
1,620 689
(42.5%) 931
(57.5%)
How did YSET scales change in order to reduce eligibility rates over time?
Analysis of the number of scales on which clients demonstrated an elevated level of risk at intake and their
first reassessment was conducted to examine changes in their overall level of risk. Client YSET scores at their
initial assessment were compared to their scores at reassessment (six months after beginning programming).
Changes in YSET scores over time were classified into three categories: an increased level of risk, no change,
or a decrease. As shown in Table 21, 83.4% of clients had a decrease in the number of scales that either met
or exceeded the risk thresholds between the YSET Intake (YSET-I) and YSET Retest (YSET-R).
I
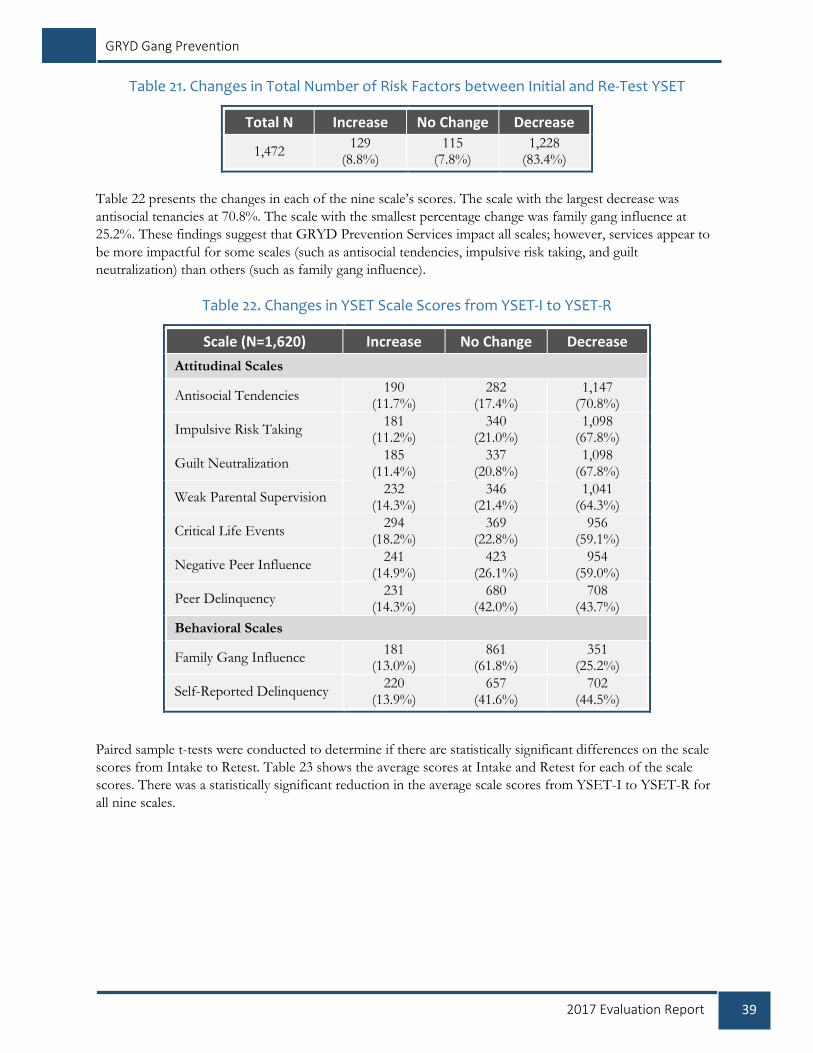
39 2017 Evaluation Report
GRYD Gang Prevention
Table 21. Changes in Total Number of Risk Factors between Initial and Re-Test YSET
Total N Increase No Change Decrease
1,472 129
(8.8%) 115
(7.8%) 1,228
(83.4%)
Table 22 presents the changes in each of the nine scale’s scores. The scale with the largest decrease was
antisocial tenancies at 70.8%. The scale with the smallest percentage change was family gang influence at
25.2%. These findings suggest that GRYD Prevention Services impact all scales; however, services appear to
be more impactful for some scales (such as antisocial tendencies, impulsive risk taking, and guilt
neutralization) than others (such as family gang influence).
Table 22. Changes in YSET Scale Scores from YSET-I to YSET-R
Scale (N=1,620) Increase No Change Decrease
Attitudinal Scales
Antisocial Tendencies 190
(11.7%) 282
(17.4%) 1,147
(70.8%)
Impulsive Risk Taking 181
(11.2%) 340
(21.0%) 1,098
(67.8%)
Guilt Neutralization 185
(11.4%) 337
(20.8%) 1,098
(67.8%)
Weak Parental Supervision 232
(14.3%) 346
(21.4%) 1,041
(64.3%)
Critical Life Events 294
(18.2%) 369
(22.8%) 956
(59.1%)
Negative Peer Influence 241
(14.9%) 423
(26.1%) 954
(59.0%)
Peer Delinquency 231
(14.3%) 680
(42.0%) 708
(43.7%)
Behavioral Scales
Family Gang Influence 181
(13.0%) 861
(61.8%) 351
(25.2%)
Self-Reported Delinquency 220
(13.9%) 657
(41.6%) 702
(44.5%)
Paired sample t-tests were conducted to determine if there are statistically significant differences on the scale
scores from Intake to Retest. Table 23 shows the average scores at Intake and Retest for each of the scale
scores. There was a statistically significant reduction in the average scale scores from YSET-I to YSET-R for
all nine scales.
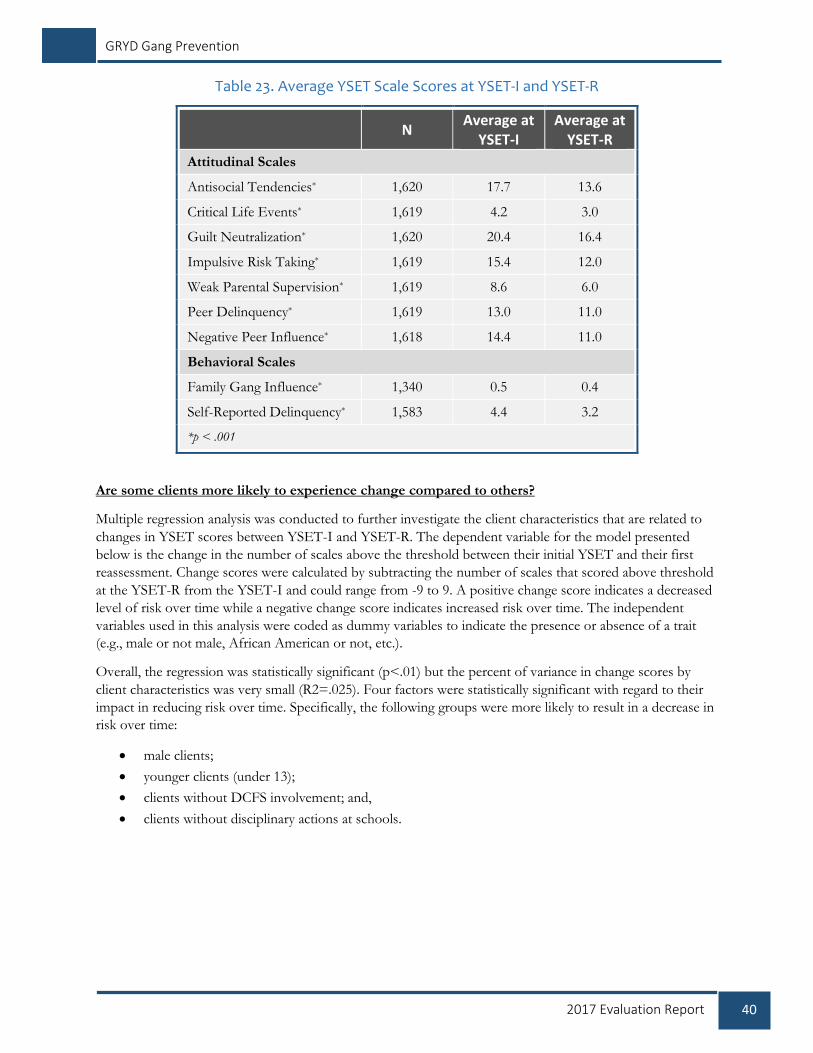
40 2017 Evaluation Report
GRYD Gang Prevention
Table 23. Average YSET Scale Scores at YSET-I and YSET-R
N Average at
YSET-I Average at
YSET-R
Attitudinal Scales
Antisocial Tendencies* 1,620 17.7 13.6
Critical Life Events* 1,619 4.2 3.0
Guilt Neutralization* 1,620 20.4 16.4
Impulsive Risk Taking* 1,619 15.4 12.0
Weak Parental Supervision* 1,619 8.6 6.0
Peer Delinquency* 1,619 13.0 11.0
Negative Peer Influence* 1,618 14.4 11.0
Behavioral Scales
Family Gang Influence* 1,340 0.5 0.4
Self-Reported Delinquency* 1,583 4.4 3.2
*p < .001
Are some clients more likely to experience change compared to others?
Multiple regression analysis was conducted to further investigate the client characteristics that are related to
changes in YSET scores between YSET-I and YSET-R. The dependent variable for the model presented
below is the change in the number of scales above the threshold between their initial YSET and their first
reassessment. Change scores were calculated by subtracting the number of scales that scored above threshold
at the YSET-R from the YSET-I and could range from -9 to 9. A positive change score indicates a decreased
level of risk over time while a negative change score indicates increased risk over time. The independent
variables used in this analysis were coded as dummy variables to indicate the presence or absence of a trait
(e.g., male or not male, African American or not, etc.).
Overall, the regression was statistically significant (p<.01) but the percent of variance in change scores by
client characteristics was very small (R2=.025). Four factors were statistically significant with regard to their
impact in reducing risk over time. Specifically, the following groups were more likely to result in a decrease in
risk over time:
male clients;
younger clients (under 13);
clients without DCFS involvement; and,
clients without disciplinary actions at schools.
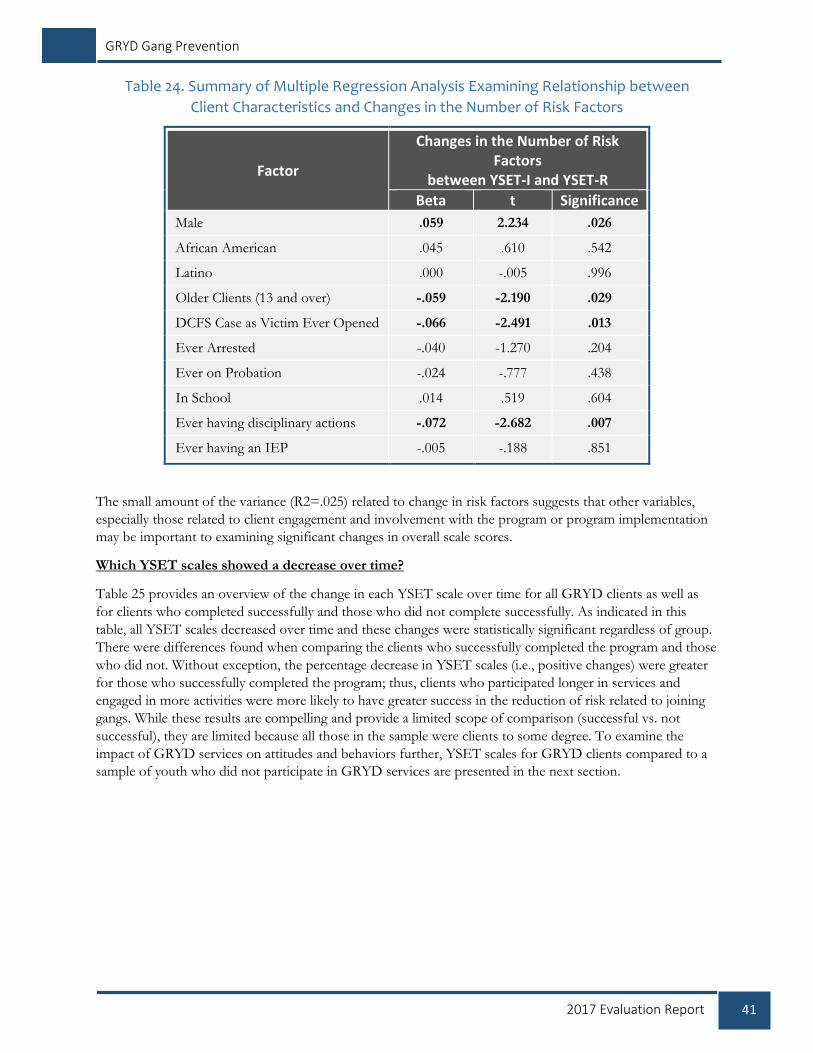
41 2017 Evaluation Report
GRYD Gang Prevention
Table 24. Summary of Multiple Regression Analysis Examining Relationship between
Client Characteristics and Changes in the Number of Risk Factors
Factor
Changes in the Number of Risk Factors
between YSET-I and YSET-R
Beta t Significance
Male .059 2.234 .026
African American .045 .610 .542
Latino .000 -.005 .996
Older Clients (13 and over) -.059 -2.190 .029
DCFS Case as Victim Ever Opened -.066 -2.491 .013
Ever Arrested -.040 -1.270 .204
Ever on Probation -.024 -.777 .438
In School .014 .519 .604
Ever having disciplinary actions -.072 -2.682 .007
Ever having an IEP -.005 -.188 .851
The small amount of the variance (R2=.025) related to change in risk factors suggests that other variables,
especially those related to client engagement and involvement with the program or program implementation
may be important to examining significant changes in overall scale scores.
Which YSET scales showed a decrease over time?
Table 25 provides an overview of the change in each YSET scale over time for all GRYD clients as well as
for clients who completed successfully and those who did not complete successfully. As indicated in this
table, all YSET scales decreased over time and these changes were statistically significant regardless of group.
There were differences found when comparing the clients who successfully completed the program and those
who did not. Without exception, the percentage decrease in YSET scales (i.e., positive changes) were greater
for those who successfully completed the program; thus, clients who participated longer in services and
engaged in more activities were more likely to have greater success in the reduction of risk related to joining
gangs. While these results are compelling and provide a limited scope of comparison (successful vs. not
successful), they are limited because all those in the sample were clients to some degree. To examine the
impact of GRYD services on attitudes and behaviors further, YSET scales for GRYD clients compared to a
sample of youth who did not participate in GRYD services are presented in the next section.

42 2017 Evaluation Report
GRYD Gang Prevention
Table 25. Change in Average YSET Scale Scores at YSET-I and YSET-R
Scale
All Clients (N=1340 – 1620)
Completed Successfully (N=396 – 537)
Closed Unsuccessfully (N=570 – 680)
YSET-I YSET-R %
Change YSET-I YSET-R
% Change
YSET-I YSET-R %
Change
Attitudinal Scales
Antisocial Tendencies 17.7 13.6* -23.2 17.8 12.9* -27.5 17.8 14.2* -20.2
Critical Life Events 4.2 3.0* -28.6 4.2 2.8* -33.3 4.4 3.3* -25.0
Guilt Neutralization 20.4 16.4* -19.6 20.4 15.5* -24.0 20.6 17.1* -17.0
Impulsive Risk Taking 15.4 12.0* -22.1 15.3 11.3* -26.1 15.4 12.4* -19.5
Weak Parental Supervision 8.6 6.0* -30.2 8.7 5.6* -35.6 8.7 6.5* -25.3
Peer Delinquency 13.0 11.0* -15.4 12.9 10.4* -19.4 13.6 11.8* -13.2
Negative Peer Influence 14.4 11.0* -23.6 14.2 10.4* -26.8 14.3 11.5* -19.6
Behavioral Scales
Family Gang Influence 0.5 0.4* -20.0 0.5 0.3* -40.0 0.6 0.5** -16.7
Self-Reported Delinquency 4.4 3.2* -27.3 4.4 2.8* -36.4 4.8 3.7* -22.9 *p < .001 **p < .005 Note: N may vary due to missing responses
How do GRYD clients compare to youth who did not receive GRYD Prevention Services? Do both
groups experience similar changes in risk over time?
The analysis included in this section compares changes in risk over time among a sample of GRYD
Prevention Services clients and a sample of similar youth in Los Angeles County who were engaged in a
recent study funded by the National Institute of Justice (NIJ).25 This comparison group provides an
opportunity to document the impact GRYD Prevention Services had on changes in attitudes and behaviors
over time relative to the County comparison group.
A total of 428 youth between the ages of 11 and 16 agreed to participate and were enrolled in the NIJ study.
Almost all of the participating youth (n=391; 91.4%) completed both a YSET-I and a YSET-R. Of these, 179
county sample youth were high risk (4 or more risk factors) and were included in the comparison. Of this
group, 70.4% were male and 82.7% were Latino. The YSET-I was administered to the county study
participants between April 4, 2011 and June 12, 2013. The follow-up YSET-R was conducted between July 5,
2012 and September 16, 2013.
The county sample was compared to a sample of 1,023 GRYD clients, who also scored above thresholds for
4 or more risk scales. The GRYD sample was comprised of 59.5% males and 77.0% Latino. These interviews
were conducted for the following dates: for the YSET-I – April 26, 2013 to April 11, 2016; for the YSET-R –
April 29, 2014 to September 7, 2016.26
25 Hennigan, K. M., Kolnick, K. A., Vindel, F., & Maxson, C. L. (2015). Targeting youth at risk for gang involvement: Validation of a gang risk assessment to support individualized secondary prevention. Children and Youth Services Review, 56, 86-96. 26 The present analyses statistically account for the amount of time between baseline and retest visits, meaning the observed differences between the GRYD and LA County samples cannot be attributed to the fact that some participants were assessed at 6 months, while others were assessed at 18 months.
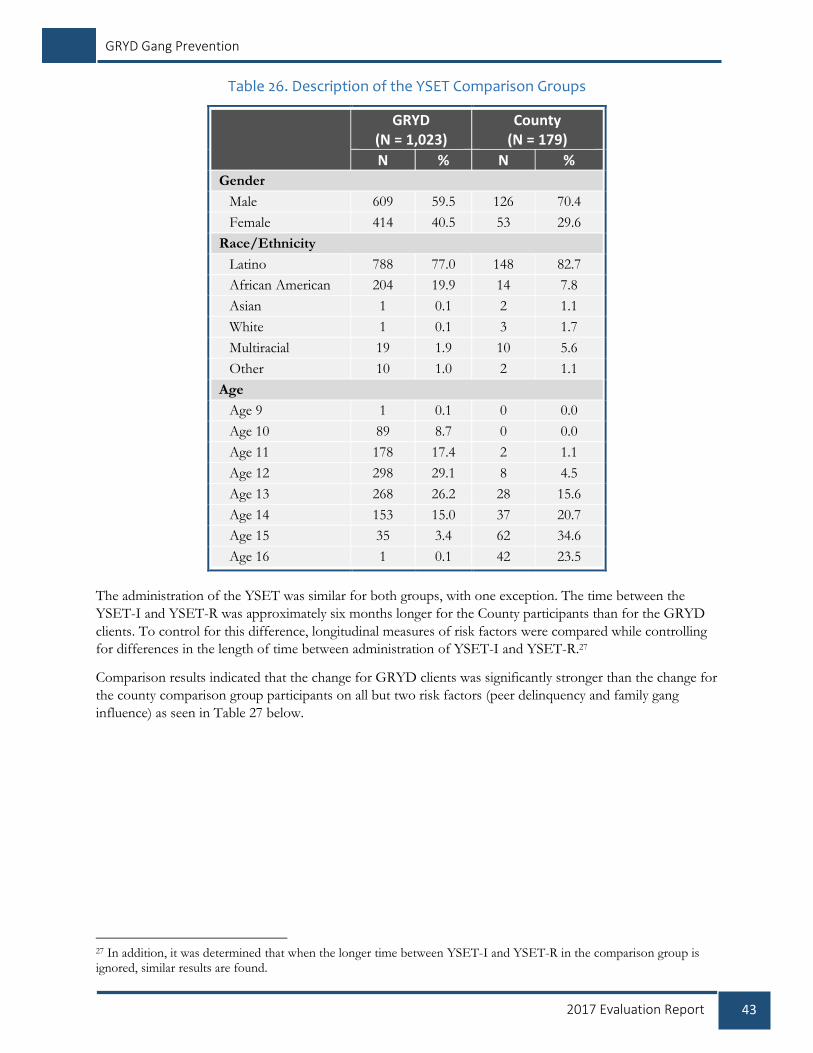
43 2017 Evaluation Report
GRYD Gang Prevention
Table 26. Description of the YSET Comparison Groups
GRYD
(N = 1,023) County
(N = 179)
N % N % Gender
Male 609 59.5 126 70.4
Female 414 40.5 53 29.6
Race/Ethnicity
Latino 788 77.0 148 82.7
African American 204 19.9 14 7.8
Asian 1 0.1 2 1.1
White 1 0.1 3 1.7
Multiracial 19 1.9 10 5.6
Other 10 1.0 2 1.1
Age
Age 9 1 0.1 0 0.0
Age 10 89 8.7 0 0.0
Age 11 178 17.4 2 1.1
Age 12 298 29.1 8 4.5
Age 13 268 26.2 28 15.6
Age 14 153 15.0 37 20.7
Age 15 35 3.4 62 34.6
Age 16 1 0.1 42 23.5
The administration of the YSET was similar for both groups, with one exception. The time between the
YSET-I and YSET-R was approximately six months longer for the County participants than for the GRYD
clients. To control for this difference, longitudinal measures of risk factors were compared while controlling
for differences in the length of time between administration of YSET-I and YSET-R.27
Comparison results indicated that the change for GRYD clients was significantly stronger than the change for
the county comparison group participants on all but two risk factors (peer delinquency and family gang
influence) as seen in Table 27 below.
27 In addition, it was determined that when the longer time between YSET-I and YSET-R in the comparison group is ignored, similar results are found.

44 2017 Evaluation Report
GRYD Gang Prevention
Table 27. Comparison of Average Scores and Percent Change for GRYD and County Samples
GRYD County
N Average Score at YSET-I
Average Score at YSET-R
% Change N Average Score at YSET-I
Average Score at YSET-R
% Change
Change in Number of Risk Factors
869 6.2 2.7* -56.5 179 6.1 5.1* -16.4
Attitudinal Scales
Antisocial Tendencies 1,023 18.0 13.6* -24.4 179 16.9 15.8* -6.5
Critical Life Events 1,022 4.4 3.0* -31.8 179 3.8 3.7* -2.6
Guilt Neutralization 1,023 20.5 16.3* -20.5 179 20.2 19.6* -3.0
Impulsive Risk Taking 1,022 15.4 11.8* -23.4 179 14.9 13.4* -10.1
Weak Parental Supervision 1,023 8.8 6.1* -30.7 179 7.6 7.3* -3.9
Peer Delinquency 1,021 13.7 11.6 -15.3 179 18.9 17.6 -6.9
Negative Peer Influence 1,022 14.9 11.3* -24.2 179 13.6 13.2* -2.9
Behavioral Scales
Family Gang Influence 722 0.5 0.3 -40.0 179 1.2 1.0 -16.7
Self-Reported Delinquency 1,003 4.8 3.5* -27.1 179 9.4 9.1* -3.2
* p < .001
Note: N may vary due to missing responses
At the YSET-I interview, the two groups had a similar level of risk factors for gang involvement (with an
average of about 6 high risks for each group). Both groups also showed a statistically significant decrease in
the number of high risks when assessed again 6 to 18 months later.
However, the magnitude of improvement over time (decreasing risk) was significantly greater for GRYD
clients than for youth in the county sample. Over time, GRYD Prevention Services clients reported
significantly fewer risk factors than did youth in the county sample. At YSET-R, those in the GRYD sample
reported an average reduction to 2.7 average risk factors relative to an average reduction to 5.1 risk factors
among the youth in the county sample as shown in Figure 5. Next, the change in each risk factor is examined
across the two groups.
Figure 5. Change in Number of Risk Factors at YSET-I and YSET-R
Average Score
N YSET-I YSET-R
GRYD 869 6.2 2.7
County 179 6.1 5.1
F(1, 1045) = 60.400. p < .001
0.0
2.0
4.0
6.0
8.0
Nu
mb
er
of
Ris
k F
acto
rs
GRYD County

45 2017 Evaluation Report
GRYD Gang Prevention
Risk Factor: Antisocial Tendencies
At YSET-I, GRYD Prevention Services clients reported significantly more antisocial tendencies (18.0) than
did youth in the county sample (16.9). At YSET-R, youth in the county sample reported significantly more
antisocial tendencies (15.8) than did GRYD clients (13.6). Although both groups’ antisocial tendencies
decreased over time relative to their baseline scores at the time of the YSET-I, GRYD clients improved
significantly more than the youth in the county sample.
Figure 6. Antisocial Tendencies: Difference in Change Over Time
Antisocial Tendencies
N YSET-I YSET-R
GRYD 1,023 18.0 13.6
County 179 16.9 15.8
F(1, 1199) = 32.655, p < .001
Risk Factor: Critical Life Events
At YSET-I, GRYD clients reported experiencing an average of 4.4 critical life events (e.g., school
suspension/expulsion, death of a family member/close friend, etc.) in the past year while youth in the county
sample experienced 3.8 events, which was a significantly higher average for the GRYD clients. At YSET-R,
youth in the county sample reported experiencing significantly more critical life events than did GRYD
clients. For clients in the GRYD sample, the number of critical life events significantly decreased over time to
3.0 events, while the number of critical life events reported by youth in the county sample remained virtually
unchanged at 3.7.
Figure 7. Critical Life Events: Difference in Change Over Time
Critical Life Events
N YSET-I YSET-R
GRYD 1,022 4.4 3.0
County 179 3.8 3.7
F(1, 1198) = 24.336, p < .001
12.0
13.0
14.0
15.0
16.0
17.0
18.0
Scale
Sco
reGRYD County
2.0
2.5
3.0
3.5
4.0
4.5
Scale
Sco
re
GRYD County

46 2017 Evaluation Report
GRYD Gang Prevention
Risk Factor: Guilt Neutralization
At YSET-I, both groups reported similar levels of guilt neutralization (i.e., the ability to rationalize their
behavior and, thus, feel less guilty after committing acts of gang-related violence) at 20.5 for GRYD and 20.1
for the county sample. Levels of guilt neutralization remained virtually unchanged for youth in the county
sample (19.6), but significantly decreased for GRYD clients (to 16.3), who reported significantly lower levels
at YSET-R.
Figure 8. Guilt Neutralization: Difference in Change Over Time
Guilt Neutralization
N YSET-I YSET-R
GRYD 1,023 20.5 16.3
County 179 20.2 19.6
F(1, 1199) = 32.256, p < .001
Risk Factor: Impulsive Risk Taking
At YSET-I, GRYD Prevention Services clients (15.4) and youth in the county sample (14.9) reported similar
levels of impulsive risk taking. Although both groups showed a statistically significant decrease in their levels
of impulsive risk taking, at YSET-R, GRYD clients reported significantly lower levels of impulsive risk taking
(11.8) compared to the county sample (13.4). The magnitude of improvement over time was significantly
greater for GRYD clients than youth in the county sample.
Figure 9. Impulsive Risk Taking: Difference in Change Over Time
Impulsive Risk Taking
N YSET-I YSET-R
GRYD 1,022 15.4 11.8
County 179 14.9 13.4
F(1, 1190) = 18.753, p < .001
15.0
16.0
17.0
18.0
19.0
20.0
21.0
Scale
Sco
reGRYD County
10.0
11.0
12.0
13.0
14.0
15.0
16.0
Scale
Sco
re
GRYD County
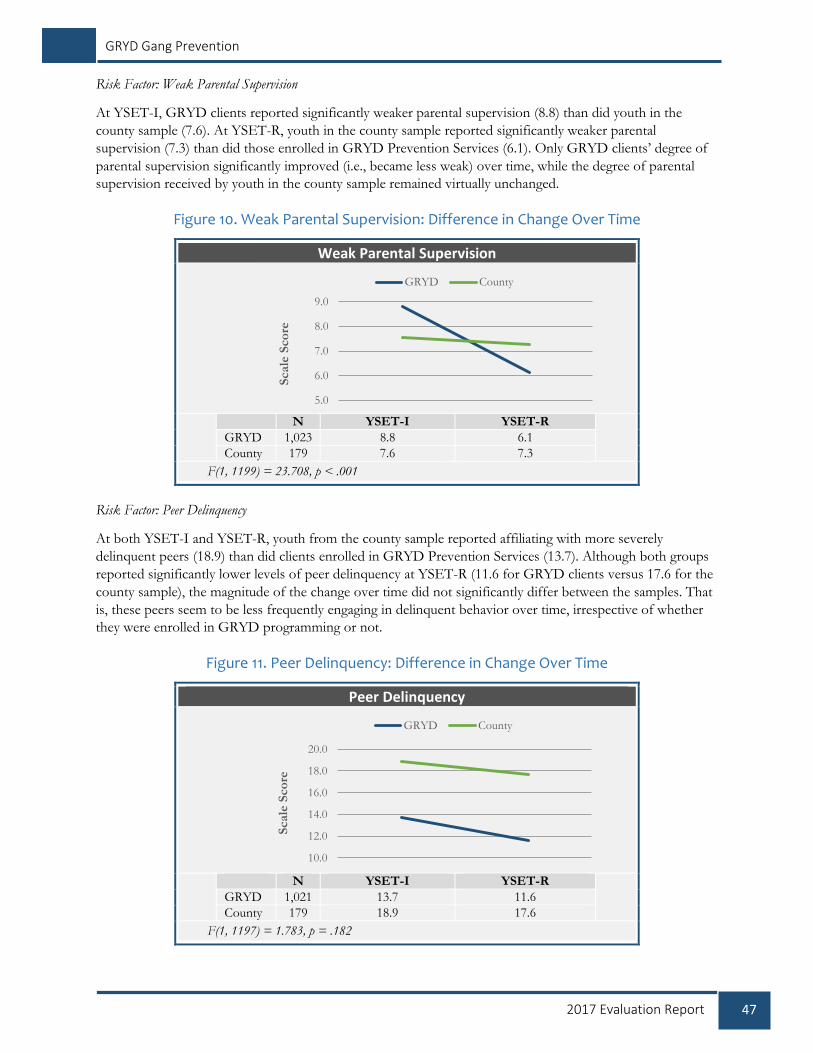
47 2017 Evaluation Report
GRYD Gang Prevention
Risk Factor: Weak Parental Supervision
At YSET-I, GRYD clients reported significantly weaker parental supervision (8.8) than did youth in the
county sample (7.6). At YSET-R, youth in the county sample reported significantly weaker parental
supervision (7.3) than did those enrolled in GRYD Prevention Services (6.1). Only GRYD clients’ degree of
parental supervision significantly improved (i.e., became less weak) over time, while the degree of parental
supervision received by youth in the county sample remained virtually unchanged.
Figure 10. Weak Parental Supervision: Difference in Change Over Time
Weak Parental Supervision
N YSET-I YSET-R
GRYD 1,023 8.8 6.1
County 179 7.6 7.3
F(1, 1199) = 23.708, p < .001
Risk Factor: Peer Delinquency
At both YSET-I and YSET-R, youth from the county sample reported affiliating with more severely
delinquent peers (18.9) than did clients enrolled in GRYD Prevention Services (13.7). Although both groups
reported significantly lower levels of peer delinquency at YSET-R (11.6 for GRYD clients versus 17.6 for the
county sample), the magnitude of the change over time did not significantly differ between the samples. That
is, these peers seem to be less frequently engaging in delinquent behavior over time, irrespective of whether
they were enrolled in GRYD programming or not.
Figure 11. Peer Delinquency: Difference in Change Over Time
Peer Delinquency
N YSET-I YSET-R
GRYD 1,021 13.7 11.6
County 179 18.9 17.6
F(1, 1197) = 1.783, p = .182
5.0
6.0
7.0
8.0
9.0
Scale
Sco
reGRYD County
10.0
12.0
14.0
16.0
18.0
20.0
Scale
Sco
re
GRYD County
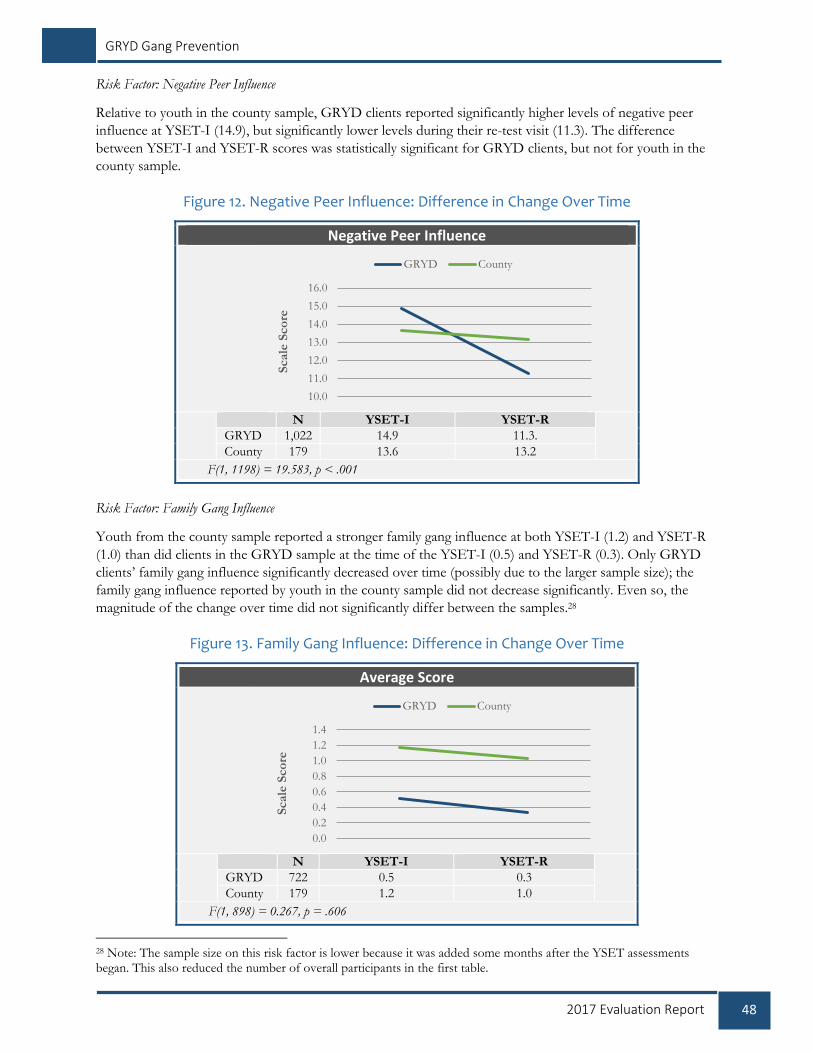
48 2017 Evaluation Report
GRYD Gang Prevention
Risk Factor: Negative Peer Influence
Relative to youth in the county sample, GRYD clients reported significantly higher levels of negative peer
influence at YSET-I (14.9), but significantly lower levels during their re-test visit (11.3). The difference
between YSET-I and YSET-R scores was statistically significant for GRYD clients, but not for youth in the
county sample.
Figure 12. Negative Peer Influence: Difference in Change Over Time
Negative Peer Influence
N YSET-I YSET-R
GRYD 1,022 14.9 11.3.
County 179 13.6 13.2
F(1, 1198) = 19.583, p < .001
Risk Factor: Family Gang Influence
Youth from the county sample reported a stronger family gang influence at both YSET-I (1.2) and YSET-R
(1.0) than did clients in the GRYD sample at the time of the YSET-I (0.5) and YSET-R (0.3). Only GRYD
clients’ family gang influence significantly decreased over time (possibly due to the larger sample size); the
family gang influence reported by youth in the county sample did not decrease significantly. Even so, the
magnitude of the change over time did not significantly differ between the samples.28
Figure 13. Family Gang Influence: Difference in Change Over Time
Average Score
N YSET-I YSET-R
GRYD 722 0.5 0.3
County 179 1.2 1.0
F(1, 898) = 0.267, p = .606
28 Note: The sample size on this risk factor is lower because it was added some months after the YSET assessments began. This also reduced the number of overall participants in the first table.
10.0
11.0
12.0
13.0
14.0
15.0
16.0S
cale
Sco
re
GRYD County
0.0
0.2
0.4
0.6
0.8
1.0
1.2
1.4
Scale
Sco
re
GRYD County
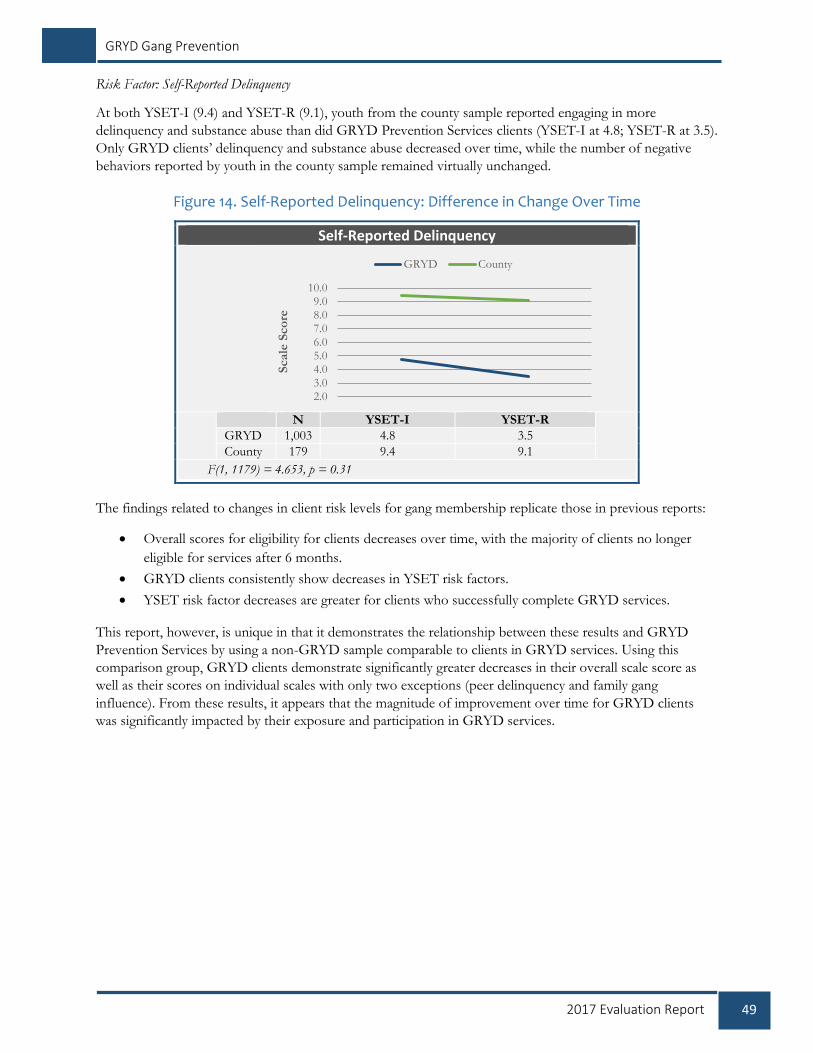
49 2017 Evaluation Report
GRYD Gang Prevention
Risk Factor: Self-Reported Delinquency
At both YSET-I (9.4) and YSET-R (9.1), youth from the county sample reported engaging in more
delinquency and substance abuse than did GRYD Prevention Services clients (YSET-I at 4.8; YSET-R at 3.5).
Only GRYD clients’ delinquency and substance abuse decreased over time, while the number of negative
behaviors reported by youth in the county sample remained virtually unchanged.
Figure 14. Self-Reported Delinquency: Difference in Change Over Time
Self-Reported Delinquency
N YSET-I YSET-R
GRYD 1,003 4.8 3.5
County 179 9.4 9.1
F(1, 1179) = 4.653, p = 0.31
The findings related to changes in client risk levels for gang membership replicate those in previous reports:
Overall scores for eligibility for clients decreases over time, with the majority of clients no longer
eligible for services after 6 months.
GRYD clients consistently show decreases in YSET risk factors.
YSET risk factor decreases are greater for clients who successfully complete GRYD services.
This report, however, is unique in that it demonstrates the relationship between these results and GRYD
Prevention Services by using a non-GRYD sample comparable to clients in GRYD services. Using this
comparison group, GRYD clients demonstrate significantly greater decreases in their overall scale score as
well as their scores on individual scales with only two exceptions (peer delinquency and family gang
influence). From these results, it appears that the magnitude of improvement over time for GRYD clients
was significantly impacted by their exposure and participation in GRYD services.
2.03.04.05.06.07.08.09.0
10.0S
cale
Sco
re
GRYD County

50 2017 Evaluation Report
GRYD Gang Prevention
Summary and
Recommendations “This program helps you immediately; it’s like a family and you’re not alone. There’s always a solution to the problem and it gives you more hope. It’s given my children
and myself more self-esteem. I have more self-esteem than I used to.”
Taken together, the results of this study provide substantial insight into who the City of Los Angeles Mayor’s
Office of Gang Reduction and Youth Development (GRYD) Prevention Services referrals and clients are; the
experiences of clients and families participating in GRYD Prevention Services; and the impact of GRYD
Prevention Services on client attitudes and behaviors. The 2017 report builds on previous reports completed
by the Urban Institute and represents the most comprehensive review of GRYD services and their impact on
client attitudes and behavior to date. Such a comprehensive examination of GRYD services is possible due to
institutionalized data systems throughout all GRYD Zones and the addition of in-depth qualitative
interviews/focus groups with program staff, clients, and family members of clients. Using these data, this
study was able to analyze data from September 1, 2011 through March 31, 2016 and complement these
results with the voice and perceptions of clients, their families, and program staff. Collectively, the findings
show that GRYD Prevention Services:
1) reached a large number of at-risk clients and their families;
2) provided a large number of activities and assistance to clients and their families; and
3) for those who enrolled in services, significantly reduced the risk of clients joining a gang,
especially among clients who successfully completed the services over time.
Summary of Findings from GRYD Efforts to Outcomes (ETO) and Youth Services Eligibility Tool (YSET) Data
Referrals to GRYD Prevention Services largely came from parent inquiries, school counselors, and youth
who self-referred. Most of the referrals were male, but slightly more than one-third were female. About half
of referrals were less than 13 years old while the
other half were between 13 and 15 years old. The
race/ethnicity of referrals was largely Latino and
African American, which is reflective of the
neighborhoods served by GRYD providers. Just
over half of referrals met the eligibility
requirements for services. Enrollment rates
varied by Zone, but taken together, nearly all of
the eligible youth subsequently enrolled in
services.
The demographics of clients reflected those of
the referrals with little difference. Additionally,
clients often lived with one biological parent or
both and were enrolled in public schools. Few
clients were involved in the juvenile justice
system, but about a third experienced a school
GRYD Prevention Client Profile
3,781 high-risk GRYD Prevention Clients
60.6% male
53.0% under 13 years old
73.4% Latino and 22.6% African American
79.2% lived at home with one biological parent
only (44.9%) or at home with both (34.3%)
31.0% had a school disciplinary action taken
against them in the last 6 months
20.3% had current or previous child welfare
involvement.
14.8% had an Individualized Education Plan
Received 165,254 activities during the study
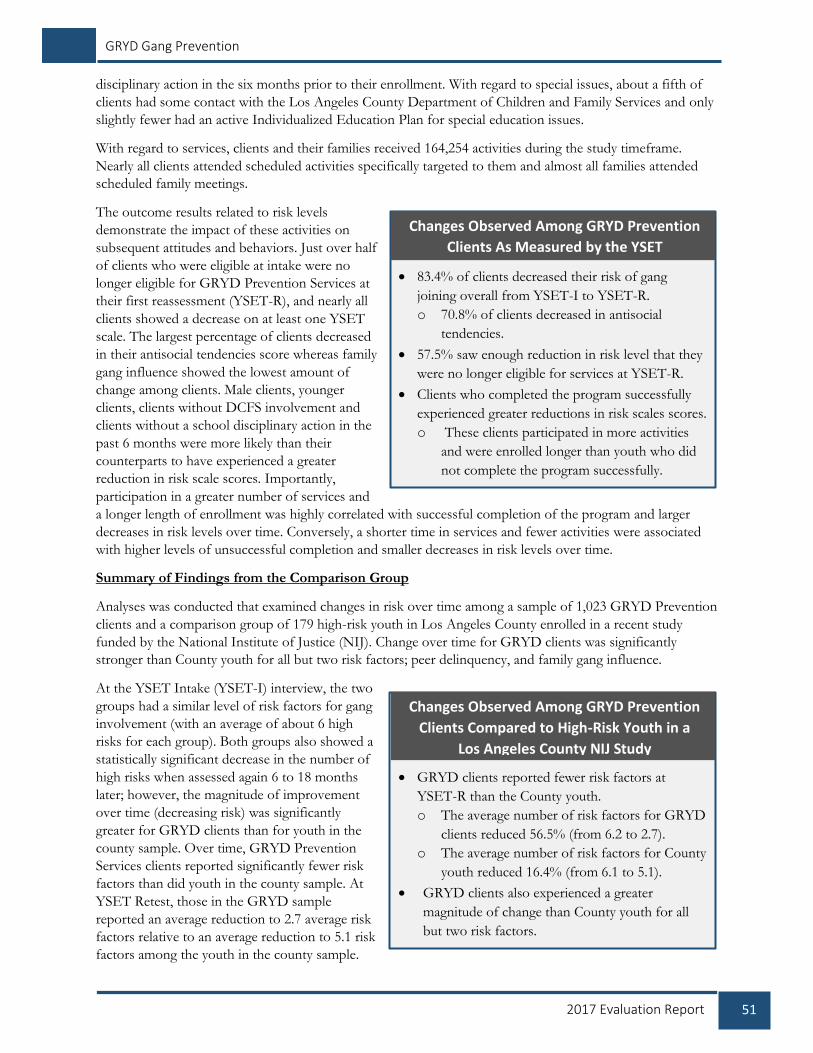
51 2017 Evaluation Report
GRYD Gang Prevention
disciplinary action in the six months prior to their enrollment. With regard to special issues, about a fifth of
clients had some contact with the Los Angeles County Department of Children and Family Services and only
slightly fewer had an active Individualized Education Plan for special education issues.
With regard to services, clients and their families received 164,254 activities during the study timeframe.
Nearly all clients attended scheduled activities specifically targeted to them and almost all families attended
scheduled family meetings.
The outcome results related to risk levels
demonstrate the impact of these activities on
subsequent attitudes and behaviors. Just over half
of clients who were eligible at intake were no
longer eligible for GRYD Prevention Services at
their first reassessment (YSET-R), and nearly all
clients showed a decrease on at least one YSET
scale. The largest percentage of clients decreased
in their antisocial tendencies score whereas family
gang influence showed the lowest amount of
change among clients. Male clients, younger
clients, clients without DCFS involvement and
clients without a school disciplinary action in the
past 6 months were more likely than their
counterparts to have experienced a greater
reduction in risk scale scores. Importantly,
participation in a greater number of services and
a longer length of enrollment was highly correlated with successful completion of the program and larger
decreases in risk levels over time. Conversely, a shorter time in services and fewer activities were associated
with higher levels of unsuccessful completion and smaller decreases in risk levels over time.
Summary of Findings from the Comparison Group
Analyses was conducted that examined changes in risk over time among a sample of 1,023 GRYD Prevention
clients and a comparison group of 179 high-risk youth in Los Angeles County enrolled in a recent study
funded by the National Institute of Justice (NIJ). Change over time for GRYD clients was significantly
stronger than County youth for all but two risk factors; peer delinquency, and family gang influence.
At the YSET Intake (YSET-I) interview, the two
groups had a similar level of risk factors for gang
involvement (with an average of about 6 high
risks for each group). Both groups also showed a
statistically significant decrease in the number of
high risks when assessed again 6 to 18 months
later; however, the magnitude of improvement
over time (decreasing risk) was significantly
greater for GRYD clients than for youth in the
county sample. Over time, GRYD Prevention
Services clients reported significantly fewer risk
factors than did youth in the county sample. At
YSET Retest, those in the GRYD sample
reported an average reduction to 2.7 average risk
factors relative to an average reduction to 5.1 risk
factors among the youth in the county sample.
Changes Observed Among GRYD Prevention
Clients As Measured by the YSET
83.4% of clients decreased their risk of gang
joining overall from YSET-I to YSET-R.
o 70.8% of clients decreased in antisocial
tendencies.
57.5% saw enough reduction in risk level that they
were no longer eligible for services at YSET-R.
Clients who completed the program successfully
experienced greater reductions in risk scales scores.
o These clients participated in more activities
and were enrolled longer than youth who did
not complete the program successfully.
Changes Observed Among GRYD Prevention
Clients Compared to High-Risk Youth in a
Los Angeles County NIJ Study
GRYD clients reported fewer risk factors at
YSET-R than the County youth.
o The average number of risk factors for GRYD
clients reduced 56.5% (from 6.2 to 2.7).
o The average number of risk factors for County
youth reduced 16.4% (from 6.1 to 5.1).
GRYD clients also experienced a greater
magnitude of change than County youth for all
but two risk factors.

52 2017 Evaluation Report
GRYD Gang Prevention
Summary of Findings from Interviews and Focus Groups with GRYD Prevention Provider Staff,
Clients, and Client Families
Overall, staff, clients, and client families felt GRYD Prevention Services had a significant and positive impact.
Despite initial hesitation, clients developed trust and rapport with their case managers. As time spent in the
program progressed, clients became more engaged and excited about their participation. Providers said that
parents’ express their enthusiasm for the program by referring other people they know to the program.
“Families are satisfied with our services and want to share this with a neighbor or friend who may be in need.” Another
provider offered, “When we do well with one kid – pretty soon the mothers and the fathers or the grandmothers want the
other sisters and brothers involved. We don’t even have to ask, they just come in with the other children or their cousins.” Clients
were most excited about the opportunity to become involved in myriad activities, including field trips,
homework help, and creative outlets. For parents, case managers became an extension of their family, as they
reported finding themselves frequently turning to them for help and support. Parents were especially
appreciative of the help they received for safe transportation and the purchase of supplies for school as well
as sports. Importantly, parents reported increased communication, decreased risk factors, and enhanced
relationships with their children. Families also gained much needed structure, time management, and positive
parenting strategies.
Following the emergence of the GRYD
Comprehensive Strategy in 2011, a process of
struggle, resistance, accommodation, and
acceptance has marked the landscape of GRYD
Gang Prevention. In the early developmental
years, several providers were extremely negative
about GRYD programming requirements.
It is apparent, however, from the interviews and
focus group conducted as part of this study, that
GRYD Prevention Providers are no longer
resistant, and in reality, have internalized
program values and goals. Providers reported
that their practices and services have changed.
“We don’t do things the same way,” one provider
offered, “The changes have been hard for us, but it’s
getting better.” Staff at another provider agreed. As
one case manager explained, “We see how it helps
kids and that’s all that matters to us.” Providers
ensured program fidelity, and went above and
beyond GRYD program requirements and
expectations to engage families and hold them
accountable and responsible for the success of
the program and the progress of their children.
Despite many positive aspects of GRYD Prevention Services, areas for improvement surfaced in many areas.
Each of these areas is described below.
Outreach
As a result of the diversity in years of involvement with GRYD, there was not a uniform recruitment strategy
across sites. Furthermore, there was a significant difference in level of success in developing school and
community partnerships. This appears to be directly correlated to the length of GRYD-provider partnership.
For instance, veteran providers reported experiencing far fewer challenges in overcoming school
bureaucracies compared with the accounts of newer providers. Despite these challenges, providers were
GRYD Provider Staff, Client, and
Client Family Experiences
Overall, staff, clients, and client families felt
GRYD Prevention Services had a significant and
positive impact.
Both parents and youth were engaged with, and
supported by, staff throughout the program.
GRYD Provider staff have internalized program
values and goals and have reported that over time
their practices and services have changed as they
have worked to implement the GRYD Prevention
Services model.
Areas for improvement identified by provider staff
included:
o assistance building successful outreach
strategies in the community;
o YSET support and review; and,
o support and training for addressing client and
family trauma.
53 2017 Evaluation Report
GRYD Gang Prevention
working to build their credibility in school settings through innovative and creative approaches. Overall, word
of mouth was the most frequently cited—and most successful—outreach strategy. Not surprisingly, this
correlated with the high rate of parent satisfaction and willingness to refer. Continuing to build successful
partnerships with community-based organizations and governmental agencies will only strengthen outreach,
recruitment, and referral efforts.
YSET
One marked internalization of GRYD values and culture involved use of the YSET to determine
participation eligibility, as well as client needs, strengths, and challenges. The newest iteration of the
assessment tool incorporated significant changes, resulting in more positive feedback than past versions.
However, despite the overall positive reaction to the YSET, individuals still expressed lingering concerns
about vocabulary and terminology, language comprehension for younger youth, as well as the length and
number of questions. Sites also noted that they perceive youth are incorrectly categorized (as “GRYD
Primary Prevention” or “GRYD Prevention Services”). Additionally, staff shared that many of the young
men and women referred are not comfortable answering “personal” questions early in their program
participation due to the lack of established relationship with the case manager. Prevention workers were
focused on finding solutions. Notably, this concern did not translate into a lack of compliance surrounding
the YSET, but instead resulted in a desire to create solutions to ease its administration.
Genogram
Both the acceptance and use of the family strength-based genogram has taken hold and solidified in sites
across the city. However, this positive response also included some disquiet. While sites recognized the
importance of the exercise, many voiced concerns about the implications of uncovering family trauma
requiring clinical intervention for which they were not prepared or trained. There was general agreement that
it is of the utmost importance that GRYD provider staff be meticulous and sensitive about how they respond
to trauma with clients and their families. Despite these misgivings, enthusiasm for the genogram was
consistent. There was general consensus that it was a valuable part of GRYD programming and assessment.
During interviews, many family members, as well as staff across sites, spoke directly about the personal
meaning of the genogram, offering such observations as: “It helped me to understand myself,” “I think everyone in
GRYD should be required to complete a genogram before we work with youth and their families,” and “This taught me a whole
different way of thinking about myself, my family, and my community, you can see why it works for youth and their families.”
Recommendations
Recommendations for this report focus on areas of concern identified by GRYD Prevention Providers
related to Youth Services Eligibility Tool (YSET) administration and processing, strength-based genograms,
training needs, and other general items such as increasing program visibility and improving relationships
within the communities served by GRYD.
YSET
Allow for staff assistance with future revisions.
Provide quicker turnaround of results (to reduce parental concern regarding “lapse in service”).
Genogram
Train staff on how to deal with trauma that arises.
54 2017 Evaluation Report
GRYD Gang Prevention
Training
Provide opportunities to have training held at various locations around LA.
Follow through on the consistent suggestion that GRYD continue to expand training opportunities
to include tangible, relevant tools and skills as well as on-going database and system training.
o Offer refresher training to providers related to program policy and application such as the
length of services, conditions for additional cycles without appeal, etc.
Offer “self-care” services for staff. Comments and observations consistently acknowledged the lack
of such support.
Expand opportunities and diversify experts, to include tangible, relevant tools and skills:
o Mental health (including self-mutilation and suicidal ideation)
o Substance abuse (Narcotics Anonymous and Alcoholics Anonymous)
o General case management
o Grief, loss, and trauma informed care
o Counseling/parenting skills (child development and child abuse)
o Mediation and Conflict Resolution
o Anger management and relationship violence (emphasis on younger children)
o Cultural sensitivity (with specific emphasis on immigration)
o Commercial sexual exploitation of children (CSEC)
Other
Market “GRYD” widely and strategically straight from the GRYD Office.
Assistance from the GRYD Office for Providers in brokering community relations.
o GRYD needs to reinforce program goals and criteria with LAUSD administration.
o GRYD Office to request dedicated space on school campus for GRYD services.
o Need for “certification” of GRYD Prevention Services provider staff.
Facilitate cross-site collaboration and better partnerships with GRYD Intervention FCM Providers.
Have the GRYD Office staff engage with families at graduations, community events, etc.
Review GRYD zoning – certain zones present geographic barriers and safety concerns.
Expand age limits for program eligibility.

55 2017 Evaluation Report
GRYD Gang Prevention
Appendix What are the demographic characteristics of GRYD Prevention Services clients?
During the period examined, 3,781 youth were enrolled in the GRYD Prevention Services.29 Over half of the
those enrolled in the program were male (60.6%) and under 13 years old (53%). The vast majority of clients
were Latino (73.4%) or African American (22.6%).
Table 28. Client Characteristics
Enrolled
N %
Gender (N=3,781)
Male 2,292 60.6
Female 1,489 39.4
Age (N=3,781)
Under 13 2,012 53.0
13 and older 1,769 46.8
Ethnicity (N=3,768)
Latino 2,767 73.4
African American 853 22.6
Asian 7 0.2
White 13 0.3
Other 31 0.8
Multi-Ethnic 97 2.3
Note: N may vary due to missing responses
29 A small number of youth who leave GRYD Prevention Services return at a later time. If a youth meets eligibility guidelines at both time points, they are allowed to re-enroll in the program. The demographic characteristics presented here represent the number of program enrollments; therefore, youth who were enrolled in the program twice are counted twice.