lawrence hunter, ph.d. professor and director computational bioscience program university of...
Post on 19-Dec-2015
214 views
TRANSCRIPT
Lawrence Hunter, Ph.D.Professor and DirectorComputational Bioscience ProgramUniversity of Colorado School of Medicine
[email protected]://compbio.uchsc.edu/Hunter
Knowledge-based Analysis ofGenome-scale Data
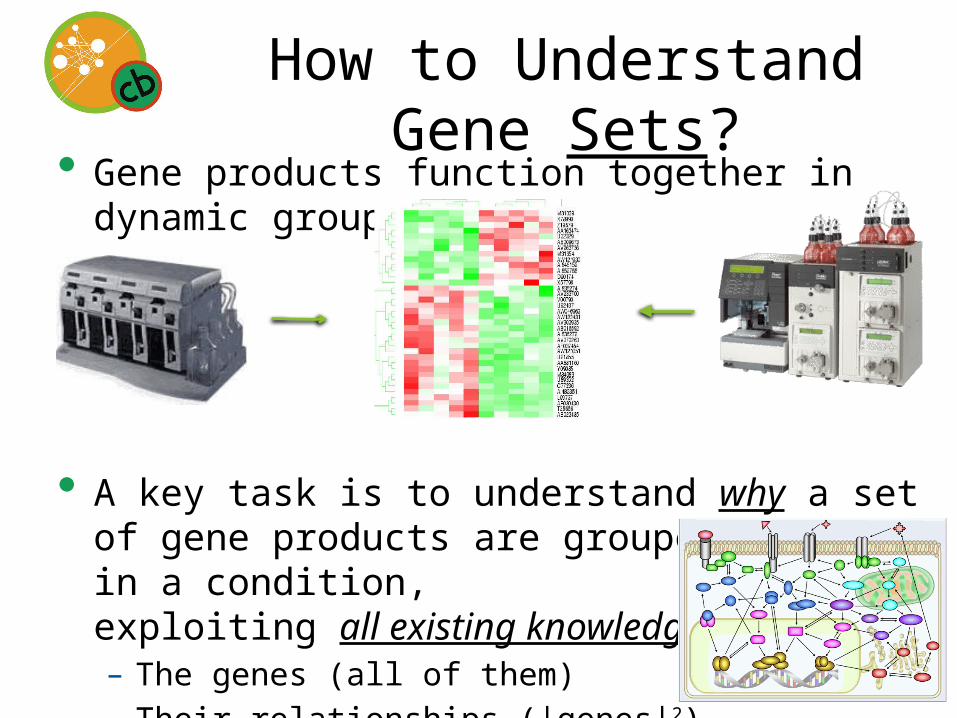
• Gene products function together in dynamic groups
• A key task is to understand why a set of gene products are grouped together in a condition, exploiting all existing knowledge about:– The genes (all of them)– Their relationships (|genes|2)– The condition(s) under study.
How to Understand Gene Sets?
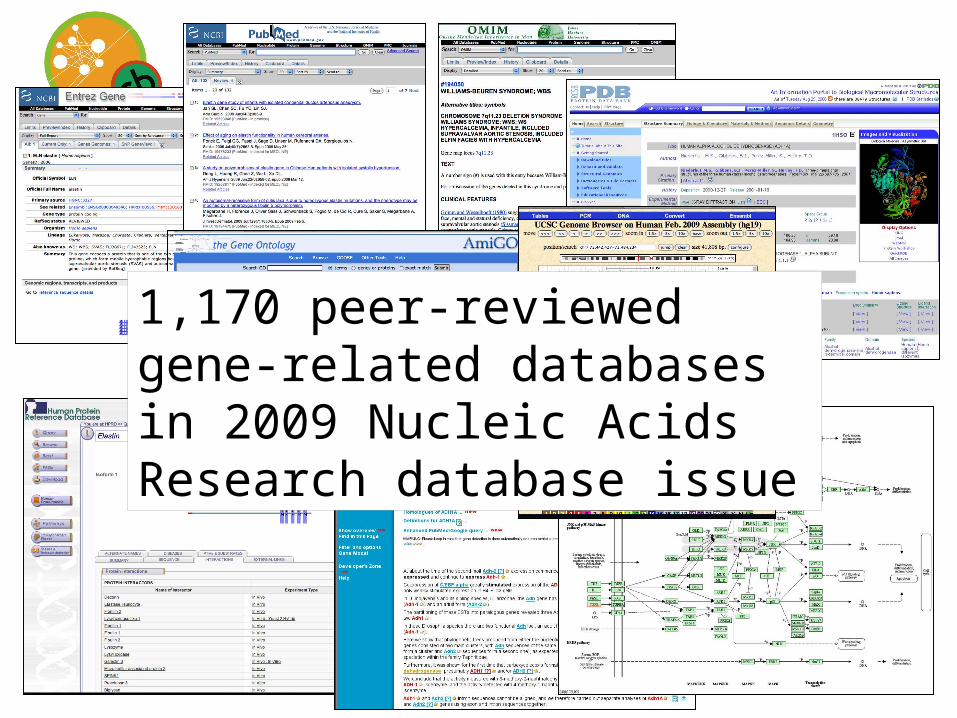
1,170 peer-reviewed gene-related databases in 2009 Nucleic Acids Research database issue

Exponential growth in the biomedical literature
1,000 genomes project will create 1,400GB next year http://1000genomes.org
Genbank growth rate
0
10
20
30
40
50
60
70
80
90
100
199319941995199619971998199920002001200220032004200520062007
Billions
of Base Pairs
19861987198819891990199119921993199419951996199719981999200020012002200320042005200620072008
0
50000
100000
150000
200000
250000
300000
350000
400000
450000
500000
550000
600000
650000
700000
750000
800000
850000
900000
6,000,000
7,000,000
8,000,000
9,000,000
10,000,000
11,000,000
12,000,000
13,000,000
14,000,000
15,000,000
16,000,000
17,000,000
18,000,000
19,000,000
20,000,000
f(x) = 316778.01 exp( 0.03560331 x )R² = 0.939342506000806
f(x) = 7013878 exp( 0.0417151 x )R² = 0.9991220427715
Medline growth rate
804,399 PubMed entries in 2008 (> 2,200/day)

How to stay ahead?
• Have to take advantage of information gained in different disciplines– Relaxin 1 & βblockers– Originally
characterized in 1926 as pregnancy related

Gene-by-gene
• Lots of gene centric information sources:– PubMed / GeneRIFs– Entrez Gene / UniProt– GeneCards– OMIM (with associated human
phenotypes)
• But these can be overwhelming even for a single gene, let alone for a list of hundreds.– Try scanning these for information about
human PPARD, a moderately well-studied gene.
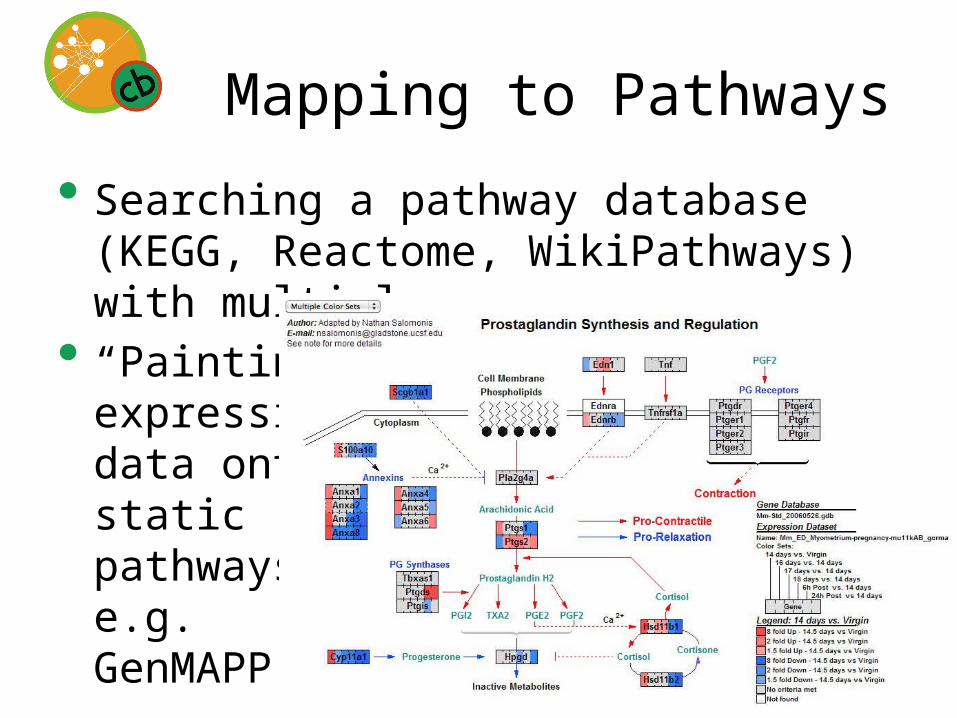
Mapping to Pathways
• Searching a pathway database (KEGG, Reactome, WikiPathways) with multiple genes
• “Painting” expression data onto staticpathways, e.g.GenMAPP
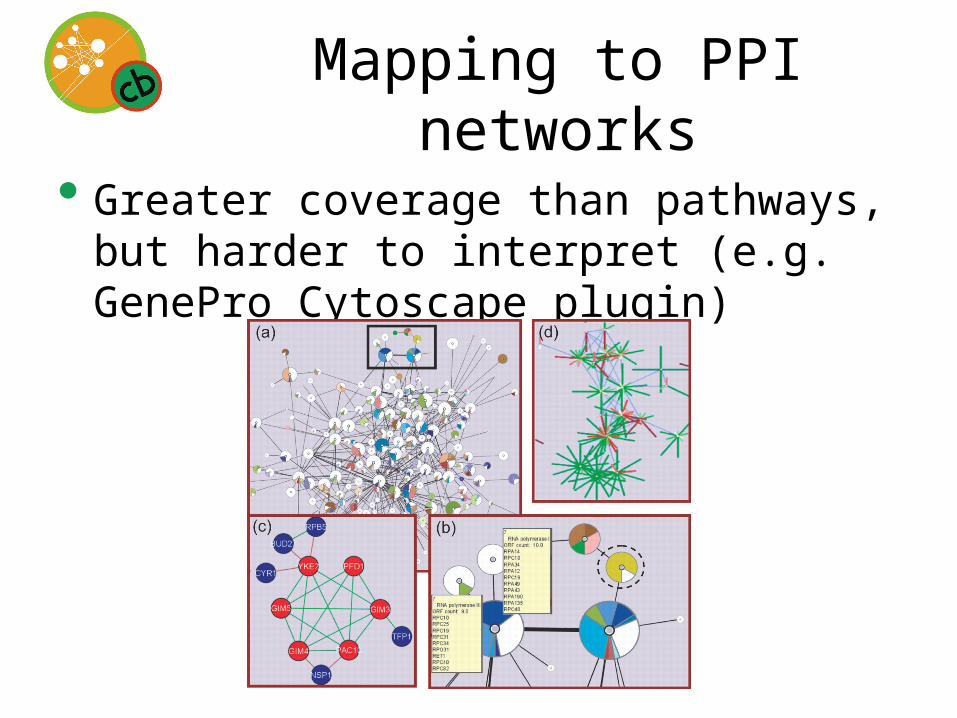
Mapping to PPI networks
• Greater coverage than pathways, but harder to interpret (e.g. GenePro Cytoscape plugin)
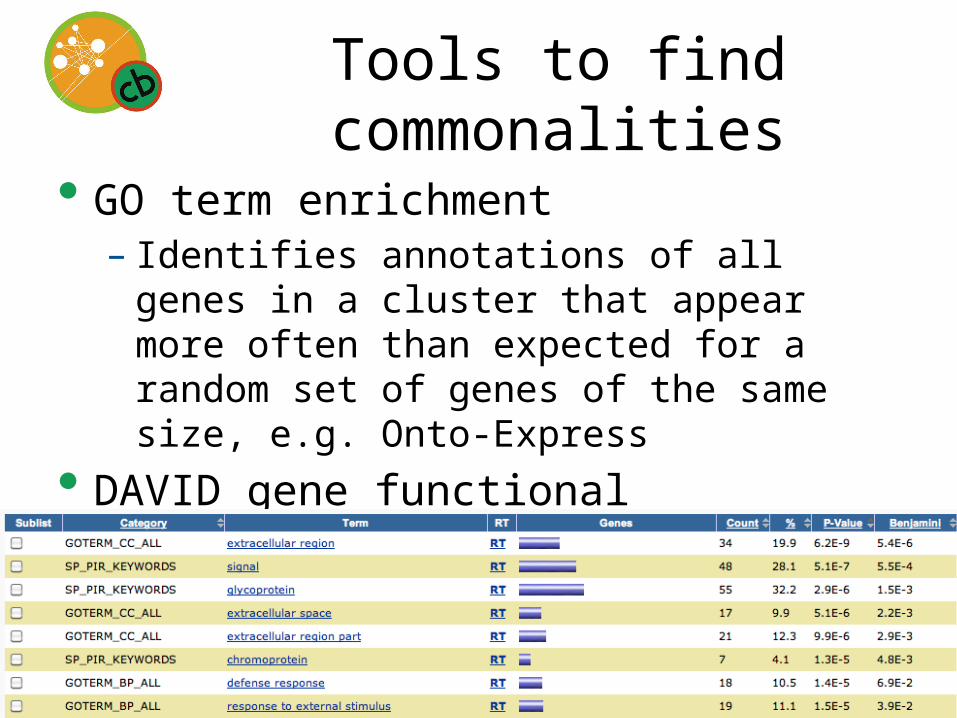
Tools to find commonalities
• GO term enrichment– Identifies annotations of all genes in a
cluster that appear more often than expected for a random set of genes of the same size, e.g. Onto-Express
• DAVID gene functional classification enrichment (GO, PIR, KEGG, Interpro, etc.)

Gene Set Enrichment Analysis
• Start with predefined sets of related genes, then test expression data for over-representation of each group
• Not alwayseasy to definegood sets;chromosomalregions workwell in cancer
3R Approach
• Integrated approach to creating knowledge-based resources and using them for analysis
• Reading: Extracting information from the literature and curated databases
• Reasoning: Integrating, extending, evaluating and aligning knowledge with data
• Reporting: Interactive visualizations and queries that facilitate explanation and hypothesis generation
Information integration• Peer-reviewed gene-centric databases
contain:– Annotations to function, location, process, disease, etc.
ontologies– Linkages to many sorts of experimental and derived data
(GWAS, expression, structure, pathways, population frequencies)
– Linkages to publications that report evidence relevant to them
• Many can be integrated into a single, unified network using gene and/or publication identifiers.– Identifier cross-reference lists increasingly reliable– Increasing coordination and standardization among providers
• Some challenges remain, e.g. what is a “gene”?– PRO might help, but not there yet.
Reading
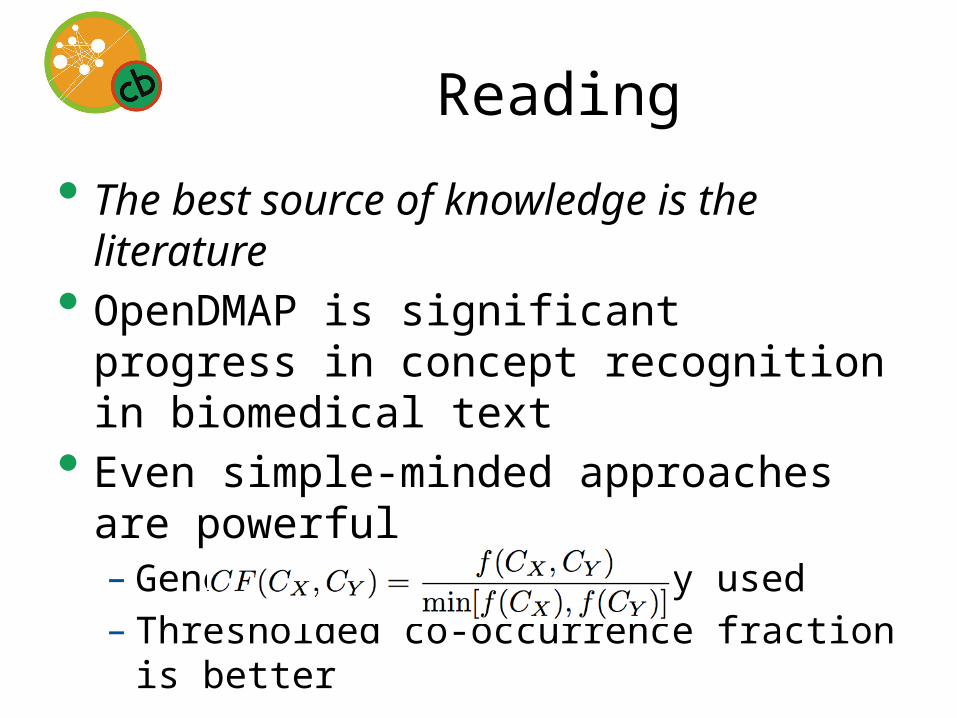
• The best source of knowledge is the literature
• OpenDMAP is significant progress in concept recognition in biomedical text
• Even simple-minded approaches are powerful– Gene co-occurrence widely used– Thresholded co-occurrence fraction is
better
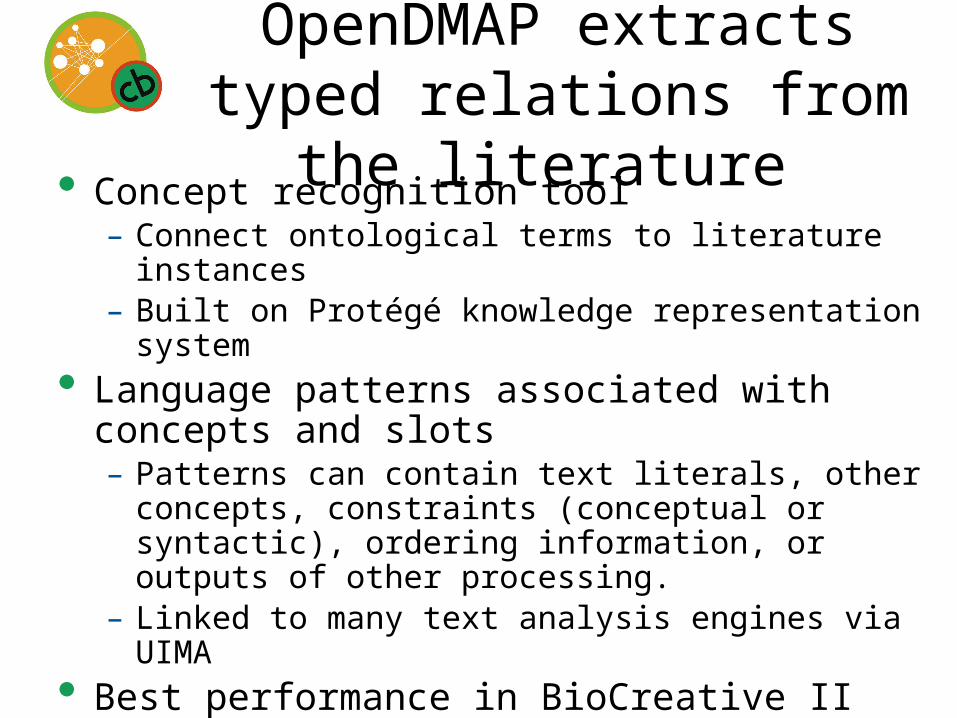
OpenDMAP extracts typed relations from the
literature • Concept recognition tool– Connect ontological terms to literature instances– Built on Protégé knowledge representation
system• Language patterns associated with concepts
and slots– Patterns can contain text literals, other concepts,
constraints (conceptual or syntactic), ordering information, or outputs of other processing.
– Linked to many text analysis engines via UIMA• Best performance in BioCreative II IPS task• >500,000 instances of three predicates
(with arguments) extracted from Medline Abstracts
• [Hunter, et al., 2008] http://bionlp.sourceforge.net
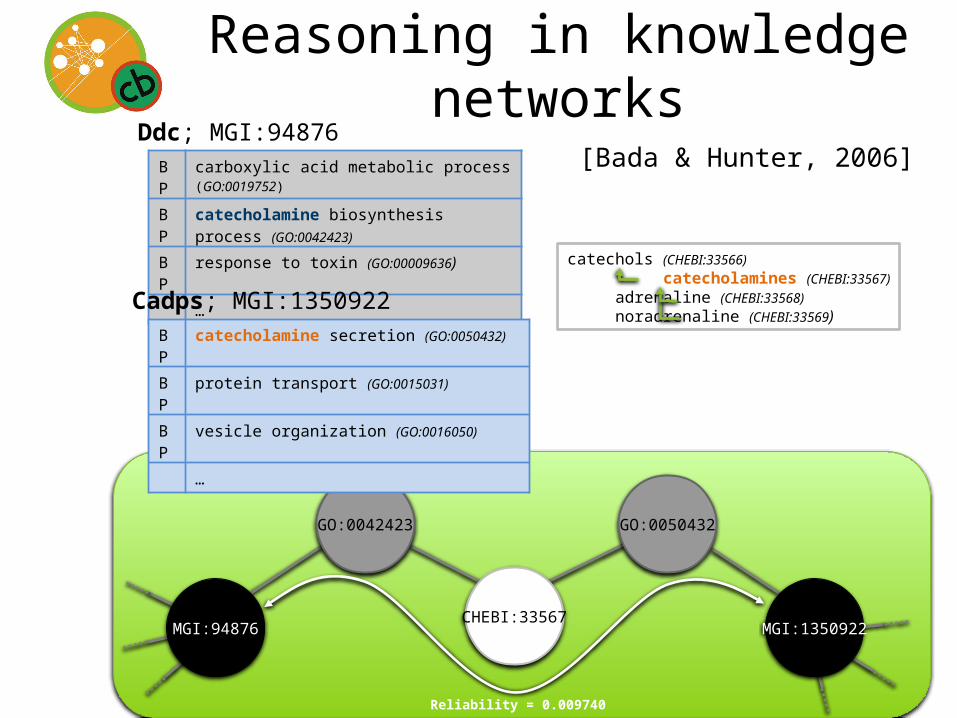
GO:0042423 GO:0050432
CHEBI:33567MGI:94876 MGI:1350922
catechols (CHEBI:33566) catecholamines (CHEBI:33567)
adrenaline (CHEBI:33568)noradrenaline (CHEBI:33569)
BP
carboxylic acid metabolic process (GO:0019752)
BP
catecholamine biosynthesis process (GO:0042423)
BP
response to toxin (GO:00009636)
…
BP
catecholamine secretion (GO:0050432)
BP
protein transport (GO:0015031)
BP
vesicle organization (GO:0016050)
…
Ddc; MGI:94876
Cadps; MGI:1350922
Reliability = 0.009740
Reasoning in knowledge networks
[Bada & Hunter, 2006]
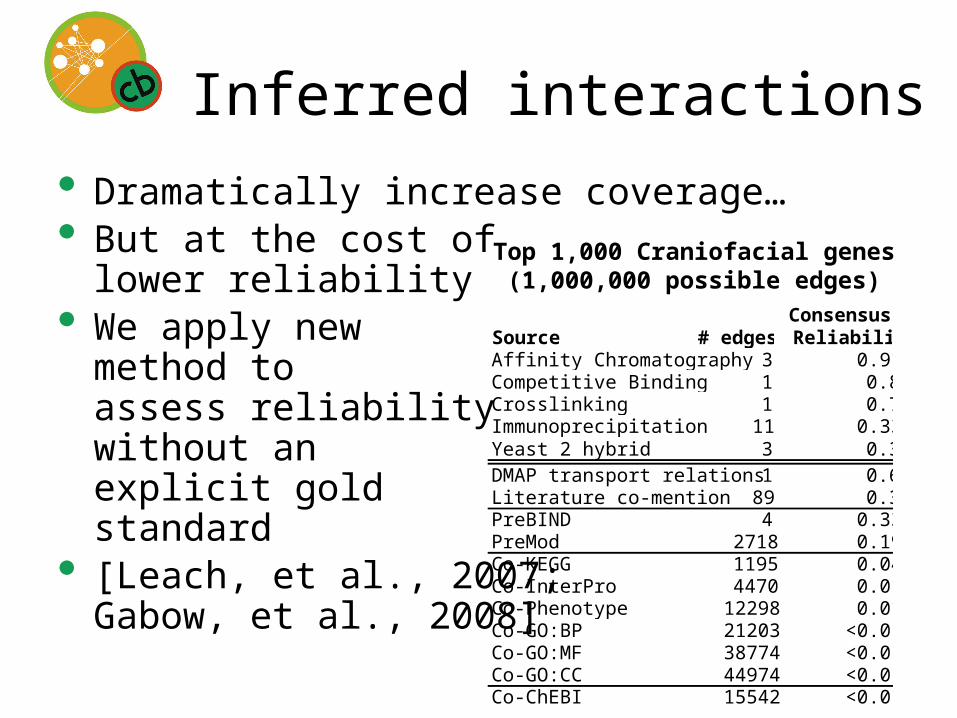
Inferred interactions
• Dramatically increase coverage…• But at the cost of
lower reliability• We apply new
method toassess reliabilitywithout an explicit goldstandard
• [Leach, et al., 2007;Gabow, et al., 2008]
Top 1,000 Craniofacial genes(1,000,000 possible edges)
Source # edgesConsensus Reliability
Affinity Chromatography 3 0.91Competitive Binding 1 0.8Crosslinking 1 0.7Immunoprecipitation 11 0.33Yeast 2 hybrid 3 0.3DMAP transport relations 1 0.6Literature co-mention 89 0.3PreBIND 4 0.33PreMod 2718 0.19Co-KEGG 1195 0.04Co-InterPro 4470 0.01Co-Phenotype 12298 0.01Co-GO:BP 21203 <0.01Co-GO:MF 38774 <0.01Co-GO:CC 44974 <0.01Co-ChEBI 15542 <0.01
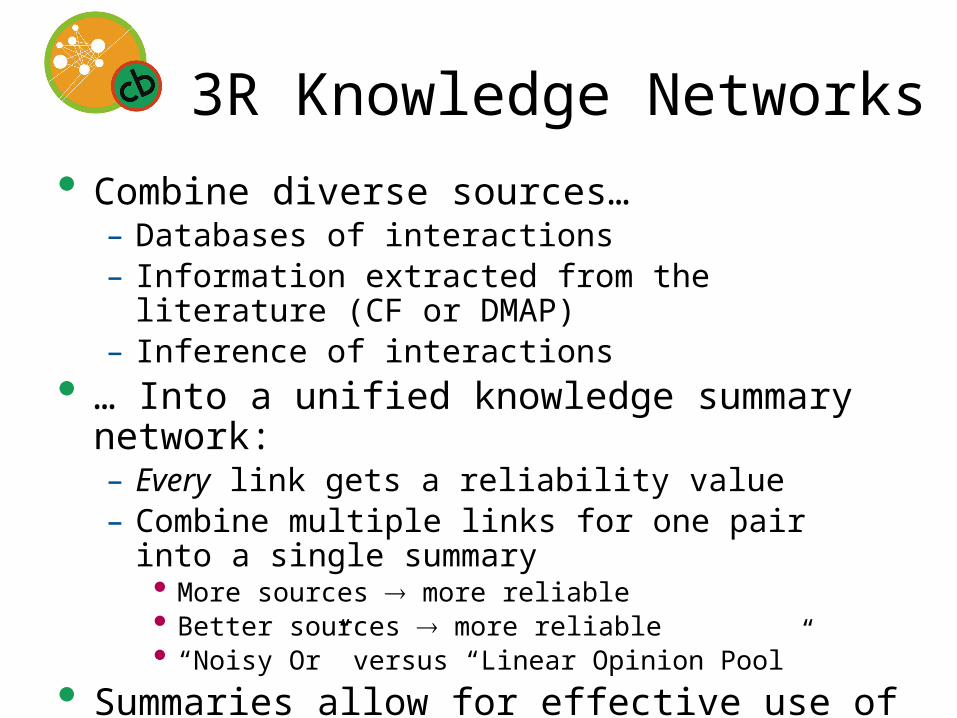
3R Knowledge Networks
• Combine diverse sources…– Databases of interactions– Information extracted from the literature (CF or
DMAP)– Inference of interactions
• … Into a unified knowledge summary network:– Every link gets a reliability value– Combine multiple links for one pair into a
single summary• More sources more reliable• Better sources more reliable• “Noisy Or” versus “Linear Opinion Pool”
• Summaries allow for effective use of noisy inferences– [Leach PhD thesis 2007; Leach et al., 2007]
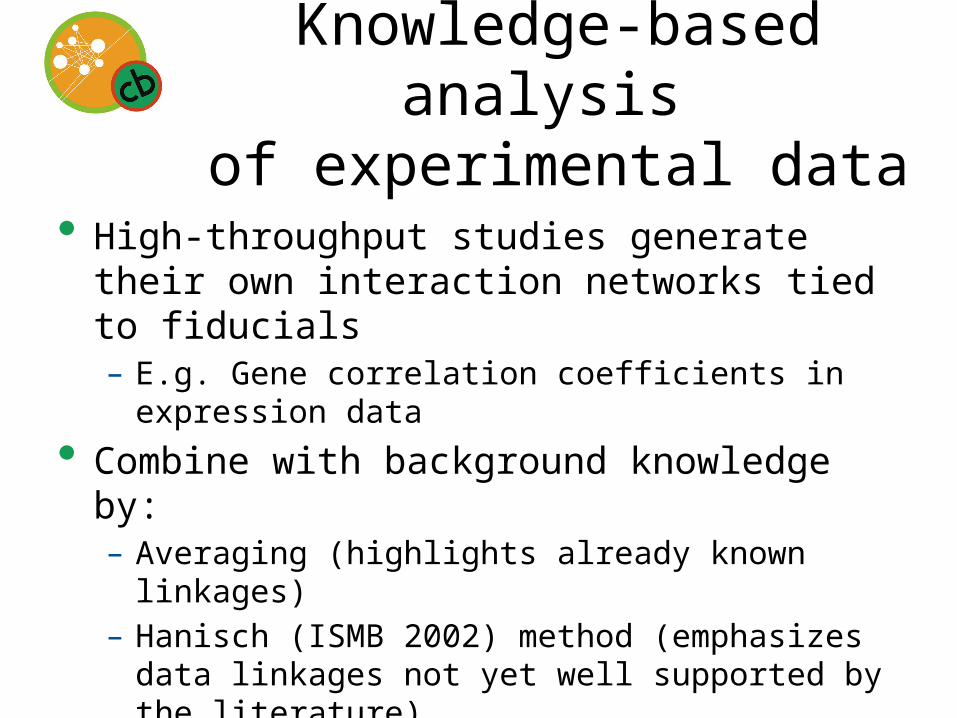
Knowledge-based analysis
of experimental data• High-throughput studies generate their
own interaction networks tied to fiducials– E.g. Gene correlation coefficients in expression
data
• Combine with background knowledge by:– Averaging (highlights already known linkages)– Hanisch (ISMB 2002) method (emphasizes data
linkages not yet well supported by the literature)
• Report highest scoring data + knowledge linkages, color coding for scores of average, Hanisch or both.
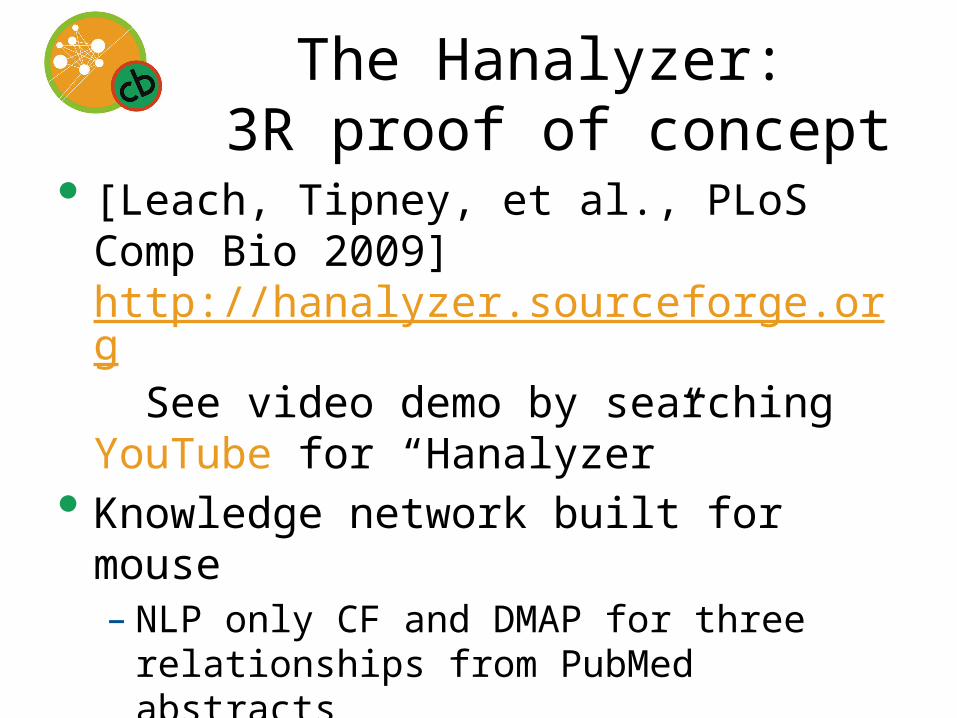
The Hanalyzer: 3R proof of concept
• [Leach, Tipney, et al., PLoS Comp Bio 2009] http://hanalyzer.sourceforge.org See video demo by searching YouTube for “Hanalyzer”
• Knowledge network built for mouse– NLP only CF and DMAP for three
relationships from PubMed abstracts
• Simple reasoning (co-annotation, including ontology cross-products)
• Visualization of combined knowledge / data network via Cytoscape + new plugins

First application: Craniofacial Development
• NICHD-funded study (Rich Spritz; Trevor Williams) focused on cleft lip & palate
• Well designed gene expression array experiment:– Craniofacial development in normal mice
(control)– Three tissues (Maxillary prominence, Fronto-
nasal prominence, Mandible)– Five time points (every 12 hours from E10.5)– Seven biological replicates per condition (well
powered)
• >1,000 genes differentially expressed among at least 2 of the 15 conditions (FDR<0.01)
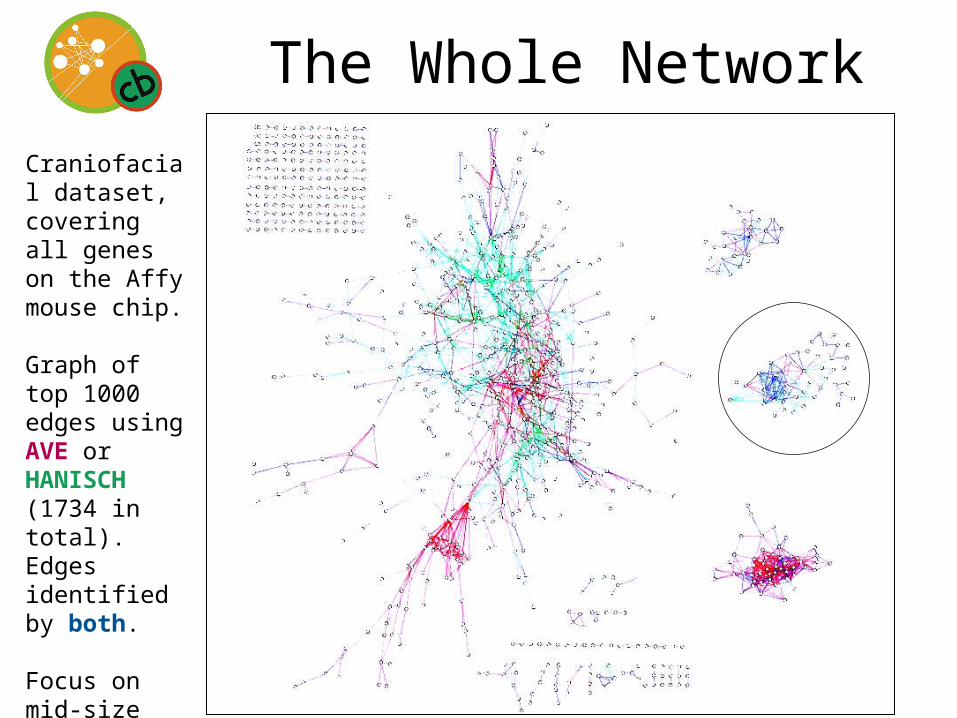
The Whole Network
Craniofacial dataset, covering all genes on the Affy mouse chip.
Graph of top 1000 edges using AVE or HANISCH (1734 in total).Edges identified by both.
Focus on mid-size subnetwork
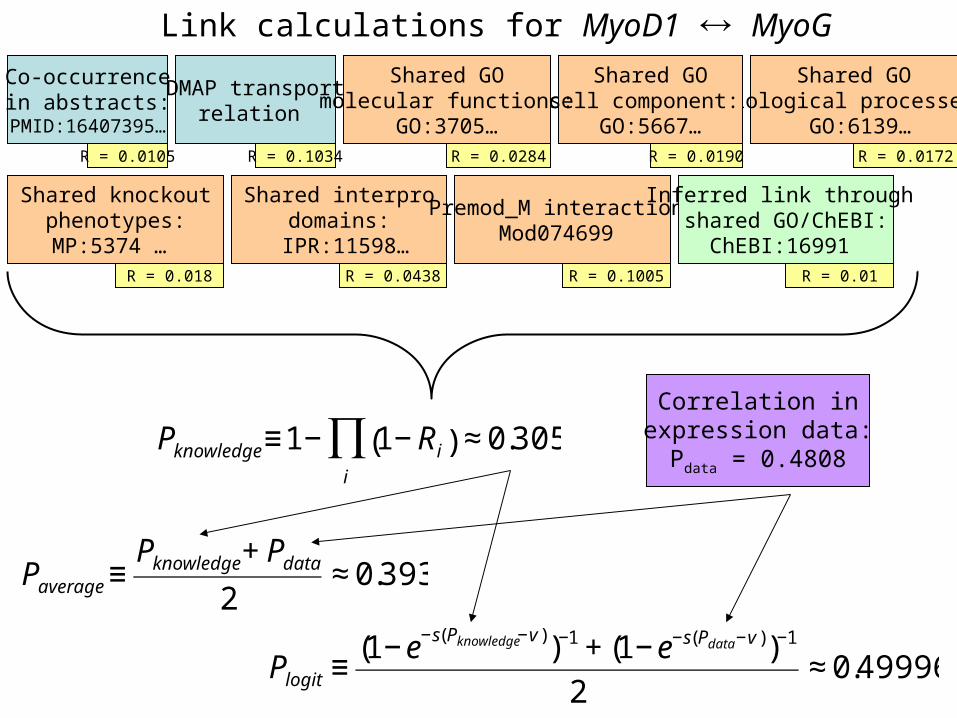
Co-occurrencein abstracts:
PMID:16407395…
R = 0.0105
DMAP transportrelation
R = 0.1034
Shared GObiological processes:
GO:6139…R = 0.0172
Shared GOcell component:
GO:5667…R = 0.0190
Shared GOmolecular functions:
GO:3705…R = 0.0284
Shared knockoutphenotypes:MP:5374 …
R = 0.018
Shared interprodomains:
IPR:11598…R = 0.0438
Premod_M interaction:Mod074699
R = 0.1005
Inferred link through shared GO/ChEBI:
ChEBI:16991 R = 0.01
€
Pknowledge ≡1− 1− Ri( ) ≈ 0.305i
∏Correlation in
expression data:Pdata = 0.4808
€
Paverage ≡Pknowledge + Pdata
2≈ 0.393
€
Plogit ≡(1− e−s(Pknowledge −v ))−1 + (1− e−s(Pdata −v ))−1
2≈ 0.49996
Link calculations for MyoD1 MyoG

AVE edgesBoth edges
Skeletal muscle structural componentsSkeletal muscle contractile componentsProteins of no common family
Strong data and background knowledge facilitate
explanations
• Goal is abductive inference: why are these genes doing this?– Specifically, why the increase in mandible before the
increase in maxilla, and not at all in the frontonasal prominence?
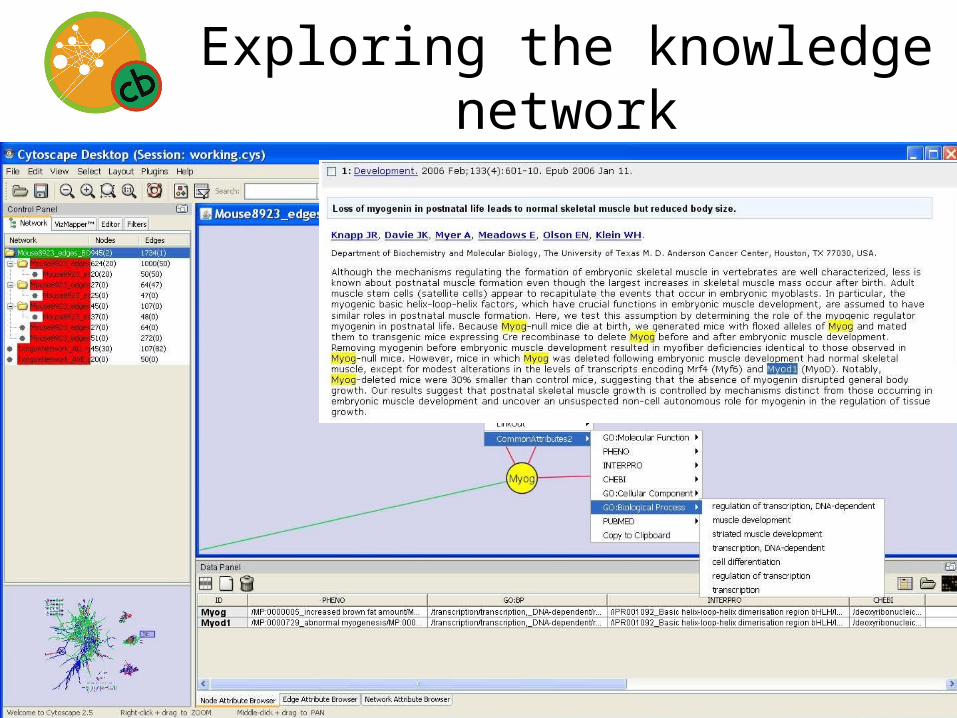
Exploring the knowledge network
See the YouTube Hanalyzer demo fora better sense of the process
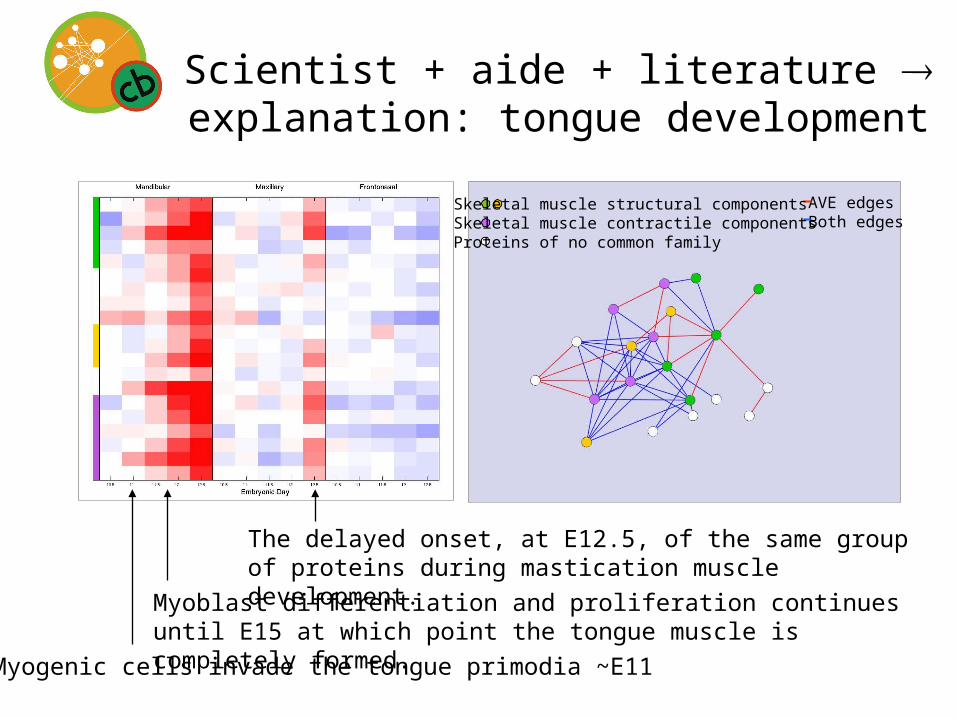
Scientist + aide + literature explanation: tongue development
AVE edgesBoth edges
Skeletal muscle structural componentsSkeletal muscle contractile componentsProteins of no common family
Myogenic cells invade the tongue primodia ~E11
Myoblast differentiation and proliferation continues until E15 at which point the tongue muscle is completely formed.
The delayed onset, at E12.5, of the same group of proteins during mastication muscle development.
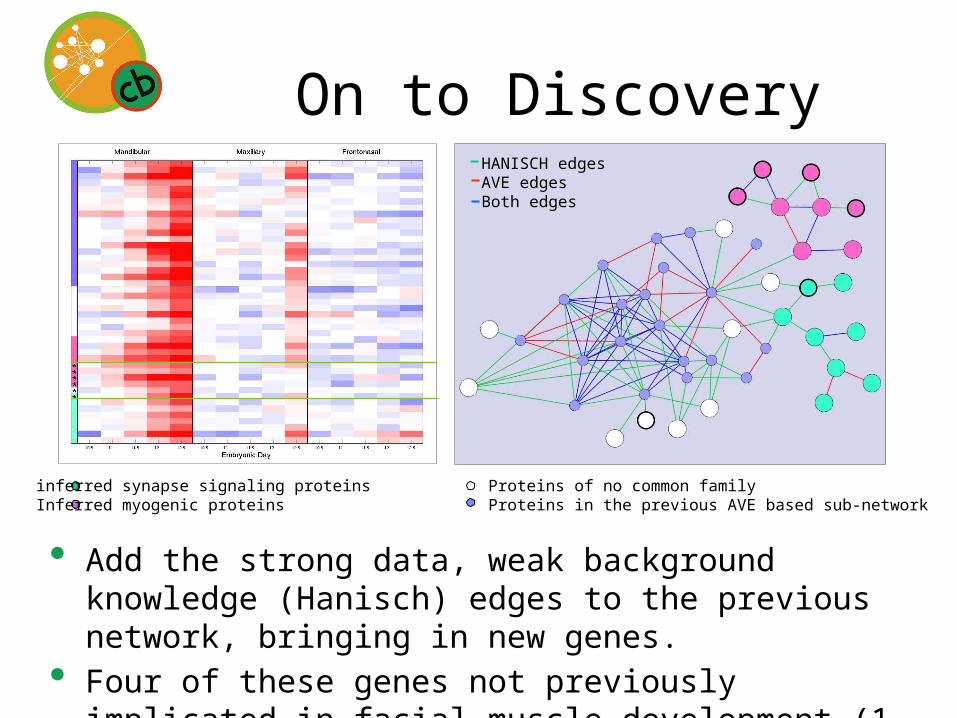
inferred synapse signaling proteinsInferred myogenic proteins
HANISCH edgesAVE edgesBoth edges
Proteins of no common familyProteins in the previous AVE based sub-network
On to Discovery
• Add the strong data, weak background knowledge (Hanisch) edges to the previous network, bringing in new genes.
• Four of these genes not previously implicated in facial muscle development (1 almost completely unannotated)

Biological validation
Apobec2
E430002G05Rik
Hoxa2
Zim1
Sagittal, E11.5
Transverse, E12.5 More rostral More caudal
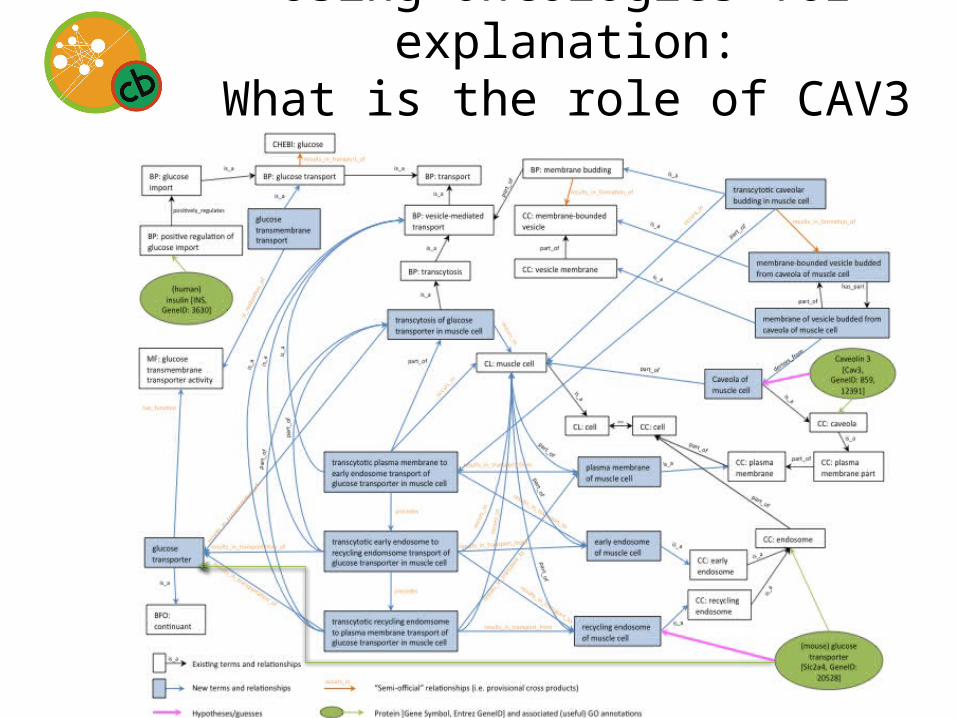
Using ontologies for explanation:
What is the role of CAV3 in muscle?
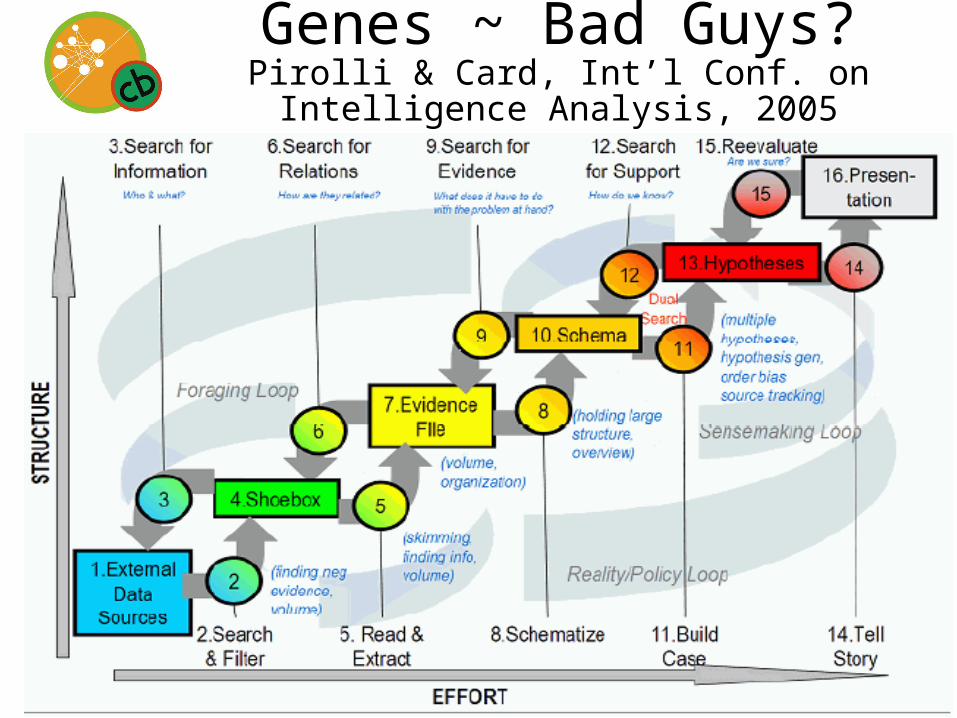
Genes ~ Bad Guys?Pirolli & Card, Int’l Conf. on Intelligence
Analysis, 2005

Bio-Jigsaw
Based on Stasko, et al.’s [2007] Jigsaw visual analytics system