laurent brochard niv in the icu: lessons learnt in the last 20 years
TRANSCRIPT

Laurent Brochard
NIV in the ICU: Lessons learnt in the last
20 years


The Engström ventilator (1951)
Ventilatory problems in thoracic anesthesia; VO Björk, CG Engström et al J Thoracic Surg. 1956; 31:117

Sadoul, Bull.physio-pathol.Resp. 1965

Traitement par ventilation instrumentale de 100 cas d'insuffisance respiratoire aigue severe (pACO2> 70) chez des pulmonaires chroniques
Sadoul, Bull.physio-pathol.Resp. 1965
NIV and 2y mortality

•Mask ventilation difficult
•Need for respiratory stimulant
•Tracheal ventilation considered
much easier
1960. Pr A.B. Tonnel

Chest 1990
Chest 1994
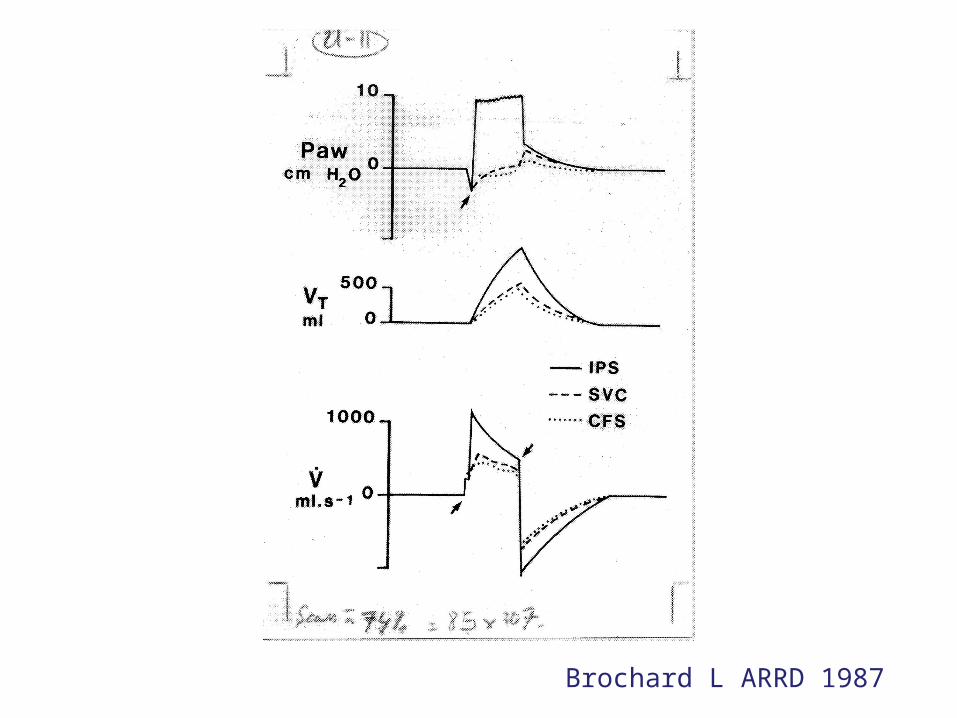
Brochard L ARRD 1987
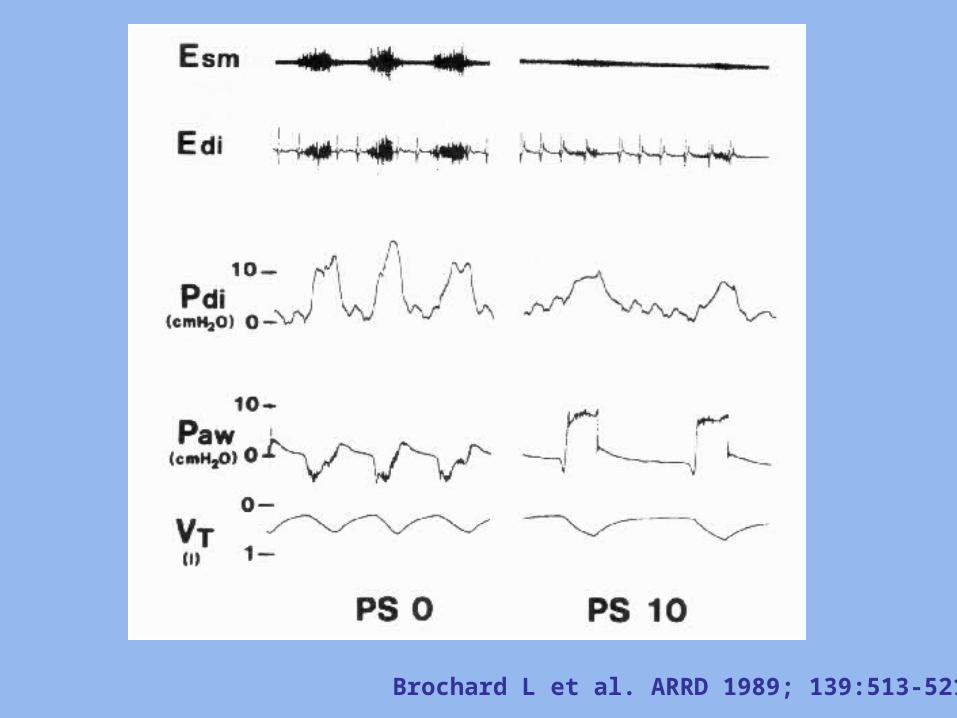
Brochard L et al. ARRD 1989; 139:513-521


NIV and exacerbations of NIV and exacerbations of COPDCOPDEffects on arterial blood Effects on arterial blood gasesgases
Brochard et al NEJM 1990, 323, 1523


Brochard et al. 1995Brochard et al. 1995
NIV and exacerbations
of COPD

Intubation Hosp Stay Mortality
NIV - PS 20 ( n=43 ) 26 % 23 ± 17 j 9 %
O2 ( n=42 ) 74 % 35 ± 33 j 29 %
NIV and exacerbations of NIV and exacerbations of COPDCOPD
Brochard et al NEJM 1995; 333, 817-22
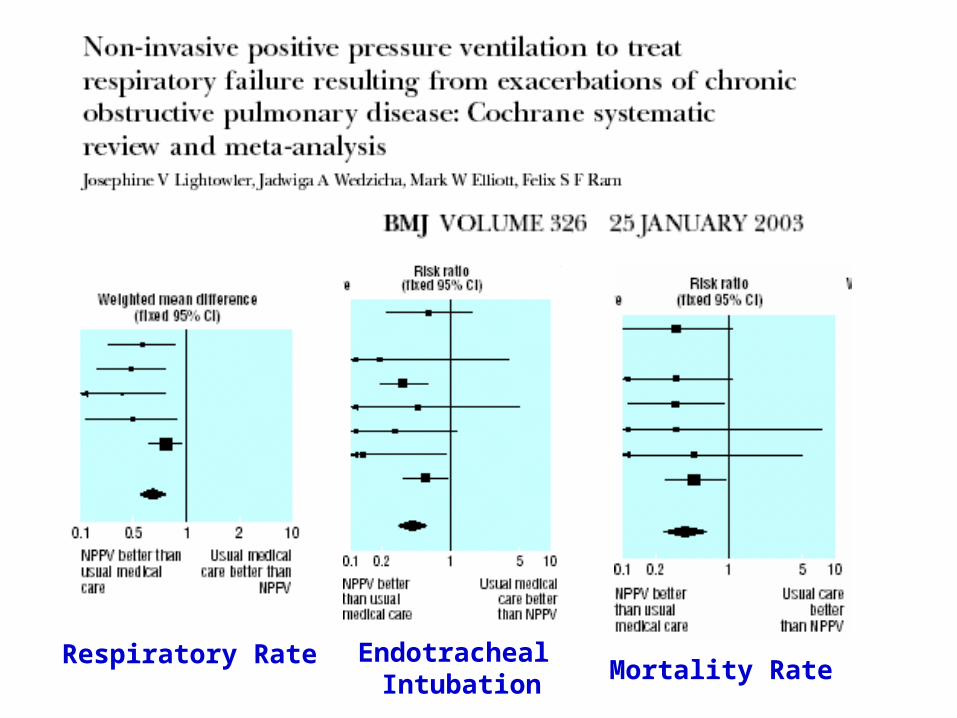
Respiratory Rate Endotracheal Intubation Mortality Rate


Study name Odds ratio and 95% CI
Odds ratio p-Value
Mehta_1997 1,083 0,957
Park_2001 8,077 0,193
Cross_2003 4,250 0,206
Bellone_2004 0,524 0,608
Park_2004 1,000 1,000
Crane_2004 1,000 1,000
Bellone_2005 0,471 0,554
Ferrari_2006 0,135 0,189
Moritz_2007 0,414 0,477
Ferrari_2007 0,297 0,464
Rusterholtz_2008 0,640 0,565
Gray_2009 0,255 0,223
Ghannem_2009 1,282 0,725
Nouira_2010 0,639 0,499
0,776 0,371
0,01 0,1 1 10 100
CPAP Better BIPAP Better
CPAP vs BIPAP in CPE: Overall

No sedationNo sedationNo central lineNo central line
No urinary catheterNo urinary catheter
No endotracheal tubeNo endotracheal tube

NIV & Nosocomial infectionsNIV & Nosocomial infections
0
20
40
60
80
100
%
Inf Noso Pn Noso AB
VNIVM
p<0.0001p<0.0001
p=0.02p=0.02
p<0.001p<0.001
Girou et al. JAMA 2000Girou et al. JAMA 2000
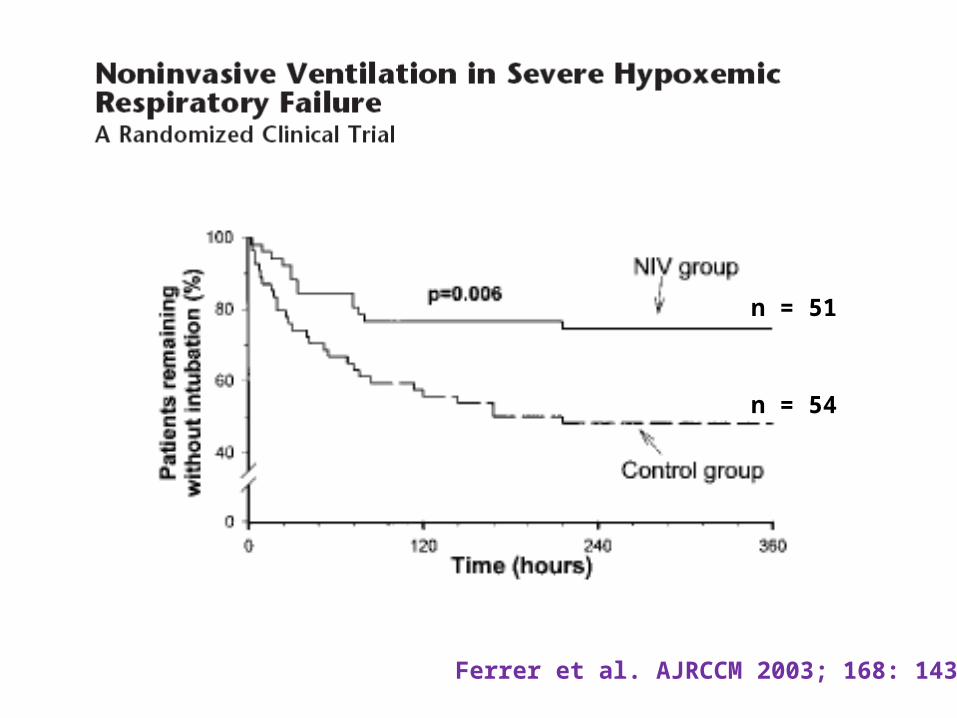
Ferrer et al. AJRCCM 2003; 168: 1438
n = 51
n = 54

CCM 2007


NIV in hypoxemic or hypercapnic patients:
Is there a different impact?

Demoule A et al ICM 2006
Mortality

Reintubation 48%
Postextubation ARF
Reintubation 72%

Reintubation 8%
Reintubation 11%
Prevention of postextubation ARF

2004 Incidence study
353 ICU 26 countries Esteban et al, AJRCCM 2008
1998Incidence study
361 ICU 20 countries Esteban et al, JAMA 2002
2010 Incidence study
553 ICU 39 countries Esteban et al
Use of Mechanical ventilation
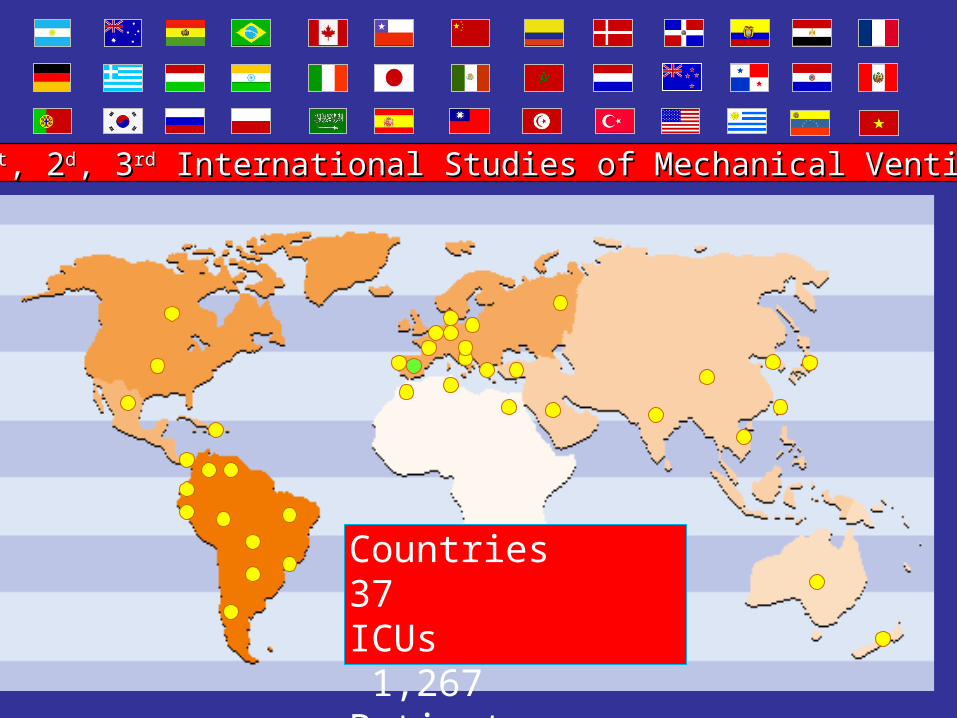
11stst, 2, 2dd, 3, 3rdrd International Studies of Mechanical Ventilation International Studies of Mechanical Ventilation
Countries 37ICUs 1,267Patients 18,321

19981998 20042004 20102010
n = 5183n = 5183 n = 4986n = 4986 n = 8313n = 8313
Age, mean (SD)Age, mean (SD) 59 (17)59 (17) 59 /1759 /17 61/1761/17
Gender, female (%)Gender, female (%) 39 %39 % 40 %40 % 38 %38 %
SAPS II, mean (SD)SAPS II, mean (SD) 44 (17)44 (17) 42 (18)42 (18) 45 (18)45 (18)
BMI. mean (SD)BMI. mean (SD) 27 (6)27 (6)
Baseline Demographics

NIV as first attempt

0
10
20
30
40
50
COPD CHF ARF
1998 2004 2010
Use of NIV 1998 - 2010

SRLF - 2012
Results of the 3rd NIV incidence study (France and Belgium)
A Demoule, S Jaber, A Kouatchet, J Lambert, F Meziani, S Perbet, L Camous, R Janssen-Langenstein, M Alves, B Zuber, F Collet, J Messika,
X Favre, O Guisset, B Misset, A Lafabrie, L Brochard, E Azoulay
For the oVNI group

Methods
• Prospective longitudinal study
• 54 ICUs
• 2 months (Nov 2010- April 2011)
• 2653 patients included
• 2445 invasive ventilatory assistance or NIV
Survey 2010 - 2011

0
20
40
60
80
100
All NIV NIV init NIV post
1997
2002
2011
Results 1 IncidenceNIV 23 vs.31% - pre 23% - post-extub 8%
**

0
20
40
60
80
100
exac CRF CPE de novo
1997
2002
2011
*
$
Results 2 IndicationsCPE: 53 vs.37% - « de novo » : 16 vs. 22%
*
*
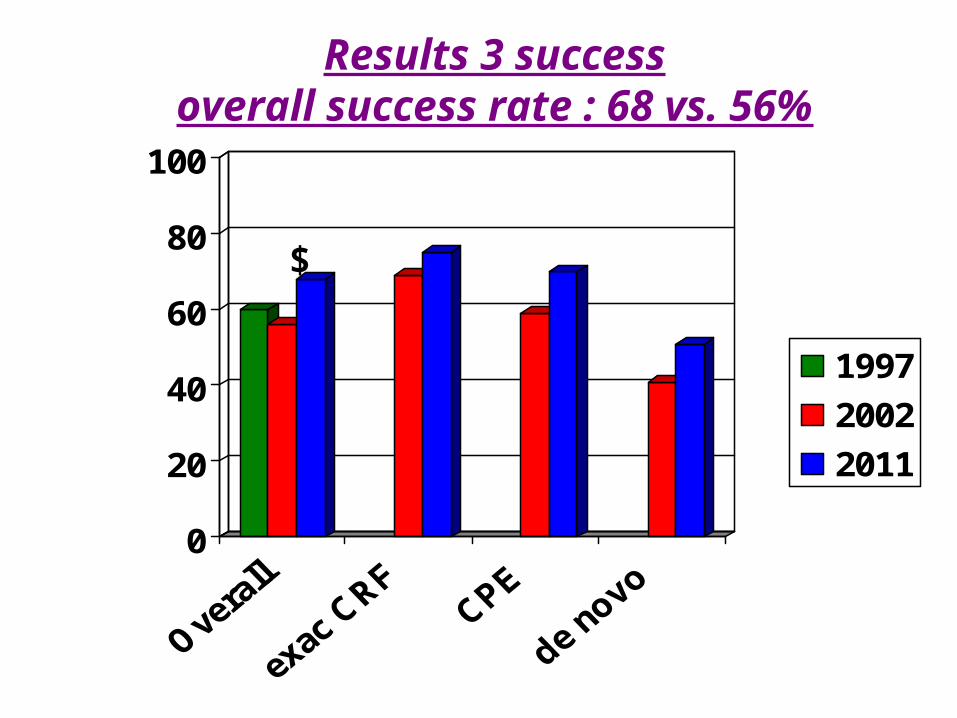
0
20
40
60
80
100
1997
2002
2011
Results 3 successoverall success rate : 68 vs. 56%
$

Summary
• The global NIV rate is stable– Increase for post-extubation
• Variations across indications– Increase for CPE– Stable in exacerbations of CRF– Decrease in « de novo » ARF
• Success rate is increasing
Compared to 2002

Crit Care Med 2007;35:932–939

2653 patients required mechanical ventilation in 54 ICUs
1450 patients received mechanicalventilation for acute respiratory failure
780 patients received noninvasivemechanical ventilation (NIV)
72 (9.2%) patients received palliative NIV
(comfort care, SCCM class 3)
All died before day-90
708 patients received curative NIV
574 (81%) patients had no treatment 134 (19%) patients had alimitation decisions Do-Not-Intubate status
ICU survivors 529 (92.2%) 97 (72.4%)
Hospital survivors 505 (88%) 75 (56%)
D-90 survivors 474 (82.6%) 53 (39.6%)
Patients interviewed on D-90 120/237 (50.6%) 34/53 (64.2%)
Relatives interviewed on D-90 122/264 (42.5%) 53/134 (39.6%)
Azoulay E et al ICM 2012

P<0.0001Mortality (%)
0
10
20
30
40
50
60
ChronicRespiratoryInsufficiency
Heart FailurePneumonia
Cancer
Azoulay E et al ICM 2012

0
10
20
30
40
50
60
No Treatment-limitationDecisions
Do-Not-IntubateDecisions
SF-36 Physical Pre-ICU Pre-ICUPost-ICU Post-ICU
0
10
20
30
40
50
60
No Treatment-limitationDecisions
Do-Not-IntubateDecisions
SF-36 Mental
Pre-ICU Pre-ICUPost-ICU Post-ICU
Azoulay E et al ICM 2012

0
10
20
30
40
50
60
No Treatment-limitationDecisions
Do-Not-IntubateDecisions
SF-36 Physical Pre-ICU Pre-ICUPost-ICU Post-ICU
0
10
20
30
40
50
60
No Treatment-limitationDecisions
Do-Not-IntubateDecisions
SF-36 Mental
Pre-ICU Pre-ICUPost-ICU Post-ICU
Azoulay E et al ICM 2012

0
5
10
15
20
25
30
35
40
45
D-90 IES Scale
D-90 HADS Anxiety Subscale
D-90 HADS Depression
Subscale
0
5
10
15
20
25
30
35
40
45
D-90 IES Scale
D-90 HADS Anxiety Subscale
D-90 HADS Depression
Subscale
P=0.33 P=0.49 P=0.06
P=0.13 P=0.16 P=0.81
Patients
Relatives
Patients
Azoulay E et al ICM 2012

0
5
10
15
20
25
30
35
40
45
D-90 IES Scale
D-90 HADS Anxiety Subscale
D-90 HADS Depression
Subscale
0
5
10
15
20
25
30
35
40
45
D-90 IES Scale
D-90 HADS Anxiety Subscale
D-90 HADS Depression
Subscale
P=0.33 P=0.49 P=0.06
P=0.13 P=0.16 P=0.81
Patients
RelativesRelatives
Azoulay E et al ICM 2012

Non invasive ventilation for acute respiratory failure
• Reduces the complications associated with mechanical ventilation
• Improves the outcome of COPD exacerbations and cardiogenic pulmonary edema
• A careful use in hypoxemic respiratory failure may be interesting
• NIV represents an interesting therapy when intensity of therapy is limited

Merci! Thank you!
Blog
• http://mechanicalventilation.wordpress.com
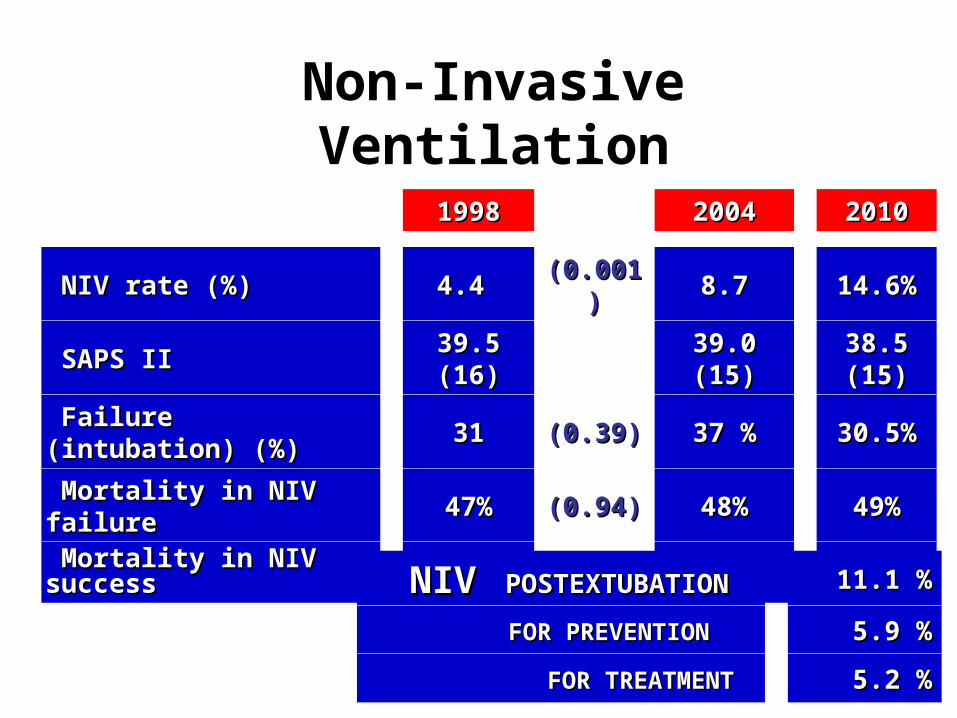
19981998 20042004 20102010
NIV rate (%)NIV rate (%) 4.4 4.4 (0.001)(0.001) 8.78.7 14.6%14.6%
SAPS IISAPS II 39.5 (16)39.5 (16) 39.0 (15)39.0 (15) 38.5 (15)38.5 (15)
Failure (intubation) (%)Failure (intubation) (%) 3131 (0.39)(0.39) 37 %37 % 30.5%30.5%
Mortality in NIV failureMortality in NIV failure 47%47% (0.94)(0.94) 48%48% 49%49%
Mortality in NIV successMortality in NIV success 21%21% (0.36)(0.36) 15%15% 9 %9 %
Non-Invasive Ventilation
NIVNIV POSTEXTUBATION POSTEXTUBATION 11.1 %11.1 %
FOR PREVENTIONFOR PREVENTION 5.9 %5.9 %
FOR TREATMENTFOR TREATMENT 5.2 %5.2 %
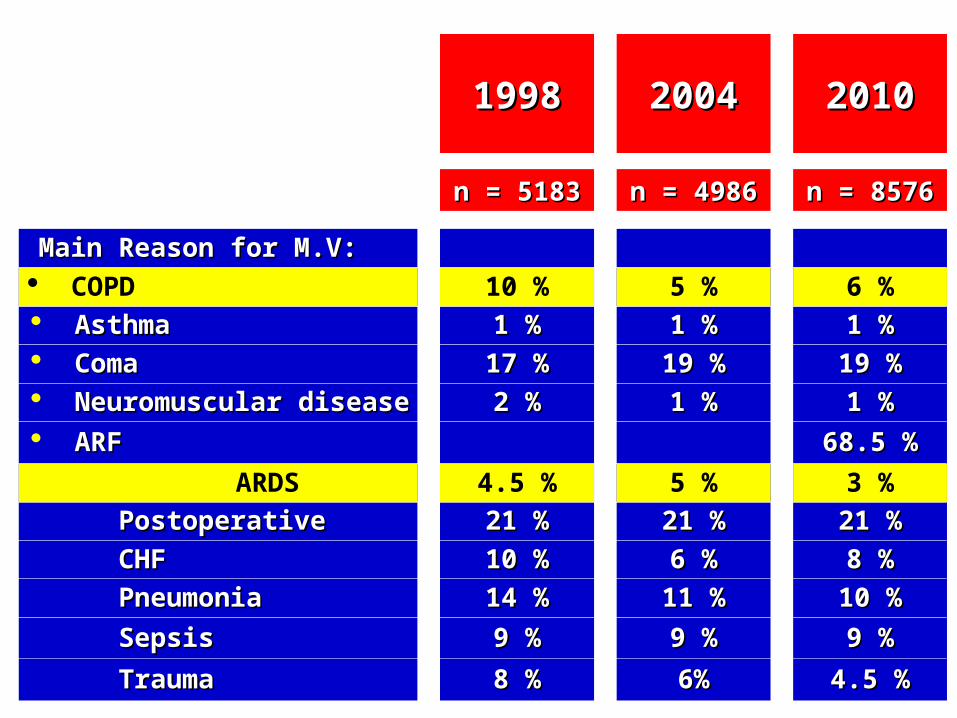
19981998 20042004 20102010
n = 5183n = 5183 n = 4986n = 4986 n = 8576n = 8576
Main Reason for M.V:Main Reason for M.V:
COPDCOPD 10 %10 % 5 %5 % 6 %6 %
AsthmaAsthma 1 %1 % 1 %1 % 1 %1 %
ComaComa 17 %17 % 19 %19 % 19 %19 %
Neuromuscular diseaseNeuromuscular disease 2 %2 % 1 %1 % 1 %1 %
ARFARF 68.5 %68.5 %
ARDSARDS 4.5 %4.5 % 5 %5 % 3 %3 %
PostoperativePostoperative 21 %21 % 21 %21 % 21 %21 %
CHFCHF 10 %10 % 6 %6 % 8 %8 %
PneumoniaPneumonia 14 %14 % 11 %11 % 10 %10 %
SepsisSepsis 9 %9 % 9 %9 % 9 %9 %
TraumaTrauma 8 %8 % 6%6% 4.5 %4.5 %
COPD 10 % 5 % 6 %
ARDS 4.5 % 5 % 3 %

Oxygen (15) CPAP (15)
P/F 169 (71-240) 167 (76-270)
RR 30 (18-44) 2 (20-60)
BAL(ml) 66 15 43 19 p<0.03
ETI 4 0 p<0.03
NIV 1 0

0
100
200
300
400
500
Baseline Bacou Koo Oracle Airvie
PT
Pes
(cm
H 2
O*s
/min
)
CCM 2009

Rouzé A et al Mémoire M2 Univ Paris Est

Secular Trends in Mortality and Use of Secular Trends in Mortality and Use of NIVNIV
in COPD and Severe CPEin COPD and Severe CPE
0
10
20
30
40
50
60
70
80
90
100
1994(n=40)
1995(n=53)
1996(n=66)
1997(n=64)
1998(n=70)
1999(n=63)
2000(n=58)
2001(n=72)
Year
Per
cent
age
of p
atie
nts
DC
NIV
P<0.0001
P=0.012
Girou et al. JAMA 2003

