latino national survey luis r. fraga, stanford university john a. garcia, university of arizona...
Post on 21-Dec-2015
213 views
TRANSCRIPT

LATINO NATIONAL SURVEY LATINO NATIONAL SURVEY
Luis R. Fraga, Stanford UniversityLuis R. Fraga, Stanford University
John A. Garcia, University of ArizonaJohn A. Garcia, University of Arizona
Rodney E. Hero, University of Notre DameRodney E. Hero, University of Notre Dame
Michael Jones-Correa, Cornell UniversityMichael Jones-Correa, Cornell University
Valerie Martinez-Ebers, Texas Christian UniversityValerie Martinez-Ebers, Texas Christian University
Gary M. Segura, University of WashingtonGary M. Segura, University of Washington

Latinos and the American PolityLatinos and the American Polity
• Are Latinos a distinct community of interest in Are Latinos a distinct community of interest in American politics?American politics?
• To what extent is this so?To what extent is this so?• By what process has this come to be?By what process has this come to be?• With what political and social effects?With what political and social effects?
• How and to what extent are Latinos integrated How and to what extent are Latinos integrated into mainstream society?into mainstream society?
• And do Latinos change America?And do Latinos change America?• Does America change Latinos?Does America change Latinos?

Latino Diversity, in America and in Latino Diversity, in America and in the LNSthe LNS
Census Bureau (American Community Census Bureau (American Community Survey, Released August 2006)Survey, Released August 2006)
• Mexican 63.9%Mexican 63.9%• Puerto Rican 9%Puerto Rican 9%• Cuban 3.5%Cuban 3.5%• Salvadoran 2.9%Salvadoran 2.9%• Dominican 2.7%Dominican 2.7%• Guatemalan 1.7%Guatemalan 1.7%• Colombian 1.8%Colombian 1.8%• ALL OTHERS 14.3%ALL OTHERS 14.3%
• Native-born (not Island-born): 56.4%Native-born (not Island-born): 56.4%• Foreign-born (40% includes children)Foreign-born (40% includes children)• Island-born (3.6% Puerto Rican)Island-born (3.6% Puerto Rican)
• No high school diploma 43%No high school diploma 43%• College graduate 11.1%College graduate 11.1%
Latino National Survey (unweighted N)Latino National Survey (unweighted N)• Mexican Mexican • Puerto Rican Puerto Rican • Cuban Cuban • Salvadoran Salvadoran • Dominican Dominican • Guatemalan Guatemalan • ColombianColombian• ALL OTHERSALL OTHERS
• Native-bornNative-born• Foreign-born (adults)Foreign-born (adults)• Island-born (Puerto Rican)Island-born (Puerto Rican)
• No high school diploma No high school diploma • College graduateCollege graduate

What We DidWhat We Did
A “national” telephone survey of 8600 Latino A “national” telephone survey of 8600 Latino residents of the United States, seeking a residents of the United States, seeking a broad understanding of the qualitative nature broad understanding of the qualitative nature of Latino political and social life in Americaof Latino political and social life in America
Approximately 40 minutes (length and Approximately 40 minutes (length and number of questions depends on split-number of questions depends on split-samples, etc)samples, etc)
English and SpanishEnglish and Spanish
Universe is all Latinos, not citizens or voters.Universe is all Latinos, not citizens or voters.

Stratified StructureStratified Structure The survey is stratified, that is, creates stand-alone samples in 15 The survey is stratified, that is, creates stand-alone samples in 15
states and the DC Metro area allowing us to speak to specific states and the DC Metro area allowing us to speak to specific political contextspolitical contexts
ArizonaArizona 400400 ArkansasArkansas 400400 CaliforniaCalifornia 12001200 ColoradoColorado 400400 DC-SMSADC-SMSA 400400 FloridaFlorida 800800 GeorgiaGeorgia 400400 IllinoisIllinois 600600 IowaIowa 400400 NevadaNevada 400400 New JerseyNew Jersey 400400 New MexicoNew Mexico 400400 New YorkNew York 800800 North CarolinaNorth Carolina 400400 TexasTexas 800800 WashingtonWashington 400400

Latino National Contextual DatabaseLatino National Contextual Database Include census, economic and demographic data:Include census, economic and demographic data:
Income, education, residential segregation, foreign-born population, Income, education, residential segregation, foreign-born population, national-origin group, citizenship status etc. at state, community, national-origin group, citizenship status etc. at state, community, political boundary, bloc and tract levelspolitical boundary, bloc and tract levels
Include political data:Include political data: Representation by gender, ethnicity, and partyRepresentation by gender, ethnicity, and party Aggregate political data, including party distribution, voter registration and Aggregate political data, including party distribution, voter registration and
turnoutturnout VRA Section 5 covered jurisdictionVRA Section 5 covered jurisdiction
Include education data:Include education data: Per pupil expenditurePer pupil expenditure Percent of LEP studentsPercent of LEP students Bilingual Instruction/English Immersion practicesBilingual Instruction/English Immersion practices Latinos as a share of total school enrollmentLatinos as a share of total school enrollment Racial and ethnic composition of school boardsRacial and ethnic composition of school boards

Themes within the SurveyThemes within the Survey
Survey includes…many of the questions or topics you Survey includes…many of the questions or topics you have grown to love from existing surveys, whenever have grown to love from existing surveys, whenever possible to ensure comparability;possible to ensure comparability;
Questions submitted by various political scientists specifically Questions submitted by various political scientists specifically targeted at states;targeted at states;
Questions suggested by the advisory board;Questions suggested by the advisory board;
Beyond the standard, we focused on transnationalism, Beyond the standard, we focused on transnationalism, identity, inter-group and intra-group relations, gender, identity, inter-group and intra-group relations, gender, education, policy preferences, discrimination, education, policy preferences, discrimination, mobilization and overall political orientations;mobilization and overall political orientations;
Some questions specific to foreign born, non-citizens, Some questions specific to foreign born, non-citizens, registered voters, and residents of specific states.registered voters, and residents of specific states.

Latino National Contextual DatabaseLatino National Contextual Database• Census demographic neighborhood data:Census demographic neighborhood data:
Income, education, residential segregation, foreign-born population, Income, education, residential segregation, foreign-born population, national-origin group, citizenship status etc. at state, community, national-origin group, citizenship status etc. at state, community, political boundary, bloc and tract levelspolitical boundary, bloc and tract levels
• Political jurisdiction data:Political jurisdiction data: Representation by gender, ethnicity, and partyRepresentation by gender, ethnicity, and party Aggregate political data, including party distribution, voter registration and Aggregate political data, including party distribution, voter registration and
turnoutturnout VRA Section 5 covered jurisdictionVRA Section 5 covered jurisdiction
• School district data:School district data: Per pupil expenditurePer pupil expenditure Percent of ELL studentsPercent of ELL students Bilingual Instruction/English Immersion practicesBilingual Instruction/English Immersion practices Latinos as a share of total school enrollmentLatinos as a share of total school enrollment Racial and ethnic composition of school boardsRacial and ethnic composition of school boards

Sources of FundingSources of Funding
• Annie E. Casey FoundationAnnie E. Casey Foundation• Carnegie CorporationCarnegie Corporation• Ford FoundationFord Foundation• Hewlett FoundationHewlett Foundation• Irvine FoundationIrvine Foundation• Joyce FoundationJoyce Foundation• Kellogg FoundationKellogg Foundation• National Science FoundationNational Science Foundation• Russell Sage FoundationRussell Sage Foundation• Texas A&M University: MALRC, PERGTexas A&M University: MALRC, PERG

The Miracles of Sample SizeThe Miracles of Sample SizeUsable sub-samples forUsable sub-samples for National origin groups (7)National origin groups (7) Stand-alone State Analysis:Stand-alone State Analysis:
15 states + DC Metro15 states + DC Metro GenerationsGenerations
5704 Foreign born5704 Foreign born 936 US-born to FB parents936 US-born to FB parents 892 US-born to at least one US born parent892 US-born to at least one US born parent 1023 US-born citizens of at least one US grandparent1023 US-born citizens of at least one US grandparent
• Includes 443 Island born Puerto Ricans andIncludes 443 Island born Puerto Ricans and• 580 4580 4thth generation US mainland born generation US mainland born
Sample StrataSample Strata Before and after Immigration MarchesBefore and after Immigration Marches Mexican State Analysis : 12 Mexican states with N’s greater than 100 Mexican State Analysis : 12 Mexican states with N’s greater than 100
respondents (1 200+, 2 300+, 2 400+):respondents (1 200+, 2 300+, 2 400+): Add statesAdd states
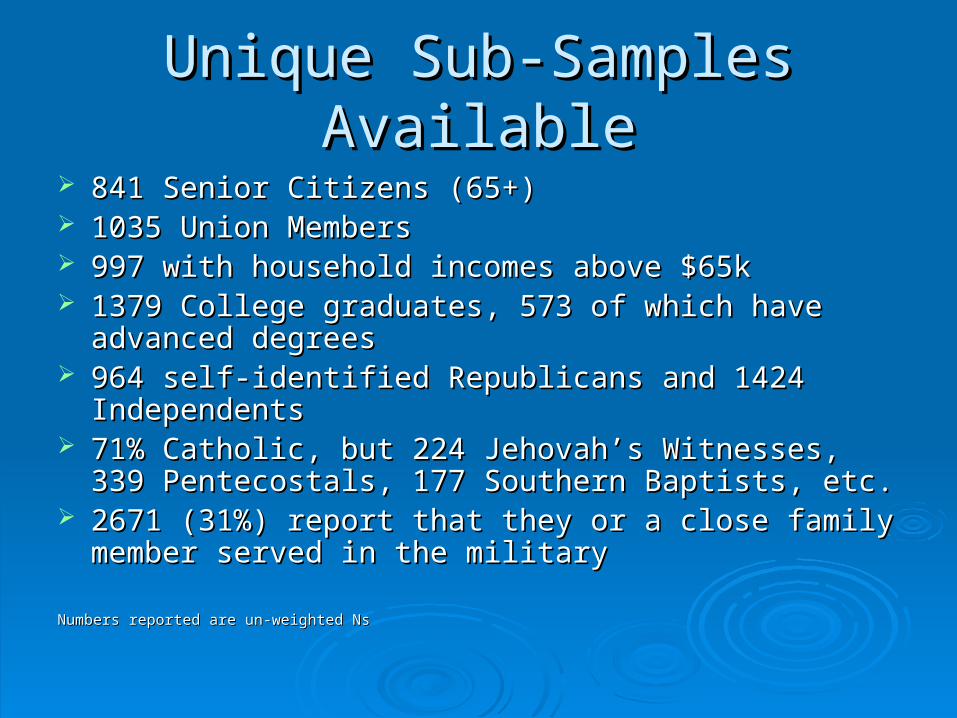
Unique Sub-Samples AvailableUnique Sub-Samples Available
841 Senior Citizens (65+) 841 Senior Citizens (65+) 1035 Union Members1035 Union Members 997 with household incomes above $65k997 with household incomes above $65k 1379 College graduates, 573 of which have advanced 1379 College graduates, 573 of which have advanced
degreesdegrees 964 self-identified Republicans and 1424 Independents964 self-identified Republicans and 1424 Independents 71% Catholic, but 224 Jehovah’s Witnesses, 339 71% Catholic, but 224 Jehovah’s Witnesses, 339
Pentecostals, 177 Southern Baptists, etc.Pentecostals, 177 Southern Baptists, etc. 2671 (31%) report that they or a close family member 2671 (31%) report that they or a close family member
served in the militaryserved in the military
Numbers reported are un-weighted NsNumbers reported are un-weighted Ns

Conceptual FrameworkConceptual Framework
False dichotomy of Latinoness and False dichotomy of Latinoness and AmericannessAmericanness Single dimension with each at one extremeSingle dimension with each at one extreme
Latino identity is an American identityLatino identity is an American identity ““Latino” socially constructed in the U.S.Latino” socially constructed in the U.S. ““American” idealized identity also socially constructed American” idealized identity also socially constructed
in the U.S.in the U.S.
BothBoth dimensions necessary to understand dimensions necessary to understand Latinos in American politicsLatinos in American politics
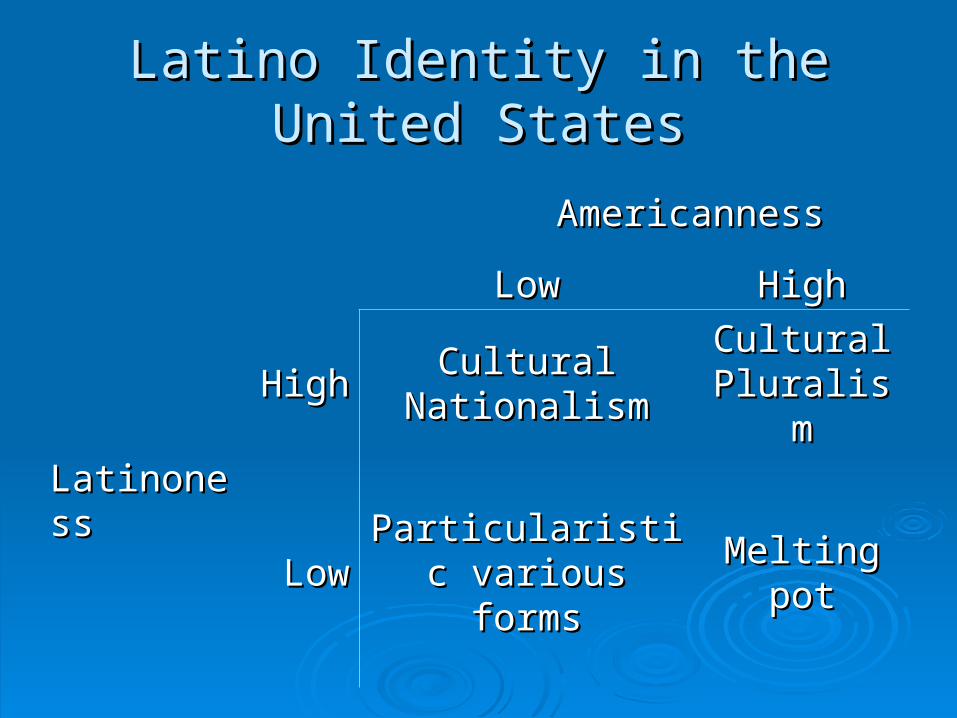
Latino Identity in the United StatesLatino Identity in the United States
AmericannessAmericanness
LowLow HighHigh
LatinonessLatinoness
HighHigh Cultural Cultural NationalismNationalism
Cultural Cultural PluralismPluralism
LowLow Particularistic Particularistic various formsvarious forms Melting potMelting pot

Contemporary Latinoness in the Contemporary Latinoness in the U.S.U.S.
1989 LNPS: national origin preference 1989 LNPS: national origin preference clearclear
Increasing immigration in the U.S.Increasing immigration in the U.S. Continued prevalence of Mexican-origin Continued prevalence of Mexican-origin
among Latinosamong Latinos
Expect persistence of national-origin as Expect persistence of national-origin as principal self-identifierprincipal self-identifier

LNS 2006LNS 2006
• PANETHNIC HISPANIC/LATINO IDENTIFICATIONPANETHNIC HISPANIC/LATINO IDENTIFICATION 100% INCREASE100% INCREASE
• RACIAL IDENTIFICATIONRACIAL IDENTIFICATION MORE COMPLEX THAN PREVIOUSLY UNDERSTOODMORE COMPLEX THAN PREVIOUSLY UNDERSTOOD
• INTERGROUP RELATIONSINTERGROUP RELATIONS STRONG SENTIMENTS OF COMMONALITY AND STRONG SENTIMENTS OF COMMONALITY AND
LINKED FATE WITH AFRICAN AMERICANSLINKED FATE WITH AFRICAN AMERICANS
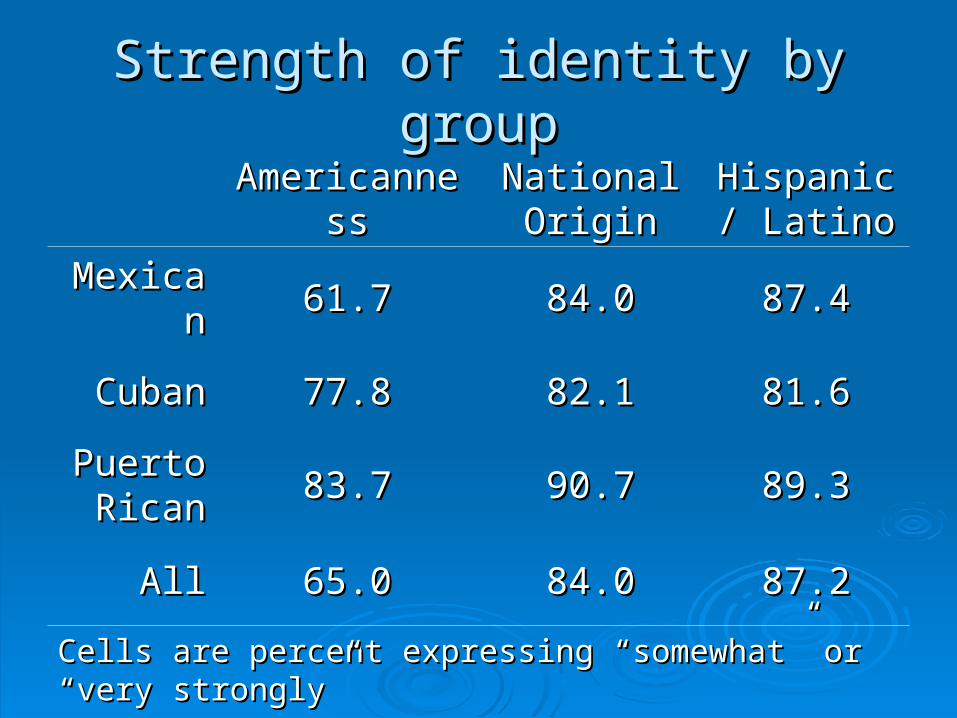
Strength of identity by groupStrength of identity by group
AmericannessAmericannessNational National OriginOrigin
Hispanic/ Hispanic/ LatinoLatino
MexicanMexican 61.761.7 84.084.0 87.487.4
CubanCuban 77.877.8 82.182.1 81.681.6
Puerto Puerto RicanRican 83.783.7 90.790.7 89.389.3
AllAll 65.065.0 84.084.0 87.287.2
Cells are percent expressing “somewhat” or “very strongly”Cells are percent expressing “somewhat” or “very strongly”
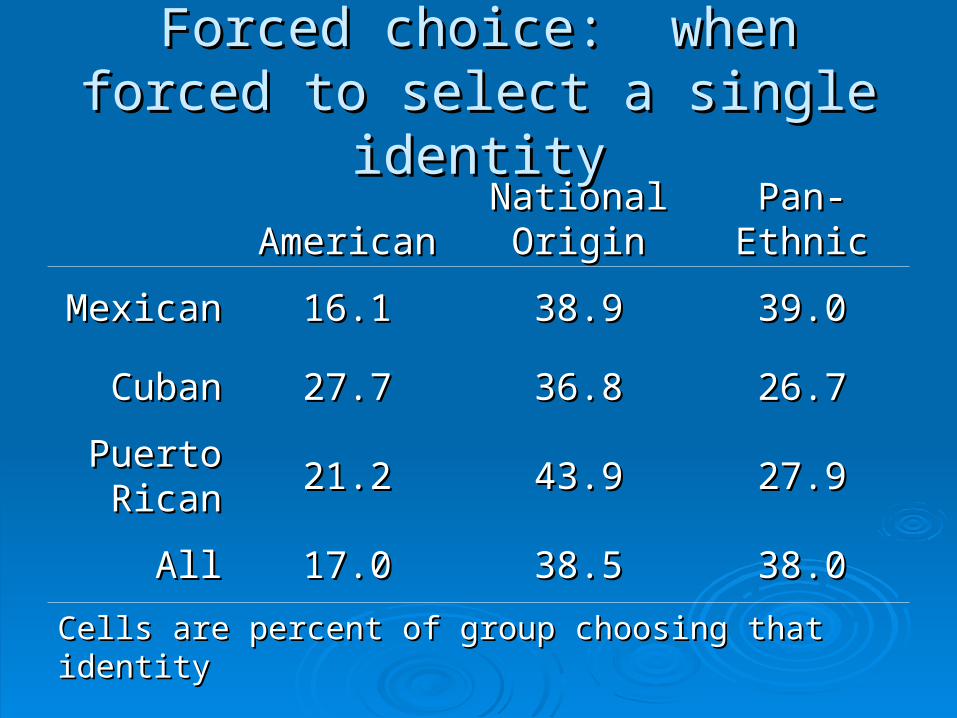
Forced choice: when forced to Forced choice: when forced to select a single identityselect a single identity
AmericanAmericanNational National OriginOrigin Pan-EthnicPan-Ethnic
MexicanMexican 16.116.1 38.938.9 39.039.0
CubanCuban 27.727.7 36.836.8 26.726.7
Puerto Puerto RicanRican 21.221.2 43.943.9 27.927.9
AllAll 17.017.0 38.538.5 38.038.0
Cells are percent of group choosing that identityCells are percent of group choosing that identity
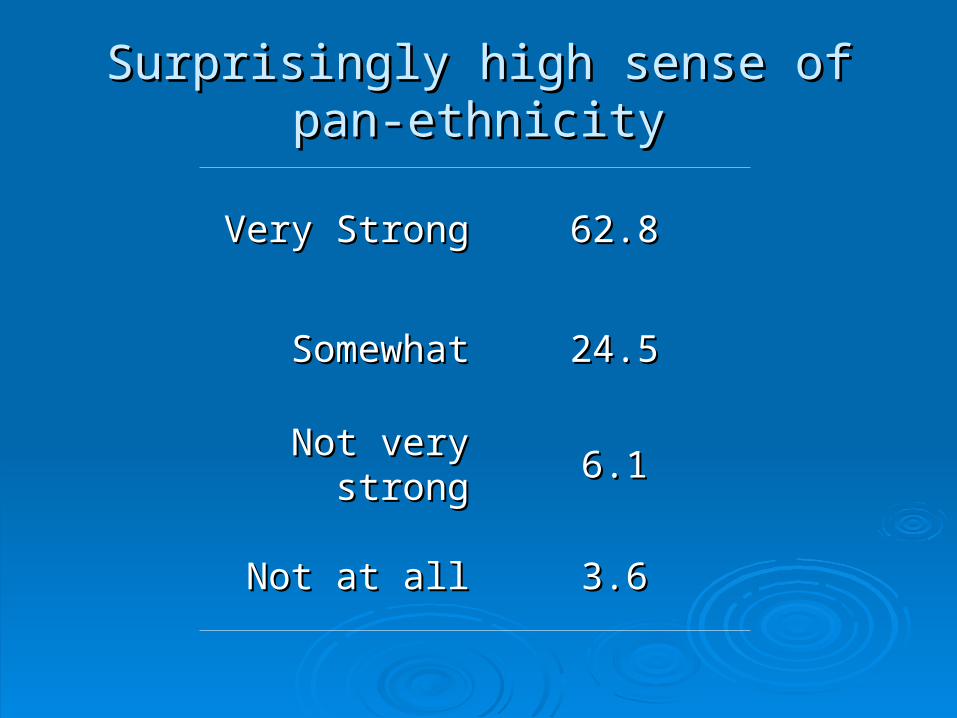
Surprisingly high sense of pan-ethnicitySurprisingly high sense of pan-ethnicity
Very StrongVery Strong 62.862.8
SomewhatSomewhat 24.524.5
Not very strongNot very strong 6.16.1
Not at allNot at all 3.63.6

Latin Linked FateLatin Linked FateIndividual & Group-based PerceptionIndividual & Group-based Perception
Mex Mex indind
Mex Mex groupgroup
Cuban Cuban indind
Cuban Cuban groupgroup
PR PR indind
PR PR groupgroup
NothingNothing 14.314.3 7.17.1 18.418.4 13.413.4 22.122.1 11.311.3
LittleLittle 15.315.3 13.213.2 11.911.9 8.68.6 15.315.3 14.114.1
SomeSome 24.624.6 25.825.8 20.520.5 22.222.2 21.721.7 28.528.5
A LotA Lot 39.239.2 46.846.8 36.336.3 43.743.7 34.134.1 38.538.5
How much does your “doing well” depend on other Latinos/Hispanics How much does your “doing well” depend on other Latinos/Hispanics also doing well? How much does [ethnic subgroup] “doing well” also doing well? How much does [ethnic subgroup] “doing well” depend on how other Hispanics or Latinos also doing well?depend on how other Hispanics or Latinos also doing well?

Extent of Commonality among Latinos regarding Jobs, Education and Extent of Commonality among Latinos regarding Jobs, Education and Income Attainment with African Americans and WhitesIncome Attainment with African Americans and Whites
Latinos in National Latinos in National Latino SurveyLatino Survey
Commonality with Commonality with African AmericansAfrican Americans
Commonality with Commonality with WhitesWhites
NativityNativity Some/ A lotSome/ A lot Some/ A lotSome/ A lot
Native Born (2408)Native Born (2408)11 67.9%67.9% 56.1%56.1%
Foreign-bornForeign-born22 (5704) (5704) 45.945.9 45.145.1
Latino Sub-GroupsLatino Sub-Groups
Colombians (139)Colombians (139) 46.846.8 53.253.2
Cubans (419)Cubans (419) 51.351.3 55.455.4
Dominicans (335)Dominicans (335) 53.753.7 43.643.6
El Salvadorans (406)El Salvadorans (406) 48.848.8 45.145.1
Guatemalans (149)Guatemalans (149) 40.940.9 43.643.6
Mexicans (5690)Mexicans (5690) 51.051.0 47.247.2
Puerto Ricans (759)Puerto Ricans (759) 65.565.5 54.254.2
11 The numbers in the parentheses represent the number of respondents in that categoryThe numbers in the parentheses represent the number of respondents in that category
22 The operational definition for the foreign-born includes all persons born outside the U.S., The operational definition for the foreign-born includes all persons born outside the U.S., including being born in Puerto Rico.including being born in Puerto Rico.

Extent of Commonality among Latinos regarding their Extent of Commonality among Latinos regarding their political situation with African Americans and Whitespolitical situation with African Americans and Whites
Latinos in National Latinos in National Latino SurveyLatino Survey
Commonality with Commonality with African AmericansAfrican Americans
Commonality with Commonality with WhitesWhites
NativityNativity Some/ A lotSome/ A lot Some/ A lotSome/ A lot
Native Born (2408)Native Born (2408)11 62.8%62.8% 48.7%48.7%
Foreign-bornForeign-born22 (5704) (5704) 43.443.4 64.164.1
Latino Sub-GroupsLatino Sub-Groups
Colombians (139)Colombians (139) 49.649.6 41.741.7
Cubans (419)Cubans (419) 51.351.3 49.949.9
Dominicans (335)Dominicans (335) 52.852.8 43.343.3
El Salvadorans (406)El Salvadorans (406) 45.345.3 40.940.9
Guatemalans (149)Guatemalans (149) 40.940.9 39.639.6
Mexicans (5690)Mexicans (5690) 46.946.9 42.642.6
Puerto Ricans (759)Puerto Ricans (759) 60.660.6 47.747.7
11 The numbers in the parentheses represent the number of respondents in that categoryThe numbers in the parentheses represent the number of respondents in that category
22 The operational definition for the foreign-born includes all persons born outside the U.S., The operational definition for the foreign-born includes all persons born outside the U.S., including being born in Puerto Rico.including being born in Puerto Rico.

How much does Latinos doing well depend on How much does Latinos doing well depend on African Americans doing wellAfrican Americans doing well
Latinos in National Latinos in National Latino SurveyLatino Survey Linked Fate with African AmericansLinked Fate with African Americans
NativityNativity Some/ A lotSome/ A lot
Native Born (2408)Native Born (2408)11 53.4%53.4%
Foreign-bornForeign-born22 (5704) (5704) 67.067.0
Latino Sub-GroupsLatino Sub-Groups
Colombians (139)Colombians (139) 66.966.9
Cubans (419)Cubans (419) 61.361.3
Dominicans (335)Dominicans (335) 72.272.2
El Salvadorans (406)El Salvadorans (406) 68.268.2
Guatemalans (149)Guatemalans (149) 64.464.4
Mexicans (5690)Mexicans (5690) 62.462.4
Puerto Ricans (759)Puerto Ricans (759) 61.861.8
11 The numbers in the parentheses represent the number of respondents in that categoryThe numbers in the parentheses represent the number of respondents in that category
22 The operational definition for the foreign-born includes all persons born outside the U.S., The operational definition for the foreign-born includes all persons born outside the U.S., including being born in Puerto Rico.including being born in Puerto Rico.

Self-identification Distribution:Self-identification Distribution:
66.1% some other race66.1% some other race
24.0% white24.0% white
.8% black.8% black
Fully 51% of respondents say Latino/Hispanic is Fully 51% of respondents say Latino/Hispanic is a different race!a different race!
But… race isn’t the same as skin tone.But… race isn’t the same as skin tone.
Racial IdentificationRacial Identification
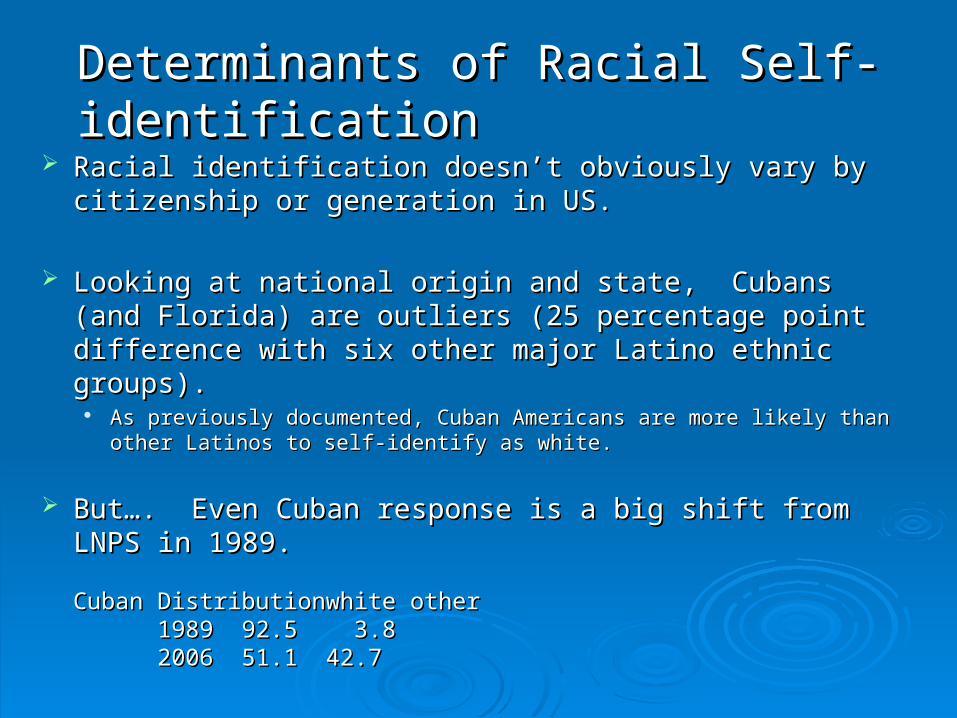
Determinants of Racial Self-identificationDeterminants of Racial Self-identification Racial identification doesn’t obviously vary by citizenship or Racial identification doesn’t obviously vary by citizenship or
generation in US. generation in US.
Looking at national origin and state, Cubans (and Florida) are Looking at national origin and state, Cubans (and Florida) are outliers (25 percentage point difference with six other major outliers (25 percentage point difference with six other major Latino ethnic groups).Latino ethnic groups).
As previously documented, Cuban Americans are more likely than other Latinos As previously documented, Cuban Americans are more likely than other Latinos to self-identify as white.to self-identify as white.
But…. Even Cuban response is a big shift from LNPS in 1989.But…. Even Cuban response is a big shift from LNPS in 1989.
Cuban DistributionCuban Distribution whitewhite otherother19891989 92.592.5 3.8 3.820062006 51.151.1 42.742.7

Plurality Answer in the mid-range of dark to light. Plurality Answer in the mid-range of dark to light. Majority answered 4 or 5, i.e. light.Majority answered 4 or 5, i.e. light.
Cuban Responses for skin-tone not significantly different Cuban Responses for skin-tone not significantly different from other groups:from other groups:
8.1 % answering ‘dark’ or ‘very dark,’ compared to 10% of other 8.1 % answering ‘dark’ or ‘very dark,’ compared to 10% of other groups.groups.
Skin-tone not obviously correlated to outcomes in Skin-tone not obviously correlated to outcomes in employment, home ownership, education, income, employment, home ownership, education, income, thinking of self as American, experience of crime, or thinking of self as American, experience of crime, or intermarriage.intermarriage.
Most importantly, skin-tone not closely correlated with Most importantly, skin-tone not closely correlated with self-reported racial identification.self-reported racial identification.
Skin-tone and its effectsSkin-tone and its effects

ImplicationsImplications• Preliminary findings challenge previous researchPreliminary findings challenge previous research
• Empirical observations distinctEmpirical observations distinct• Theories must be reexaminedTheories must be reexamined
• Dimensions of communityDimensions of community• How is it manifested?How is it manifested?• Which factors drive sense of communityWhich factors drive sense of community
• Implications for American politicsImplications for American politics• Effects of community sentiment on the development Effects of community sentiment on the development
of the Latino futureof the Latino future• Effects of Latino community sentiment on American Effects of Latino community sentiment on American
politicspolitics

Public Release of Data SetPublic Release of Data Set Questionnaire available in the Fall of 2006 at the Questionnaire available in the Fall of 2006 at the
University of Washington Institute for the Study University of Washington Institute for the Study of Ethnicity, Race, and Sexuality (WISER) at of Ethnicity, Race, and Sexuality (WISER) at http://depts.washington.edu/uwiserhttp://depts.washington.edu/uwiser
Release to Advisory Board in Spring 2007Release to Advisory Board in Spring 2007 Conference for Assistant Professors and Conference for Assistant Professors and
Graduate Students in AY 2007-8 selected from a Graduate Students in AY 2007-8 selected from a call for papers to be issued Summer 07call for papers to be issued Summer 07
Release to general political science public at the Release to general political science public at the 2007 Annual Meeting of the American Political 2007 Annual Meeting of the American Political Science AssociationScience Association