latin america and the caribbean’s economic recovery€¦ · · 2016-07-21latin america and the...
TRANSCRIPT

| 1775 Massachusetts Avenue, NW, Washington, DC 20036 | 202.797.6000 | fax 202.797.6004 | brookings.edu
1
Latin America and the Caribbean’s
Economic Recovery
Mauricio Cárdenas and Camila Henao, Brookings Institution
Introduction Latin American countries have a long and distressing history of economic downturns and fast subsequent
economic recoveries: the 1994 Mexican debt crisis, the 1997 contagion from the Asian financial crisis, the
1998-99 currency crisis in Brazil and the 2001-2002 debt crisis in Argentina (IADB, 2008). These
economic crises and recoveries have captured the attention and efforts of policymakers for more than 20
years. Due to the reform effort undertaken by the region over this time period, the global financial setback
of 2008-2009 did not catch the region off-guard. Therefore, although the events of 2008 did have a
considerable effect on Latin American economies, the effects were less adverse than in developed
countries and milder than previous episodes of contagion.
Latin America has shown extraordinary resilience during the recent global financial crisis mainly because
it experienced unprecedented international financial support and strong macroeconomic fundamentals
(Izquierdo and Talvi, 2010). This time the region boasted low fiscal and current account deficits, greater
degree of exchange rate flexibility, low levels of short-term foreign debt and high levels of international
reserves. The combination of stronger fundamentals and a new level of competence in implementing
countercyclical fiscal and monetary policies are the primary reasons why Latin America withstood the
global recession. China’s robust economic growth was also a factor, as commodity-exporting countries in
Latin America benefited from high terms of trade with China.
Latin America has not been immune to global shocks and it would be misleading to suggest so.
Historically, cycles of recession and recovery in the region have very closely followed that of the
developed world. The current setback in financial markets and fears of a double dip recession in
developed countries are also likely to have a prolonged impact on the region’s economic performance.
That said, Latin America’s recent capacity to resist a severe downturn without a major financial crisis
suggests that it has moved closer to attaining economic normalcy, as defined by a combination of
stronger fundamentals and the capability to implement countercyclical policies (Izquierdo and Talvi,
2008).
In an effort to assess current economic trends, we constructed the Latin America and the Caribbean
Economic Recovery Index (LACER) based on Eswar Prasad and Karim Foda’s Tracking Indexes for

| 1775 Massachusetts Avenue, NW, Washington, DC 20036 | 202.797.6000 | fax 202.797.6004 | brookings.edu
2
Global Economic Recovery (TIGER) for the G-20 economies. LACER combines real, financial and
confidence variables for the seven largest economies in Latin America: Argentina, Brazil, Chile,
Colombia, Mexico, Peru, and Venezuela. These economies represent 91 percent of the combined GDP of
Latin America and the Caribbean.
This note describes the variables used, their sources and the time span for which they are available. It
also explains the methodology used to aggregate the variables and to construct the overall indexes and
presents the results from the real, financial, confidence and overall indexes.
Methodology The LACER index is constructed using principal component analysis (PCA), which is a multivariate
statistical technique used to reduce the number of variables in a data set into a smaller number of
dimensions. This technique presupposes that the input variables are correlated and obtains uncorrelated
indices which are linear combinations or components of the initial variables. Graphically, components are
at right angles to each other, highlighting their uncorrelated property which means they measure different
dimensions in the data (See Vyas and Kumaranayake, 2006).
The components are ordered so that the first component explains the largest possible amount of variation
in the original data. The second component, uncorrelated to the first component, explains additional but
less variation than the first component and so forth (Vyas and Kumaranayake, 2006).
Specifically, the LACER index displays the common variance of the growth rate of a set of key economic
variables and should be interpreted as an indicator that takes the pulse of their growth rates. For
simplicity, the linear combination is scaled in a 0 to 100 range, corresponding to the historical minimum
and maximum values. For each country we construct four indexes: one corresponding to each set of
variables ─ real, financial and confidence ─ and a composite measure of these three indexes, the overall
LACER index. The following tables summarize the variables used in the construction of the corresponding
indexes. All data are monthly.
The information on the real economy includes the following variables: employment level, export volume,
import volume, industrial production volume and GDP. In all cases, we use the 12-month growth rate
(GDP is quarterly, year over year) of the seasonally-adjusted data (not adjusted in the case of GDP).
Financial sector variables include the 12-month growth rate in equity prices and stock market
capitalization (all in domestic currency) plus the emerging bond spread (in basis points over U.S.
Treasury) and the TED spread (difference between the 3-month Libor and the U.S. Treasury). Confidence
data include results from business and consumer confidence surveys (except in Venezuela where data
were not available). To capture long-run trends as well as short-term fluctuations, we use monthly data
(except for GDP, which is quarterly).

| 1775 Massachusetts Avenue, NW, Washington, DC 20036 | 202.797.6000 | fax 202.797.6004 | brookings.edu
3
Variable Description Source
Employment
12‐month growth rate of total employment levels; quarterly data for Mexico. Argentina and Venezuela not included given data limitations.
International Labor Organization
Exports
12‐month growth rate of 3 month moving average of seasonally adjusted volume. Venezuela not included given data limitations.
World Bank, Global Economic Monitor
Imports12‐month growth rate of 3 month moving average. Seasonally adjusted volume.
World Bank, Global Economic Monitor
Industrial Production12‐month growth rate of 3 month moving average. Seasonally adjusted volume.
World Bank, Global Economic Monitor
GDP Quarterly, year‐over‐year real growth rate. Each month in quarter is equal to quarterly rate.
Economic Intelligence Unit
REAL VARIABLES
Variable Description Source
Equity Markets 12‐month growth rate of share price index in domestic currency
World Bank, Global Economic Monitor
Stock Market Capitalization
12‐month growth rate in domestic currency
CEIC Data Company, Ltd.; Bloomberg (Chile,
Colombia and Venezuela)
Emerging Bond Spreads
Basis points over US treasury
World Bank, Global Economic Monitor
TED SpreadDifference between 3‐month LIBOR and U.S. Treasury, basis points
World Bank, Global Economic Monitor and US
Dept. of Treasury
FINANCIAL VARIABLES
The data to construct the confidence index were taken from different sources and were modified so that
all surveys are comparable. All balances are normalized so that their range is between 0 and 100 and in a
manner such that 0 corresponds to the month for which the specific survey had the most unfavorable
answers, and 100 is the historical maximum for favorable responses. The re-scaled balances were
obtained with the following equation.

| 1775 Massachusetts Avenue, NW, Washington, DC 20036 | 202.797.6000 | fax 202.797.6004 | brookings.edu
4
Country Description Source
Argentina
Balance index. Perceptions over the next 12 months: economic situation, investment climate,
unemployment and credit availability; not included in overall calculus given data limitations.
Deloitte Barometro de Empresas‐ Deloitte
Argentina
BrazilData taken from OECD‐ smoothing, centering
and adjusting amplitude.OECD
Chile
Balances of business confidence levels. (Balance=Favorable‐unfavorable). Difussion
Score Balance=(Balance +100)/2 . This procedure rescales the results between [0,100] where 50 is a neutral score, less than 50 a non‐favorable
score, and more than 50 a favorable score. The final indicator is constructed as a weighted
average of 4 indicators of sectorial confidence: manufacturing, comerce, construction and mining. The weights correspond to the participation of such sectors in the GDP.
Universidad Adolfo Ibáñez‐ Business
School
ColombiaIndex of Industrial confidence. Balance index
(Balance=%favorable‐%unfavorable), and range [‐100,100].
Fedesarrollo
MexicoData taken from OECD‐ smoothing, centering
and adjusting amplitude.OECD
Peru
Balances Index; Balance=(% favorable‐%unfavorable‐1)*50. Range [0,100]; not included in overall calculations given data
limitations.
Banco Central de la Reserva del Perú
Venezuela N/A N/A
Argentina Balance Index; Balance= 50*(positive‐negative). Universidad Torcuato
di Tella ‐Finance Research Center
BrazilData taken from OECD‐ smoothing, centering
and adjusting amplitude.OECD
Chile
Balance Index, constructed from the public's responses to 5 questions regarding their personal economic situation, the country's
economy, the world economy in the long run, and expectations about household consumption.
Range [0,100].
IPEC
ColombiaIndex of Consumer Confidence. Balance index;
Balance=%favorable‐%unfavorable, and range [‐100,100].
Fedesarrollo
MexicoData taken from OECD‐ smoothing, centering
and adjusting amplitude.OECD
PeruBalance Index; Balance= %favorable‐
%unfavorable+100. Michelsen Consulting
Venezuela N/A N/A
Business Confidence
CONFIDENCE VARIABLES
Consum
er Confidence
*All balances rescaled such that 0 is the lowest point and a 100 the highest point.
| 1775 Massachusetts Avenue, NW, Washington, DC 20036 | 202.797.6000 | fax 202.797.6004 | brookings.edu
5
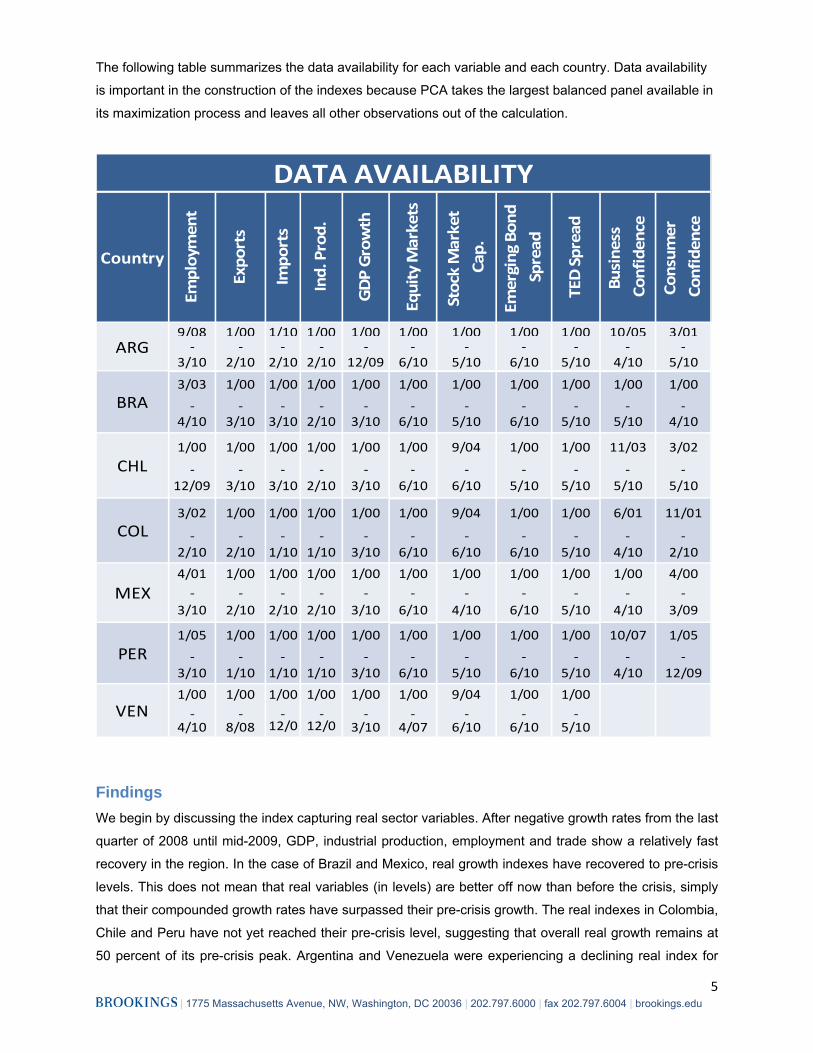
The following table summarizes the data availability for each variable and each country. Data availability
is important in the construction of the indexes because PCA takes the largest balanced panel available in
its maximization process and leaves all other observations out of the calculation.
Country
Employment
Exports
Imports
Ind. Prod.
GDP Growth
Equity Markets
Stock Market
Cap.
Emerging Bond
Spread
TED Spread
Business
Confidence
Consum
er
Confidence
9/08 1/00 1/10 1/00 1/00 1/00 1/00 1/00 1/00 10/05 3/01‐ ‐ ‐ ‐ ‐ ‐ ‐ ‐ ‐ ‐ ‐
3/10 2/10 2/10 2/10 12/09 6/10 5/10 6/10 5/10 4/10 5/10
3/03 1/00 1/00 1/00 1/00 1/00 1/00 1/00 1/00 1/00 1/00
‐ ‐ ‐ ‐ ‐ ‐ ‐ ‐ ‐ ‐ ‐4/10 3/10 3/10 2/10 3/10 6/10 5/10 6/10 5/10 5/10 4/10
1/00 1/00 1/00 1/00 1/00 1/00 9/04 1/00 1/00 11/03 3/02
‐ ‐ ‐ ‐ ‐ ‐ ‐ ‐ ‐ ‐ ‐12/09 3/10 3/10 2/10 3/10 6/10 6/10 5/10 5/10 5/10 5/10
3/02 1/00 1/00 1/00 1/00 1/00 9/04 1/00 1/00 6/01 11/01
‐ ‐ ‐ ‐ ‐ ‐ ‐ ‐ ‐ ‐ ‐2/10 2/10 1/10 1/10 3/10 6/10 6/10 6/10 5/10 4/10 2/10
4/01 1/00 1/00 1/00 1/00 1/00 1/00 1/00 1/00 1/00 4/00‐ ‐ ‐ ‐ ‐ ‐ ‐ ‐ ‐ ‐ ‐
3/10 2/10 2/10 2/10 3/10 6/10 4/10 6/10 5/10 4/10 3/09
1/05 1/00 1/00 1/00 1/00 1/00 1/00 1/00 1/00 10/07 1/05
‐ ‐ ‐ ‐ ‐ ‐ ‐ ‐ ‐ ‐ ‐3/10 1/10 1/10 1/10 3/10 6/10 5/10 6/10 5/10 4/10 12/09
1/00 1/00 1/00 1/00 1/00 1/00 9/04 1/00 1/00‐ ‐ ‐ ‐ ‐ ‐ ‐ ‐ ‐
4/10 8/08 12/0 12/0 3/10 4/07 6/10 6/10 5/10
MEX
PER
VEN
DATA AVAILABILITY
ARG
BRA
CHL
COL
Findings We begin by discussing the index capturing real sector variables. After negative growth rates from the last
quarter of 2008 until mid-2009, GDP, industrial production, employment and trade show a relatively fast
recovery in the region. In the case of Brazil and Mexico, real growth indexes have recovered to pre-crisis
levels. This does not mean that real variables (in levels) are better off now than before the crisis, simply
that their compounded growth rates have surpassed their pre-crisis growth. The real indexes in Colombia,
Chile and Peru have not yet reached their pre-crisis level, suggesting that overall real growth remains at
50 percent of its pre-crisis peak. Argentina and Venezuela were experiencing a declining real index for

| 1775 Massachusetts Avenue, NW, Washington, DC 20036 | 202.797.6000 | fax 202.797.6004 | brookings.edu
6
some time before the recent crisis and as early as 2004. Argentina has shown some recovery, whereas
Venezuela is imploding.
After a plunge in mid-2008, financial variables are recovering and have reached similar or higher growth
rates than those of the pre-crisis period. All of the countries’ indexes seem highly synchronized,
especially during and after the crisis. In more recent months and particularly after the Greek debt crisis,
Latin American equity markets have experienced considerable setbacks. This pattern is captured in the
country indexes as well as in the composite financial index.
In summary, financial variables have recovered faster than the real sector and confidence indicators.
However, financial markets are experiencing yet another downturn which has had a negative impact on
Latin America. So, the region has not been immune to the problems in Europe.
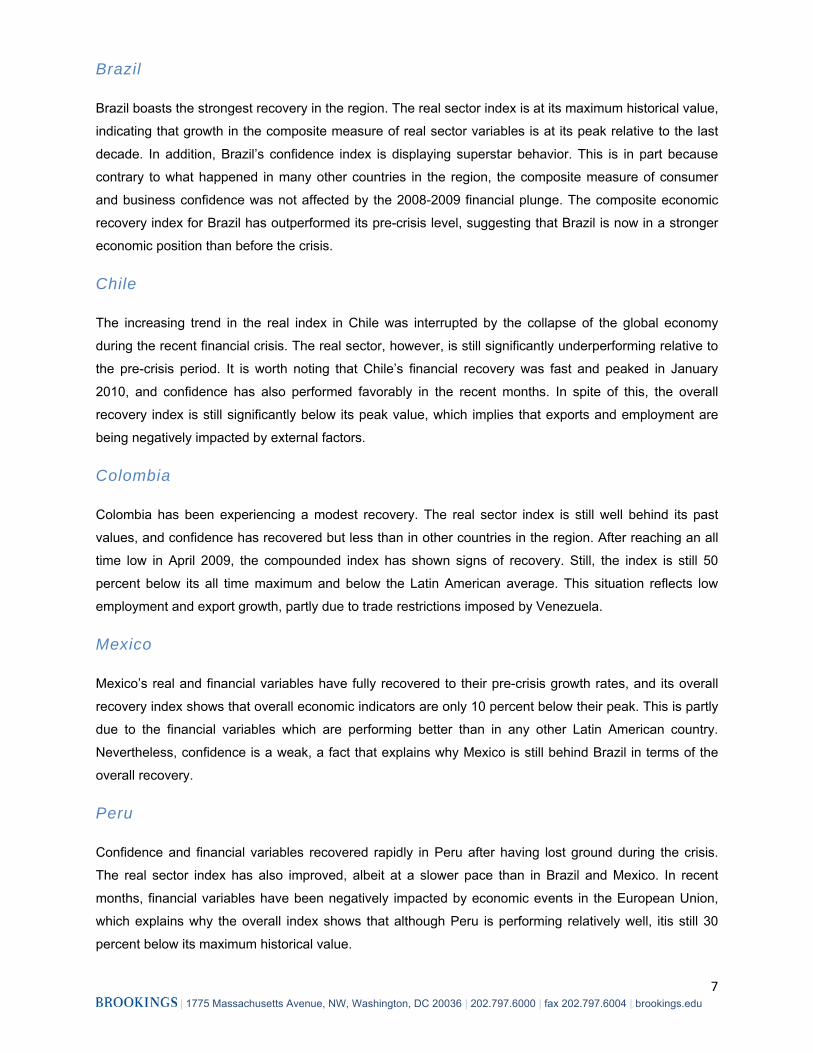
In terms of the confidence indexes, Brazil shows a strong positive trend unaffected by the recent crisis.
Mexico’s confidence index hit a historical low during the global recession in January 2009 and since then
has been recovering but has not reached the pre-crisis values. The same applies to Colombia and
Argentina. In Chile and Peru, confidence has recovered to close to pre-crisis levels.
The composite LACER index is still well below its highest point reached in January 2005. The situation
can be partly attributed to the fact that the real economy index is still significantly below the mean of the
pre-crisis era, except in Brazil. This is especially true in Venezuela, which is well below its past maximum
value. The region is also lagging because of confidence indicators.
Differences in economic performance within Latin America are evident. Some countries are recovering
quickly (Brazil and to some extent Mexico), others are moving forward but not quite yet at cruising speed
(Colombia, Chile and Peru), while Argentina and Venezuela are lagging behind. The diverging trends
reflect a range of factors, but domestic policies exert the most significant influence in explaining the
differences.
Individual Country Analysis Argentina
Argentina is currently experiencing a very modest recovery in the real index which is mainly the result of
job loss, declining trends in industrial production, and moderate GDP growth rates. The confidence index
shows signs of recovery after the crisis. Financial variables have performed well, explaining why the
overall recovery index shows a moderate but positive trend in recent months. However, data for 2010 are
showing signs of growth and it is likely that the real index will pick up significantly in future months.
| 1775 Massachusetts Avenue, NW, Washington, DC 20036 | 202.797.6000 | fax 202.797.6004 | brookings.edu
7
Brazil
Brazil boasts the strongest recovery in the region. The real sector index is at its maximum historical value,
indicating that growth in the composite measure of real sector variables is at its peak relative to the last
decade. In addition, Brazil’s confidence index is displaying superstar behavior. This is in part because
contrary to what happened in many other countries in the region, the composite measure of consumer
and business confidence was not affected by the 2008-2009 financial plunge. The composite economic
recovery index for Brazil has outperformed its pre-crisis level, suggesting that Brazil is now in a stronger
economic position than before the crisis.
Chile
The increasing trend in the real index in Chile was interrupted by the collapse of the global economy
during the recent financial crisis. The real sector, however, is still significantly underperforming relative to
the pre-crisis period. It is worth noting that Chile’s financial recovery was fast and peaked in January
2010, and confidence has also performed favorably in the recent months. In spite of this, the overall
recovery index is still significantly below its peak value, which implies that exports and employment are
being negatively impacted by external factors.
Colombia
Colombia has been experiencing a modest recovery. The real sector index is still well behind its past
values, and confidence has recovered but less than in other countries in the region. After reaching an all
time low in April 2009, the compounded index has shown signs of recovery. Still, the index is still 50
percent below its all time maximum and below the Latin American average. This situation reflects low
employment and export growth, partly due to trade restrictions imposed by Venezuela.
Mexico
Mexico’s real and financial variables have fully recovered to their pre-crisis growth rates, and its overall
recovery index shows that overall economic indicators are only 10 percent below their peak. This is partly
due to the financial variables which are performing better than in any other Latin American country.
Nevertheless, confidence is a weak, a fact that explains why Mexico is still behind Brazil in terms of the
overall recovery.
Peru
Confidence and financial variables recovered rapidly in Peru after having lost ground during the crisis.
The real sector index has also improved, albeit at a slower pace than in Brazil and Mexico. In recent
months, financial variables have been negatively impacted by economic events in the European Union,
which explains why the overall index shows that although Peru is performing relatively well, itis still 30
percent below its maximum historical value.

| 1775 Massachusetts Avenue, NW, Washington, DC 20036 | 202.797.6000 | fax 202.797.6004 | brookings.edu
8
Venezuela
The real sector index shows a declining trend, which is atypical for a Latin American economy. Financial
sector variables do not show a distinctive trend, implying that non-financial forces are driving the results
of the overall recovery index and that has been relatively unaffected by the financial crisis. What is
remarkable about this index is its persistent negative trend since 2004. Venezuela has reached a
historical low in terms of economic performance, not necessarily in levels but certainly in growth terms.
Conclusion Three stylized facts can be drawn from our analysis:
• Latin American recovery has gathered momentum as the real, financial and confidence indexes
rebound strongly. Nevertheless, there is still room for further growth as the overall LACER index
is still below its historical peak in every country, with the exception of Brazil.
• The financial sector recovered faster than the real economy and business and consumer
confidence. Nonetheless, the financial indicators are recently displaying yet another downturn,
implying that the region has not been immune to the problems in Europe.
• The recovery has been strong in all countries, with the notable exception of Venezuela where the
overall LACER growth index has a declining trend.

| 1775 Massachusetts Avenue, NW, Washington, DC 20036 | 202.797.6000 | fax 202.797.6004 | brookings.edu
9

| 1775 Massachusetts Avenue, NW, Washington, DC 20036 | 202.797.6000 | fax 202.797.6004 | brookings.edu
10
| 1775 Massachusetts Avenue, NW, Washington, DC 20036 | 202.797.6000 | fax 202.797.6004 | brookings.edu
11

| 1775 Massachusetts Avenue, NW, Washington, DC 20036 | 202.797.6000 | fax 202.797.6004 | brookings.edu
12

| 1775 Massachusetts Avenue, NW, Washington, DC 20036 | 202.797.6000 | fax 202.797.6004 | brookings.edu
13

| 1775 Massachusetts Avenue, NW, Washington, DC 20036 | 202.797.6000 | fax 202.797.6004 | brookings.edu
14
References Inter-American Developing Bank, 2008. Social and Labor Market Policies for Tumultuous Times: Confronting the Global Crisis in Latin America and the Caribbean, Washington, DC, United States: IADB.
Izquierdo, A., and Talvi, E. 2008. Policy Trade-offs for Unprecedented Times, Washington, DC, United States: IADB.
Izquierdo, A., and Talvi, E. 2010. The Aftermath of the Crisis: Policy Lessons and Challenges Ahead for Latin America and the Caribbean, Washington, DC, United States: IADB.
Manly,BFJ, 1994. Multivariate statistical methods. A primer. 2nd Edition. London: Chapman and Hall.
Vyas, S., and Kumaranayake,L., 2006. How to do (or not to do)… Construction socio-economic status indices: how to use principal components analysis, Oxford University Press and The London School of Hygine and Tropical Medicine.

| 1775 Massachusetts Avenue, NW, Washington, DC 20036 | 202.797.6000 | fax 202.797.6004 | brookings.edu
15
Appendix: Country variables
Argentina Real Economy Indicators

| 1775 Massachusetts Avenue, NW, Washington, DC 20036 | 202.797.6000 | fax 202.797.6004 | brookings.edu
16
Financial Indicators
Confidence Indicators

| 1775 Massachusetts Avenue, NW, Washington, DC 20036 | 202.797.6000 | fax 202.797.6004 | brookings.edu
17
Brazil Real Economy Indicators

| 1775 Massachusetts Avenue, NW, Washington, DC 20036 | 202.797.6000 | fax 202.797.6004 | brookings.edu
18
Financial Indicators
Confidence Indicators
Chile Real Economy Indicators

| 1775 Massachusetts Avenue, NW, Washington, DC 20036 | 202.797.6000 | fax 202.797.6004 | brookings.edu
19
Financial Indicators

| 1775 Massachusetts Avenue, NW, Washington, DC 20036 | 202.797.6000 | fax 202.797.6004 | brookings.edu
20
Confidence Indicators

| 1775 Massachusetts Avenue, NW, Washington, DC 20036 | 202.797.6000 | fax 202.797.6004 | brookings.edu
21
Colombia Real Economy Indicators
Financial Indicators

| 1775 Massachusetts Avenue, NW, Washington, DC 20036 | 202.797.6000 | fax 202.797.6004 | brookings.edu
22
Confidence Indicators
Mexico Real Economy Indicators

| 1775 Massachusetts Avenue, NW, Washington, DC 20036 | 202.797.6000 | fax 202.797.6004 | brookings.edu
23
Financial Indicators
| 1775 Massachusetts Avenue, NW, Washington, DC 20036 | 202.797.6000 | fax 202.797.6004 | brookings.edu
24
Confidence Indicators
Peru Real Economy Indicators

| 1775 Massachusetts Avenue, NW, Washington, DC 20036 | 202.797.6000 | fax 202.797.6004 | brookings.edu
25
Financial Indicators

| 1775 Massachusetts Avenue, NW, Washington, DC 20036 | 202.797.6000 | fax 202.797.6004 | brookings.edu
26
Confidence Indicators
Venezuela Real Economy Indicators

| 1775 Massachusetts Avenue, NW, Washington, DC 20036 | 202.797.6000 | fax 202.797.6004 | brookings.edu
27
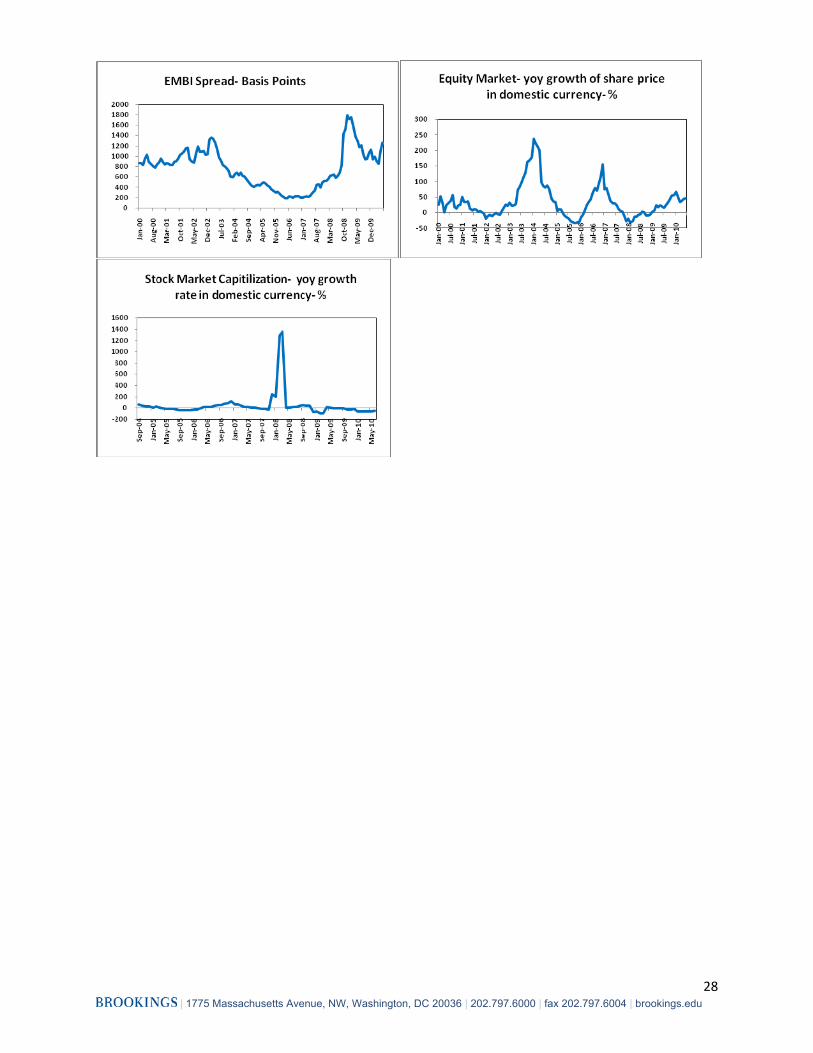
Financial Indicators
| 1775 Massachusetts Avenue, NW, Washington, DC 20036 | 202.797.6000 | fax 202.797.6004 | brookings.edu
28