laser-generation based imaging of ultrasonic wave ... · ultrasonic waves were disturbed by the...
TRANSCRIPT

Laser-Generation Based Imaging of Ultrasonic Wave Propagation
on Welded Steel Plates and Its Application to Defect Detection
Shigeki Yashiro1, Nobuyuki Toyama2, Junji Takatsubo2 and Tetsuro Shiraishi3
1Faculty of Engineering, Shizuoka University, Hamamatsu 432-8561, Japan2Research Institute of Instrumentation Frontier, National Institute of Advanced Industrial Science and Technology (AIST),Tsukuba 305-8568, Japan3Graduate School of Science and Engineering, Ehime University, Matsuyama 790-8577, Japan
This study investigated nondestructive testing of welded steel plates by imaging ultrasonic wave propagation based on laser generation.The specimens were scanned by a pulsed laser, and the signals were received by a fixed piezoelectric transducer. A moving diagram of wavepropagation from the fixed point was obtained directly from the collected signals. Wave scattering due to a weld defect (e.g., toe crack or rootcrack) was successfully imaged on weld specimens, and was easily recognized by visual observation in the measured moving diagrams. Theseexperiments demonstrated the ability of the imaging technique to inspect a large area in a short time and to reliably detect a defect. Furthermore,the position-time-amplitude maps (B-scope images) were reconstructed from the moving diagram along some lines perpendicular to the defect,and the location and the size of a root crack were evaluated based on the B-scope images. [doi:10.2320/matertrans.M2010204]
(Received June 10, 2010; Accepted September 2, 2010; Published October 14, 2010)
Keywords: weld defect, weld cracking, nondestructive testing, ultrasonic imaging, laser ultrasonics
1. Introduction
Nondestructive testing is an important engineering field inensuring structural safety. Of the many techniques developedfor damage detection and identification, ultrasonic testing hasbeen widely used to assess reliability of structural compo-nents, and various approaches aimed at quantitative evalua-tion of the damage have been proposed.1–5)
Ultrasonic testing has frequently been applied to theinspection of welding. Defects were detected by analyzingthe manually-measured one-dimensional waveform in themost popular ultrasonic testing. However, interpretation ofthe one-dimensional waveform, or detection of the signalfrom the defect, is sometimes difficult, since the scatteredsignal is measured as a mixed signal of the reflected wave,diffracted wave, and mode-converted wave with smalleramplitude. Accordingly, signal processing has been studiedfor accurate detection of defects.6,7) The phased-arraymethod8) and the time-of-flight diffraction (TOFD) method9)
have recently attracted attention, since the resulting two-dimensional (2D) images facilitate understanding of thedefect condition and enhance inspection reliability. Komuraet al.10) applied these methods to the inspection of weldingin a nuclear power plant. Although phased arrays and TOFDare powerful tools for precise analysis of a specific region,they are not suited for inspection of a large area of a three-dimensional shape with curved surfaces and irregularities,since some additional mechanical devices are needed to scanthe surface.
Imaging technique for ultrasonic wave propagation willbe a powerful tool of nondestructive testing, since the movingdiagram facilitates understanding on the mechanism of wavepropagation and detection of wave scattering. However,conventional imaging methods (e.g., photoelasticity)11–13)
apply only to transparent materials and have limited utility.Therefore, these methods have been used only to understand
experimentally the mechanism of ultrasonic wave propaga-tion. Recently, Staszewski et al.14) imaged wave propagationnear a fatigue crack in an aluminum plate by using a three-dimensional scanning laser vibrometer that enabled non-contact signal reception. The authors developed a techniquefor imaging wave propagation by using a scanning pulsedlaser for generation, and employed this technique to detectbonding damage in a CFRP skin/hat-stringer structure15) andartificial corrosion damage in a steel elbow-pipe.16) Althoughthese studies14–16) indicated usefulness of the wave propaga-tion images for damage detection, to our knowledge, no studyhas been reported on engineering applications of the imagingtechniques and on the possibility for characterizing damage.
The purpose of this study is then to verify the ability ofthe laser-generation based imaging technique to detectdefects in a steel plate with butt welding. For this purpose,we experimentally visualized wave propagation on weldspecimens by the imaging technique, and investigated defectdetection from the measured moving diagrams. Furthermore,the characterization of the weld defect is presented byreconstructing B-scope images, and the applicability of theimaging technique to sizing defects is discussed.
2. Procedure for Imaging Wave Propagation
In conventional imaging of ultrasonic wave propaga-tion,14,17,18) ultrasonic waves are generated at a fixed point bya piezoelectric transducer, and non-contact signal reception isperformed at grid points by a scanning laser vibrometer.However, the signal-to-noise ratio of a laser vibrometer(or other non-contact reception method) is generally poorcompared to that of a piezoelectric transducer.19,20) There-fore, waveform averaging was carried out in the previousstudies,14,17) and high-speed inspection is difficult. Here,the key point of the present technique is to exchange thegeneration and the non-contact reception: ultrasonic waves
Materials Transactions, Vol. 51, No. 11 (2010) pp. 2069 to 2075#2010 The Japan Institute of Metals
are generated at grid points by a scanning pulsed laser, andthe signal is received by a fixed piezoelectric transducer.Based on the reciprocity principle in wave propagation,16)
the waveforms obtained by the system with the scanninggeneration and the fixed reception are the same as the dataset of the conventional approach. The amplitude of eachwaveform at time t is then plotted on a contour map, whichcorresponds to a snapshot of the wave propagation. Finally,the snapshots are continually displayed in a time series andappear to be a moving diagram of wave propagation from thefixed reception point.
The system configuration with a scanning pulsed laser anda fixed receiver has the following two advantages overconventional approaches. (1) Scanning a three-dimensionalshape with curved surfaces and irregularities is easy, sincegeneration with a pulsed laser needs no control of laserincident angle and focus. (2) Waveform averaging is notnecessary since a high signal-to-noise ratio is achieved by apiezoelectric transducer. These two advantages enable high-speed inspection of a structural component with an arbitrarythree-dimensional shape.
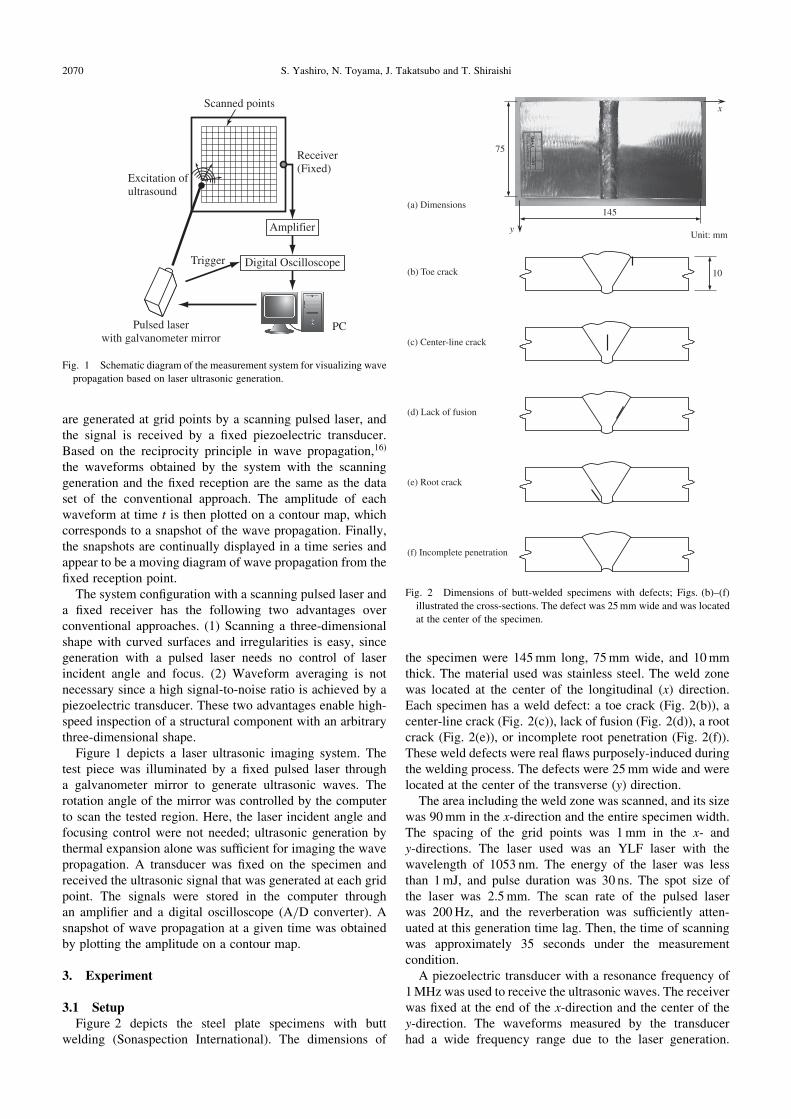
Figure 1 depicts a laser ultrasonic imaging system. Thetest piece was illuminated by a fixed pulsed laser througha galvanometer mirror to generate ultrasonic waves. Therotation angle of the mirror was controlled by the computerto scan the tested region. Here, the laser incident angle andfocusing control were not needed; ultrasonic generation bythermal expansion alone was sufficient for imaging the wavepropagation. A transducer was fixed on the specimen andreceived the ultrasonic signal that was generated at each gridpoint. The signals were stored in the computer throughan amplifier and a digital oscilloscope (A/D converter). Asnapshot of wave propagation at a given time was obtainedby plotting the amplitude on a contour map.
3. Experiment
3.1 SetupFigure 2 depicts the steel plate specimens with butt
welding (Sonaspection International). The dimensions of
the specimen were 145mm long, 75mm wide, and 10mmthick. The material used was stainless steel. The weld zonewas located at the center of the longitudinal (x) direction.Each specimen has a weld defect: a toe crack (Fig. 2(b)), acenter-line crack (Fig. 2(c)), lack of fusion (Fig. 2(d)), a rootcrack (Fig. 2(e)), or incomplete root penetration (Fig. 2(f)).These weld defects were real flaws purposely-induced duringthe welding process. The defects were 25mm wide and werelocated at the center of the transverse (y) direction.
The area including the weld zone was scanned, and its sizewas 90mm in the x-direction and the entire specimen width.The spacing of the grid points was 1mm in the x- andy-directions. The laser used was an YLF laser with thewavelength of 1053 nm. The energy of the laser was lessthan 1mJ, and pulse duration was 30 ns. The spot size ofthe laser was 2.5mm. The scan rate of the pulsed laserwas 200Hz, and the reverberation was sufficiently atten-uated at this generation time lag. Then, the time of scanningwas approximately 35 seconds under the measurementcondition.
A piezoelectric transducer with a resonance frequency of1MHz was used to receive the ultrasonic waves. The receiverwas fixed at the end of the x-direction and the center of they-direction. The waveforms measured by the transducerhad a wide frequency range due to the laser generation.
Amplifier
Digital Oscilloscope
Receiver(Fixed)
PCPulsed laserwith galvanometer mirror
Trigger
Excitation ofultrasound
Scanned points
Fig. 1 Schematic diagram of the measurement system for visualizing wave
propagation based on laser ultrasonic generation.
75
145
y
x
Unit: mm
(a) Dimensions
(b) Toe crack
(f) Incomplete penetration
10
(c) Center-line crack
(d) Lack of fusion
(e) Root crack
Fig. 2 Dimensions of butt-welded specimens with defects; Figs. (b)–(f)
illustrated the cross-sections. The defect was 25mm wide and was located
at the center of the specimen.
2070 S. Yashiro, N. Toyama, J. Takatsubo and T. Shiraishi

The components with the frequency up to 1.5MHz weremeasured by the transducer, and the major components hadthe frequencies of 0.5 to 1MHz.
3.2 Imaged wave propagation on weld specimensFigure 3 depicts the measured waveforms for generation at
distance �x from the center of the weld zone to thetransducer (Fig. 3(a)), which corresponds to one-dimensionalsignals in conventional ultrasonic testing. In the specimenwith a crack on the test surface (toe crack), scattered signalswith relatively large amplitude were delayed with increasingdistance �x (Fig. 3(b)). We could find the defect byobserving the change in the time delay of this scatteredsignal. The waveforms measured in the specimen with a
crack on the back surface (root crack) are depicted inFig. 3(c). In this case, the scattered signals were less clearthan those in Fig. 3(b). Then, detection of the defect on theback surface was more difficult than the defect on the testsurface.
Figure 4 depicts images of wave propagation in all theweld specimens. We obtained continuous moving diagrams;snapshots at 5 ms intervals are presented here. The propaga-tion of the incident wave in the þx-direction was visualizedin all the specimens. Two types of incident waves couldbe observed in the snapshots; one had higher velocity(5800m/s) with smaller amplitude, and the other had lowervelocity (3000m/s) with greater amplitude, where thevelocity was obtained by a B-scope image described later.As depicted in the dispersion curves calculated by Dispersesoftware (Fig. 5), the velocities of all the Lamb modeschanged within the measured frequency range. Moreover,the dispersion characteristic of guided waves did not appearin the measured waveforms (Fig. 3) even if the waveformscontained many frequency components. Therefore, theobserved waves were not the Lamb modes; the former wasdetermined as the longitudinal wave and the latter was theshear wave from the wave velocity.
Then, the wave propagation in the toe-crack specimen(Fig. 4(a)) is explained as a typical result. Clear wavescattering was observed at the center of the weld zone whenthe incident shear wave passed the weld zone (t ¼ 20 ms).The longitudinal wave and the shear wave reflected at theweld zone appeared after the wave scattering and propagatedin the �x direction (t � 20 ms). The scattered waves withlarge amplitudes were generated only at the center of theweld zone, not in all the specimen width. Therefore, theultrasonic waves were disturbed by the weld defect, not bythe welding.
The present study focused on finding the wave scattering,which is the first step in defect detection. Clear wavescattering was observed after 25 ms when the incident shearwave arrived at the weld zone in the specimen with the toecrack (Fig. 4(a)). The reflected waves had two types asobserved in the incident waves, and velocities of thesereflections were 3000m/s and 5800m/s, which correspond-ed to the shear wave and the longitudinal wave. The shearwave had larger amplitude than the longitudinal one in thereflected waves and mainly appeared. Wave scatteringsimilar to that in Fig. 4(a) was imaged after 25 ms in thespecimens with a center-line crack (Fig. 4(b)) and the lackof fusion (Fig. 4(c)). In the other defect types at the backsurface (Figs. 4(d) and 4(e)), a reflected wave with avelocity of 5800m/s (longitudinal wave) was mainlyobserved after the incident shear wave passed the weldzone, although the two types of reflections appeared as in thetoe crack specimen. The scattered wave with the largestamplitude was visible in the toe crack (Fig. 4(a)). Wavepropagation in the �x direction was also easily recognizedfor the center-line crack (Fig. 4(b)) and the lack of fusion(Fig. 4(c)) in the specimen. With the root crack (Fig. 4(d))and the incomplete penetration (Fig. 4(e)) on the backsurface, the scattered wave with smaller amplitude couldbe detected easily in the moving diagrams (continuallydisplayed snapshots), although specifying it in the still
∆x
(a) Test points
Receiver
Laser generation
Am
plitu
de
Time, t/µs0 5040302010
Am
plitu
de
Time, t/µs0 5040302010
(b) Toe crack
(c) Root crack
Incident wave Scattered wave (shear)
Incident wave Scattered wave (longitudinal)
Welding
∆x = 0 mm(Center of specimen)
∆x = 10 mm
∆x = 20 mm
∆x = 30 mm
∆x = 0 mm(Center of specimen)
∆x = 8 mm
∆x = 16 mm
∆x = 24 mm
Fig. 3 Waveforms measured along the center line of the specimen width;
�x denotes the distance from the center. The peak of the scattered wave is
indicated by arrows.
Laser-Generation Based Imaging of Ultrasonic Wave Propagation on Welded Steel Plates and Its Application to Defect Detection 2071
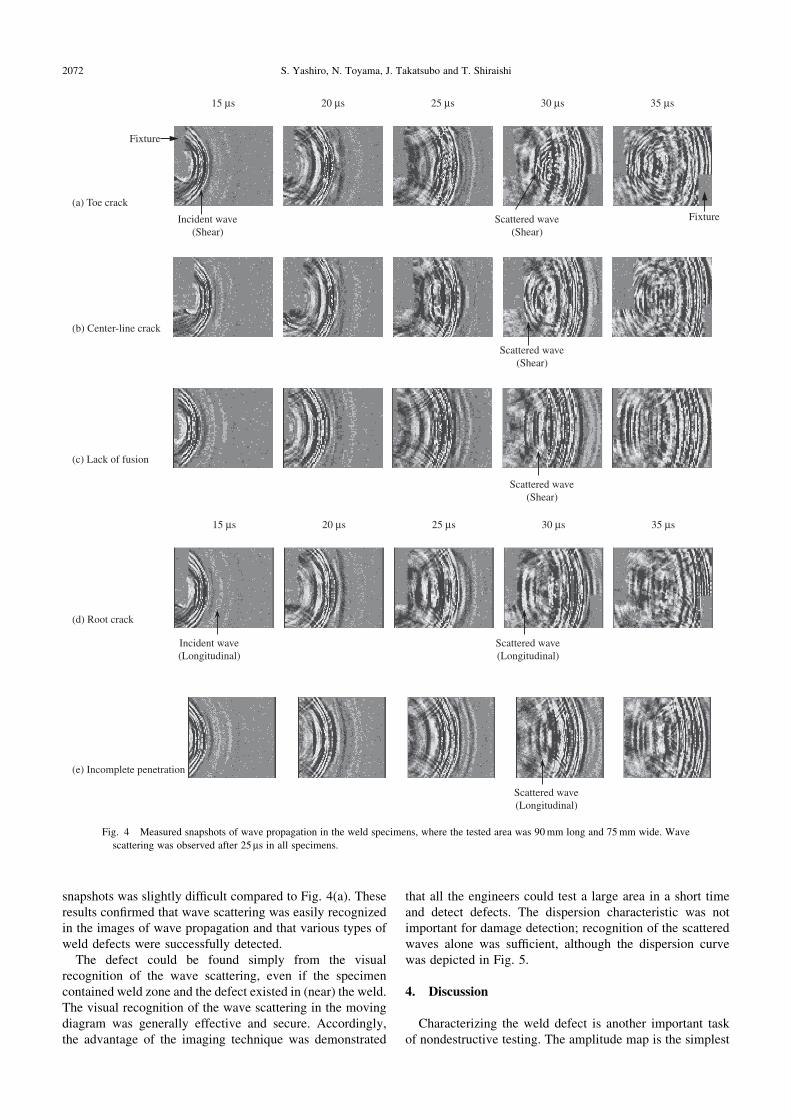
snapshots was slightly difficult compared to Fig. 4(a). Theseresults confirmed that wave scattering was easily recognizedin the images of wave propagation and that various types ofweld defects were successfully detected.
The defect could be found simply from the visualrecognition of the wave scattering, even if the specimencontained weld zone and the defect existed in (near) the weld.The visual recognition of the wave scattering in the movingdiagram was generally effective and secure. Accordingly,the advantage of the imaging technique was demonstrated
that all the engineers could test a large area in a short timeand detect defects. The dispersion characteristic was notimportant for damage detection; recognition of the scatteredwaves alone was sufficient, although the dispersion curvewas depicted in Fig. 5.
4. Discussion
Characterizing the weld defect is another important taskof nondestructive testing. The amplitude map is the simplest
(a) Toe crack
15 µs 20 µs 25 µs 30 µs 35 µs
Fixture
FixtureIncident wave(Shear)
Scattered wave(Shear)
(b) Center-line crack
Scattered wave(Shear)
(c) Lack of fusion
Scattered wave(Shear)
15 µs 20 µs 25 µs 30 µs 35 µs
(e) Incomplete penetration
(d) Root crack
Incident wave(Longitudinal)
Scattered wave(Longitudinal)
Scattered wave(Longitudinal)
Fig. 4 Measured snapshots of wave propagation in the weld specimens, where the tested area was 90mm long and 75mm wide. Wave
scattering was observed after 25ms in all specimens.
2072 S. Yashiro, N. Toyama, J. Takatsubo and T. Shiraishi

way to indicate defect position. Figure 6 presents a contourmap of the maximum amplitude of the moving diagram in theroot crack specimen depicted in Fig. 4(d). The lines withsmaller amplitude along the y-direction appeared at thecenter in the longitudinal direction. This smaller amplituderesulted from the irregularities on the surface, and these linescorresponded to the weld zone. Moreover, larger amplitudein the welding was found; this peak indicated interferencebetween the incident wave and the scattered wave. This resultdemonstrated that the source of the scattered wave (i.e., thelocation of the defect) was approximately indicated by themaximum amplitude map.
In order to quantitatively evaluate the defect, a B-scopeimage was created along the center line (Fig. 7(a)) of theroot crack specimen, as depicted in Fig. 7(b). The horizontaland vertical axes corresponded to the position x and the timet in this image, and the amplitude was represented by thecontrast. The wave velocity was then obtained by the slopeof the contrast. An incident longitudinal wave with smalleramplitude and a shear wave with greater amplitude are
depicted in Fig. 7(b). The slope of the incident shear wavewas disturbed in the center of the scanned area correspond-ing to the weld zone with irregularities, and some reflectedwaves with the opposite slope were observed in the weldzone. In order to identify the reflection point, the incidentwaves were removed by using a filtering method. Theincident waves and reflected waves were divided clearly inthe frequency-wavenumber domain by the three-dimensionalFourier transform of the moving diagram (collected signalsat all the grid points). Then, only the reflected wave could beextracted by the three-dimensional inverse Fourier transformof the data without the incident component, which wasfiltered in the frequency-wavenumber domain.21) The prop-agation of the reflected waves is depicted in Fig. 8, andthe B-scope image without the incident waves was thenobtained (Fig. 7(c)). The generation of the reflected wavewith greater amplitude was found inside the weld zone aswell as the smaller reflection at the ends of the welding.We could determine that the reflection source (i.e., defect)existed at 39mm from the left end of the tested area, which
0 0.5 1.0 1.50
1
2
3
4
5
6G
roup
vel
ocity
v/k
m·s
-1
Frequency, f /MHz
S0
A0
S1 S
2
S3
S4
S5
S6
A1
A2
A3
A4 A
5A
6
Fig. 5 Calculated dispersion curve for the steel plate.
WeldingFixture
Fixture
Fig. 6 Contour plot of the maximum amplitude for the specimen with a
root crack.
x/mm
Time, t/µs
(b) Without filtering
(c) With filtering
39 mm
Figs. 7b, c
Fig. 915 mm
90 mm
0 900
50
x
(a) Snapshot (30 µs)
Welding
Incident wave (longitudinal)
Incident wave(shear)
Scattered wave(longitudinal)
Scattered wave(longitudinal)
Reflectionfrom welding
Reflectionfrom welding
23.6 µs
Fig. 7 B-scope image along the center line for the root crack. The scattered
wave was generated in the weld zone.
Laser-Generation Based Imaging of Ultrasonic Wave Propagation on Welded Steel Plates and Its Application to Defect Detection 2073
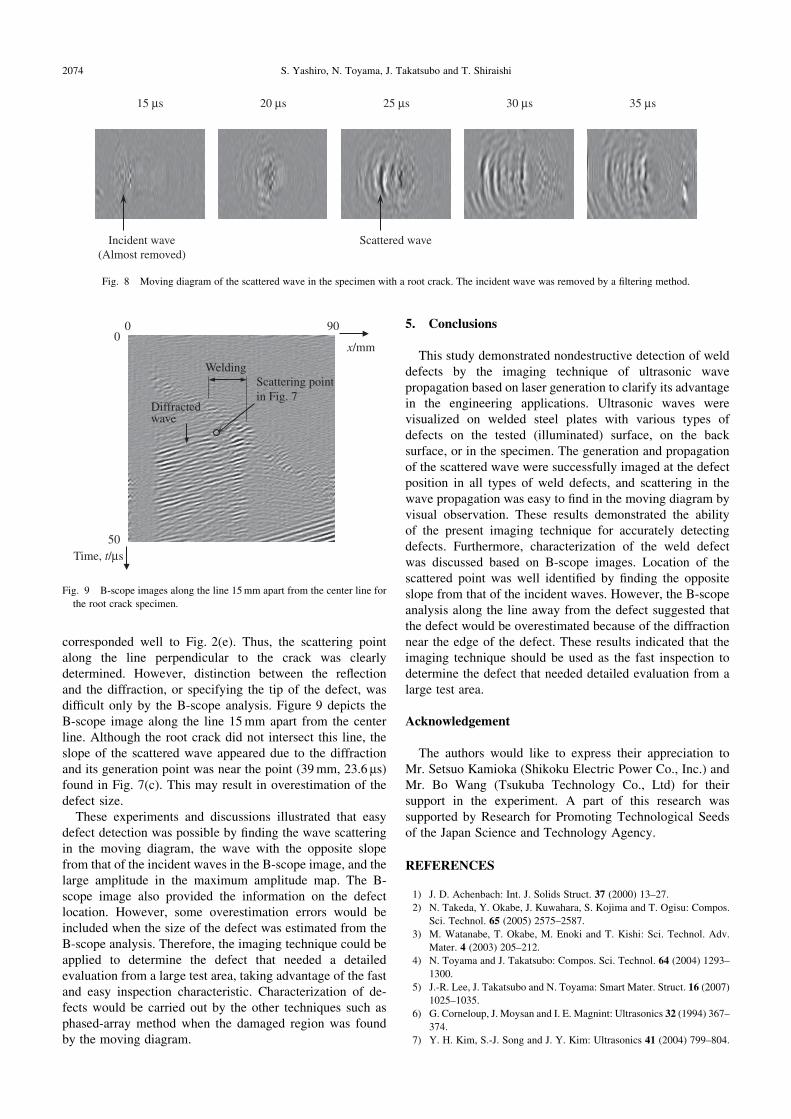
corresponded well to Fig. 2(e). Thus, the scattering pointalong the line perpendicular to the crack was clearlydetermined. However, distinction between the reflectionand the diffraction, or specifying the tip of the defect, wasdifficult only by the B-scope analysis. Figure 9 depicts theB-scope image along the line 15mm apart from the centerline. Although the root crack did not intersect this line, theslope of the scattered wave appeared due to the diffractionand its generation point was near the point (39mm, 23.6 ms)found in Fig. 7(c). This may result in overestimation of thedefect size.
These experiments and discussions illustrated that easydefect detection was possible by finding the wave scatteringin the moving diagram, the wave with the opposite slopefrom that of the incident waves in the B-scope image, and thelarge amplitude in the maximum amplitude map. The B-scope image also provided the information on the defectlocation. However, some overestimation errors would beincluded when the size of the defect was estimated from theB-scope analysis. Therefore, the imaging technique could beapplied to determine the defect that needed a detailedevaluation from a large test area, taking advantage of the fastand easy inspection characteristic. Characterization of de-fects would be carried out by the other techniques such asphased-array method when the damaged region was foundby the moving diagram.
5. Conclusions
This study demonstrated nondestructive detection of welddefects by the imaging technique of ultrasonic wavepropagation based on laser generation to clarify its advantagein the engineering applications. Ultrasonic waves werevisualized on welded steel plates with various types ofdefects on the tested (illuminated) surface, on the backsurface, or in the specimen. The generation and propagationof the scattered wave were successfully imaged at the defectposition in all types of weld defects, and scattering in thewave propagation was easy to find in the moving diagram byvisual observation. These results demonstrated the abilityof the present imaging technique for accurately detectingdefects. Furthermore, characterization of the weld defectwas discussed based on B-scope images. Location of thescattered point was well identified by finding the oppositeslope from that of the incident waves. However, the B-scopeanalysis along the line away from the defect suggested thatthe defect would be overestimated because of the diffractionnear the edge of the defect. These results indicated that theimaging technique should be used as the fast inspection todetermine the defect that needed detailed evaluation from alarge test area.
Acknowledgement
The authors would like to express their appreciation toMr. Setsuo Kamioka (Shikoku Electric Power Co., Inc.) andMr. Bo Wang (Tsukuba Technology Co., Ltd) for theirsupport in the experiment. A part of this research wassupported by Research for Promoting Technological Seedsof the Japan Science and Technology Agency.
REFERENCES
1) J. D. Achenbach: Int. J. Solids Struct. 37 (2000) 13–27.
2) N. Takeda, Y. Okabe, J. Kuwahara, S. Kojima and T. Ogisu: Compos.
Sci. Technol. 65 (2005) 2575–2587.
3) M. Watanabe, T. Okabe, M. Enoki and T. Kishi: Sci. Technol. Adv.
Mater. 4 (2003) 205–212.
4) N. Toyama and J. Takatsubo: Compos. Sci. Technol. 64 (2004) 1293–
1300.
5) J.-R. Lee, J. Takatsubo and N. Toyama: Smart Mater. Struct. 16 (2007)
1025–1035.
6) G. Corneloup, J. Moysan and I. E. Magnint: Ultrasonics 32 (1994) 367–
374.
7) Y. H. Kim, S.-J. Song and J. Y. Kim: Ultrasonics 41 (2004) 799–804.
15 µs 20 µs 25 µs 30 µs 35 µs
Incident wave(Almost removed)
Scattered wave
Fig. 8 Moving diagram of the scattered wave in the specimen with a root crack. The incident wave was removed by a filtering method.
Welding
Diffractedwave
Scattering point in Fig. 7
x/mm
Time, t/µs
0 900
50
Fig. 9 B-scope images along the line 15mm apart from the center line for
the root crack specimen.
2074 S. Yashiro, N. Toyama, J. Takatsubo and T. Shiraishi

8) B. W. Drinkwater and P. D. Wilcox: NDT&E Int. 39 (2006) 525–541.
9) G. Baskarana, K. Balasubramaniam and C. L. Rao: NDT&E Int. 39
(2006) 458–467.
10) I. Komura, T. Hirasawa, S. Nagai, J. Takabayashi and K. Naruse: Nucl.
Eng. Des. 206 (2001) 351–362.
11) K. G. Hall: Ultrasonics 20 (1982) 159–167.
12) H. U. Li and K. Negishi: Ultrasonics 32 (1994) 243–248.
13) R. D. Huber, R. B. Mignogna, K. E. Simmonds, R. S. Schechter and
P. P. Delsanto: Ultrasonics 35 (1997) 7–16.
14) W. J. Staszewski, B. C. Lee and R. Traynor: Meas. Sci. Technol. 18
(2007) 727–739.
15) S. Yashiro, J. Takatsubo and N. Toyama: Compos. Sci. Technol. 67
(2007) 3202–3208.
16) S. Yashiro, J. Takatsubo, H. Miyauchi and N. Toyama: NDT&E Int. 41
(2008) 137–144.
17) J. Takatsubo, M. Imade, Q. Fan and S. Yamamoto: Trans. Japan Soc.
Mech. Eng. C 65 (1999) 4299–4304.
18) J. A. Scales and A. E. Malcolm: Phys. Rev. E 67 (2003) 046618.
19) A. Moreau, D. Levesque, M. Lord, M. Dubois, J.-P. Monchalin, C.
Padioleau and J. F. Bussiere: Ultrasonics 40 (2002) 1047–1056.
20) M. Dubois, K. C. Burr and T. E. Drake: Appl. Opt. 43 (2004) 4399–
4407.
21) M. Ruzzene: Smart Mater. Struct. 16 (2007) 2116–2129.
Laser-Generation Based Imaging of Ultrasonic Wave Propagation on Welded Steel Plates and Its Application to Defect Detection 2075