las vegas - unlv€¦ · las vegas me 100 georg f. mauer ph.d. ... conclusion chapter 4 plan for...
TRANSCRIPT

1
University of Nevada Las Vegas
ME 100Georg F. Mauer Ph.D.
Mechanical and Aerospace ENGINEERING –
Chapter 4 – Engineering Solutions (Problem Solving)
Chapter 4Engineering Solutions
Sections 4.1 through 4.4 Read!
Chapter 4Engineering Solutions
4.4 and 4.5 Problem Presentation
Chapter 4Engineering Solutions
•Analysis (Math)and
•Text (English Language)
Organize your work as follows (see book):
Problem StatementTheory and Assumptions
SolutionVerification

2
Tools:
Pencil and PaperSee Fig. 4.1 in Book
or useAnalysis Software,
e.g. Mathcad
Tools:Word Processor
See Fig. 4.3a and b in BookBenefits:
Neater appearanceImport graphics
Import results from other tools, such as spread sheets
Source: Eide, Fig. 4.3b (earlier Version)
Analysis Software :Advantages: •Always clean and organized•Numerics will be correct (assuming you entered correct equations)•Automated graphing and presentation tools•Superior error and plausibility checking
Analysis Software :
Using Math software (e.g. Mathcad, Mathematica) gives you:•Faster Analysis•What if simulation capability(as in: what if we tweak this parameter?)
Examples of Analysis Software:
•Mathematica (symbolic)•Maple (symbolic)•Mathcad (general and symbolic)•Matlab (numerical)•Numerous specialty products

3
Dipole (physics)analysis example
Mathematica
Mathematica
Mathematica
Mathcad Calculus Example
y x( ) x3
1 x2+ x3+sin 3 x⋅( )
Maple Differentiation
xy x( )d
d3 x2
1 x2+ x3+( )sin 3 x⋅( )
⎡⎢⎣
⎤⎥⎦
12
⋅ 12
x3
1 x2+ x3+( )sin 3 x⋅( )
⎡⎢⎣
⎤⎥⎦
32
⋅ a⋅−
with
a 2 x⋅ 3 x2⋅+( )sin 3 x⋅( )
3 1 x2+ x3+( )sin 3 x⋅( )2
⋅ cos 3 x⋅( )⋅−⎡⎢⎢⎣
⎤⎥⎥⎦
SymbolicsExample(Mathcad)
Examples in Mathcad: compute motionof sliding block.
Motion of sliding block.

4
Dynamic system analysis exampleDynamic system analysis example
Mathcad can find the solution by symbolicEquation solving:
Dynamic system analysis example
What is in it for me?
Yes, you will have to get used to the constraints imposed by the
software. This will pass. All learning is an investment
for your future.
What is in it for me?
Benefits:Faster
More EfficientMore accurate.
Better presentationTime is money.
What is in it for me?
Tools such as Mathcad allow you to create:
•Better presentations•Accurate results.•Better design choices (playwhat if? scenarios)

5
Part BTechnical Communication
Written and Oral
Vocabulary:Check your Thesaurus
(From greek: treasure chest)
What’s the difference between
principal principle?
What’s the difference between
principal principle?
principalis(adj., lat.) :main, underlying.
principium (Noun, lat. ):A basic generalization that is accepted as true
Principium cont’dThe word stem appears in several English words, e.g.
‘Prince’from (Princeps, lat.) :Literally: first to capture the spoils (spolia)
What’s the difference between
affect effect?
afficere(verb, lat.) :To touch.‘Water restrictions affect everyone in the LV valley’
effectus(Noun, lat. ):Result
‘We observed the effect of high temperatures on the material’
What’s the difference?

6
As an engineer, you want to be clear, brief, and factual in your communications…
Yet, even with correct grammar and spelling, you still can distort language in various ways:
Meanwhile in Europe, the Enlightenment was a reasonable time. Voltare invented electricity, andgravity was invented by Isaac Walton. It is chiefly noticeable in Autumn, when the apples are falling offthe trees.
Quotes from College Freshman essays collected by Richard Lederer:
“The Renaissance was an age in which more individuals felt the value of their human being. Martin Luther was nailed to the church door at Wittenberg for selling papal indulgences. He died a horrible death, being excommunicated by a bull. It was the painter Donatello's interest in the fema1e nude that made him the father of the Renaissance.”
Quotes from College Freshman essays collected by Richard Lederer: Quotes from College Freshman essays
collected by Richard Lederer:
“It was an age of great inventions and discoveries. Gutenberg invented the Bible. Sir Walter Raleigh is a historical figure because he invented cigarettes. Another important invention was the circulation of blood. Sir Francis Drake circumcised the world with a 100-foot clipper.”
Richard Lederer cont’d:
Beethoven wrote music even though he was deaf. He was so deaf that he wrote loud music. He took long walks in the forest even when everyone was calling for him. Beethoven expired in 1827 and later died for this.
Richard Lederer cont’d:
Cyrus McCormick invented the McCormick raper, which did the work of a hundred men. Samuel Morse invented a code of telepathy, and Charles Darwin was a naturalist who wrote the Organ of the Species. Karl Marx became one of the Marx brothers.

7
Richard Lederer cont’d:
The First World War, caused by the assignation of the Arch Duck by a surf, ushered in a new error in the anals of human history.
Obfuscation
• Doublespeak: language that hides, evades or misleads.
• What about– "negative cash flow," – "deficit enhancement," – "negative contributions to profits," – or “alternative career enhancement?”
What’s the purpose of this speech?Quoted from Dave Barry.
REPORTER: Senator, are you for oragainst the MX missile system?SENATOR: Bob, the MX missile system reminds me of an old saying that the country folk in my state like to say. It goes like this: "You can carry a pig for six miles, but if you set it down it might run away."
Dave Barry cont’d:I have no idea why the country folk saythis. Maybe there's some kind of chemicalpollutant in their drinking water. That iswhy I pledge to do all that I can to protectthe environment of this great nation ofours, and put prayer back in the schools,where it belongs. What we need is jobs,not empty promises.
I realize I'm risking my political career be being so outspoken on a sensitive issue such as the MX, but that's just the kind of straight-talking honest person I am, and I can't help it.
Dave Barry cont’d: Dave Barry: A 200 word essay on:
THE INTENT OFTHE MONROE DOCTRINE
"The Monroe Doctrine is, without a doubt, one of the most important and famous historical doctrines ever to be set forth in doctrine form. And yet, by the same token, we must ask ourselves: Why? What is the quality that sets this particular doctrine -the Monroe Doctrine- apart from all the others?

8
There can be no question that the answer to this question is: The intent. For when we truly understand the intent of a doctrine such as the Monroe Doctrine, or for that matter any other doctrine, only then can we truly know exactly what that doctrine was intended to accomplish as far as doctrinal intention is concerned. This has been an issue of great significance to historians and human beings alike throughout the distinguished history of this great country..
Dave Barry ‘Monroe Doctrine’ cont’d:
.. a country that we call, simply, 'the United States of America,' a country that has produced more than its share of famous doctrines and great heroes and, yes, educators of the caliber of Mr. Fossum, doing such a superb job of preparing the young people of tomorrow for the day when we, as a society and yet by the same token also as a nation, finally reach 200 words."
Dave Barry ‘Monroe Doctrine’ cont’d:
Franz Kafka(1883-1924)
We conclude this section with a fine example of 20th
Century Literature:
If some frail tubercular lady circus rider were to be driven in circles around and around the arena for months and months without interruption in front of a tireless public on a swaying horse by a merciless whip-wielding master of ceremonies, spinning on the horse, throwing kisses and swaying at the waist,and if this performance, amid the incessant roar of the orchestra and the ventilators, were to continue into the ever-expanding, gray future, accompanied by applause, which died down and then swelled up again, from hands which were really steam hammers, perhaps then a young visitor to the gallery might rush down the long stair case through all the levels, burst into the ring, and cry “Stop!” through the fanfares of the constantly adjusting orchestra.
Franz Kafka: Up in the Gallery
But since this is not so— since a beautiful woman, in white and red, flies in through curtains which proud men in livery open in front of her, since the director, devotedly seeking her eyes, breathes in her direction, behaving like an animal, and, as a precaution, lifts her up on the dapple-gray horse, as if she were his grand daughter, the one he loved more than anything else, as she starts a dangerous journey, but he cannot decide to give the signal with his whip and finally, controlling himself, gives it a crack, runs right beside the horse with his mouth open, follows the rider’s leaps with a sharp gaze, hardly capable of comprehending her skill, …
.. tries to warn her by calling out in English, furiously castigating the grooms holding hoops, telling them to pay the most scrupulous attention, and begs the orchestra, with upraised arms, to be quiet before the great jump, finally lifts the small woman down from the trembling horse, kisses her on both cheeks, considers no public tribute adequate, while she herself, leaning on him, high on the tips of her toes, with dust swirling around her, arms outstretched and head thrown back, wants to share her luck with the entire circus—since this is so, the visitor to the gallery puts his face on the railing and, sinking into the final march as if into a difficult dream, weeps, without realizing it.

9
Finis(noun, Lat.)
‘The end’
Conclusion Chapter 4
Plan for the long term.Become familiar with those tools that will make you the
most productive.Your investment will pay off
handsomely.
Chapter 5Representation
ofTechnical Information
A Typical Scenario
We collected data in an experiment.
•The data set might consist of a list, such as the one on page 143 in your book, or a computer data file.•We plot the data.
A Problem: Noisy Data (Noise often results from poor quality measurements, or from interference (just try AM radio) How good is this control?
10
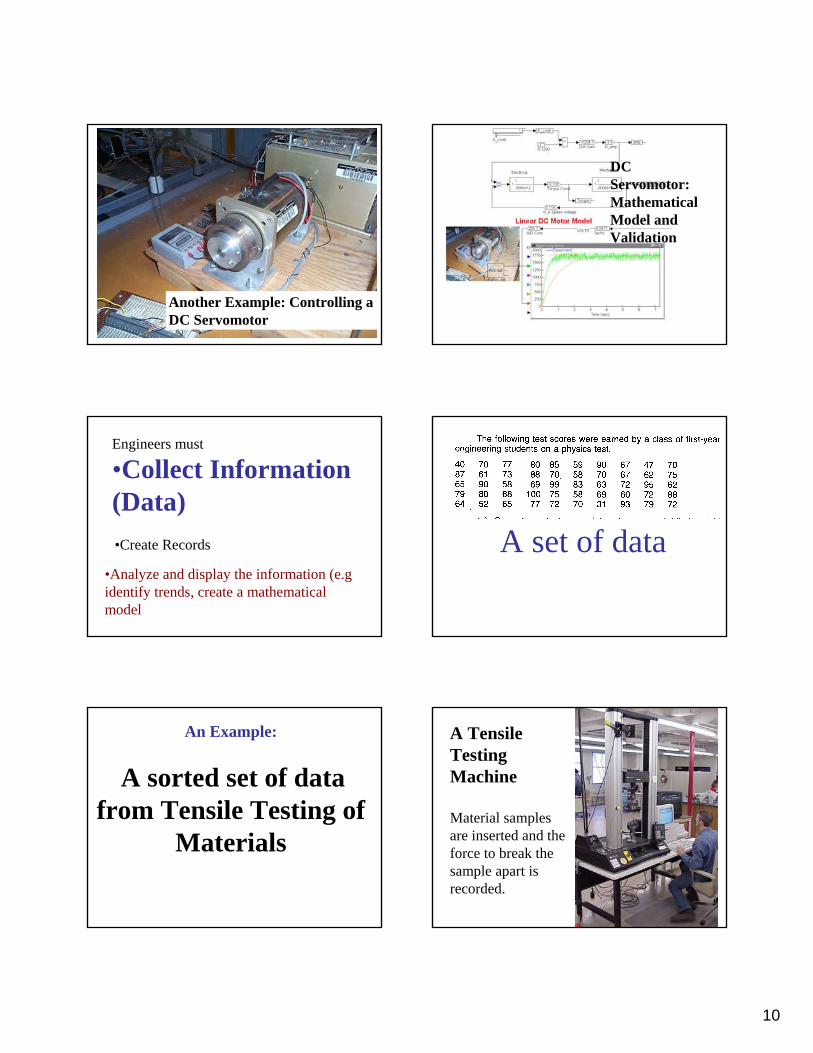
Another Example: Controlling a DC Servomotor
DC Servomotor:Mathematical Model and Validation
Engineers must
•Collect Information (Data)
•Analyze and display the information (e.g identify trends, create a mathematical model
•Create Records A set of data
An Example:
A sorted set of data from Tensile Testing of
Materials
A Tensile Testing Machine
Material samples are inserted and the force to break the sample apart is recorded.
11
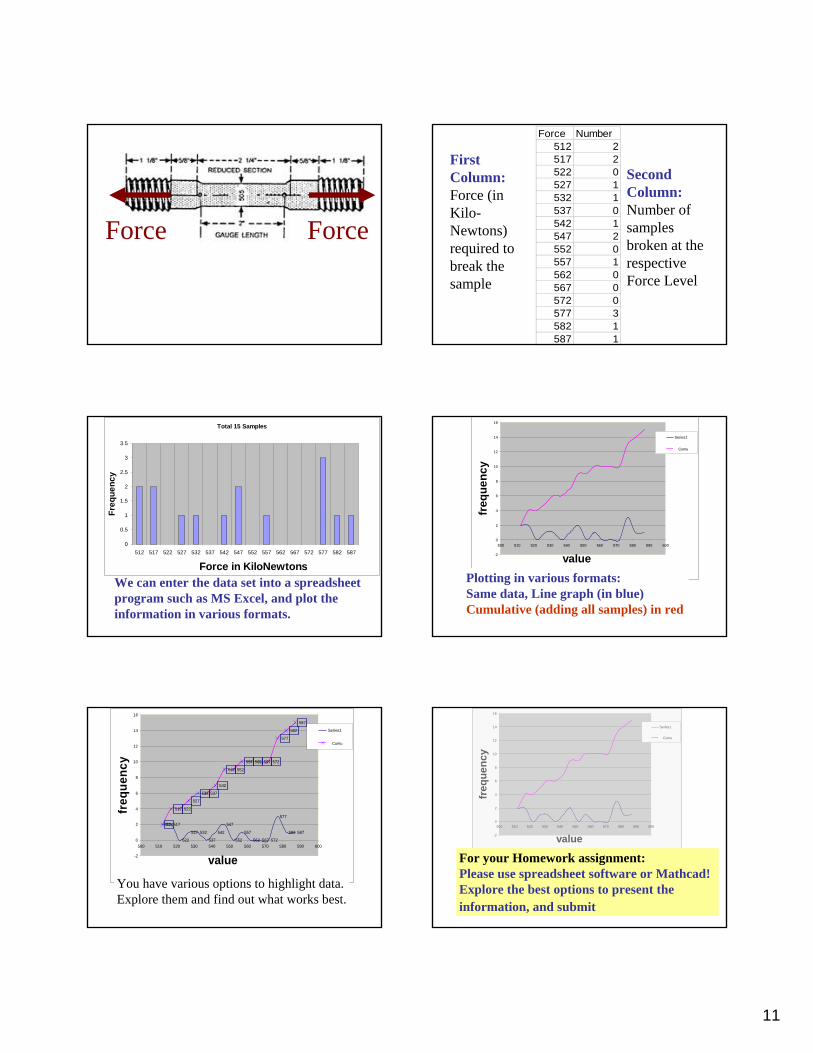
Force Force
Force Number512 2517 2522 0527 1532 1537 0542 1547 2552 0557 1562 0567 0572 0577 3582 1587 1
First Column:Force (in Kilo-Newtons) required to break the sample
Second Column:Number of samples broken at the respective Force Level
Total 15 Samples
0
0.5
1
1.5
2
2.5
3
3.5
512 517 522 527 532 537 542 547 552 557 562 567 572 577 582 587
Force in KiloNewtons
Freq
uenc
y
We can enter the data set into a spreadsheet program such as MS Excel, and plot the information in various formats.
-2
0
2
4
6
8
10
12
14
16
500 510 520 530 540 550 560 570 580 590 600
value
freq
uenc
y
Series1
Series2Cumu
Plotting in various formats:Same data, Line graph (in blue)Cumulative (adding all samples) in red
512 517
522
527 532
537
542
547
552
557
562 567 572
577
582 587
512
517 522
527
532 537
542
547 552
557 562 567 572
577
582
587
-2
0
2
4
6
8
10
12
14
16
500 510 520 530 540 550 560 570 580 590 600
value
freq
uenc
y
Series1
Series2Cumu
You have various options to highlight data.Explore them and find out what works best.
-2
0
2
4
6
8
10
12
14
16
500 510 520 530 540 550 560 570 580 590 600
value
freq
uenc
y
Series1
Series2Cumu
For your Homework assignment:Please use spreadsheet software or Mathcad!Explore the best options to present the information, and submit

12
f
00123456789
101112131415
1563
26367997
131143138120
74724013
=
Mathcad Example:
A Gaussian (Normal) Distribution.
The numbers are shown at right. Plotting the Gaussian (Normal)
Distribution. (Histogram)
8 6 4 2 0 2 4 6 80
50
100
150
Histogram
143
0
f
μ 4 σ⋅+μ 4 σ⋅− int
Compute the Normal Distribution.(Blue Line)
8 6 4 2 0 2 4 6 80
50
100
150
HistogramNormal fit
142
0.163
f
F int( )→⎯⎯
μ 4 σ⋅+μ 4 σ⋅− int
f hist int N,( ):=
Mathcad Commands:
Histogram:
Gaussian FittingFunction:
F x( ) n h⋅ dnorm x μ, σ,( )⋅:=
For help in Mathcad, see Quick sheets Statistics
Example: Statistics of Gambling
Who wins?
The player or the casino?
Example: Statistics of Gambling
We can believe the warm and fuzzy testimonials:“Bob”: “I won $134,567 at xyz Palace”

13
Example: Statistics of Gambling
Or we can do the cold math.An example follows on the next series of slides. We’ll discuss the math concepts afterwards.
Source: www-ec.njit.edu/~grow/ roulette/sld001.htm
Q: What kind of distribution will result?

14
Mean μ:AverageValue:
∑==N
ixN
Mean 1μ
Standard Dev σ:67% of events are within μ+/-σ

15
The preceding analysis did not consider the fact that the casino limits the player’s capital.All casino tables carry a signe.g. “minimum bet $5
maximum bet $500”
Without the sign, a player could recover from losing streaks by doubling each losing bet, to lose only the predicted 5%.
The sign prevents the player from recovery at the point of maximum profit to the casino.The average table game winnings at Nevada casinos are 15% of wagered amounts.
MEG100Georg F. Mauer Ph.D.
Mechanical and Aerospace ENGINEERING –
Chapter 5 – Technical Information
Chapter 5.2 Collecting Data•Manual (slow, inefficient, error-prone. don’t waste your time! Sometimes, of course, manual recording of data is expedient)•Computer assisted (typically faster and more accurate) You can also buy special recorders (data loggers) that record very large quantities at very high rates.

16
Example:During Nuclear testing at the Nevada Test Site, all data must be collected within about 100 nanoseconds after triggering.The instrumentation is destroyed by the explosion
Plotting Experimental Data:A set of x/y data
x12
3
45
6
7
8
9
10
= y x( )9.87111.09
15.714
17.36421.608
22.117
27.808
28.495
31.351
34.355
=
Plotting Experimental Data:Basics
•Present the information clearly and concisely!•Each graph should speak for itself: Label the axes!
Descriptive Title!
Eide,Page 106Fig. 5.9 Scaling the Axes
Eide,Page 106 Fig. 5.10
Please Read and apply!
Axes Graduations
Eide,Page 107Fig. 5.12

17
Eide,Page 107 Fig. 5.13 Proper Representation of Data
You choose.
Plotting Experimental Data:Graphing the data (scatter points)
1 2 3 4 5 6 7 8 9 105
10
15
20
25
30
35
40
Y
X
1 2 3 4 5 6 7 8 9 1010
15
20
25
30
35
40
4540.536
14.305
Y
101 X
Plotting Experimental Data:Graphing the data (data points connected by lines)
1 2 3 4 5 6 7 8 9 1010
15
20
25
30
35
40
4540.536
14.305
Y
101 X
We can use Bar Graphs
..Or steps
1 2 3 4 5 6 7 8 9 1010
15
20
25
30
35
40
4540.536
14.305
Y
101 X
Linear Interpolation:Best fit line
1 2 3 4 5 6 7 8 9 1010
15
20
25
30
35
40
4540.536
14.305
Y
μ x⋅ β+
101 X x,

18
Eide,Page 111Fig. 5.21
MultipleData Sets
Eide,Page 113Fig. 5.23
Spreadsheet Rules
Logarithms
1797 Britannica 1797 Britannica
1797 Britannica
LogarithmsExpress as exponents of 10
102100 =10110 =100.3012 =
100.6995 =
LogarithmsReduce multiplication to an addition (“Slide rule”)
100.301+0.6992*5 =
= 101
Plotting Experimental Data:A Quadratic Function (free fall)The falling distance is proportional totime2
t 1 2, 10..:=
falldrop t( )12
g⋅ t2⋅:=

19
0 2 4 6 8 100
100
200
300
400
500
Time in Seconds
Dro
p in
Ele
vatio
n (m
eter
s)
490.5
0.049
falldrop t( )
100.1 t
Free Fall: Elev. vs. Time
0.1 1 100.01
0.1
1
10
100
1 .103
Time in Seconds
Dro
p in
Ele
vatio
n
490.5
0.049
falldrop t( )
100.1 t
Free Fall: Elev. vs. TimeSame data, in log-log format
0.1 1 100.01
0.1
1
10
100
1 .103
Time in Seconds
Dro
p in
Ele
vatio
n (m
eter
s)
490.5
0.049
falldrop t( )
100.1 t0.1 1 10
0.01
0.1
1
10
100
1 .103
Time in Seconds
Dro
p in
Ele
vatio
n (m
eter
s)
490.5
0.049
falldrop t( )
100.1 t
Log-Log plots: What is different?The axis labels are multiples of 10,Not increments by 10, as in linear graphs
Eide,Page 121

20
Log-Log plots: What is different?The axis labels are multiples of 10,In the linear graph, the data were evenly distributed.
0 2 4 6 8 100
100
200
300
400
500
Time in Seconds
Dro
p in
Ele
vatio
n (m
eter
s)
490.5
0.049
falldrop t( )
100.1 t 0.1 1 100.01
0.1
1
10
100
1 .103
Time in Seconds
Dro
p in
Ele
vatio
n (m
eter
s)
490.5
0.049
falldrop t( )
100.1 t
Log-Log plots: What is different?The axis labels are multiples of 10,In the logarithmic plot, the data seem to be clustered in the upper right corner.
Why?
d .1 .2, 10..:= f d( ) log d( ):=d
0.10.40.7
1
1.3
1.6
1.9
2.2
2.5
2.8
3.1
3.4
3 7
= f d( )-1
-0.398-0.155
0
0.114
0.204
0.279
0.342
0.398
0.447
0.491
0.531
0 568
=
0 2 4 6 8 101
0.5
0
0.5
11
1−
f d( )
100.1 d
The (decadic) logarithm of 0.1 = -1.Log(1)= 0; Log(10) =1 ……
We can use logarithmic plots to test a data set for polynomial relationships. Look at these three polynomials:
f1 x( ) 2 x1.5⋅:=
f2 x( ) 3 x3⋅:=
f4 x( ) 1.2 x3.5⋅:=
Now graph the three polynomials in log-log format:
f1 x( ) 2 x 1.5⋅:=
f2 x( ) 3 x 3⋅:=
f4 x( ) 1.2 x 3.5⋅:= 1 101
10
100
1 .103
1 .104
3.795 103×
1.2
f1 x( )
f2 x( )
f4 x( )
101

21
x1
1.41.82.22.6
33.43.84.24.6
55.45.86.26.6
7
= fp x( )20.08530.62473.48194.966
222.621269.297298.011514.174612.635833.211
1.231·10 3
1.532·10 3
1.625·10 3
2.186·10 3
2.226·10 3
2.821·10 3
=
Example:Testing the dataSet at right for Polynomial Properties.
We can use log-log graphing toidentify patterns.
Here is a linear plot of the data.
The values are somewhat scattered due to sensor noise.
0 2 4 6 8 100
1000
2000
3000
4000
5000
6000
7000
8000
fp x( )
x
1 1010
100
1 .103
1 .104
7.17 103×
15.401
fp x( )
9.81 x
Here is a log-log plot of the same data.
The values appear to follow a straight path.
1 101
10
100
1.103
1.1047.115103×
7
fpx( )
fp1x( )
9.81 x
A best fit line is found as:
fp1 x( ) 7 x3⋅:=