large scale rotary shear shredder performance testing · large scale rotary shear shredder...
TRANSCRIPT
LARGE SCALE ROTARY SHEAR SHREDDER
PERFORMANCE TESTING
DAVID B. SPENCER
Waste Energy Technology Corporation
Bedford, Massachusetts
JERRY W. TEMPLE Waste Energy Technology Corporation
Summerville, South Carolina
DENNIS M.FORSYTHE
Department of Biology
The Citadel
Charleston, South Carolina
ABSTRACT
Slow speed rotary shear shredders have recently received considerable attention for processing of municipal solid waste. Potential benefits from shear shredding could include reduced explosion potential, lower power consumption, lower operating and maintenance costs and less overgrinding of glass. Although there has been much interest in rotary shear shredders, little actual operating data exist showing the capacity and performance of these units on municipal solid waste at full scale.
A large scale, 50 TPH (45.3 tph) Iowa Manufacturing Company (Cedarapids) Model 5096 (127 cm X 244 cm) shear shredder was installed and has been evaluated over a 6-month period at the Charleston County Solid Waste Reduction Center. Two Heil 42F vertical shaft hammermills also are operated at the reduction center. Long term landfill tests were conducted on waste processed by both shredders to measure the performance of the shear shredder and to compare the effect of shredder type on landfilling characteristics. These results show capacity in excess of 60 TPH (54.4 tph) using 4 in. (10 cm) cutters and comparable landfilling characteristics for both types of shredders.
INTRODUCTION
Virtually all processes for the disposal, recovery or incineration of municipal solid waste are significantly improved by shredding. In RDF-type resource recovery systems, size reduction is essential for introduction into the boiler and homogenization of the fuel. Shredding is also important for liberation of materials for front-end separation processes, and for materials transfer and conveying.
In mass burning systems, shredding of oversized bulky waste (OBW) is desirable to improve materials handling and reduce the size of noncombustible materials and large combustible objects such as furniture, rugs, tires, logs, etc.
In landfill disposal operations shredding reduces transportation costs, reduces the need for costly cover materials, and increases the life of landfills by allowing higher compaction densities, less cover which consumes landfill volume, and reduced infestation by insects and rodents.
Almost every RDF-Facility uses a shredder at one stage or another. Shredding has traditionally been the first unit operation in most front-end separation systems designed to produce refuse derived fuel. While recently there have been some systems which have employed trommels as the first processing step, these systems usually include shredding as well.
Anticipated benefits of shredding prior to combustion of refuse include the following:
• Less Excess Air/Higher Efficiency • Reduced Size and Cost for Combustion/Boiler
Equipment • More Uniform Heat Release from Refuse • Lower Maintenance Cost for Combustion System • Simplified Ash Handling Equipment • Improved Materials Recovery Potential • Reduced Air EmiSSions/less Pollution Control
Equipment
619
• Greater Potential for Firing with Sludge, Coal and Other Supplementary Fuels
Many experts would agree that shredding is beneficial to almost all solid waste disposal and resource recovery operations. However, they would disagree over whether shredding is really worth the cost.

Limited testing performed to date indicates that substantial benefit can be realized by application of the rotary shear shredder to the solid waste industry.
BACKGROUND
The limitations associated with operation of conventional shredders are well known. Of these limitations, the greatest concern is the potential for explosions within the shredder cavity, discussed below. Another concern is with the high wear rates of the shredder components and the time involved in removing, rebuilding, and replacing hammers and grates. Further, difficulties with high speed shredding include high power consumption, high capital costs for the shredder, explosion suppression and isolation of the shredders. Finally, the excessively fine size of glass particles produced during shredding are imbedded in combustibles or "fly" in subsequent air classifying operations, contaminating the RDF and hindering efforts to produce a low-ash RDF.
The frequency of explosions in high speed shredders has been reduced to a formula by Factory Mutual Research. Significant explosions have been experienced at numerous waste processing facilities: Chemung County, New York; Monroe County, New York; Albany, New York; Syracuse, New York; Buffalo, New York; Wilmington, Delaware (both the prior shredding station and at the Delaware Reclamation Project); Milwaukee, Wisconsin; Columbus, Ohio; San Diego, California; Anchorage, Alaska; Lane County, Oregon; and North York, Ontario, just to name a few. Photographs of the damage from some of these incidents are provided in Fig. 1
•
CHARLESTON COUNTY, SOUTH CAROLINA
Coastal South Carolina has unique geological conditions which make shredding of solid waste attractive as compared to conventional methods of landfllling. Due to the high water table, vegetation, shallow excavation depth, and the high cost of landfill cover material available, direct land filling is very expensive. For these reasons, shredding can be quite attractive because intermediate cover is unnecessary and higher compaction densities can be achieved in the landfill.
After a comprehensive study, in 197 4 the County designed, financed and constructed a shredding atation. The facility was deSigned to house four shredders, only three of which were installed at the outset: Two were 20 TPH (18 tph) model 42-F Heil/Tollemache units; and one was a 40 TPH (36 tph) model 92-A (the first of the Hell 92 series sold in the U.S.). The waste is reduced to a nominal size of 6-in. to 8-in. (15 cm to 20 cm). Figure 2 provides
620
photographs of the Charleston Solid Waste Reduction Facility as it existed in mid-1981.
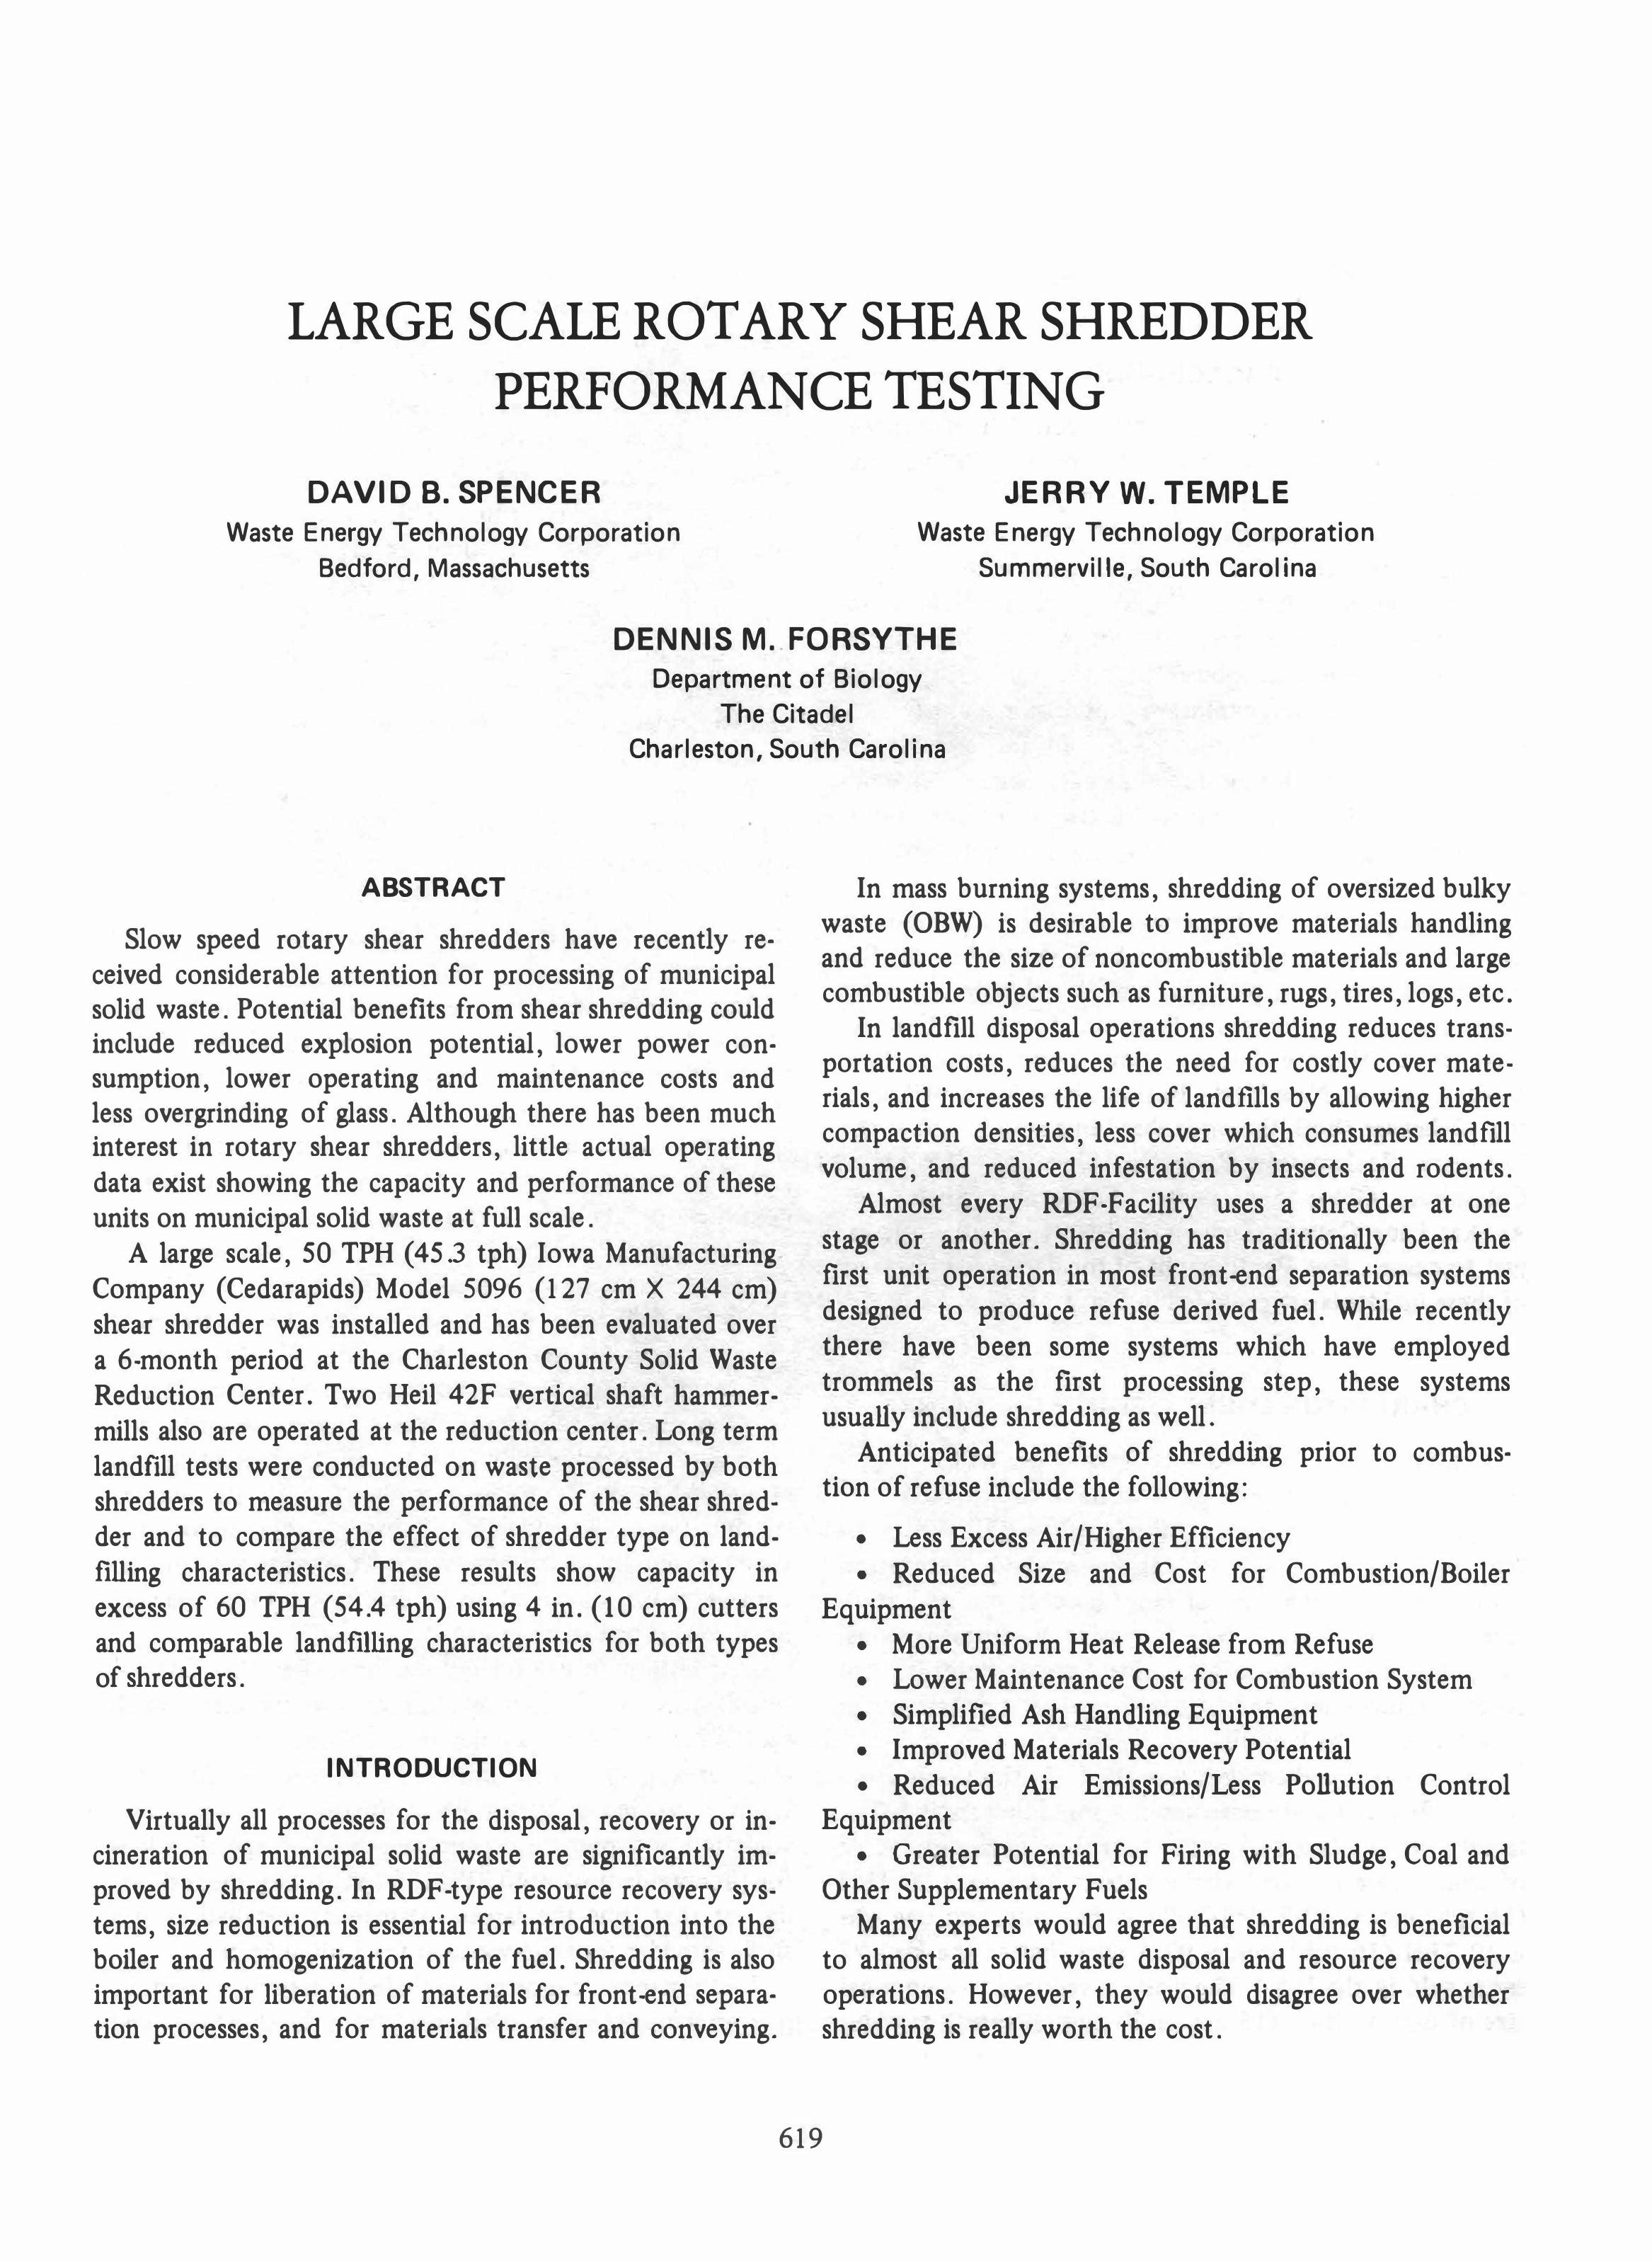
Since beginning operation, the facility has experienced two major explosions, one in 197 6 and one in 1981. The damage from the 1981 explosion was serious. The pressures were sufficient to lift six panels of the roof on the building and rip out six side walls of the building (Fig. 3a), rip the doors off the feed chutes of the shredder and throw them over 50 feet (15 m), and fracture the glass panes in the control room which was almost 200 feet (60 m) away from the shredder. The coupling on the shredder was damaged beyond repair, all the feed and discharge chutes were severely deformed (Fig. 3b), and unknown damage was done to the shredder bearings and seals. The conveyor covers were damaged beyond repair and the cyclone and conveyor supports were severely deformed (Fig. 3c).
Fortunately, in this explosion, only one employee was injured, with cuts on his arm. The consequences could have been much worse judging from the fact that the protective screen which covers the infeed opening of the shredder was ripped off and thrown to within inches of the operator.
The County was concerned about future insurability of the facility and the safety of its employees. More serious than the damage to equipment and buildings was the potential for injury to personnel. Although the County was not anxious to be a pioneer in the development of a new shredder, neither were they anxious to continue operations in the same manner as before.
Waste-Energy Technology Corp. was retained by the County to prepare the insurance claim after the 1981 explosion and later to design and manage the construction of safety improvements to the facility. With its own design team, assisted by the expert advice of Andrew Martin as its explosion consultant, Waste-Energy designed and fabricated explosion relief vents for the remaining two Model 42-F shredders in accordance with its detailed specifications. (Shredder No.2 has experienced an additional explosion since the vents were installed, and no damage or loss of operation occurred except that the vent hood canvas had to be replaced.)
In addition, Waste-Energy recommended that Charleston County consider installation of a rotary shear shredder. After visiting a similar, but smaller installation in Oklahoma City which utilized a Saturn shredder, the County decided to direct Waste-Energy to deSign an installation and prepare competitive bidding specifications for procurement of a 40 TPH (36 tph) rotary shear shredder, at that time the largest permanent installation of a shear shredder for solid waste in the United States.
Performance concerns included: capacity; particle size of the solid waste discharged from the shredders; and

•
(a) Milwaukee, Wisconsin
(b) Chemung County, New York
FIG.1 DAMAGE FROM SHREDDER EXPLOSIONS
621

•
•
(a) Tipping Floor
(b) Compactor Outload Area
FIG.2 CHARLESTON COUNTY SOLID WASTE REDUCTION CENTER [SWRC]
622
(bl Damage to Shredder I nfeed Chute
(al Building Damage
(el Damage to Conveyor Covers
FIG.3 1981 CHARLESTON COUNTY SWRC SHREDDER EXPLOSION
623

regulatory landfill standards regarding compaction density, odor, litter, and attraction to insects and rodents. WasteEnergy retained the services of Dr. Dennis M. Forsythe, Professor, Department of Biology at The Citadel who is an expert in conducting studies regarding the health and environmental effects of landfill operations.
Initial data collected from the Hell shredders by Dr. Forsythe when they were first installed in 1974 demon· strated Hell's ability to meet these regulatory standards. A comparison test therefore was devised to compare the performance of the Hell shredders to the Cedarapids shear shredder to determine its relative performance. If the Hell shredder was acceptable, and if the performance of the Hell and Cedarapids shredders were the same, then the Cedarapids shredder would be acceptable also.
DESCRIPTION OF THE SHEAR SHREDDER
Figure 4a is a photograph of the Cedarapids Model 5096 rotary shear shredder. Figure 4b is a photograph of the hydraulic power pack and electrical controls.
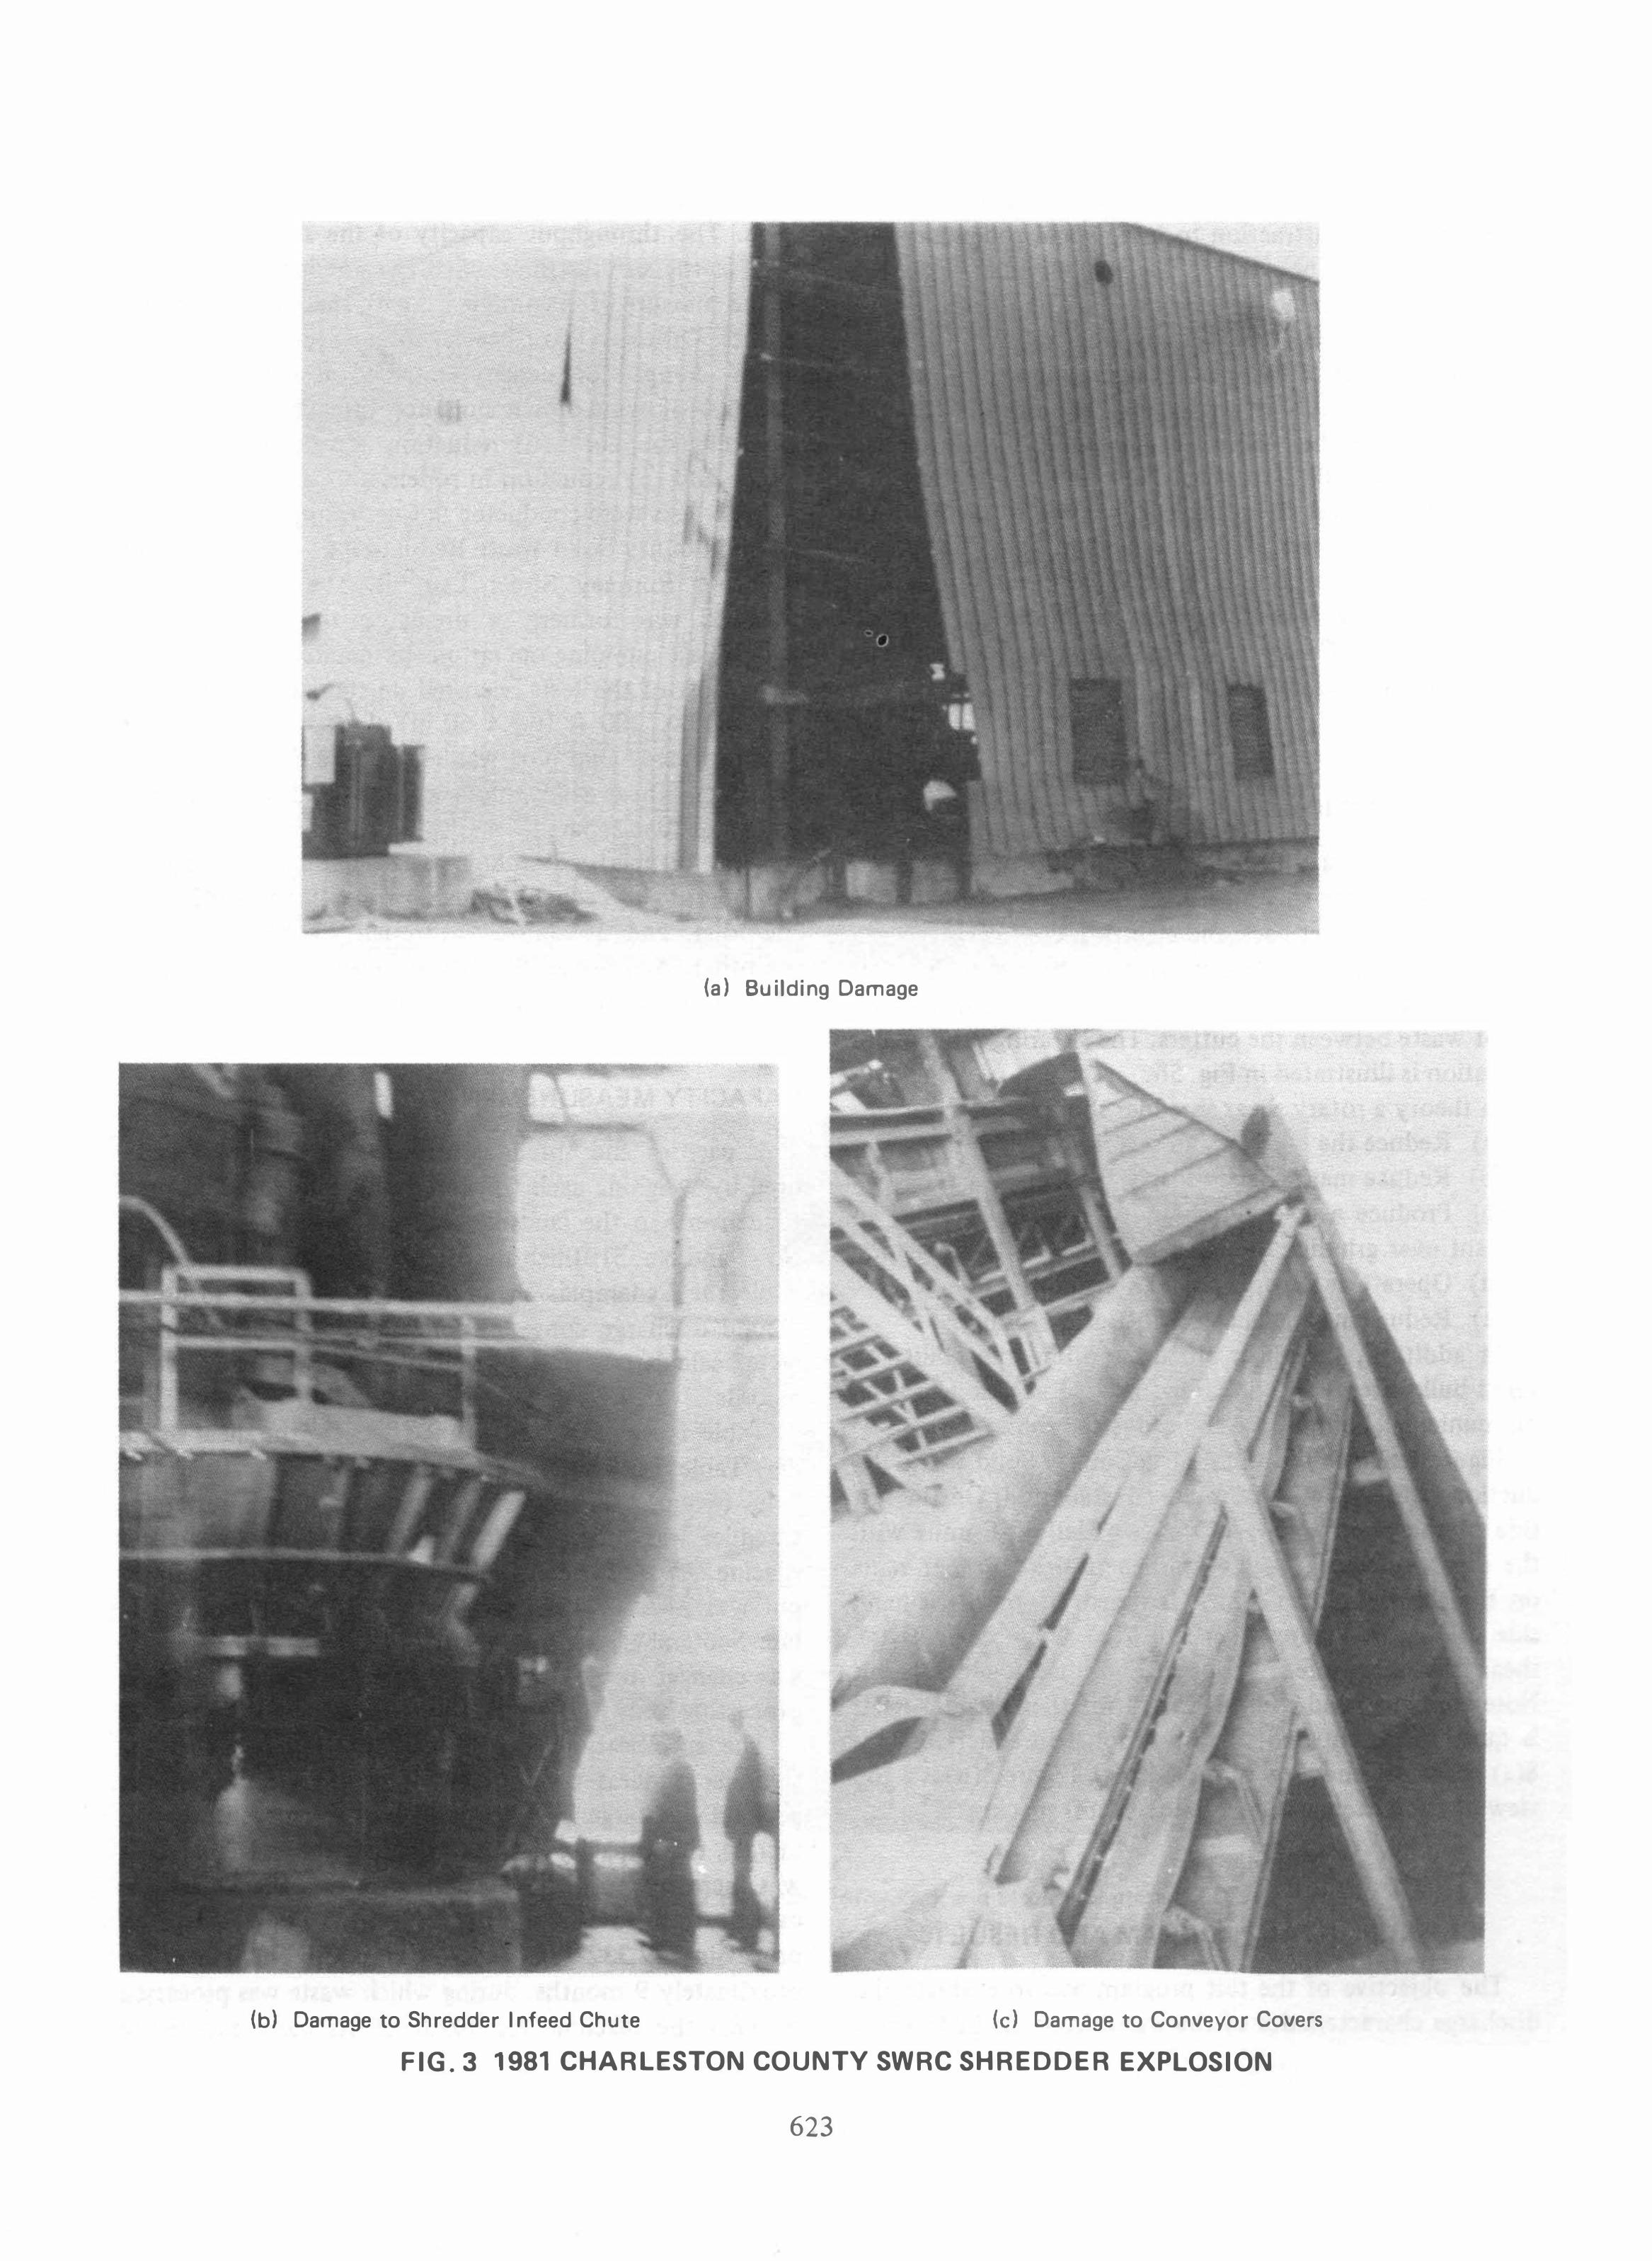
Figure Sa shows a close up view of the two inch cutter spacing and also the cleaning fingers which remove build· up of waste between the cutters. The shearing principal of operation is illustrated in Fig. 5b.
In theory a rotary shear shredder should: (a) Reduce the number and severity of explosions; (b) Reduce maintenance costs; (c) Produce a coarsely shredded product without at-
tendant over grinding of glass and other brittle inorganics; (d) Operate at lower installed horsepower; (e) Reduce installed capital cost of shredding. In addition, the shear shredder offers the ability to
shred bulky items and discarded tires in addition to typi· cal municipal, commercial and industrial solid waste.
Figure 6 shows the Charleston County Solid Waste Re· duction Center (SWRC) shredder installation. On the left side of the photograph are the two Hell 42·F units with the new explosion relief vents. There are no relief vents on the shear shredder which is shown on the right hand side of Fig. 6. Figures 7(a) and 7(b) show views of the shear shredder infeed hopper and discharge coneyor. Note that the head room required for the shredder itself is quite low compared to conventional shredders. Figure 8(a) shows an end view of the cutters. Figure 8(b) is a top view of the cutters with a two in. (5 cm) spacing.
EXPERIMENTAL PROGRAM AND RESULTS
The objective of the test program was to evaluate the discharge characteristics of the waste from the Cedarapids
shear shredder in comparison to the existing Hell shredders. The throughput capacity of the shear shredder as well as the size distribution of the shredder discharge was to be measured for compliance with specification requirements. Other areas of special interest included: (a) solid waste compaction density obtained at the landftll; (b) amount of wind·blown nuisance litter produced at the landfill; (c) odors; (d) reduction and destruction of insects; and (e) reduction in rodent and insect population.
The tests were conducted in Charleston, South Carolina at the County Solid Waste Reduction Center (SWRC) and adjacent Romney Street Landfill. The Romney Street Landfill was formerly a dredge materials disposal site whose last pumping operations terminated about 20 years ago. Most of the tests occurred on the landftll site where two 200 X 200 ft (60 X 60 m) plots of shredded waste were located. One plot was established for each type of shredder. These study plots were located approximately 400 ft (120 m) apart.
The comparison studies were conducted during the periods of 4 October through 15 December 1982 (2-1/2 months), and 10 January through 11 March 1983 (2 months). Additional capacity data were collected on the shear shredder from March through June 1983.
CAPACITY MEASUREMENTS
Capacities and shredder throughput rates were meas· ured by weighing each truckload of shredded waste prior to delivery to the landfill. The two Hell shredders (Mills No. 2 and No. 3) utilize one discharge conveyor/compactor while the Cedarapids shear shredder (Mill No. 1) uses a second discharge conveyor/compactor. Throughput rates were calculated from operations records and weigh records.
Table 1 provides performance data for the shear shred· der. Table l ·A shows the results of limited testing using 2 in. (5 cm) spacings between cutters. At the outset the shredder was supplied with 2 in. cutters and 2 in. cutter spacing. As can be seen from Table 1, the average through. put was 21.6 TPH (19.6 tph) during the 8-day period in late September, early October, before the cutter spacing was changed to 4 in. (10 cm). (These data are based on processing only 382 tons during 17 .7 operating hours.)
The specifications for the shredder required that the shredder process a minimum of 40 TPH and that the product discharge be nominal 4 in. (10 cm). In order to inerase the capacity of the machine, the cutter spacing was increased to 4 in. (10 cm). With this change average capacity rose to 58.5 TPH (53.1 tph). This was based on processing 49,332 tons (44,744 t) in Mill No. l over approximately 9 months, during which waste was processed through the machine for 842.6 hr. As more experience
624

,
,
rt • j t 01
(a) Cedarapids Model 5096 Rotary Shear Shredder
• 1 :
-
(b) Rotary Shear Shredder Hydraulic Power Pack and Electric Controls
FIGURE 4
625
(a) Closeup Photograph of Cutters and Cleaning Fingers in Rotary Shear Shredder
(b) I llustration of Shear Shredder Cutting Action
FIGURE 5
626
•

FIG.6 CHARLESTON COUNTY SHREDDER INSTALLATIONS
(a) I nfeed Conveyor (b) Feed Hopper and Discharge Conveyor
FIG.7 CHARLESTON COUNTY CEDARAPIDS ROTARY SHEAR SHREDDER INSTALLATION
627

(a) Top View
(b) End View
FIG.8 VIEW OF SHEAR SHREDDER CUTTERS WITH 2-IN. SPACING
628

TABLE 1 CEDARAPIDS MODEL 5096 ROTARY SHEAR SHREDDER (400 HP) PERFORMANCE DATA •
A. PERFORMANCE DATA USING 2" CUTTER SPACING
Month/Yr
Sep 82 Oct 82
Availability during Month day/days (% )
02/02 100.0 06/06 100.0
Hours Operated during Month
(hrs)
6.9 10.8
Tons Processed during Month (Short Tons)
169 213
Capacity Ave. Max. (tph) (tph)
24.5 19.7
27.1 30.5
---------------------� -------------------------------- ----
Total 08/08 100.0 17.7 382
B. PERFORMANCE DATA USING 4" CUTTER SPACING
Month/Yr
Oct 82 Nov 82 Dec 82 Jan 83 Feb 83 Mar 83
•
Apr 83 May 83 Jun 83
Availability during Month day /days (%)
16/16 100.0 16/22* 72.7 15/21* 71.4 20/21 95.2 20/20 100.0 20/20 100.0 19/21 90.5 12/21* 57.1 21/22 95.5
Hours Operated during Month
(hrs)
80.6 86.7 84.7
107.9 113.7 116.7
94.7 66.5 91.1
Tons Processed during Month (Short Tons)
3781 4558 4500 6496 6773 7494 5773 4232 5715
21.6 30.5
Capacity Ave. Max. (tph) (tph)
46.9 76.0 52.6 63.7 53.1 67.0 60.2 92.9 59.6 76.6 64.2 87.3 61.0 80.8 63.6 94.9 62.7 102.4
----- --- ----------------------------- ------------- --------
Total 159/184 86.4 842.6 49322 58.5 (ave. )
--------------------
*Note: In each of these months the shaft collar slipped requiring several days to remachine the shaft. This was deemed a materials and workmanship problem which should not recur. Thus the average availability should exceed 90% . The Nov and Dec non-availability was a single occurrence extending across both months.
629
was gained with the shredder the capacity increased. During this period of time the average monthly capacity of the machine increased from 47 TPH (43 tph) in October 1982 to 63 TPH (57 tph). During that period the peak daily capacity measured was 102 TPH (92.5 tph) in June 1983. The peak hourly capacity would certainly be in excess of this figure, but was not measured.
Machine availability during the same 9-month period averaged 86.5 percent. Of the 25 days that the machine was not available to process waste, 21 of these were to correct a shaft collar problem which is believed to be a correctable design deficiency. Thus an availability in excess of 95 percent is believed possible.
By comparison, during the December period, the two Heil 42-F mills processed 3570 tons (3238 t) of solid waste during 177 mill operating hours (94 hr for Mill No. 2 and 82.9 hr for Mill No. 3). This represents an average capacity per mill of 20.2 TPH (18.3 tph) versus the design capacity of 20 TPH.
It is worthwhile to note that during this test, the operators fed most of the tires and oversized bulky waste through the shear shredder, Mill No. 1, due to the ease with which this material could be processed by that machine.
SIZE DISTRIBUTION MEASUREMENTS
Only very limited size distribution information was determined during this test program. Only the percentage of 4 in. screen oversize was measured. (Much larger test programs funded by the New York State Energy Research and Development Authority and the U.S. Navy were underway at the time this paper was submitted for publication .)
Table 2 provides data on screen samples from the shear shredder tests. The average weight percentage of 4 in. screen-oversize was 14.9 percent for the shear shredder when the cutter spacing was set at 4 in. (10 cm).
Only qualitative data were gathered regarding size reduction of glass. The shear shredder with the 2 in. (5 cm) cutter spacing reduced the size of glass but did not pulverize the glass as was observed with the Heil 42-F. With the 2 in. spacing, no whole bottles were observed in the shredded product. With the 4 in. (10 cm) spacing, several whole bottles and whole cans passed through the shear shredder and were observed in the product, unbroken.
POWER CONSUMPTION
Power consumption was not measured in Charleston but was measured at another Cedarapids 5096 shredder
630
installation in Elmira, New York. The latter program is being funded by the New York State Energy Research and Development Authority, the Chemung County Solid Waste Disposal District and the Iowa Manufacturing Company, to demonstrate the performance of shear shredders on MSW.
The 5096 shredder is driven by two 200 hp motors. During operation power was measured both by a GE watt Transducer coupled to a strip chart recorder and a GE watthour/recording demand meter. At the Elmira installation, separate power wiring was run to each motor. Because connection of both meters to the same motor attenuated the signal, the watthour recording demand meter was connected to one motor and the watt transducer to the other. A comparison of measurements showed the same power draw by each motor. Thus, readings could be doubled to account for both motors.
The power consumed by the shredder at idle was 112 kW or 38 percent of the rated power calculated from nameplate horsepower. During operation of the mill with 4 in. cutter spacings at processing rates in excess of 60 TPH, the 15 minute average demand for the shredder never exceeded 60 kW per motor. It should be noted that instantaneous spikes as high as 130 kW per motor were measured. Utilizing the maximum fifteen minute average demand of 120 kW and a processing rate of 60 TPH the average energy required per ton of refuse shredded is only 2 kWoh/ton.
Power consumption for the shear shredder appears to be buffered by the hydraulic system and is relatively independent of the processing rate of the shredder. As measured, only a small increase in fifteen minute average demand from (112 kW to 120 kW) resulted as the feedrate was increased from 0 to 60 TPH.
Literature on hammermil1s (Hainsworth et aI., 1976 and Vesiland et al., 1980) show specific energy consumption data for full scale commercial equipment to range from 5 kWoh/ton to greater than 30 kWoh/ton. One must be cautious in comparing these data to the shear shredder data because feed material, feedrates, and discharge particle size vary from location to location. Also, some data are presented on a wet weight basis and some data on a dry weight basis. The Cedarapids 5096 shear shredder energy consumption would increase to between 2.5 to 3.0 kWoh/ton on a dry weight basis at a 60 TPH feedrate. Finally, and perhaps of greatest significance, most data are presented based on net power consumption, where net power is defined as the measured power draw during shredding minus the freewheeling or idling power, or the power used by the shredder to run with no refuse in it. The data presented for the shear shredder in Elmira, New York is calculated based on gross or total measured consumption.

Sample t
1
2
3
4
5
6
7
8
9
10
11
12
TOTAL
NOTE:
•
TABLE 2 SIZE ANALYSIS CEDARAPIDS MODEL 5096 ROTARY SHEAR SHREDDER (4 IN.
Sample Weight (lbs. )
17.5
18.5
21.5
22.5
16.5
11.0
19.5
21.0
26.0
11.0
15.5
11.5
212.0
CUTTER SPACING)
+ 4" Retained On Top of Screen
(lbs. )
2.5
3.5
1.5
3.0
3.0
3.5
2.0
1.5
2.5
2.5
3.0
3.0
Percent Passing 4"
(% )
85.7
81.1
93.0
86.7
81.8
68.2
89.7
92.9
90.4
7 7 .3
80.6
7 3.9
31.5 AVE. 85.1
•
Material Retained (comment)
Cardboard, Plastic
wood, Cardboard, Metal tube
Twigs,Can,Plastic
Fiberglas Cloth, Tape,Cardboard,Paper
Boxboard,Plastic,Can Cardboard, Diaper
Can, Feed Sack,Plastic, Plastic fil m
Cardboard, Plastic Boxboard
Plant stems,Paper, Sack, Magazine
Cardboard, Shingles, Plastic
Asphalt Shingle,Paper sack, Envelope
Diaper,Book,Plastic
Paper,Cardboard,Plastic
The par tic le size testing was done using a 4" rectangular screen. Sa m p les were co l lected at the shred der discharge. The testing was done after ap proximately 15,000 tons had been p rocessed through the sh redder so that it woul d be based on average wear since particle size could be a function of cutter wear. Cutter life of 30,000 tons was assumed •
631

LANDFI LL PLOTS
Approximately 1 00 tons (90 t) of shredded solid waste from each type of shredder were deposited in individual landfill plots on a daily basis. Accurate tonnages were recorded. Each load was leveled and compacted in 6 in. (15 cm) lifts using the existing landfill compactor, a Hyster 440-C weighing 60,000 pounds (27,000 kg). During the study period over 4000 tons (3600 t) of MSW were compacted at each plot.
Study samples were collected twice weekly. During each sampling, weather conditions were recorded. Wind speeds were determined and wind direction was established. Temperatures of the air, refuse surface and subsurface (1 0 in. [25 cm] deep) were recorded. Precipitation and cloud cover were estimated.
Weather conditions were generally warmer and drier than normal between October and December; but cooler and wetter between January and March. Rainy weather during February and March made the landfill test plots impassable, and no shredded waste was placed on the two study plots after 1 6 February.
The surface and subsurface temperatures for both study plots were about 1 0 to 1 5°F (5 to 8°C) above the air temperature. The highest temperatures measured were at a maximum depth of 10 in. (25 cm) beneath the surface. Comparison of surface and subsurface temperatures between the Hell and Cedarapids plots showed no significant differences.
COMPARISON OF NUISANCE LITTER
To collect the blown litter from the study plots, a 5 ft (1.7 m) high, "chicken wire" fence was installed on three sides of each plot, a distance of 25 ft (7 m) away from each plot. Once each week, material that collected on the fence was removed manually and measured (by volume and weight). In addition, an estimate of the amount of wind-blown litter was made by measuring the amount of litter adjacent to the fence once a week.
Less than 30 lb (15 kg) of material was removed and collected from both fences during the testing period of 4 October through 15 December 1 982 (Table 3-A). Volume data only were collected for the period of 10 January through 1 1 March 1 983 (Table 3-B). The material collected within 4 ft inside the fence line during the five months of testing was 1 2.2 cubic yards for the Cedarpaids test plot and 1 2.5 for the Hei! test plot (Table 3-C).
The material that was removed consisted entirely of light weight plastic and paper. The particle size of the material from the fence was largely in the 2 in. X 4 in. (5 X 1 0 cm) particle size. The average noncompacted
632
weight of the material removed from the fence was 2.2 Ib/ft3 (35 kg/m3).
Little difference was noted within the two test plots of the amount of material being carried by the wind during and after the compactor trailers were unloaded on the landfill site.
COMPARISON OF COMPACTION DENSITY
The difference in compaction density between the two test plots averaged less than 1 percent. During the test period, approximately 1 00 tons (90 t) per day of shredded municipal solid waste (MSW) was delivered to each test plot, for a total of 8169 tons (7409 t) - 4094 tons (3713 t) for the Cedarapids and 4075 tons (3696 t) for the Hell.
After compacting in 6 in. (1 5 cm) lifts to a predetermined height of 3 ft (1 m), compaction density was determined for each study plot from the two types of shredders. Four tests were performed at each test plot, by marking out a one fe area and removing all material inside the area to a depth of one ft. The material removed was collected in plastic bags and weighed. To establish accurate volumes for each sample collected, measurements were made at each test area (Table 4).
After the material collected from the landfill was weighed and recorded, a screen test was performed to determine particle size. The material was manually shaken on a screen having an opening of 4 in? to determine the amount by weight that would pass through the 4 in. openings. For the Heil shredder, an average of 91 percent of the shredded material passed through the 4 in. (1 0 cm) openings. For the Cedarapids shredder, an average of 87.7 percent passed through.
--- - �
The results from the compaction tests were similar to the sizing tests performed on material from the discharge conveyor of the Cedarapids shredder. Of the twelve samples taken at the discharge of the Cedarapids shredder, the average size less than 4 in. was 85.1 percent.
COMPARISON OF OFFENSIVE ODORS
We found no quantitative method for measuring offensive odors. However, twice each week during the midday and early afternoon, the magnitude of odors from the two shredde,d waste plots was determined by two individuals standing downwind from the plots.
The presence (or absence) of offensive odors, and the relative strength of the odors on the two study plots were noted at different times of day each week. One person, who sampled the plots at midday, recorded no significant odors on either plot in 3 of 1 9 visits (1 6 percent). The
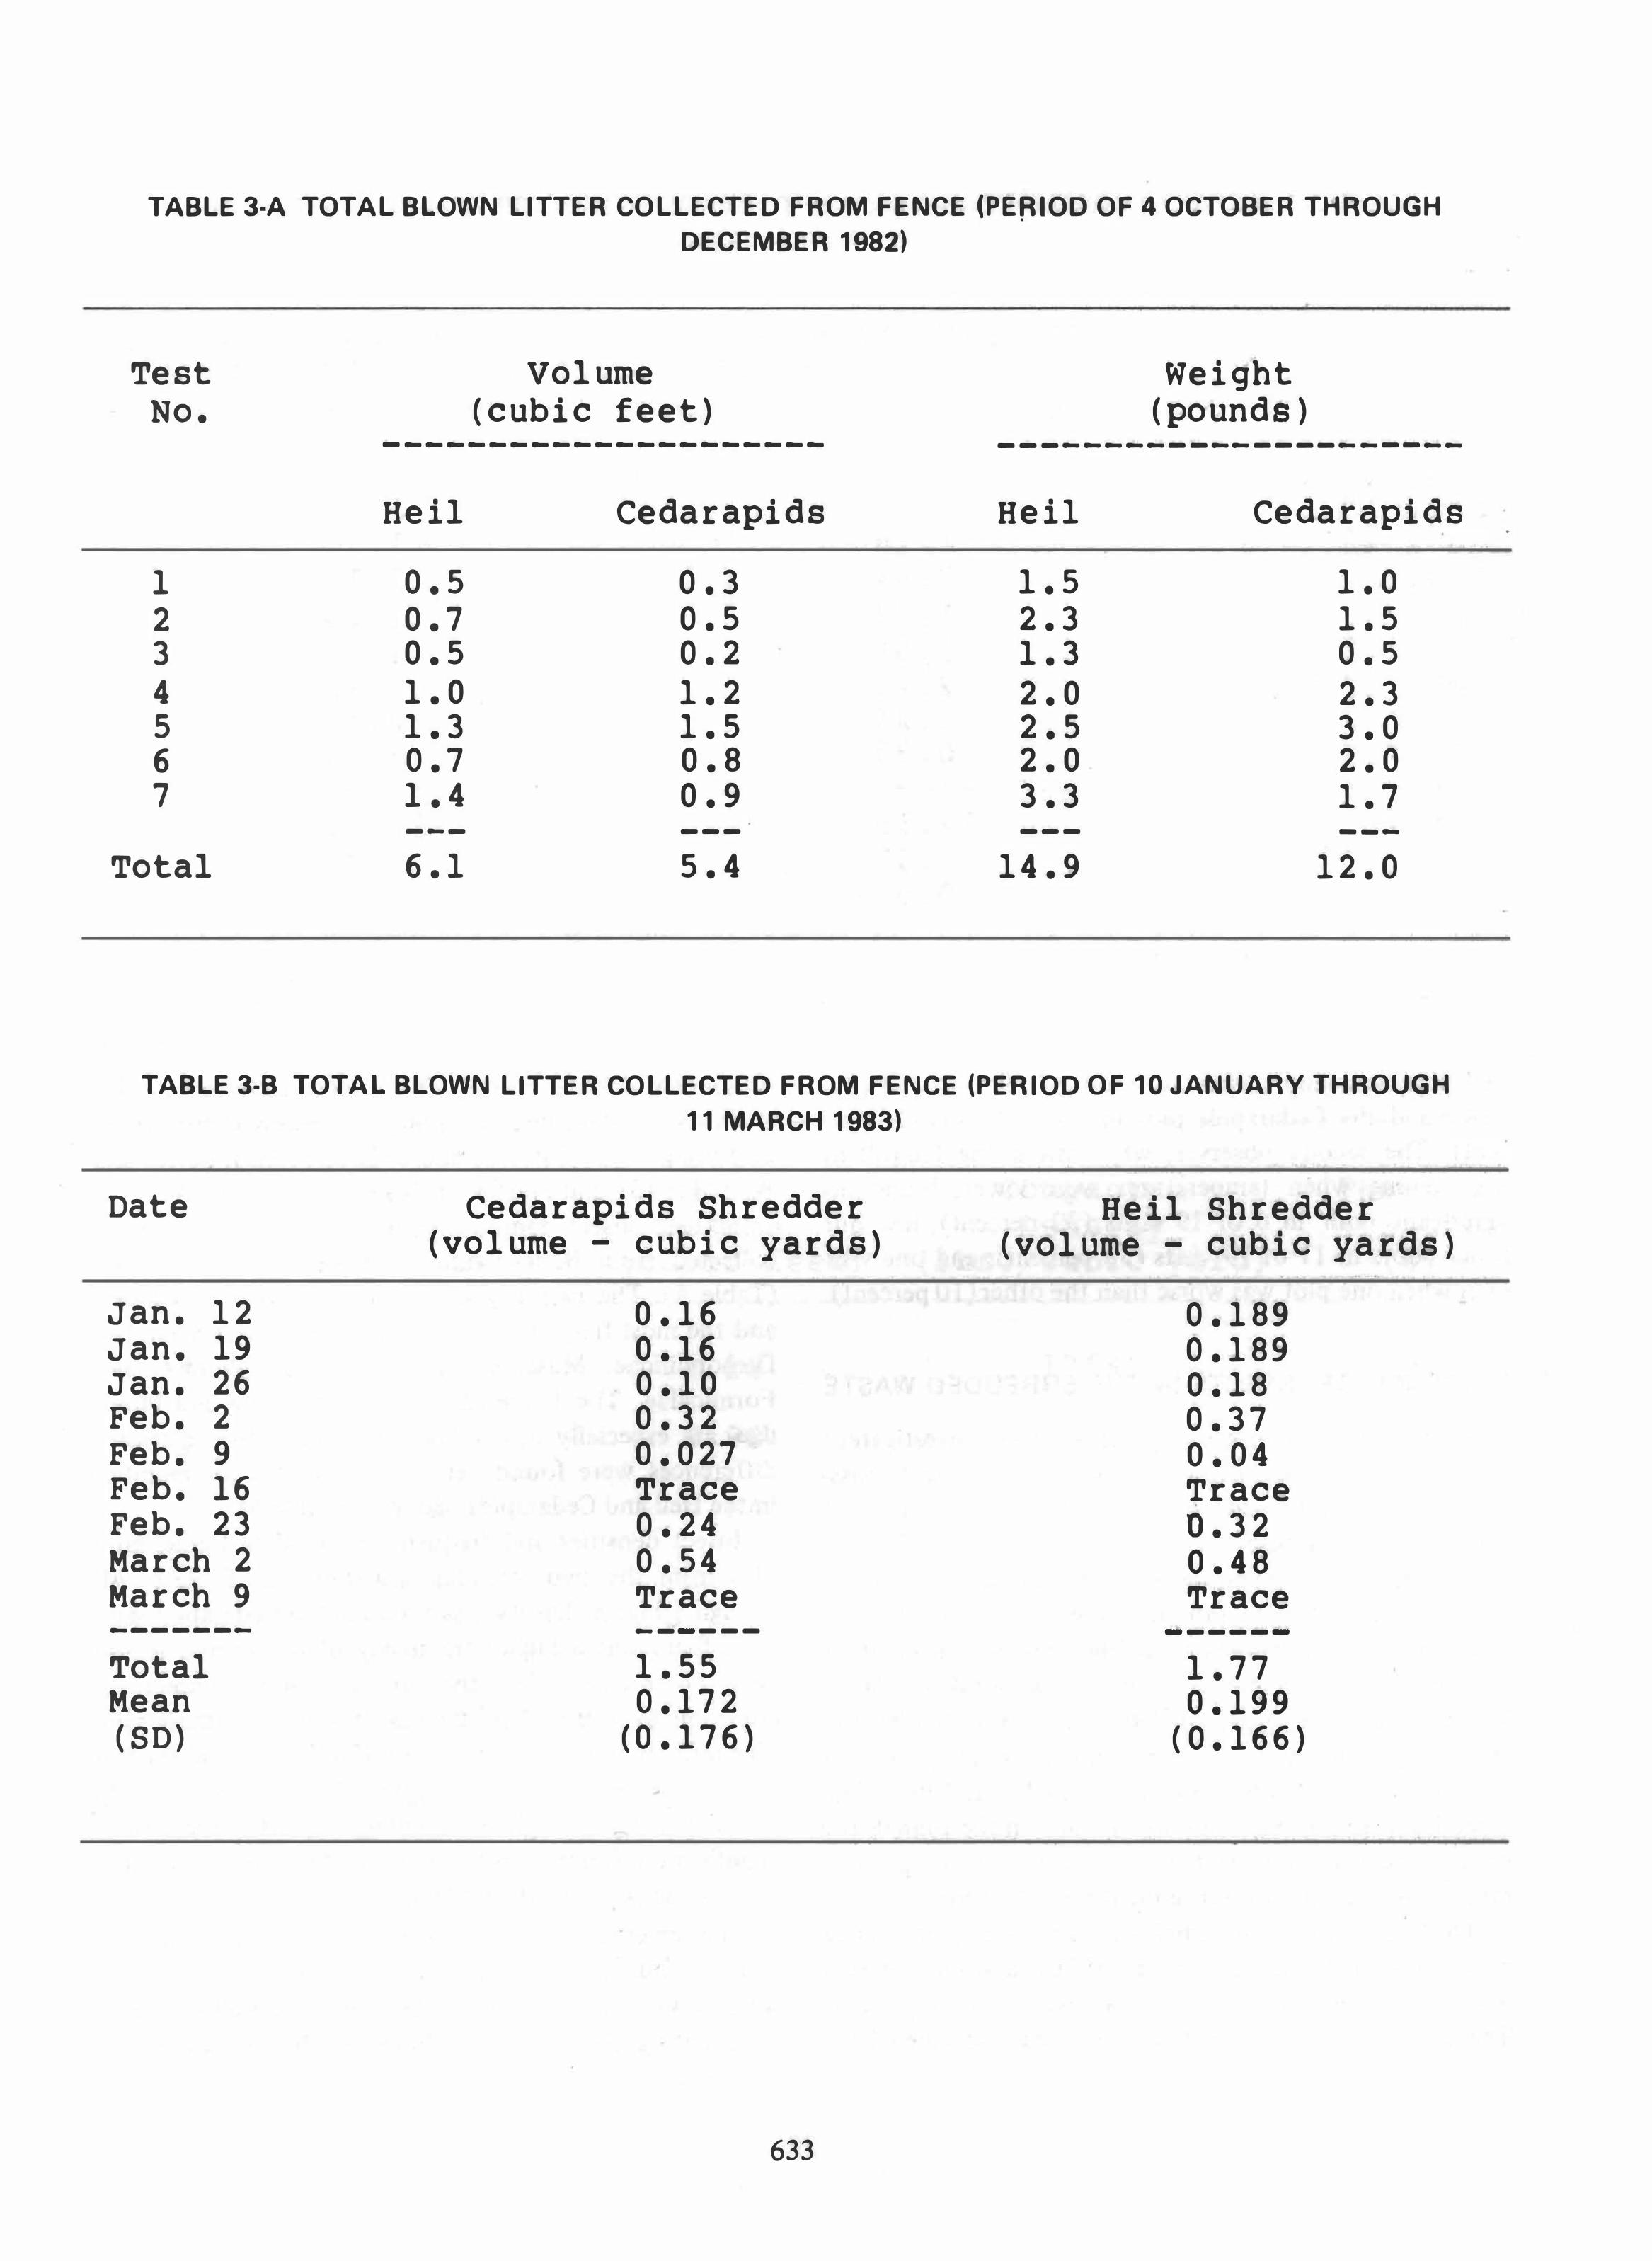
TABLE 3-A TOTAL BLOWN LITTER COLLECTED FROM FENCE (PEfUOD OF 4 OCTOBER THROUGH
DECEMBER 1982)
Test No.
1 2 3 4 5 6 7
Total
Volume (cubic feet)
---------------------
Hei1 Cedarapids
0.5 0.3 0.7 0.5 0.5 0.2 1.0 1.2 1.3 1.5 0.7 0.8 1.4 0.9 --- ---6.1 5.4
Weight (poundS)
----------------------
Hei1 Cedarapids
1.5 1.0 2.3 1.5 1.3 0.5 2.0 2.3 2.5 3.0 2.0 2.0 3.3 1.7 --- ---
14.9 12.0
TABLE 3-B TOTAL BLOWN LITTER COLLECTED FROM FENCE (PERIOD OF 10 JANUARY THROUGH
1 1 MARCH 1983)
Date
Jan. 12 Jan. 19 Jan. 26 Feb. 2 Feb. 9 Feb. 16 Feb. 23 March 2 March 9 -------
Total Mean (SD)
Cedarapids Shredder (volume - cubic yards)
0.16 0.16 0.10 0.32 0.027 Trace 0.24 0.54 Trace
------1.55 0.172
(0.176)
633
Hei1 Shredder (volume - cubic yards)
0.189 0.189 0.18 0.37 0.04 Trace 0.32 0.48 Trace
------
1.77 0.199
(0.166)
•

TABLE 3-C TOTAL BLOWN LITTER ADJACENT TO FENCE (PERIOD OF 10 JANUARY THROUGH
1 1 MARCH 1983)
,
Date Cedarapids Shredder (vo1ume- cubic yards)
Heil Shredder (volume - cubic yards)
Jan. 12 1.7 Jan. 19 1.75 Jan. 26 1.19 Feb. 2 0.94 Feb. 9 1.07 Feb. 16 1.58 Feb. 23 2.23 March 2 1.34 March 9 0.35 -- --- -- --- ---Total 12.15 Mean 1.35 (SO) (0.55)
Hell plot was more offensive in 1 1 of 19 visits (58 percent); and the Cedarapids plot in 5 of 19 visits (26 percent). The second observer, who visited the landfill in the evening when temperatures were lower, found no significant odor in 6 of 19 visits (32 percent); low but equal odors in 11 of 19 visits (58 percent); and one visit each when one plot was worse than the other (10 percent).
PRESENCE OF INSECTS IN THE SHREDDED WASTE
Two aspects of insect populations were investigated: (a) the number and species composition of insects passing through the shredders; and (b) the attractiveness of shredded waste to insects.
To determine the presence of insects passing through the shredded material, samples were taken from the two shredders once each week at midday. From each shredder ten samples of twelve cubic feet each were taken, placed in plastic garbage bags, labeled and transported to the laboratory. One-half of the samples were processed through Berlese funnels (Borror and DeLong, 1966). The shredded material was allowed to stand in the funnels for 48 hr; the insects collected were stored in 70 percent ethanol and labeled for subsequent identification.
The other half of the samples were placed in emergence traps (modified after Touchton, 1976), and left for two weeks to determine if any larval insects were present. The insects which emerged were pinned and labeled for
634
1.0 1.0 1.39 1.12 1.26 1.38 0.92 0.57 3.85
- -----
12.49 1.39
(O. 96)
subsequent identification. The insects collected in this study were identified to family and genus (when possible) using keys of Borror and DeLong (1966), Borror and White (1970), and Pratt et al. (1975).
Sixteen insect families representing six orders were collected from Berlese funnel samples during the study (Table 5). The majority of insects were flies or beetles, and the most frequently occurring families were Sciaridae, Drosophilidae, Muscidae, Phoridae, Staphylinidae, and Formicidae. The Dipteran families, Muscidae and Phoridae, are especially associated with refuse. No significant differences were found between the insect communities in the Hell and Cedarapids materials (Table 6).
Insect densities and frequencies found in funnel samples from the two shredders are shown in Table 6. Although a higher density was found in the Cedarapids samples, there was a higher frequency of occurrence in the Heil. These data reflect the patchy nature of insect distribution in refuse. The standard deviation of these samples reflects the variability found (Table 6), as do the frequency figures. These data suggest that insects are rarely found passing through the shredders and that there is no significant difference in the numbers passing through the Hell as compared to the Cedarapids.
The emergence trap data showed similar trends to those found for the Berlese funnels (Table 7). All insects were Diptera of two families, Muscidae and Calliphoridae, representing three genera. These are all common refuse

TABLE 4 SHREDDED WASTE LANDFILL COMPACTION TESTS
Hei] test plot
Test
1
2
3
4
Material Weight
(pounds)
38.0
62.5
58.0
54.0
Hole Volume
(cubic feet)
0.91
1.09
1.10
1.20
Compacted Density
(lbs./cubic yard)
1127
1548
1423
1215
Average compaction density: 1328 Ibs/cubic yard
Test
1
2
3
4
plot
Material Weight
(pounds)
211.0
49.0
46.5
35.0
Hole Volume
(cubic feet)
4.16
0.90
0.94
0.87 •
Compacted Density
(lbs./cubic yard)
1369
1470
1335
1086
Average compaction density: 1315 Ibs/cubic yard
635
Passing 4 inches
(% )
95
92
90
87
Passing 4 inches
(% )
90
89
81
91
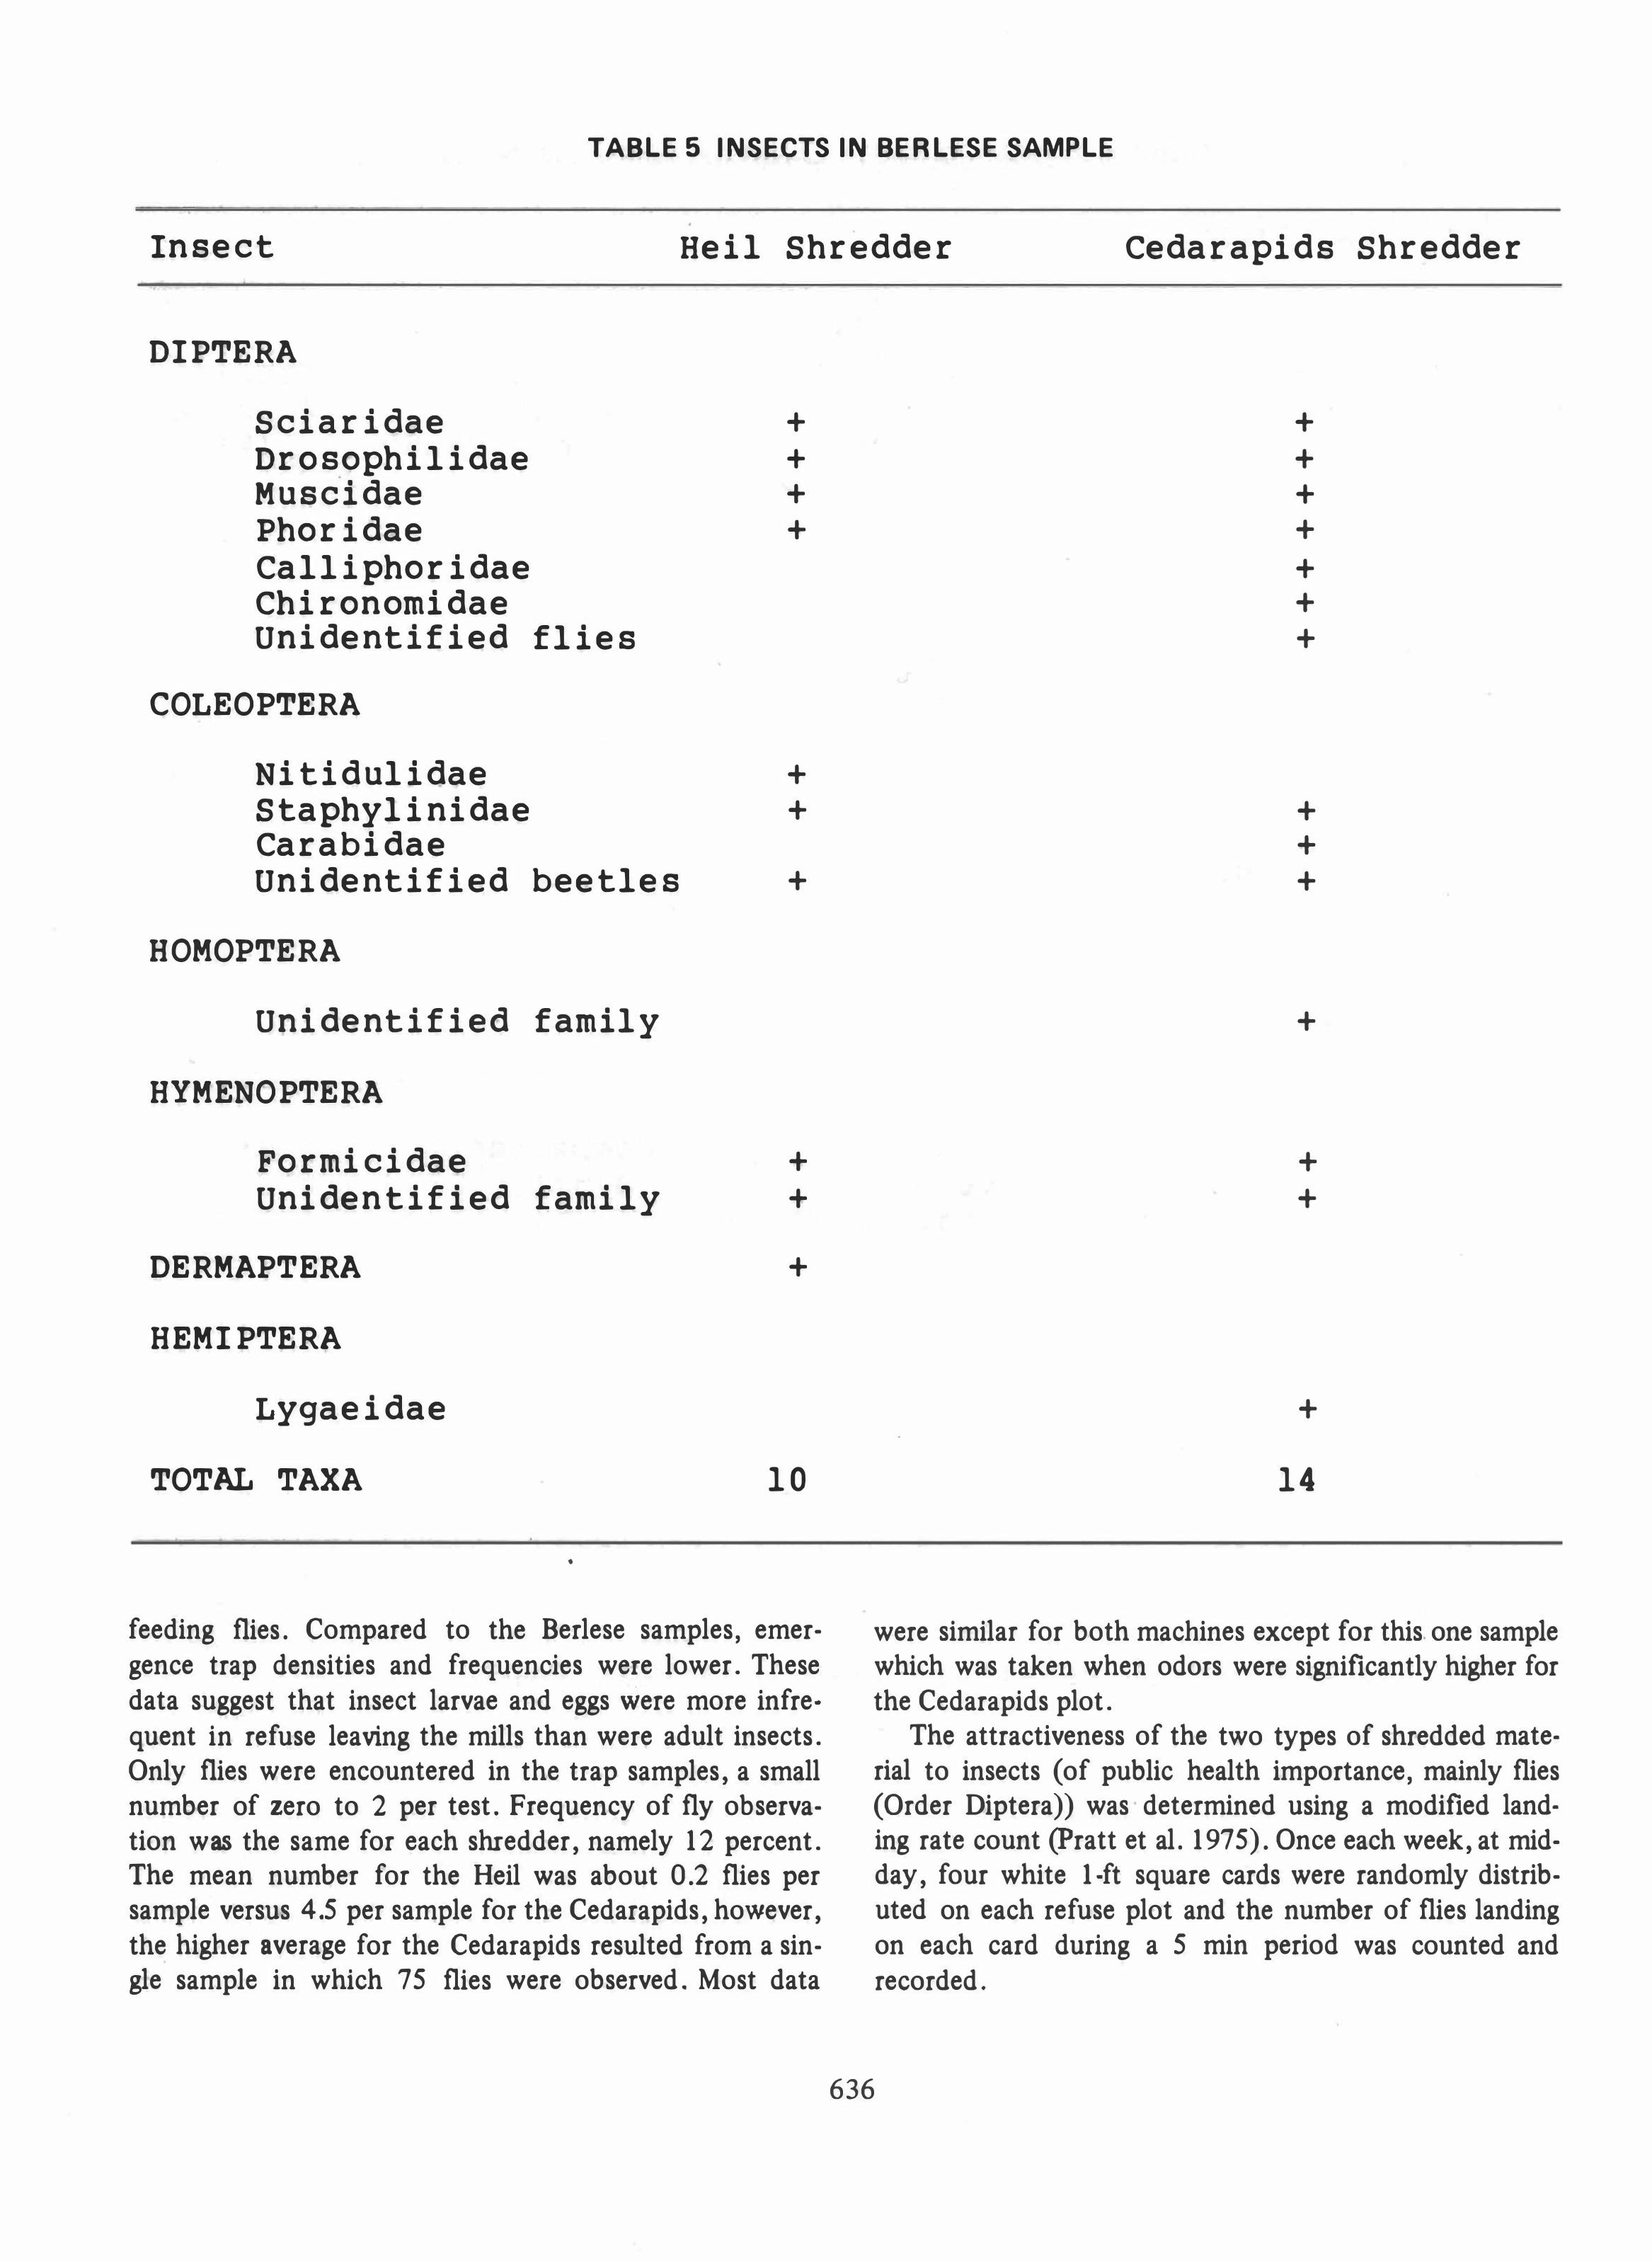
TABLE 5 INSECTS IN BERLESE SAMPLE
•
Insect Heil Shredder Cedarapids Shredder
DIPTERA
Sciaridae Drosophilidae Muscidae Phoridae Calliphoridae Chironomidae Unidentified flies
COLEOPTERA
Nitidulidae Staphylinidae Carabidae Unidentified beetles
HOMOPTERA
Unidentified family
HYMENOPTERA
Formicidae Unidentified family
DERMAPTERA
HEMIPTERA
Lygaeidae
TOTAL TAXA
•
+
+ + +
+ +
+
+
+
+
10
feeding flies. Compared to the Berlese samples, emergence trap densities and frequencies were lower. These data suggest that insect larvae and eggs were more infrequent in refuse leaving the mills than were adult insects. Only flies were encountered in the trap samples, a small number of zero to 2 per test. Frequency of fly observation was the same for each shredder, namely 12 percent. The mean number for the Heil was about 0.2 flies per sample versus 4.5 per sample for the Cedarapids, however, the higher average for the Cedarapids resulted from a single sample in which 75 flies were observed. Most data
•
+
+ + +
+ + +
+ + +
+
+
+
+
14
were similar for both machines except for this one sample which was taken when odors were Significantly higher for the Cedarapids plot.
The attractiveness of the two types of shredded material to insects (of public health importance, mainly flies (Order Diptera)) was determined using a modified landing rate count (pratt et al. 1975). Once each week, at midday, four white 1-ft square cards were randomly distributed on each refuse plot and the number of flies landing on each card during a 5 min period was counted and recorded.
636

Mean (SO)
Frequency
Range
Mean (SO)
Frequency
Range
* Only
Mean (SO)
Frequency
Range
* Only
TABLE 6 MEAN NUMBER OF INSECTS IN BERLESE SAMPLES
Hei1 Shredder
5.06 (7.9)
76%
o - 32 ,
Cedarapids Shredder
9.12 (23.26)
59%
o - 98
TABLE 7 FLIES IN EMERGENCE TRAP SAMPLES*
Hei1 Shredder
and
0.18 (0.5)
12%
0 - 2
Cedarapids Shredder
were found
4.47 (18.1)
12%
o - 75
TABLE 8 LANDING RATE COUNTS OF DIPTERA*
Hei1 Shredder
3.90 (2.9)
94%
o - 13
Cedarapids Shredder
1.60 (2.25)
76%
o - 13
and Cftlliphoridfte were found
637

The relative attractiveness of refuse to insects was measured by landing rate counts on the two sample plots (Table 8). There was a trend for fewer flies to be seen on the Cedarapids plot but the high standard deviations of the samples make the differences nonsignificimt. The trend toward higher numbers of flies on the Heil plot was also shown by observations. In 10 of 19 days, more flies were seen on the Heil plot than the Cedarapids plot. On two occasions, in early October, more flies were seen on the Cedarapids plot. In the other seven observations no flies were seen on either plot. These results suggest the Cedarapids shredded material. attracts fewer refusebreeding flies than did the Heil, but the result may not be meaningful.
ATTRACTIVENESS OF SHREDDED REFUSE TO
RODENTS
The attractiveness to rodents of the waste shredded by the two different types of shredders was evaluated using modified North American traplines (Smith 1974). Each 200 fe (60 m2) plot was subdivided into four transects 50 ft (15 m) apart. Each transect consisted of four stations with three rat traps per station for a total of 48 traps. Rat snaptraps baited with a peanut butter/oatmeal/ raisin mix were set in the evening during midweek, and traps were picked up the following morning. Locations showing where rodents were caught, along with data on species, sex, and age, were noted.
A total of 28 individual rodents of one species, the House Mouse (Mus musculus) were trapped in 1,824 trap-nights during this study for a capture rate of 1 percent. No other rodent species were caught or observed during the study, and no mice were caught between October and December. All but two (7 percent) of the mice were caught on the edges of the study plots. A comparison between the plots showed a significantly higher number of mice (19 Cedarapids vs 9 Heil) and a higher frequency of occurrence (37 percent Cedarapids vs 16 percent Heil) for the Cedarapjds plot.
DISCUSSION AND CONCLUSIONS
A comparison of the two shredders for compaction density, amount of wind blown litter, excessive odors, reduction and destruction of insects, and attractiveness to rodents and insects, showed insignificant differences between the Heil and Cedarapids shredders in all cases, with the possible exception of attractiveness to rodents, where the Cedarapids shredder was slightly higher. House Mice were found in the Heil study plots, but more were noted in the Cedarapids plots.
Observations of the Cedarapids shredder over a 9-month period during which 50,000 tons (45,000 t) was shredded showed it to be effective for milling solid waste at average daily capacities in excess of 60 TPH using 4 in. (10 cm) cutter spacing. Peak daily capacity exceeded 100 TPH. With this cutter configuration the capacity was 3 times that of the Heil 42-F.
With the 4 in. (10 cm) cutter spacing, the incoming MSW was reduced to a size 85 percent of which passed a 4 in. (10 cm) square opening. Availability of the machine exceeded 85 percent, and availabilities in excess of 95 percent appear possible once additional corrections are made to the hardware.
Of further qualitative interest is the shear shredder's ability to shred discarded tires, a serious disposal and public health problem (peterson, 1979, U.S. Dept. Health, Education, and Welfare), and to shred MSW without overgrinding of glass.
In both test plots, surface and subsurface temperatures for both the Heil and Cedarapids shredders were higher than ambient temperature. These higher temperatures are believed due to spontaneous generation of heat by microorganisms in the refuse. Touchton (1976) in a year-long study of the Romney Street landfill, found similar temperature differences. He suggested that the higher subsurface temperatures might destroy insect eggs and larvae.
Odors are a common nuisance associated with solid waste disposal sites. This study showed slightly higher, but fluctuating odors for the Heil machine, probably due to variations in the types of refuse processed and the air temperature more so than the type of shredder used to prepare the waste. However, at no time did the odors create a public nuisance.
The species, populations, and occurrence of insects found in Berlese funnels and emergence traps during this study were similar to those found by Touchton (1976). Although there were differences recorded for the two shredders, the differences were numerically inSignificant both for destruction of adult insects passing through the shredder, and for destruction of adult insects passing through breeding. In all studies of landfills, refuse-feeding flies of the families Muscidae, CalliphOridae, and Sarcophagidae dominate the insect community (Cranford, 1973, Abdel-Gawaad and Stein, 1978,' Forsythe and Touchton, 1977).
The low number of rodents captured during this study and the presence of only one species was not surprising; as the South Carolina Coastal Plain is noted for its low mammalian diversity and density (Schacher and Pelton, 1979). Surprisingly, no Norway Rats (Rattus norvegicus) were found as they are common on landfills (Lore and Flannelly, 1978, Newell, 1971); and they were observed
638
at Romney Street during previous studies (Forsythe, 1980). The data show a slightly higher presence of mice on the Cedarapids plot; however, the results may not be significant. An examinatio'n of the cover surrounding the plots suggests there was more cover suitable for mice adjacent to the Cedarapids plot. Although mice were found, they do not pose as serious public health threat as do Norway and Black (Rattus rattus) Rats, and no rats were found during this study.
ACKNOWLEDGMENTS
The authors acknowledge the financial support of the Charleston County Council. Special appreciation is owed to Dr. N. Steven Steinert, County Manager, and Mr. William E. Koopman, Deputy County Administrator for their continued support and assistance. Appreciation is also owed to Mr. John Ohlandt, South Carolina Department of Health, without whose help this work could not have been accomplished. We also wish to thank Mark Jaspan and Ricky Wolfe for assistance in the field and Sharon Pleskowicz for editing and typing this paper.
Finally, we thank the New York State Energy Research and Development Authority and the Chemung County Solid Waste Disposal District for their support and assistance in measuring and reporting the power consumption data from Elmira, New York.
REFERENCES
[1) Abdel-Gawaad, A. A. and Stein, W., "Investigations of
the insect fauna of a refuse dump. Part 2. The aerobic refuse dump
as a breeding place of synanthropic flies Diptera, Muscidae,
Calliphoridae," Z Angew. Zool. 65(1):357-366, 1978 (in German).
[2) Borror, D. J. and DeLong, D. W., An Introduction to the
Study of Insects, Revised edition, Holt, Rinehart and Winston,
New York, NY, 1966,819 pages. (3) Borror, D. J. and White, R. E., A Field Guide to the In
sects of America North of Mexico, Houghton Mifflin Co., Boston, MA, 1970,403 pages.
[4) Forsythe, D. M., The Attractiveness of Shredded Gar
bage to Gulls and Other Avian Species Potentially Hazardous to
Aircraft, AFESC-TR-80-02, U.S. Air Force, Tyndall Air Force Base, FL, 1980, 102 pages.
(5) Forsythe, D. M. and Touchton, K. L., "A Survey of Insect Numbers and Species Composition at the Charleston County Solid Waste Reduction Center, Charleston, SC," South Carolina
A cad. Science Bulletin 39:54, 1977.
(6) Hainsworth, E., Mayberry, 1. L., and Piscitella, R. R., Energy From Municipal Solid Waste Mechanical Equipment and
Systems Status Report, Prepared for U.S. Department of Energy,
DOE Contract No. DE-AC07-76ID01570. (7) Lore, R. and Flannelly, K., "Habitat Selection and Bur
row Construction by Wild Rattus norvegicus in Landfill,"!. Compo
Physiol. Psychol., 92(50) :888-896, 1978. (8) Peterson, C., "Scrap Tires Arise As Special Disposal
Problem," Waste Age, May:37:39, 1979. (9) Pratt, H. D., Littig, K. S., and Scott, H. G., Flies of
Public Health Importance and Their Control, U.S. Dept. of HEW, Center for Disease Control, Atlanta, GA, DHEW Pub. No. (CDC)
75-8218,1975,46 pages. (10) Schacher, W. H. and Pelton, M. R., "The Mammals of
Kiawah Island, SC," pages 184-195. IN: Forsythe, D. M. and
Ezell, Jr., W. B. (eds.), Proc. 1st South Carolina Endangered
Species Symposium, SCWMRD, Columbia, SC, 1979. [11) Smith, R. L., Ecology and Field Biology, Second Edi
tion, Harper & Row, New York, NY, 1974,849 pages.
(12) Touchton, K. L., "A Survey of Insect Distribution and Species Composition of a Solid Waste Dump Site," The Citadel,
Dept. of Biology, 1976, Charleston, SC. Unpub.
[13) U.S. Department of Health and Human Services, "Biolo
gy and Control of Aedes Aegypti. Vector Topics Number 4, Cen
ter for Disease Control, Atlanta, GA, 1979, 68 pages.
(14) Vesiland, P. A., Rimer, A. E., and Worrel, W. A., "Per
formance Characteristics of a Vertical Harnmermill Shredder,"
Proceedings 1980 National Waste Processing Conference, ASME,
May 1980.
Key Words: Bulky Wastes • Compaction • Explosion .
Hammermill • Landfill • Materials Recovery • Refuse
Derived Fuel • Sanitary Landfill • Shear Shredding •
Shredders • Volume Reduction
639