l'approccio nutrizionale e farmacologico-zamboni · l’approccio nutrizionale e farmacologico...
TRANSCRIPT

Prof Mauro Zamboni
Clinica Geriatrica
Università di Verona
L’approccio Nutrizionale e Farmacologico
19 Ottobre 2013Aula Magna Nuovo Ospedale S. Anna
Cona, Ferrara
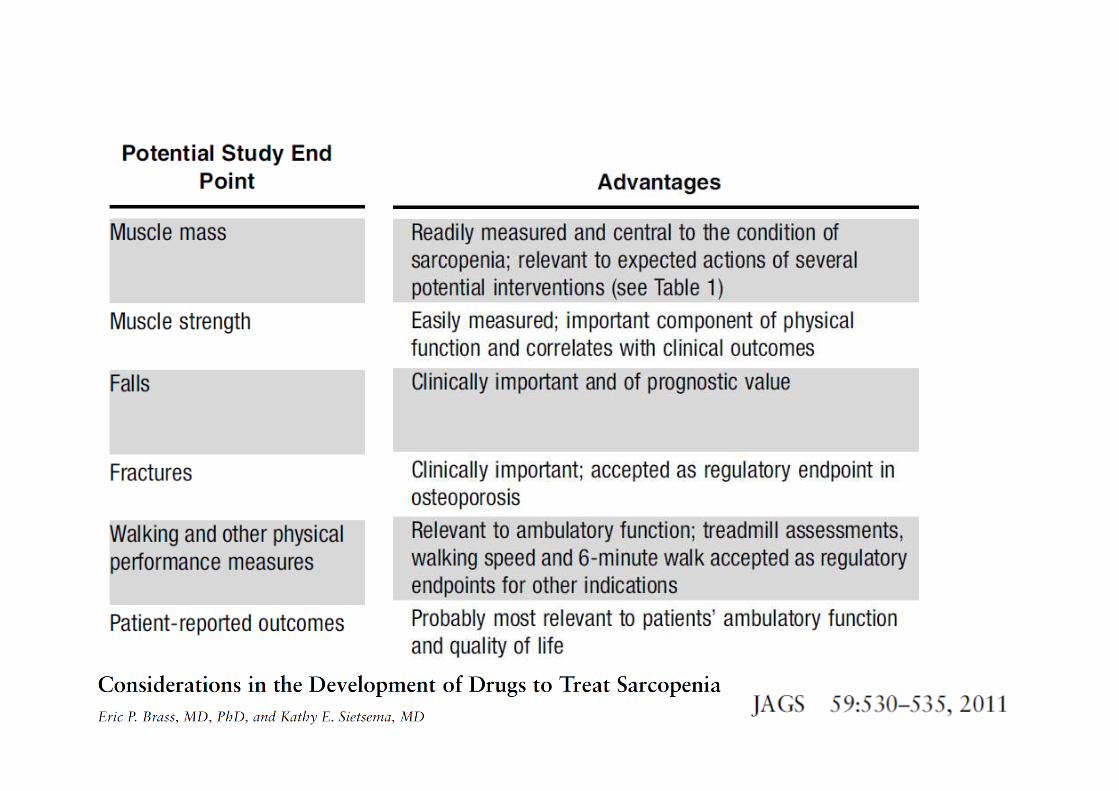
La SarcopeniaDefinizione, Patogenesi e Trattamento
“Sarcopenia is becoming recognized as a
major cause of disability and morbidity
in the elderly population”.
Roubenoff and Hughes, 2000
Why to identify Sarcopenia ?
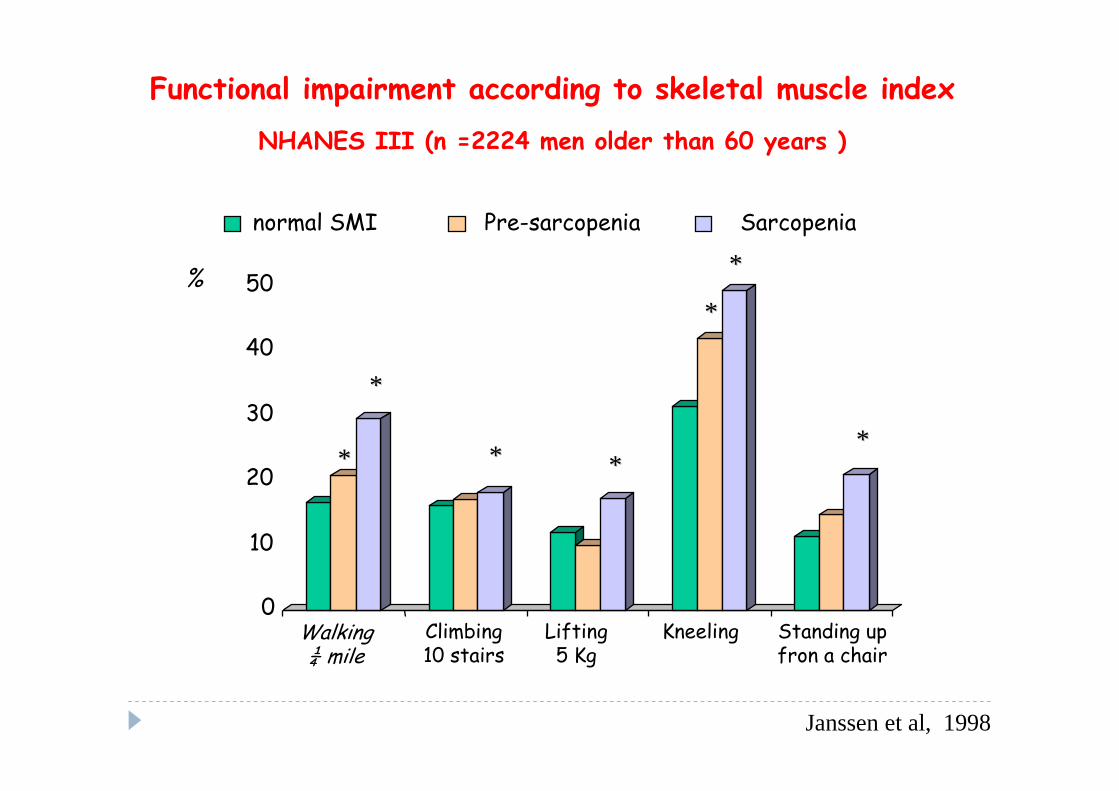
Functional impairment according to skeletal muscle index
NHANES III (n =2224 men older than 60 years )
0
10
20
30
40
50
Janssen et al, 1998
**
** **
**
**
**
normal SMI Pre-sarcopenia Sarcopenia
Walking ¼ mile
Climbing 10 stairs
Lifting5 Kg
Kneeling Standing up fron a chair
%
**

Predictors of worsening disability during the follow-up period 5.5 years (160 subjects older 70)
0 1 2 3 4 5
Comorbility (n of patologies)
Age
Basal Appendicular FFM
Basal FM
O.R.
Basal BMI
Loss of appendicular FFM
Gender
Meters (6 min walking test)
6 7 8 9 10
OR 2.15 p<0.001
Fantin et al, 2007
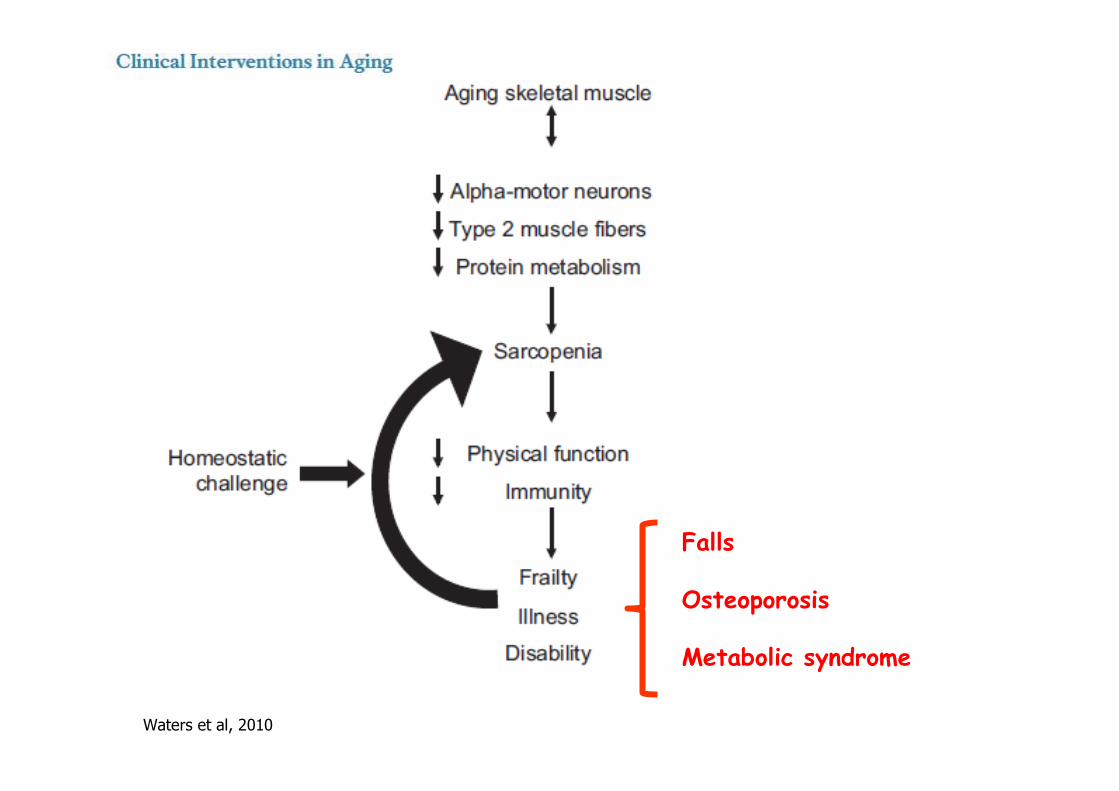
Waters et al, 2010
Falls
Osteoporosis
Metabolic syndrome
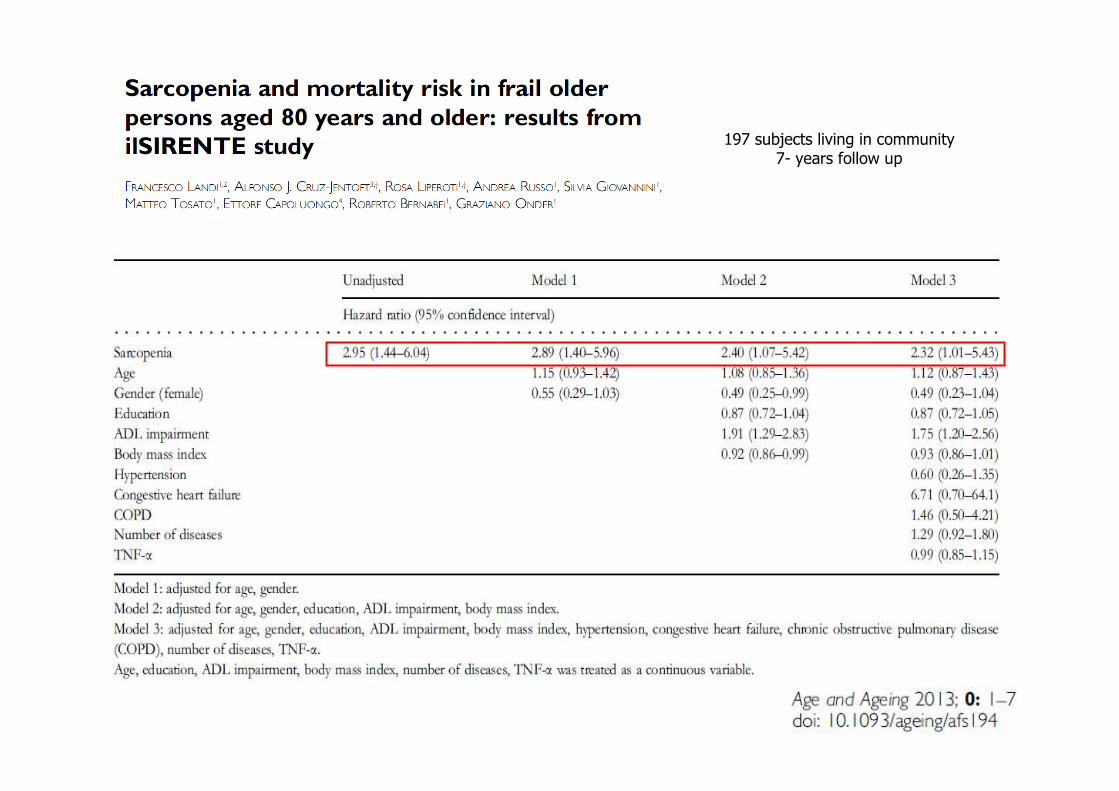
197 subjects living in community7- years follow up

Gariballa and Alessa, 2013
6-months hospital readmission
432 hospitalizedill older patients
with age higher than 65 years
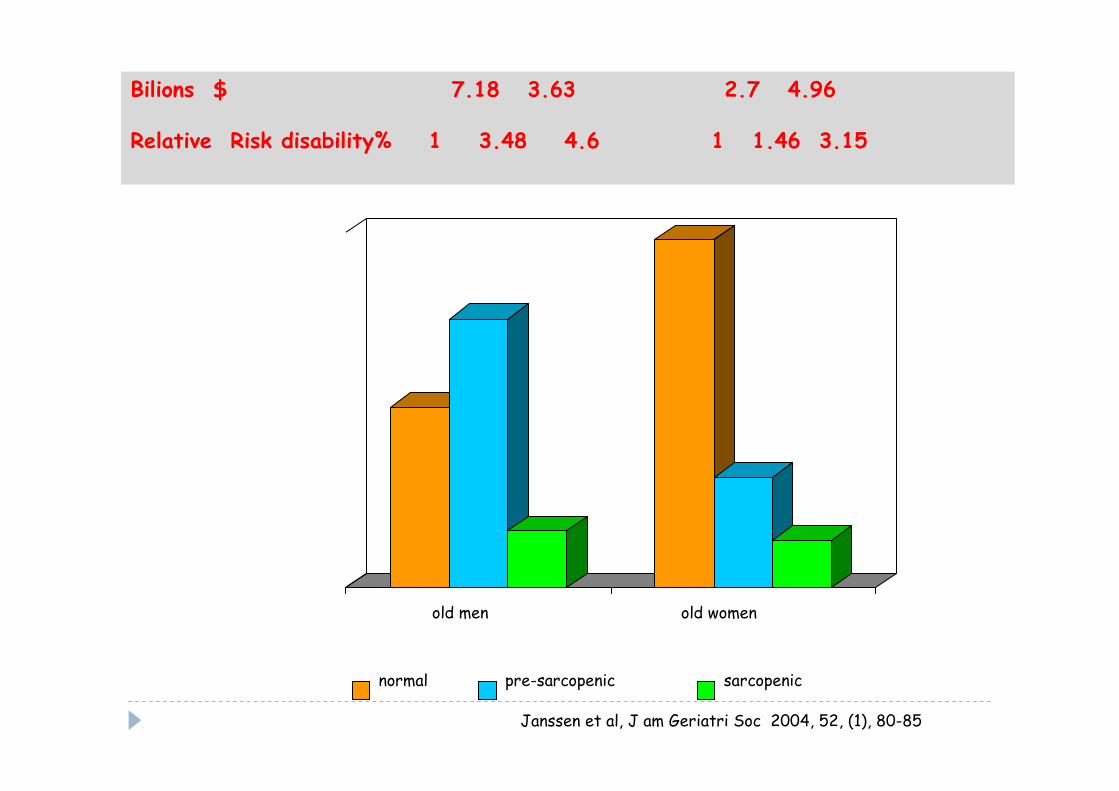
Janssen et al, J am Geriatri Soc 2004, 52, (1), 80-85
Bilions $ 7.18 3.63 2.7 4.96
Relative Risk disability% 1 3.48 4.6 1 1.46 3.15
0
10
20
30
40
50
60
70
old men old women
normal pre-sarcopenic sarcopenic
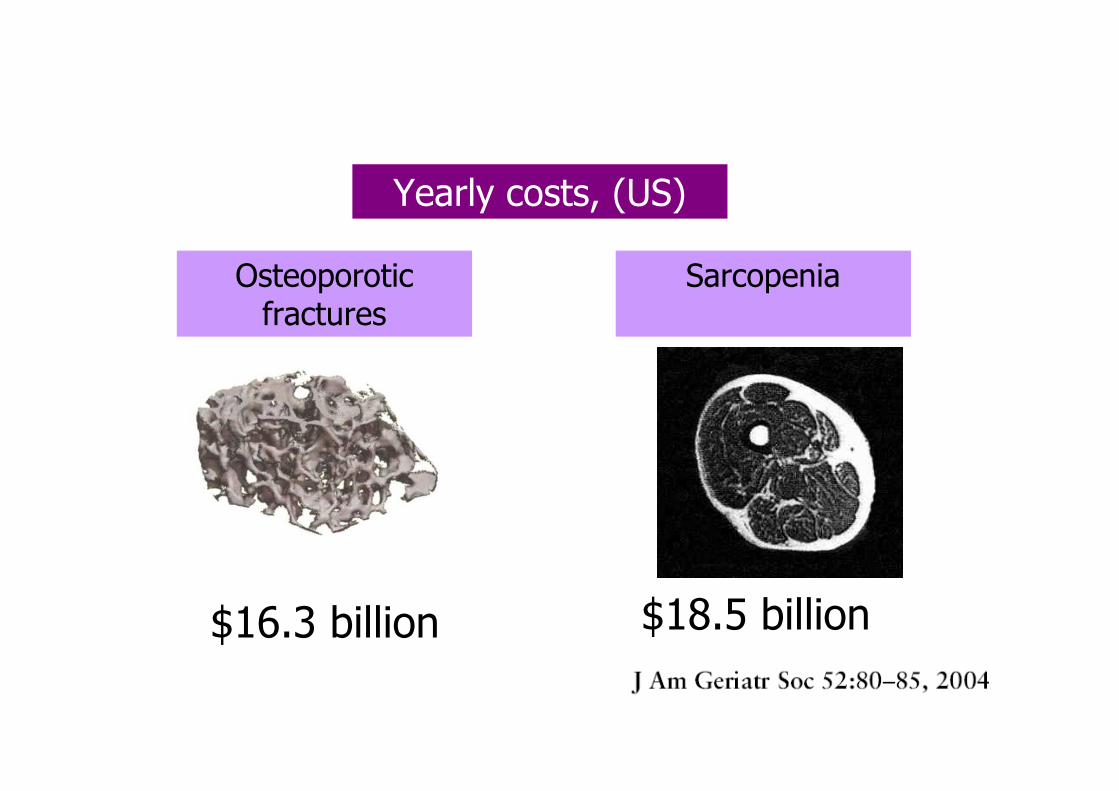
Yearly costs, (US)
Osteoporotic fractures
$16.3 billion $18.5 billion
Sarcopenia

Map of 1121 studies found by search of: osteoporosis
March 2013
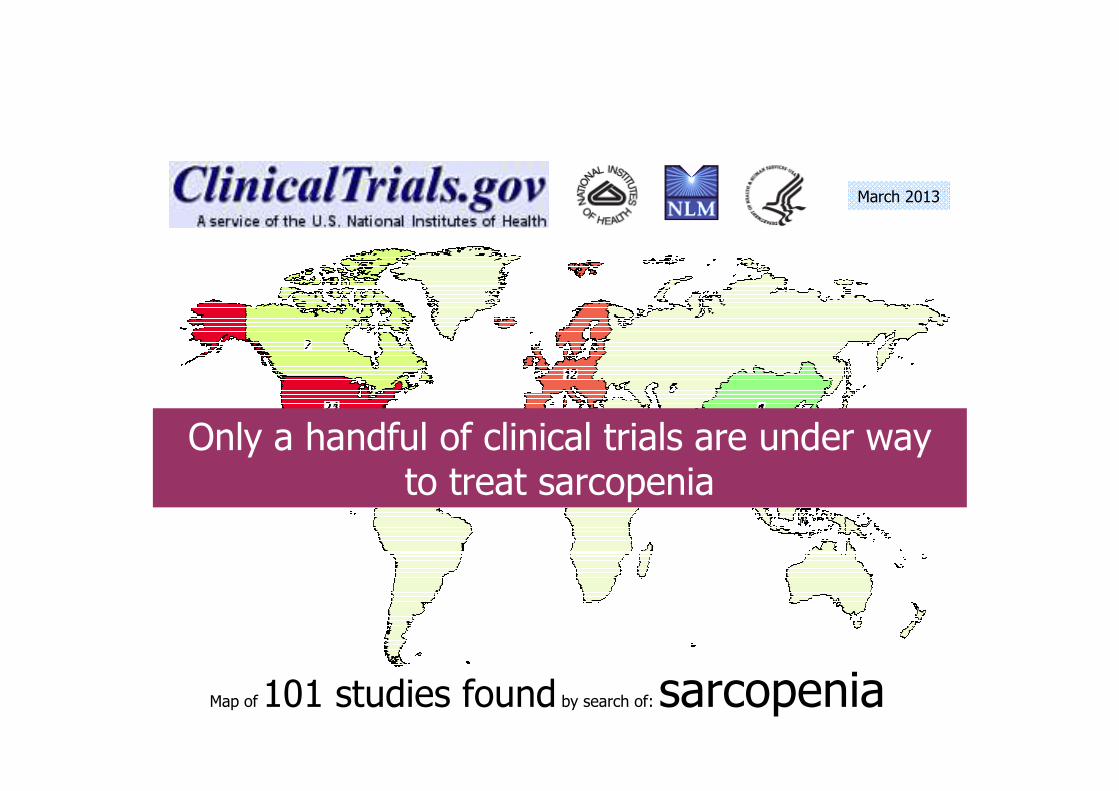
Map of 101 studies found by search of: sarcopenia
Only a handful of clinical trials are under way to treat sarcopenia
March 2013

to maintain muscle mass
to reduce muscle mass loss or to regain
different aims
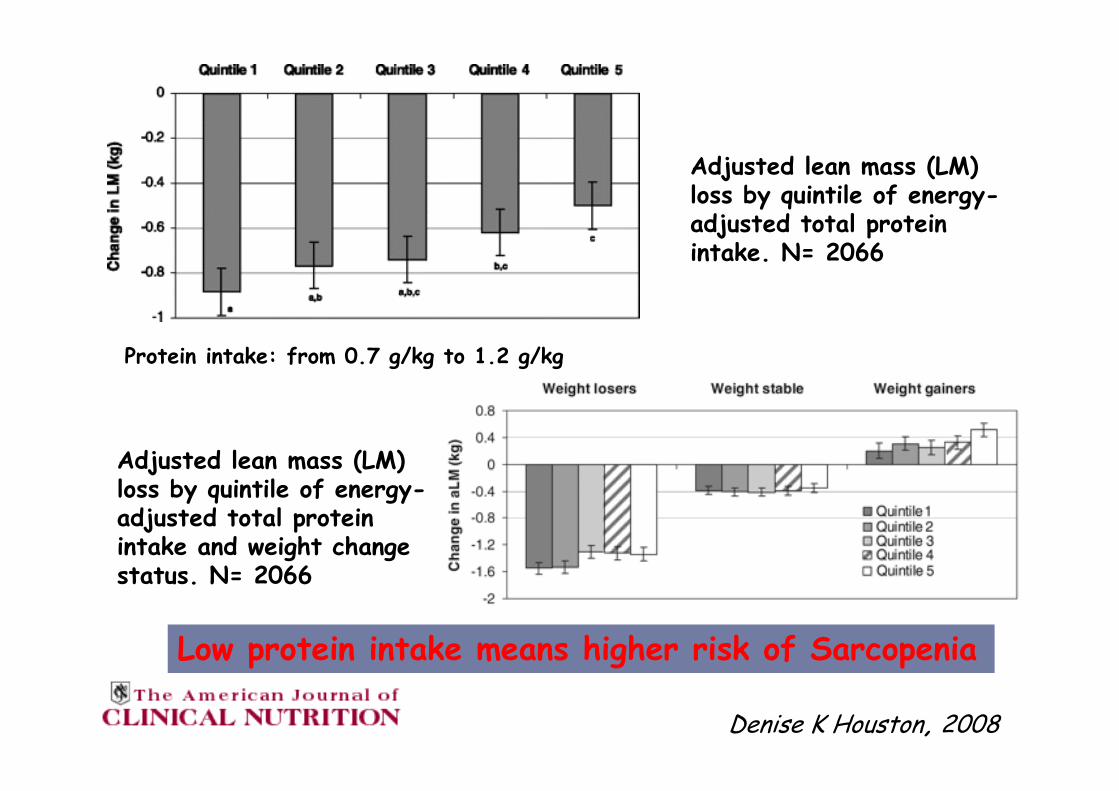
Denise K Houston, 2008
Adjusted lean mass (LM) loss by quintile of energy-adjusted total protein intake. N= 2066
Adjusted lean mass (LM) loss by quintile of energy-adjusted total protein intake and weight change status. N= 2066
Low protein intake means higher risk of Sarcopenia
Protein intake: from 0.7 g/kg to 1.2 g/kg

Protein intake (g/d) by age
Protein intake (g/kg body weigth) by age
NHANES 2003-2004
Fulgoni ,2008

0
25
50
75
100
125
mean 5° 10° 25° 50° 75° 90° 95°
Introito calorico e proteico in soggetti anziani di sesso femminIntroito calorico e proteico in soggetti anziani di sesso femminileile
Continuing Survey of Food Intakes by Individuals Continuing Survey of Food Intakes by Individuals
(15000 soggetti, con et(15000 soggetti, con etàà di 60, 70, 80 e oltre) di 60, 70, 80 e oltre)
0
500
1000
1500
2000
2500
mean 5° 10° 25° 50° 75° 90° 95°
calorie (kcal)
60-69 anni 70-79 anni 80+ anni
Protein (g)
Wakimoto & Block, 2001
Percentili
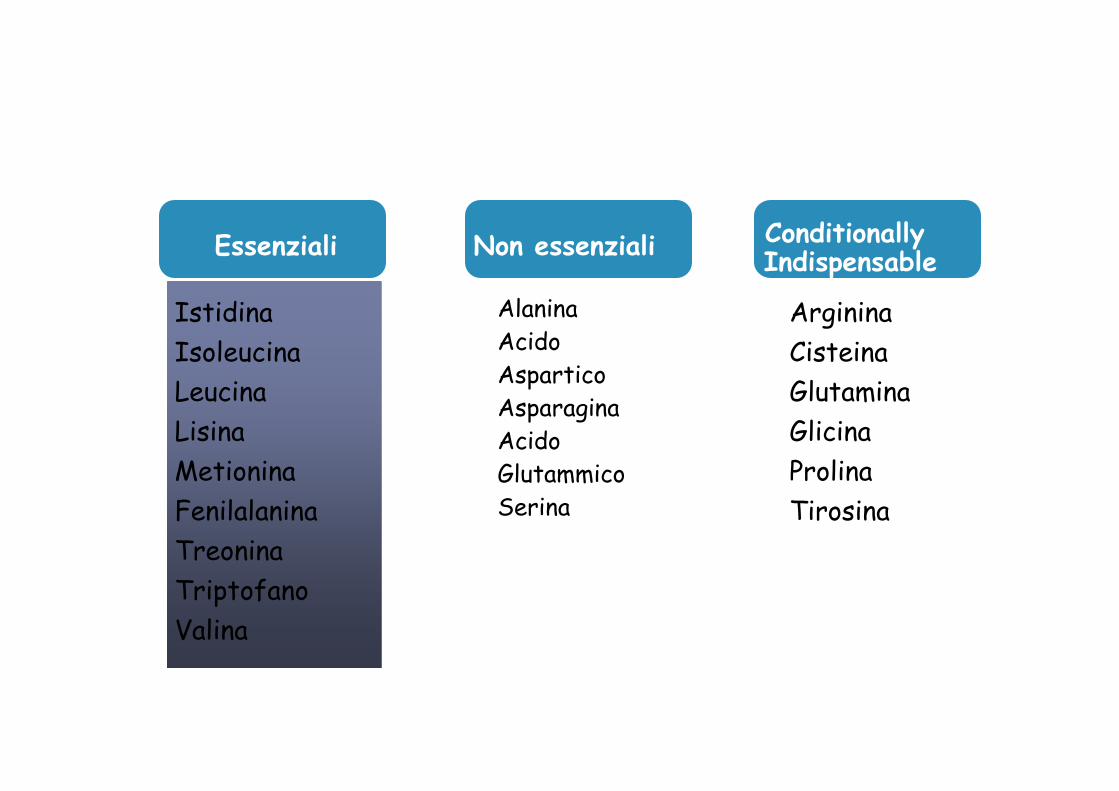
Istidina
Isoleucina
Leucina
Lisina
Metionina
Fenilalanina
Treonina
Triptofano
Valina
Non essenziali
AlaninaAcidoAsparticoAsparagina AcidoGlutammicoSerina
Arginina
Cisteina
Glutamina
Glicina
Prolina
Tirosina
Conditionally Indispensable
Essenziali
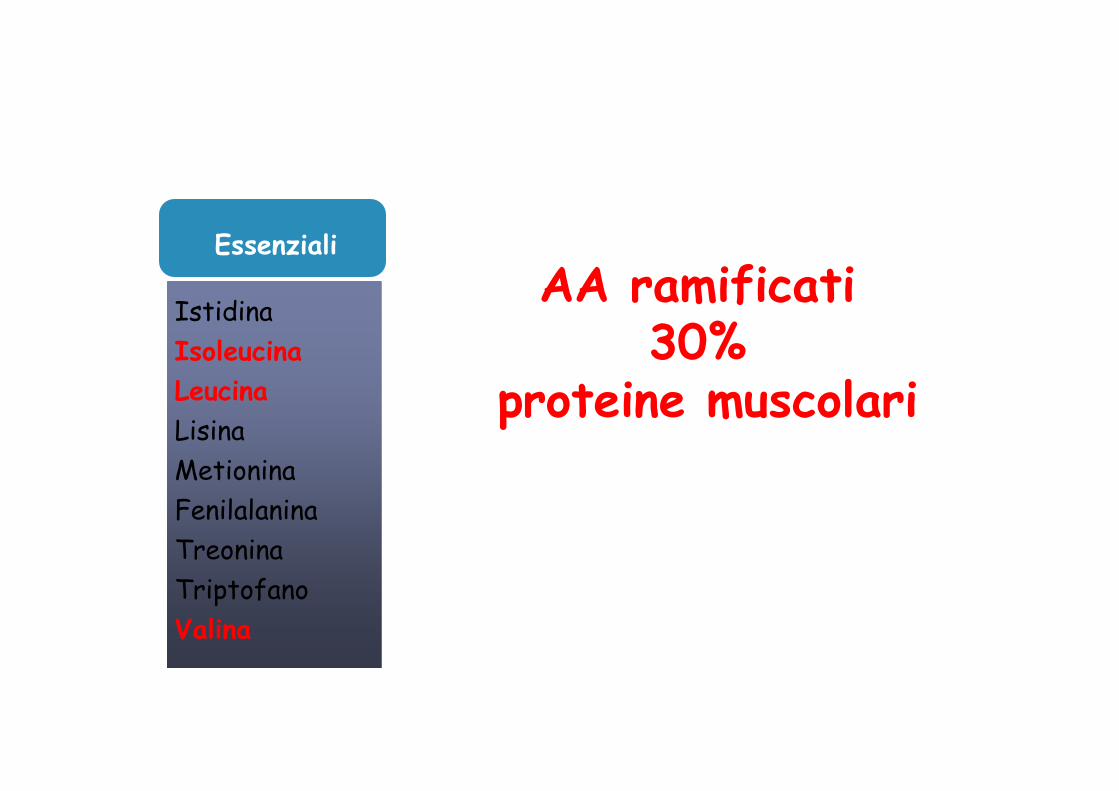
Istidina
Isoleucina
Leucina
Lisina
Metionina
Fenilalanina
Treonina
Triptofano
Valina
Essenziali
AA ramificati30%
proteine muscolari
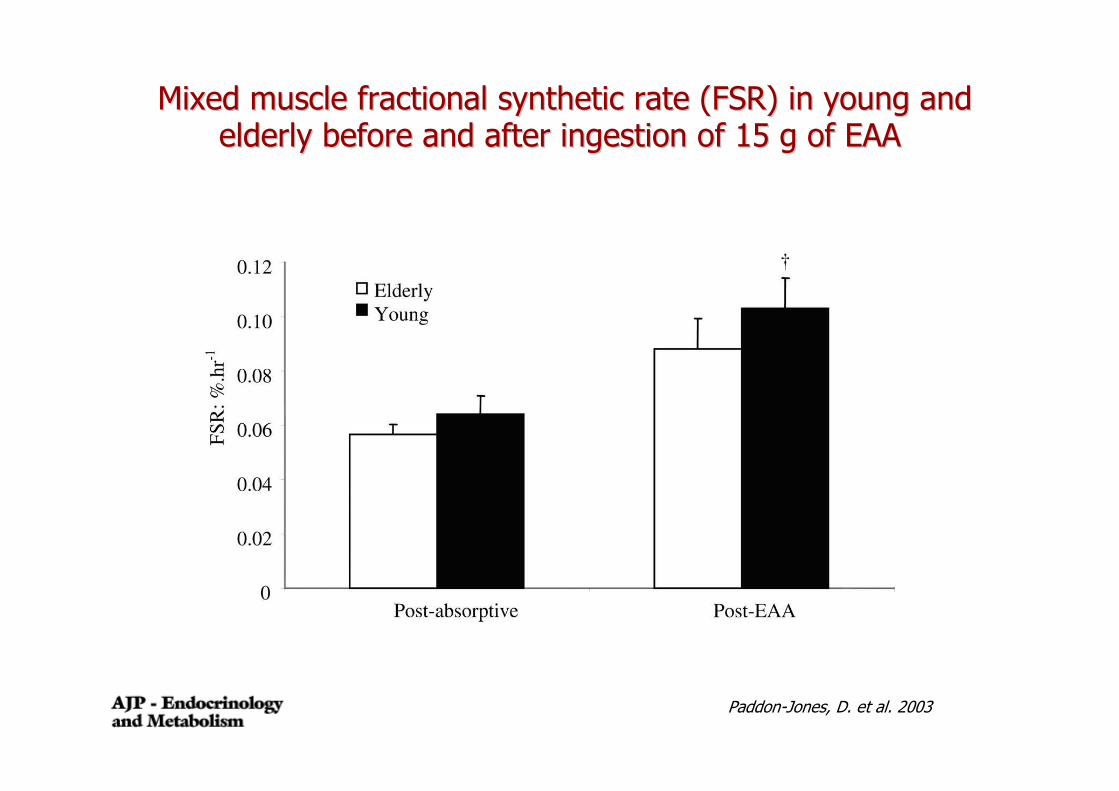
Paddon-Jones, D. et al. 2003
Mixed muscle fractional synthetic rate (FSR) in young and Mixed muscle fractional synthetic rate (FSR) in young and elderly before and after ingestion of 15 g of EAAelderly before and after ingestion of 15 g of EAA
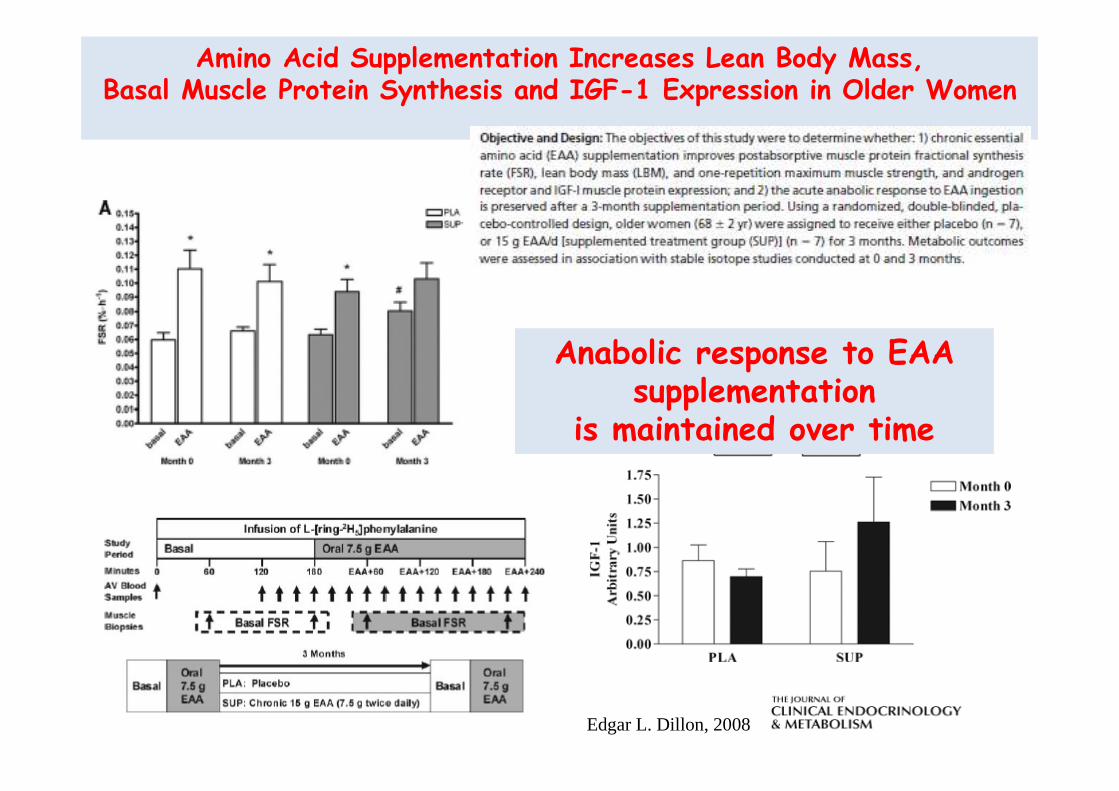
Amino Acid Supplementation Increases Lean Body Mass,Basal Muscle Protein Synthesis and IGF-1 Expression in Older Women
Edgar L. Dillon, 2008
Anabolic response to EAA supplementation
is maintained over time

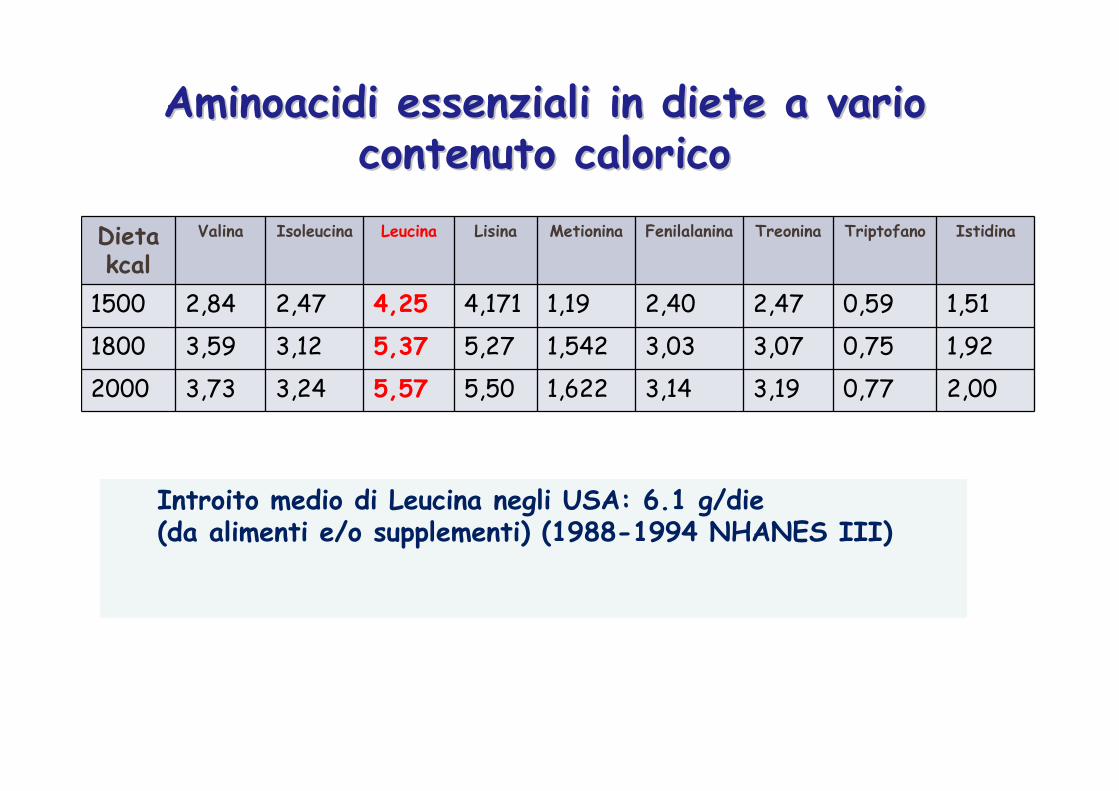
Dietakcal
Valina Isoleucina Leucina Lisina Metionina Fenilalanina Treonina Triptofano Istidina
1500 2,84 2,47 4,25 4,171 1,19 2,40 2,47 0,59 1,51
1800 3,59 3,12 5,37 5,27 1,542 3,03 3,07 0,75 1,92
2000 3,73 3,24 5,57 5,50 1,622 3,14 3,19 0,77 2,00
Aminoacidi essenziali in diete a vario Aminoacidi essenziali in diete a vario contenuto calorico contenuto calorico
Introito medio di Leucina negli USA: 6.1 g/die (da alimenti e/o supplementi) (1988-1994 NHANES III)
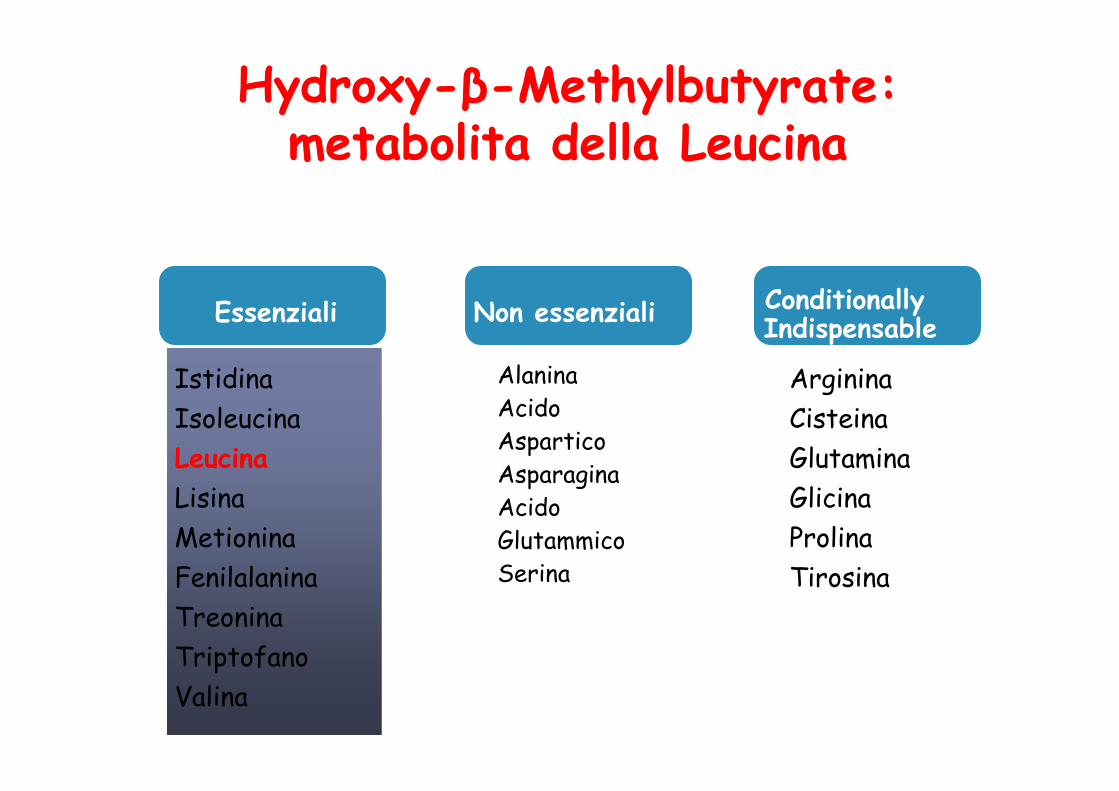
Istidina
Isoleucina
Leucina
Lisina
Metionina
Fenilalanina
Treonina
Triptofano
Valina
Non essenziali
Hydroxy-β-Methylbutyrate: metabolita della Leucina
AlaninaAcidoAsparticoAsparagina AcidoGlutammicoSerina
Arginina
Cisteina
Glutamina
Glicina
Prolina
Tirosina
Conditionally Indispensable
Essenziali
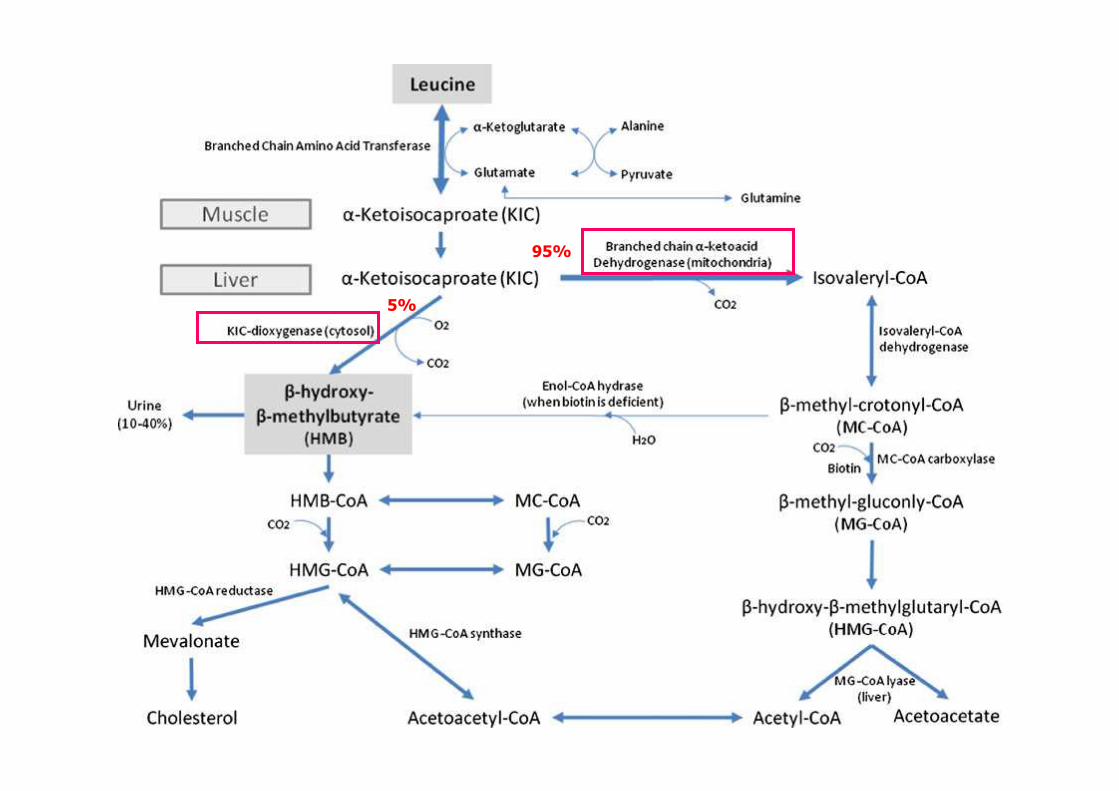
5%
95%

Studi in vitro: meccanismi d’azione
In colture di miociti:aumenta sopravvivenza cellule
muscolari satelliti ed inibisce apoptosi
Kornasio et al, 2009
Nei ratti inoculati con epatomaaumenta
fosforilazione mTOR a livello del muscolo gastrocnemio
previene:perdita di peso
decremento massa gastrocnemio
Aversa et al 2011
Inibizione caspasi 8 e 3
Smith HJ, et al. Cancer Res. 2005

Change in Muscle Strength During HMB Supplementation
Nissen S, et al. J Appl Physiol. 1996;81(5):2095-2104.
aP < .03 bP < .02 cP < .01
� 41 healthy young adults (19-29 years), untrained� 2 protein levels: 117 g/day (control) or 175 g/day
− Diet was controlled, nutrient powder in a shake� 3 HMB supplementation doses randomized and blinded within each protein group
− 0, 1.5, or 3.0 g/day Mixed in orange juice� Weight training for 1.5 hours 3 days/week for 3 weeks
� Data from control and high protein groups were pooled because there was no difference in HMB results
� Overall muscle strength increased at 3 weeks
− 8% in control group− 13% in 1.5 g HMB group− 18% in 3.0 g HMB group
800
600
400
200
0
Week 1
Chan
ge in
tota
l bod
y st
reng
th,
kg
-200
Week 3
a
Control1.5 g HMB3.0 g HMB
cb
b

Change in Urinary 3-Methylhistidine (3-MH) Excretion During HMB Supplementation
Nissen S, et al. J Appl Physiol. 1996;81(5):2095-2104.
� 3-MH is a muscle-specific amino acid− Formed during breakdown of muscle proteins (actin and myosin)− Excreted unchanged in urine
aP < .04bP < .001
� Total muscle breakdown per day increased from 3% at baseline to− 6% at week 3 in control group− 5.5% at week 3 in 1.5 g HMB group− 4.5% at week 3 in 3.0 g HMB group
100
80
60
40
20
Week 1
% C
han
ge in
3-M
H f
rom
bas
al
-20Week 3
a
Control1.5 g HMB3.0 g HMB
b
Week 2
0
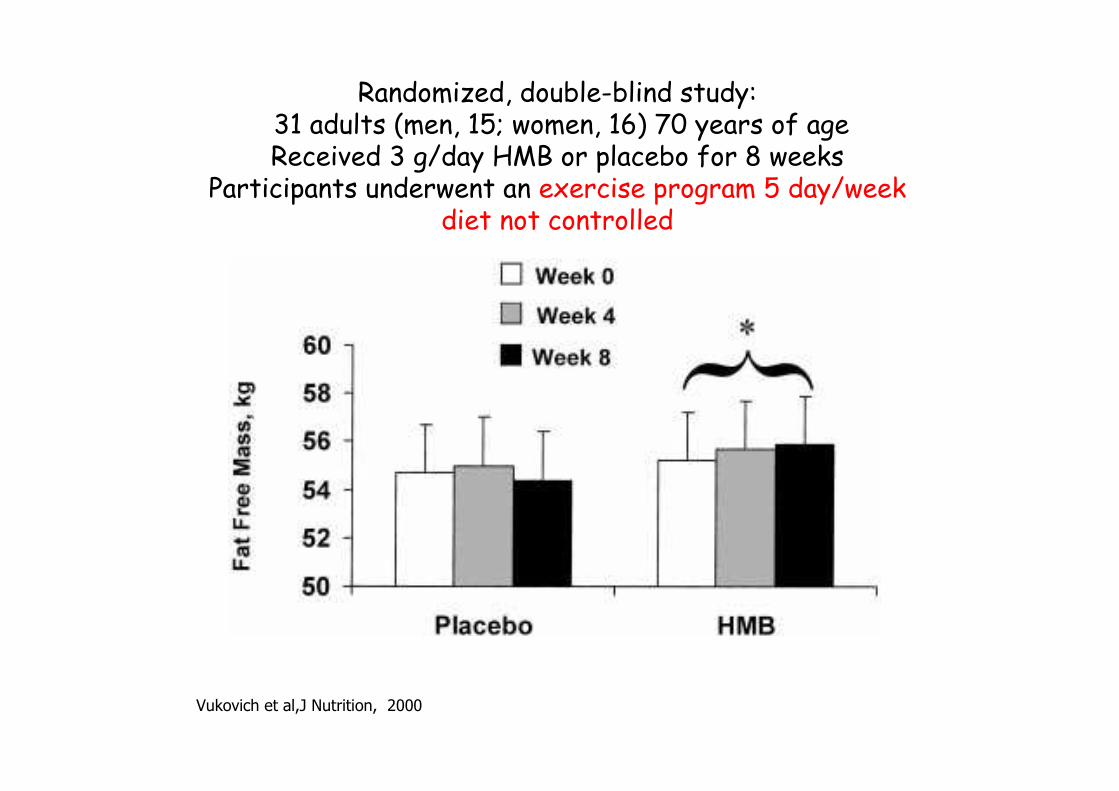
Vukovich et al,J Nutrition, 2000
Randomized, double-blind study: 31 adults (men, 15; women, 16) 70 years of ageReceived 3 g/day HMB or placebo for 8 weeks
Participants underwent an exercise program 5 day/weekdiet not controlled

Double blind study
Flakol et al, 2004
Double-blind study in old women (76,7 years)2 g HMB (n 23) vs placebo (n 27)
12 weeks: no exercise
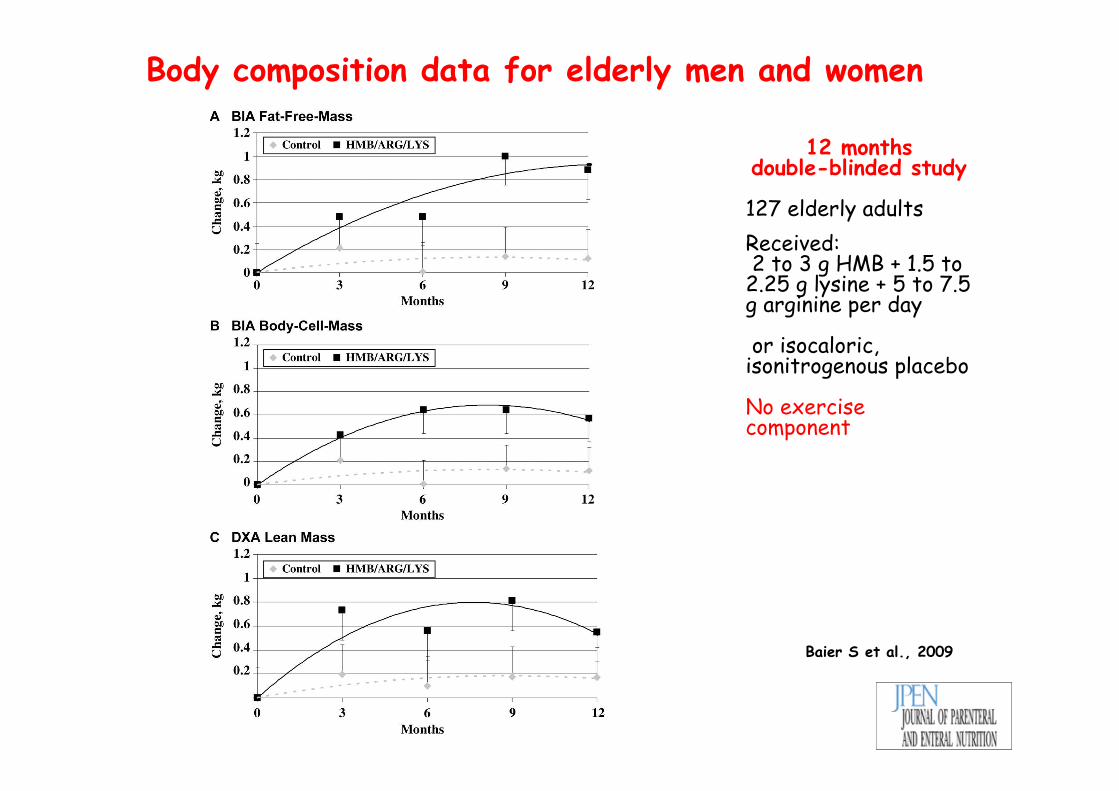
Body composition data for elderly men and women
Baier S et al., 2009
12 months double-blinded study
127 elderly adults
Received:2 to 3 g HMB + 1.5 to
2.25 g lysine + 5 to 7.5 g arginine per day
or isocaloric, isonitrogenous placebo
No exercise component
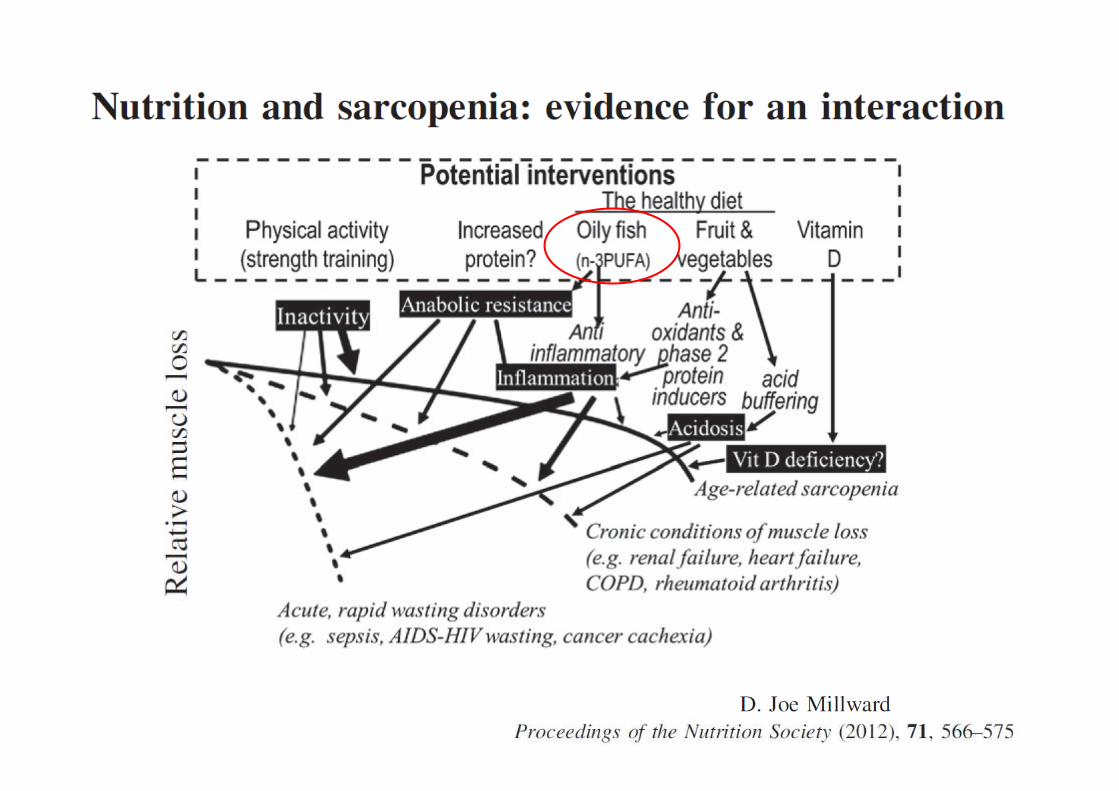
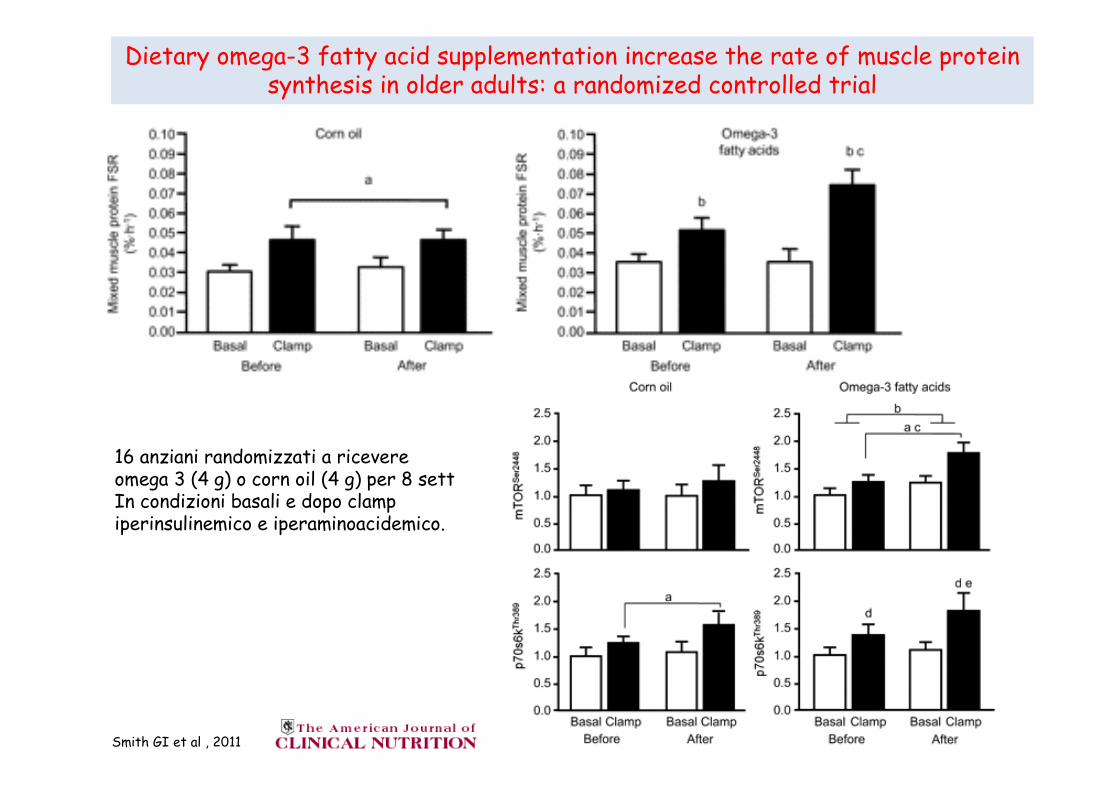
Dietary omega-3 fatty acid supplementation increase the rate of muscle proteinsynthesis in older adults: a randomized controlled trial
Smith GI et al , 2011
16 anziani randomizzati a ricevere omega 3 (4 g) o corn oil (4 g) per 8 settIn condizioni basali e dopo clamp iperinsulinemico e iperaminoacidemico.


The Minos study: 845 men aged 45-85 years
Szulc et al, 2004

Vitamina D
• Ipovitaminosi D associata ad atrofia fibre di tipo II
• Livelli Vitamina D associati a forza muscolare
• Supplemantazione Vitamina D aumenta forza muscolare e sembra ridurre il rischio di caduta
• Bassi livelli di vitamina D associati ad aumentato rischio di miopatia da statina

Adherence to Mediterranean diet and decline in walking speed
over 8 years in community-dwelling older adultsShahar DR, 2012
H-ABC study
2225 well functionining participants
older than 70 years
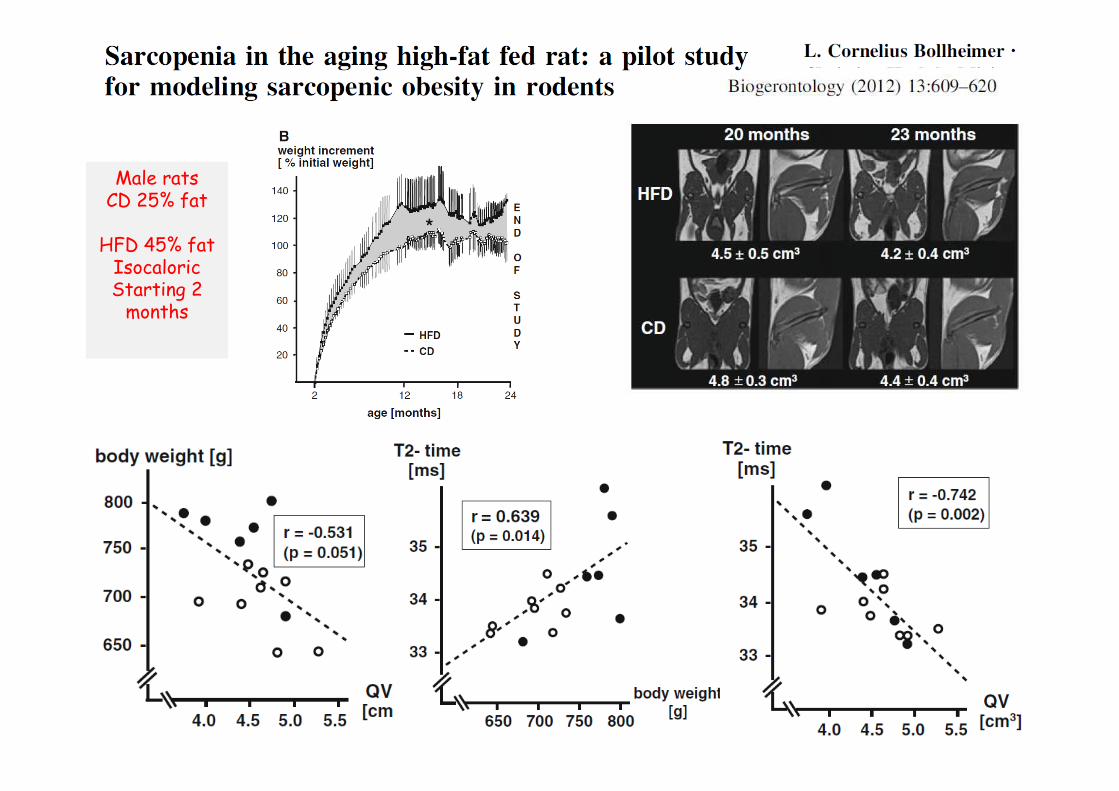
Male ratsCD 25% fat
HFD 45% fatIsocaloric Starting 2
months
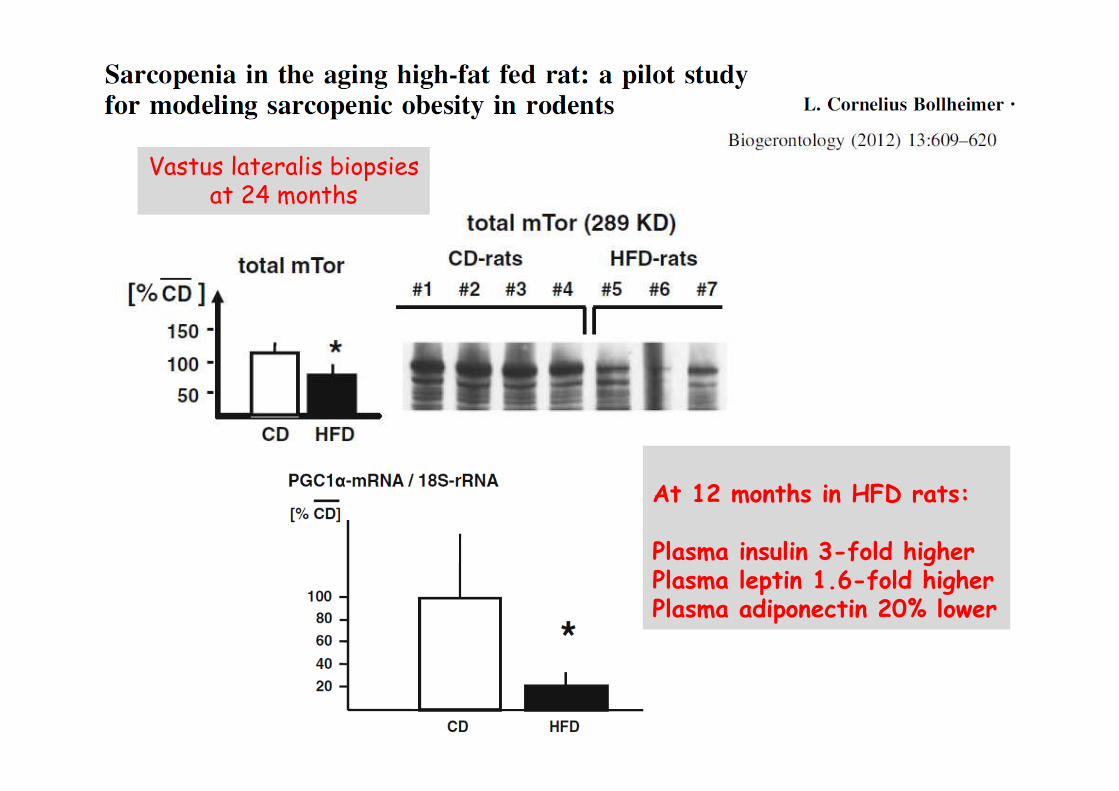
Vastus lateralis biopsiesat 24 months
At 12 months in HFD rats:
Plasma insulin 3-fold higherPlasma leptin 1.6-fold higherPlasma adiponectin 20% lower
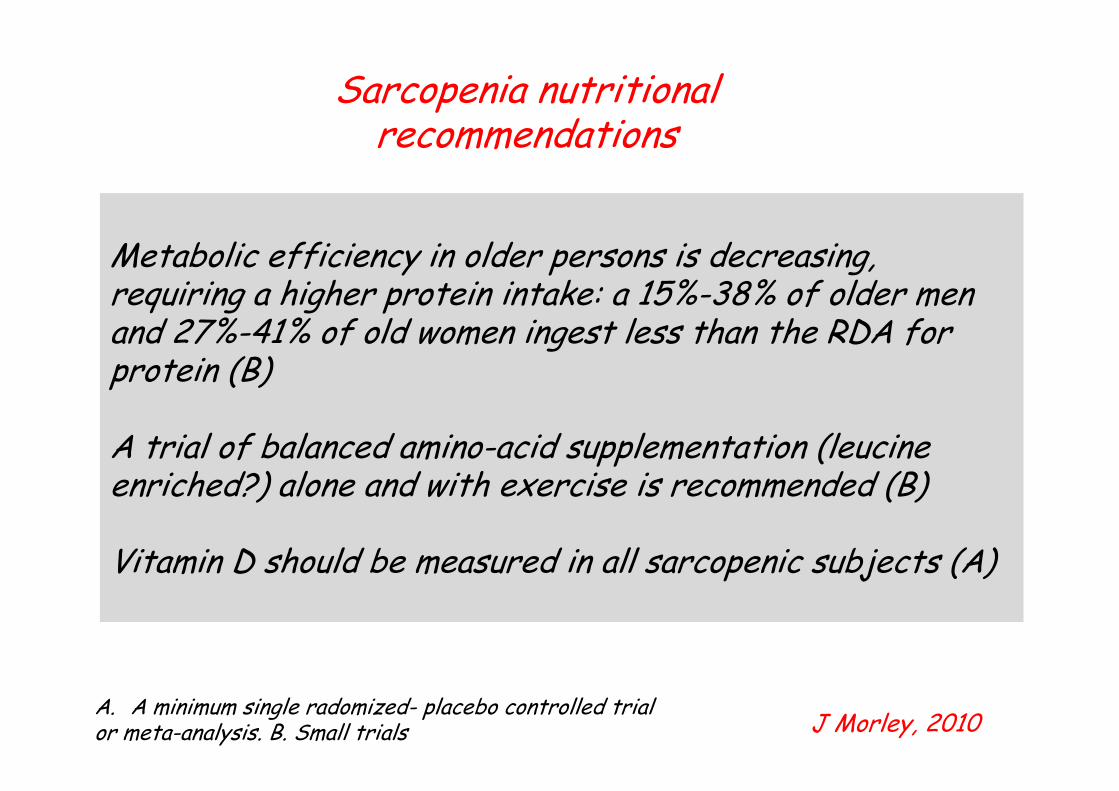
Sarcopenia nutritional recommendations
Metabolic efficiency in older persons is decreasing, requiring a higher protein intake: a 15%-38% of older men and 27%-41% of old women ingest less than the RDA for protein (B)
A trial of balanced amino-acid supplementation (leucine enriched?) alone and with exercise is recommended (B)
Vitamin D should be measured in all sarcopenic subjects (A)
J Morley, 2010A. A minimum single radomized- placebo controlled trial or meta-analysis. B. Small trials
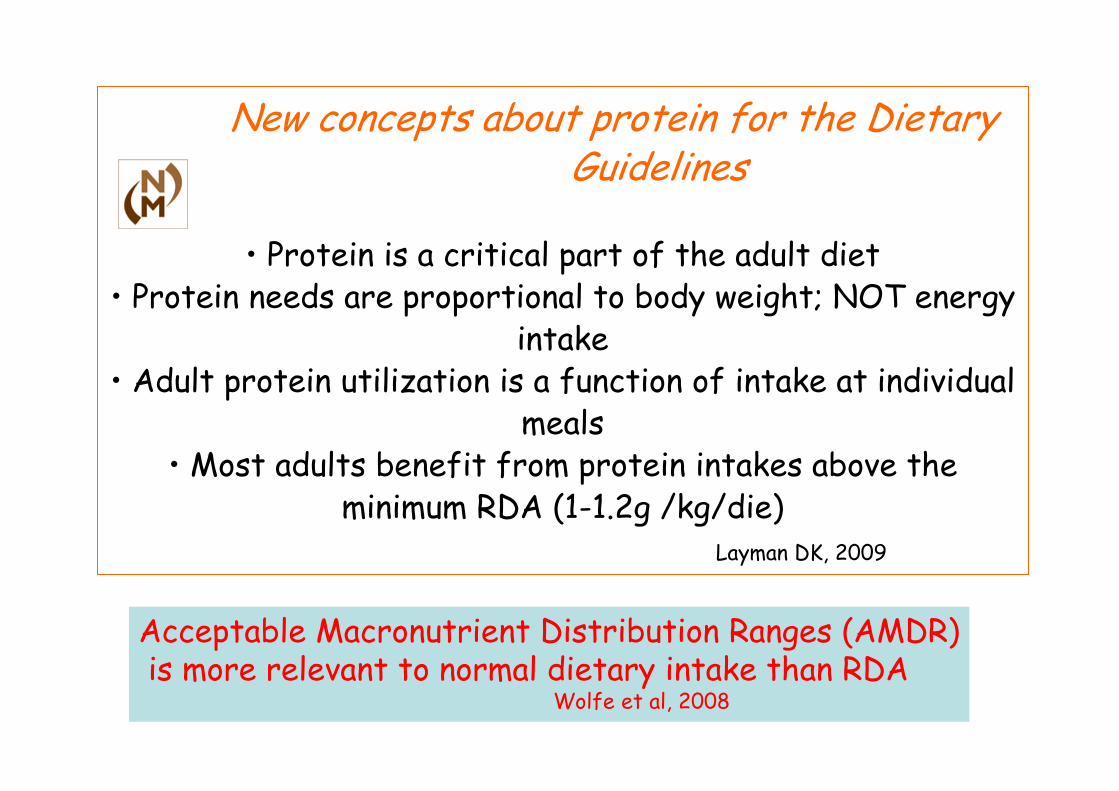
New concepts about protein for the Dietary Guidelines
• Protein is a critical part of the adult diet• Protein needs are proportional to body weight; NOT energy
intake• Adult protein utilization is a function of intake at individual
meals• Most adults benefit from protein intakes above the
minimum RDA (1-1.2g /kg/die)Layman DK, 2009
Acceptable Macronutrient Distribution Ranges (AMDR)is more relevant to normal dietary intake than RDA
Wolfe et al, 2008

Donald K Layman, 2009
Protein distribution at meals. A) Ingestion of 90 grams of protein, distributed evenly at 3 meals.
B) Ingestion of 90 grams of proteins unevenly distributed throughout the day. Stimulating
muscle protein synthesis to a maximal extent during the meals shown in Figure 1A is more likely
to provide a greater 24 hour protein anabolic response than the unequal protein distribution in
Figure 1B.
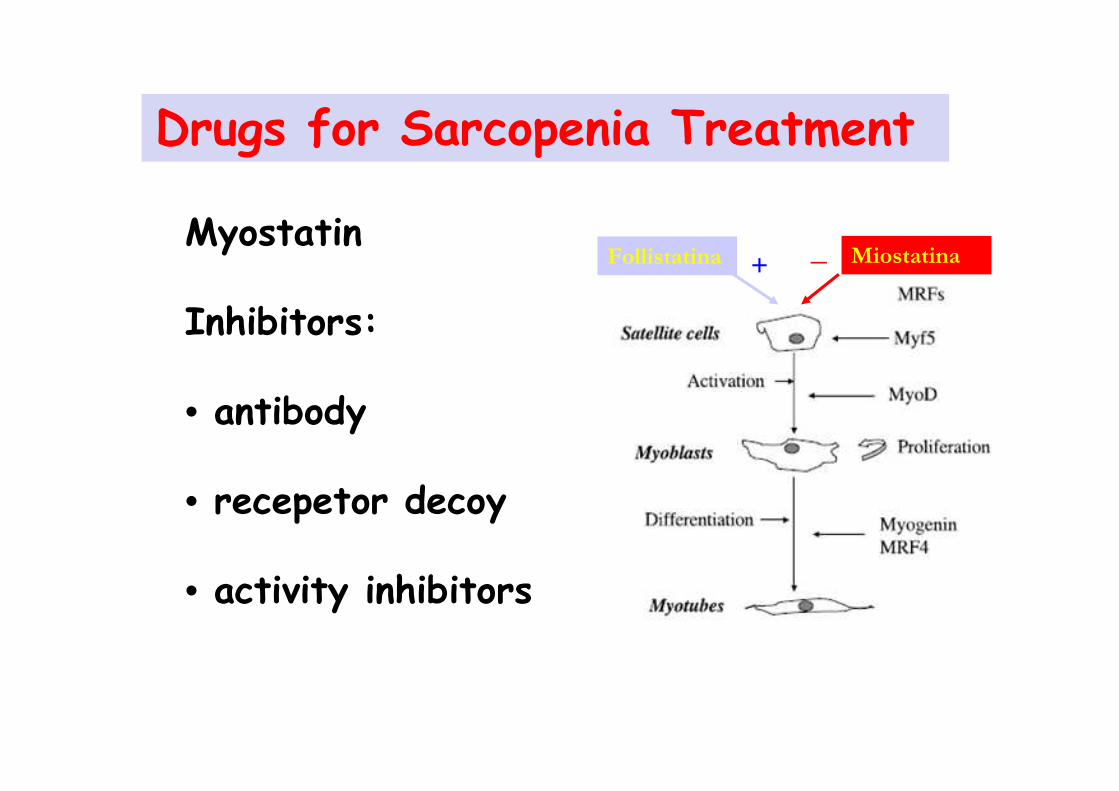
Drugs for Sarcopenia Treatment
Myostatin
Inhibitors:
• antibody
• recepetor decoy
• activity inhibitors
Follistatina Miostatina_+

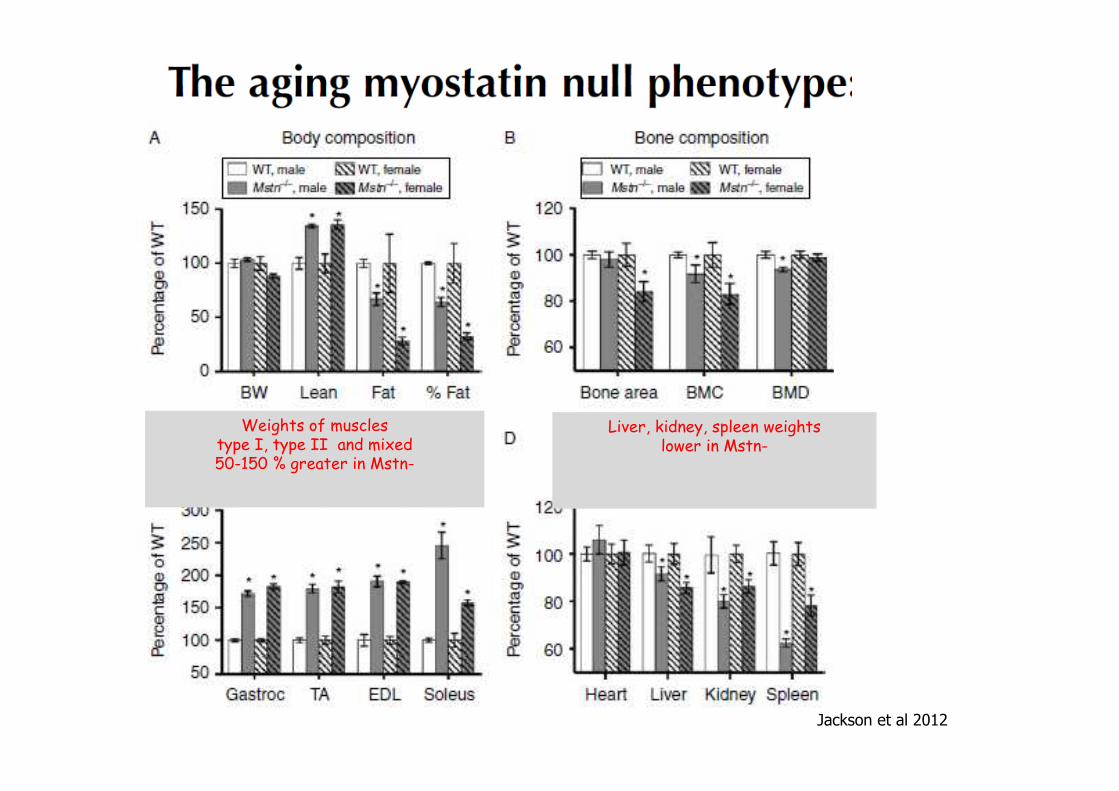
Jackson et al 2012
Weights of muscles type I, type II and mixed50-150 % greater in Mstn-
Liver, kidney, spleen weights lower in Mstn-
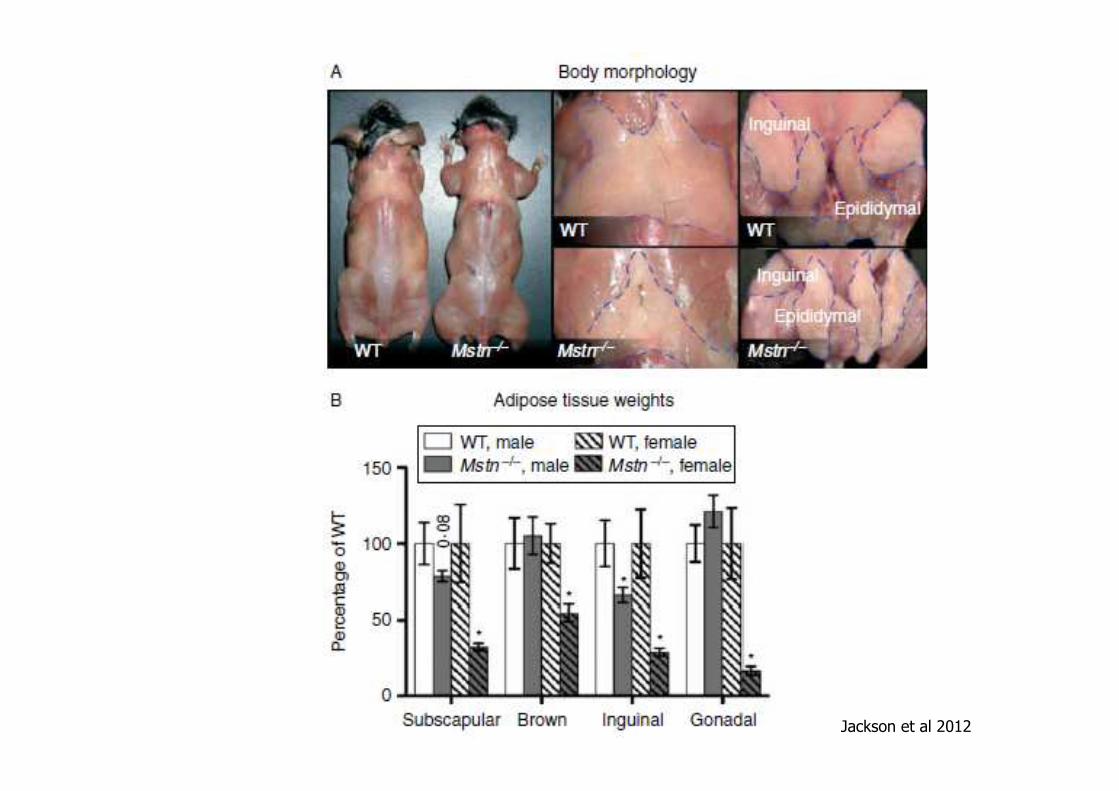
Jackson et al 2012
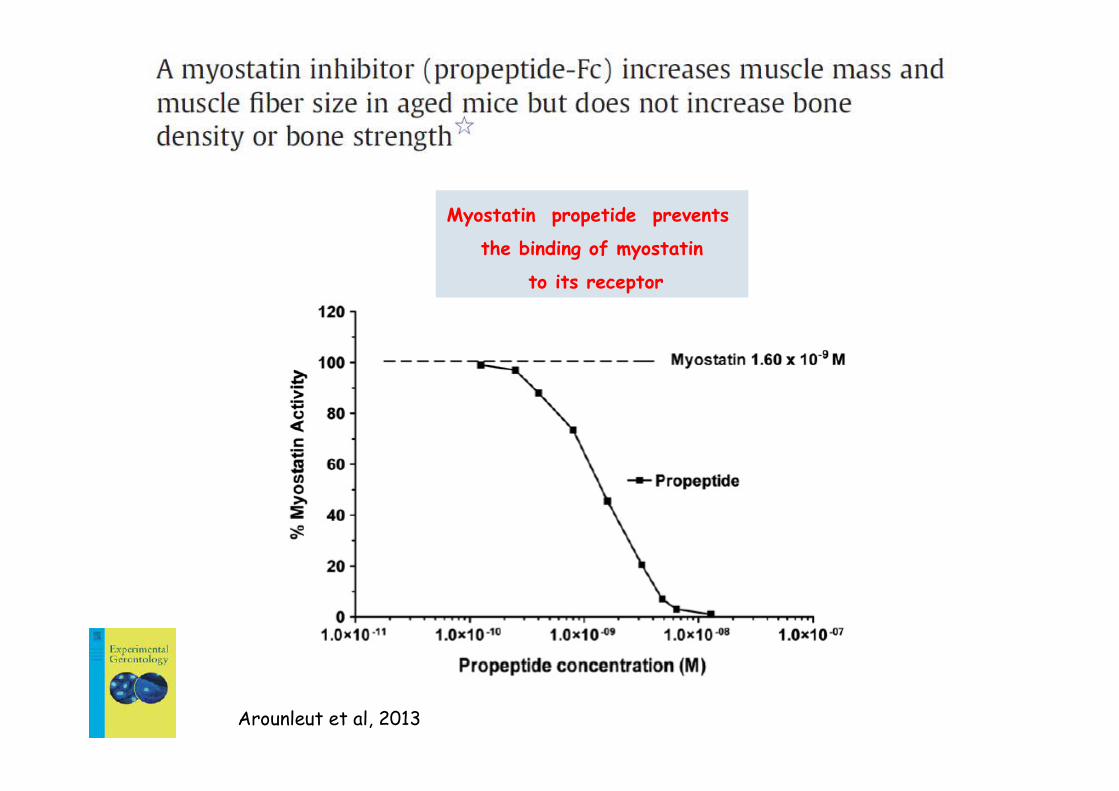
Arounleut et al, 2013
Myostatin propetide prevents
the binding of myostatin
to its receptor

Arounleut et al, 2013
Male mice 22-m old: 20mg/kg myostatin propeptide (PRO) body weight i.p. for 25 days vs vehicle (VEH)

Arounleut et al, 2013
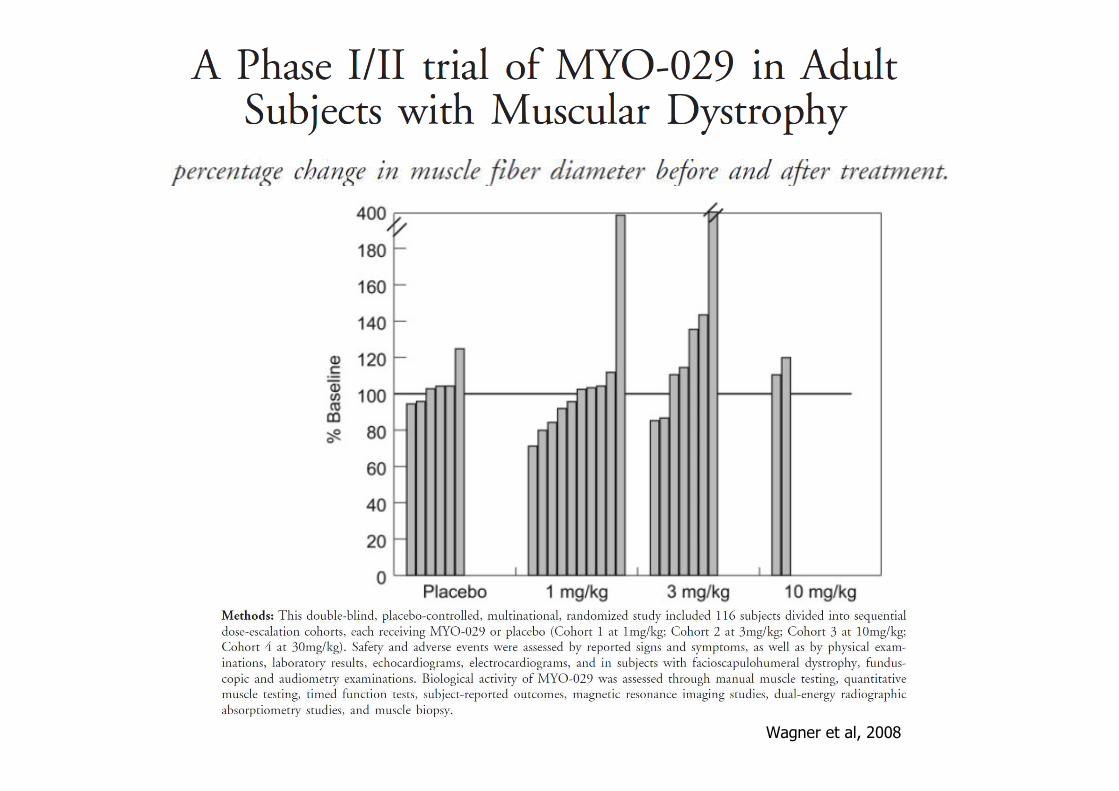
Wagner et al, 2008

Drugs for Sarcopenia Treatment:
Ancillary Effects
•Ace-Inhibitors ?
• Statin ?
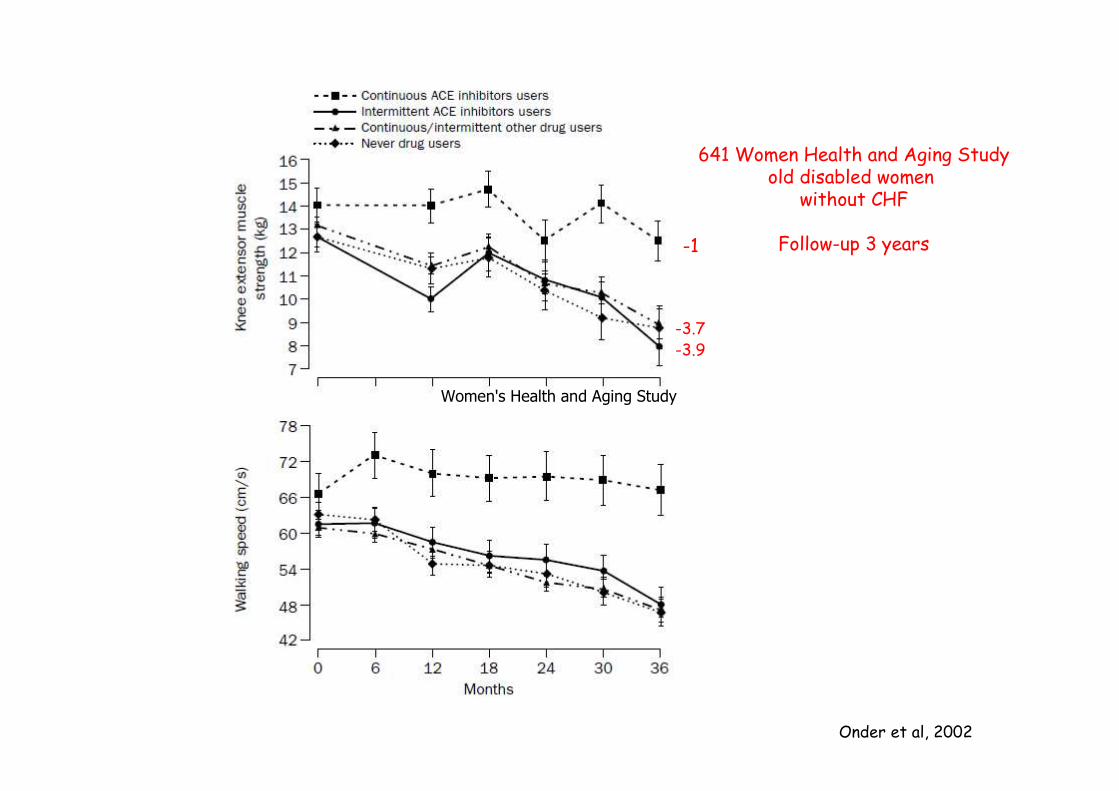
Onder et al, 2002
641 Women Health and Aging Studyold disabled women
without CHF
Follow-up 3 years
Women's Health and Aging Study
-1
-3.7-3.9
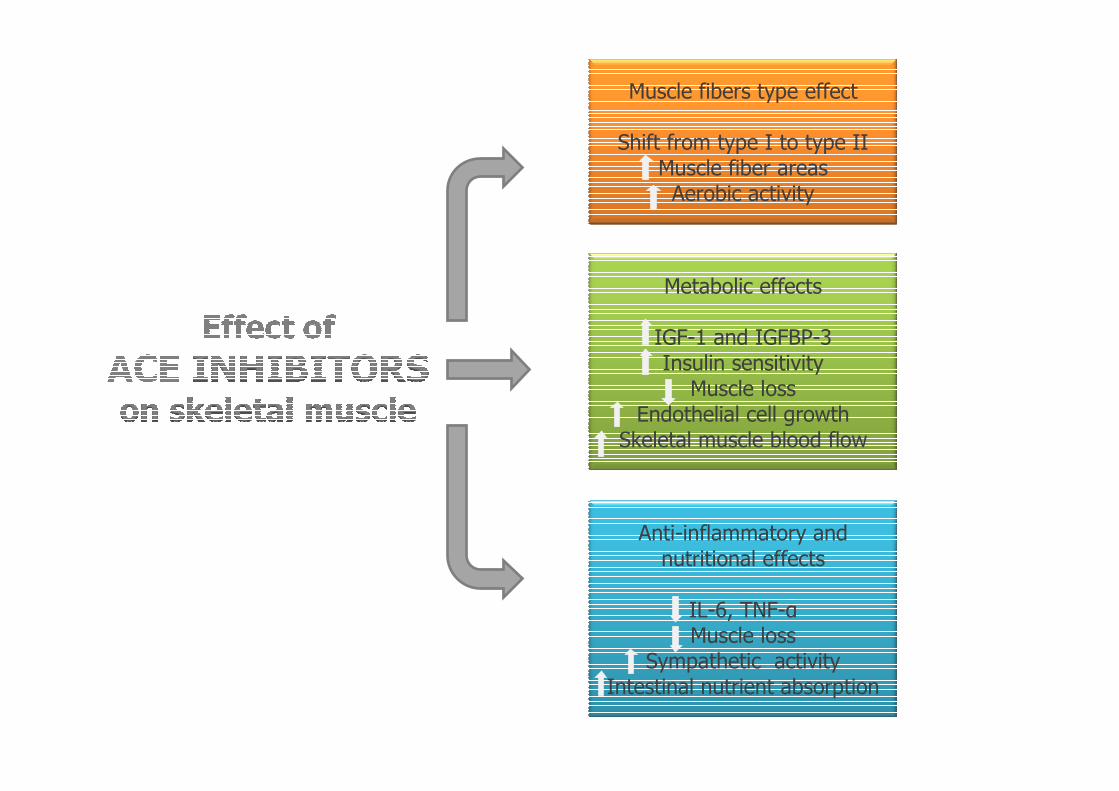
Muscle fibers type effect
Shift from type I to type IIMuscle fiber areas
Aerobic activity
Metabolic effects
IGF-1 and IGFBP-3Insulin sensitivity
Muscle lossEndothelial cell growth
Skeletal muscle blood flow
Anti-inflammatory and nutritional effects
IL-6, TNF-αMuscle loss
Sympathetic activityIntestinal nutrient absorption
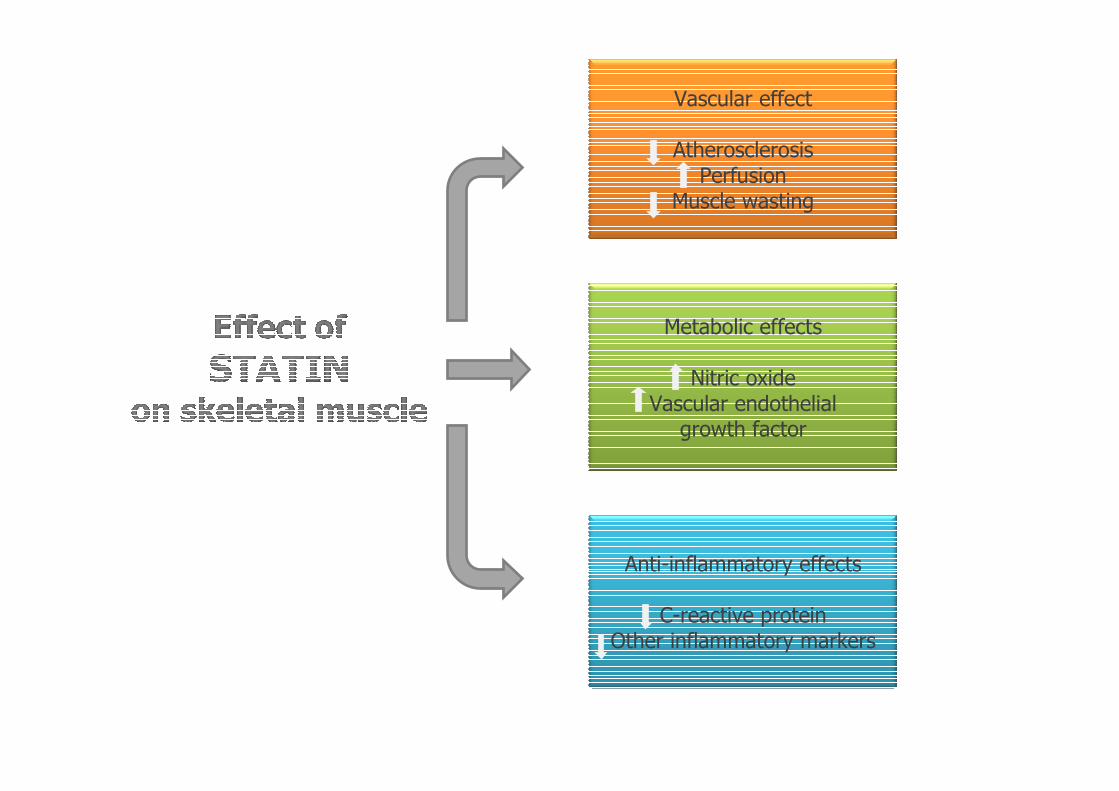
Vascular effect
AtherosclerosisPerfusion
Muscle wasting
Metabolic effects
Nitric oxideVascular endothelial
growth factor
Anti-inflammatory effects
C-reactive proteinOther inflammatory markers