landslide hazard mapping and risk assessment using gis

1
Landslide Hazard Mapping and Risk Assessment Using GIS. Case of Nyabihu District, Rwanda Emile Niyonkuru, BSc 1* ; Bryant Hirwa Shimwa, BSc. 1 ; Charles Mwafurika,BSc 1 and Maurice Mugabowindekwe, MSc 1 , 1 Department of Civil,Environment and Geomatics Engineering, School of Engineering, College of Science and Technology, University of Rwanda, Kigali Emile NIYONKURU & Bryant HIRWA SHIMWA UNIVERSITY OF RWANDA Email:[email protected], [email protected] Phone: +250 787 741 030, +250 782 614 235 Contact 1. Dai , Lee, Ngai, 2002. Landslide risk assessment and management. s.l.:Elsevier Science B.V. 2. Alpha, T. R., 1991. How to construct Four Paper Models that Describe Isaland Coral reefs, s.l.: U.S. Geological Surveying. 3. Basharat, M., 2012. The distribution, characteristics and behaviour of mass movement striggered by the Kashmir Earthquake NW Himalaya,. Muzaffarabad: Fakultät der Friedrich-Alexander-Universität Erlangen. 4. By Lynn M. Highland, and Peter Bobrowsky, 2008. The Landslide Handbook- A Guide to Understanding Landslides. Virginia: U.S. Geological Survey, Reston, Virginia. 5. Causes and Types of Landslides (n.d.). 6. Cesar Augusto, Johnny Alexander Vega, and Milissa Parra Obando, 2018. Effect of the Rainfall Infiltration Processes on the Landslide Hazard Assessment of Unsaturated Soil in Tropical Mountainous Region. s.l.:Interchopen. 7. Department of Natural Resources, F., n.d. Landslide Mitigation Strategies. s.l.:s.n. 8. Dibanga B. Placide, M. V. & Gatera Frederic, B. D. o. R., 2017. State of Hydrogeological DIisasters in Northwestern Rwanda. East African Journal of Science and Technology, Vol.7(Issue1), pp. 1-25. 9. Diop, Colin, Chiliza, 2010. Landslide inventorization and susceptibility mapping in South Africa. ResearchGate, Volume 7, pp. 207-210. 10.Forum, W. L., 2017. Landslide Risk Assessment for the Built Environment in Sub-Saharan Africa. Nottingham, Springer International Publishing. References Rwanda’s landscape is generally hilly and mountainous, with elevation ranging from 950 above sea level (ABSL) m in Bugarama plain in South West, to 4,507 m ABSL on top of Mount Kalisimbi in the Northern highlands. The country’s average altitude is about 1,700 m ABSL. Some regions of the country, mainly the Northern and Western provinces, are mostly dominated by high altitudes with steep slopes, which often cause the landslides in the region, especially during rainy seasons. Consequently, the landslides lead to frequent disruption in traffic movement, and endanger people’s lives and properties. Nyabihu district located in Western province, is one of the areas mostly affected by landslides, with most of the areas prone to the hazard. Through DEM generation, weighting overlay and rating, and ground- truthing, this research identified and mapped the districts’ areas prone to the landslides and their level of exposure. Factors including slope, rainfall, soil type, and soil depth were taken into consideration and rated according to their influence to landslide occurrence. This led to the analysis of the probability of every area of the district to fall under different landslide susceptibility categories: low, medium or high, and a district landslide hazard susceptibility map was generated. According to this research, areas of the district were ranked depending on the available social infrastructure and population density, with respect to the landslide susceptibility category of the areas, in order to generate the level of exposure (risk) of the areas to the landslide hazard. The research found that 7.83 % of the district is highly susceptible to the landslide hazard, while 89.74% of the district is moderately susceptible to the hazard, and 2.43% of the district is lowly vulnerable to the landslides. According to this research, sectors of the district including Mulinga, Jomba and Rurembo have been found to be at high risk of the landslides hazard, given the fact that they are located in high risk zone of the hazard and encounter a large number of social infrastructures (roads, hospitals, schools, etc.) with high population density 485.2 inhabitants/km 2 . The research proposes a number of potentially effective remedial actions to combat the effects of the landslides in the district. Finally, the research highlights that further research projects can consider more factors including influence of gravity, soil erodibility, rainfall erosivity, and other geologic and geomorphologic factors, in order to establish a fully detailed landslide susceptibility of the district. Abstract For mapping high risk zones of the study area, five factors namely rainfall, soil type and depth, Land Use/Cover and slope have been considered. Each causal factor with its level of influence has been analyzed and the outcome demonstrates how enormously landslide hazards are distributed across the entire region of Nyabihu district It had been found with steep slope with the highest pick of almost 88 degrees in North of the region, annual rainfall varies between 1000 and 1924 mm which has greater influence in landslide occurrence, highly dominated by sandy soil as type of soil, dominated with deep soil known to hold large amount of water consequently resulting into slope failure and lastly land cover which is an open Agriculture that occupied large surface of 40% of the total areas. Referring to the analysis resulted from the computation of various essential parameters and criteria necessary for its occurrence, landslide hazard map of Nyabihu district has been generated using Spatial Multi-Criteria Evaluation in ArcMap. For mapping high risk zones of the study area, five factors were assigned weighted where rainfall 24%, soil type 18% and depth 12%, Land Use/Cover 14% and slope 32% have been considered. Each causal factor with its level of influence has been analyzed and the outcome demonstrates how enormously landslide hazards are distributed across the entire region of Nyabihu district. The quantification of three kind of selected elements namely social (schools, hospital), and physical(roads) infrastructures and populations number has been taken into consideration on the basis of each sector of Nyabihu district. Each element categorized into ranges each with three classes and assigned different values 1,2,3 representing sector with low risk, moderate, high risk respectively through method known as rating. Rating and ranging were classified according to the number or quantity of selected elements available in each sector by ensuring the balance between elements being less, moderate and highly affected. Introduction This research adopted the classification by rating and fit to be weighted overlay. During data analysis, different factors were classified according to rating assigned to each factor causing landslide. A rating between 1 and 3 was assigned to each key factor. This introduced, after getting the classification of all key factors, each factor was assigned a weight depending to its own level of potential influence to cause slope failures (MIDIMAR, 2015). It is indicated that at time landslide happened, different factors will contribute depending at different level of their nature. A weight of 1 is given the meaning of absence influence factor, 2 as a moderate influence while 3 implied highly presence influence of the factor as these provided values were adopted on the basis of other related researches, field information and analytical thinking. Here, is a detailed flowchart illustrating the methods used for a complete study of landslide hazard mapping and risk assessment in Nyabihu district. Methods and Materials One of the major concern of this study was to analyse the key factors or parameters causing landslide in Nyabihu district. Specifically, the research focused on five parameters including slope, rainfall, soil type, land cover/use and soil depth which finally used to assess areas prone to landslide by mapping landslide hazard in this district. The influence of soil type on landslide occurrence goes hand in hand with soil depth, because the properties of soil is analyzed mostly on the basis of its type and depth. Through spatial Analyst in GIS, the above discussed factors were combined to produce landslide hazard map. To combine these factors for producing such map weighted overlay methods or approach has been used where by each factor assigned weighted value depend on its level of impact for landslide occurrence as it can be indicated where these values adapted by referring to the literatures researches and the information gathered on the field. Thus using ArcGIS spatial analysist module, the produced map was classified into three classes namely low hazardous, moderate hazardous and high hazardous as indicated in the Figure 4, which clearly shown that most part of Nyabihu district are likely to experience landslide especially in south east part though other areas also are subjected to high hazardous zones. Landslide exposure assessment had provided useful information which could be used for protecting social and physical infrastructures again with population in given land of the district. Roads, schools, health centers and population were the only elements at risk have been assessed in this research. During assessing risks in Nyabihu District, 91 Schools have been assessed found 8 highly exposed, 83 as moderated at risk. Total 316 roads found 53.3% are in high danger while 45.7%, 1.3% moderate and low exposed respectively. 38.4% population of Nyabihu are in high risk zone exposed to landslide especially Bigogwe, Rambura, Mukamira and Jenda sectors of Nyabihu. Bigogwe and Rambura sectors in Nyabihu have been found the most 12 sectors in the District which are at stake of landslide exposure than other least sectors, while Kintobo sector less to landslide exposure. Discussion The aim of this research was to design a feasible platform and roadmap for landslides occurrence and risk assessment for areas prone to landslides in Nyabihu district. The study anchored on the effective mapping of areas with high susceptibility to landslides occurrence and conducting the risk assessment to quantify and analyse the amount of risk to be encountered for both physical, social and human environment. With the help of ArcGIS, triggering factors such as slope, rainfall, soil type, soil depth and land cover have been analysed and rating according to their level of influence to landslide occurrence. The study revealed that every area of the district falls into different landslide susceptibility categories namely high, moderate and low classes hazardous. It was found that areas of South-East of the district is highly susceptible and prone to landslides occurrence, with 7.83 % of the entire district highly susceptible to landslide hazards, 89.74% moderately susceptible to landslide hazards, and 2.43% of the district lowly susceptible and vulnerable to the landslides occurrence. Sectors of the district including Muringa, Jomba and Rurembo have been detected to be at stake of experiencing landslide hazards compared to other regions of the district given the fact that they are located in steep slopes and high risk zones. In addition to landslides hazard mapping for areas in high risk zones in Nyabihu district, risk assessment was an essential task to perform in order to conduct the whole study. The research shows that mostly affected sectors of the district, namely Muringa, Jomba and Rurembo, encounter a large number of social infrastructures (roads, hospitals, schools, etc.) with high population density 485.2 inhabitants/km 2. Therefore, through the provision of possible landslide relevant information to decision makers, engineers, scientific researchers and the general public on how enormous landslides are, this research highlights possible long term mitigation measures on how to efficiently control the risk of landslides occurrence. Some of them include measures on the stabilization of the slope through afforestation and building retaining walls. Policy makers in charge of disaster management also should find ways to relocate the local community living in high risk zones to areas of less impact so as to allow the sustainable development free from landslide hazards. Conclusion Landslides are considered to be one of the most dangerous hazards in the world which mostly affect the natural environment and human activities (Dibanga B. Placide & Gatera Frederic, 2017). Over the past decades, landslides led to various loss of lives, causalities as well as the destruction of social and economic activities in different areas around the world. Geographical phenomena such as steep slope, heavy rainfall, tectonic movements, changes in water levels, and various human activities such as deforestation, construction of roads and buildings as well as other underground human activities like mining have been considered to be the most causal agents to landslides. The Sub-Saharan Africa where Rwanda and other large parts of Eastern Africa are located, is a region which highly experiences natural hazards including landslides at a higher level compared to Western part of Africa where the probability of landslide hazards is at lower level of occurrence. Landslide hazards occurring in the region are mainly caused by heavy rainfall, steep slopes, soil type and deforestation, leading to social and economic impacts(UNISDR, 2008). Known countries to be prone to landslides in East Africa include Kenya, Ethiopia, and Uganda; a neighboring country to Rwanda. In 2010, over 350 people were killed by one landslide event in Uganda, and the Ugandan government called for an immediate mass re-settlement away from mountainous slopes of Mt. Elgon (Forum, 2017) Rwanda, known as a country of thousand hills, is characterized by a mountainous relief with the average elevation of around 1,700 meters. Parts of Northern and Western regions of the country are at high elevation due to their topography characterized by steep slopes which are often affected by landslides during rainy seasons (MIDIMAR, 2015). Nyabihu district is one of 7 Districts that make up the Western Province of Rwanda. It neighbors Rubavu district on the West, Ngororero on the South, Gakenke on the East, Musanze on the North-East, Rutsiro on the South-West, and Uganda on the North. The district comprises of 12 sectors subdivided into 73 Cells and 473 villages, with the population density estimated to be 556 inhabitants per square kilometer (Nyabihu, 2013). Jenda and Bigogwe sectors are the most populated sectors in the region. Sectors like Mukamira, Bigogwe, Jenda and Rambura are the only urbanized areas in the district (NISR, 2012). Geographically, the relief of Nyabihu is 90% rugged mountains with more than 55% of the total area characterized by steep slopes. It receives an annual rainfall closer to 1,400mm, creating a high risk for natural disasters including landslides and soil erosion which result into the destruction of both human activities and his environment (Nyabihu, 2013). The Soil property in Nyabihu district is sandy, clay, laterite and volcanic. Basically the sandy and permeable soil type found especially in Bigogwe, Jenda and Rambura sectors of Nyabihu district are among the main factors causing landslides in the area (Dibanga B. Placide & Gatera Frederic, 2017). Thus, effective measures, techniques and mechanisms are needed to be taken for controlling and preventing landslides since the ones in charge of preventing and monitoring landslide hazards, have no exact and updated information and they are unaware of areas prone to landslides in the area. It is in this regard that this study aimed at mapping and assessing risk of areas prone to landslide in Nyabihu district. Results Figure 1. Map shows Key factors triggering Landslide. Figure 4. Landslide hazard Map. Chart 1. Landslide Risk Exposure Chart. Figure 5. Landslide Exposure Map. 0.0 20.0 40.0 60.0 80.0 100.0 Roads, % Health Centers, % Schools, % Population, % 1.3 0.0 0.0 0.9 45.7 98.0 91.9 60.8 53.0 2.0 8.8 38.4 Exposed per factor in percent Highly Hazardous Moderately Hazardous Lowly Hazardous Table 1. Data Types and their Usage. Figure 2. Flowchart Showing Procedures of Mapping Landslide Hazards.

Upload: others

Post on 05-Feb-2022

6 views

Category:

Documents


0 download

TRANSCRIPT

Landslide Hazard Mapping and Risk Assessment Using GIS. Case of Nyabihu District, Rwanda

Emile Niyonkuru, BSc1*; Bryant Hirwa Shimwa, BSc.1; Charles Mwafurika,BSc1 and Maurice Mugabowindekwe, MSc1, 1 Department of Civil,Environment and Geomatics Engineering, School of

Engineering, College of Science and Technology, University of Rwanda, Kigali

Emile NIYONKURU & Bryant HIRWA SHIMWA UNIVERSITY OF RWANDA Email:[email protected],

[email protected] Phone: +250 787 741 030, +250 782 614 235

Contact1. Dai , Lee, Ngai, 2002. Landslide risk assessment and management. s.l.:Elsevier Science B.V.2. Alpha, T. R., 1991. How to construct Four Paper Models that Describe Isaland Coral reefs, s.l.: U.S. Geological Surveying.3. Basharat, M., 2012. The distribution, characteristics and behaviour of mass movement striggered by the Kashmir Earthquake NW Himalaya,. Muzaffarabad: Fakultät der Friedrich-Alexander-Universität Erlangen.4. By Lynn M. Highland, and Peter Bobrowsky, 2008. The Landslide Handbook- A Guide to Understanding Landslides. Virginia: U.S. Geological Survey, Reston, Virginia.5. Causes and Types of Landslides (n.d.). 6. Cesar Augusto, Johnny Alexander Vega, and Milissa Parra Obando, 2018. Effect of the Rainfall Infiltration Processes on the Landslide Hazard Assessment of Unsaturated Soil in Tropical Mountainous Region. s.l.:Interchopen.7. Department of Natural Resources, F., n.d. Landslide Mitigation Strategies. s.l.:s.n.8. Dibanga B. Placide, M. V. & Gatera Frederic, B. D. o. R., 2017. State of Hydrogeological DIisasters in Northwestern Rwanda. East African Journal of Science and Technology, Vol.7(Issue1), pp. 1-25.9. Diop, Colin, Chiliza, 2010. Landslide inventorization and susceptibility mapping in South Africa. ResearchGate, Volume 7, pp. 207-210.10.Forum, W. L., 2017. Landslide Risk Assessment for the Built Environment in Sub-Saharan Africa. Nottingham, Springer International Publishing.

References

Rwanda’s landscape is generally hilly and mountainous, with elevation ranging from950 above sea level (ABSL) m in Bugarama plain in South West, to 4,507 m ABSL ontop of Mount Kalisimbi in the Northern highlands. The country’s average altitude isabout 1,700 m ABSL. Some regions of the country, mainly the Northern and Westernprovinces, are mostly dominated by high altitudes with steep slopes, which oftencause the landslides in the region, especially during rainy seasons. Consequently,the landslides lead to frequent disruption in traffic movement, and endangerpeople’s lives and properties. Nyabihu district located in Western province, is one ofthe areas mostly affected by landslides, with most of the areas prone to the hazard.Through DEM generation, weighting overlay and rating, and ground- truthing, thisresearch identified and mapped the districts’ areas prone to the landslides and theirlevel of exposure. Factors including slope, rainfall, soil type, and soil depth weretaken into consideration and rated according to their influence to landslideoccurrence. This led to the analysis of the probability of every area of the district tofall under different landslide susceptibility categories: low, medium or high, and adistrict landslide hazard susceptibility map was generated. According to thisresearch, areas of the district were ranked depending on the available socialinfrastructure and population density, with respect to the landslide susceptibilitycategory of the areas, in order to generate the level of exposure (risk) of the areas tothe landslide hazard. The research found that 7.83 % of the district is highlysusceptible to the landslide hazard, while 89.74% of the district is moderatelysusceptible to the hazard, and 2.43% of the district is lowly vulnerable to thelandslides. According to this research, sectors of the district including Mulinga,Jomba and Rurembo have been found to be at high risk of the landslides hazard,given the fact that they are located in high risk zone of the hazard and encounter alarge number of social infrastructures (roads, hospitals, schools, etc.) with highpopulation density 485.2 inhabitants/km2. The research proposes a number ofpotentially effective remedial actions to combat the effects of the landslides in thedistrict. Finally, the research highlights that further research projects can considermore factors including influence of gravity, soil erodibility, rainfall erosivity, andother geologic and geomorphologic factors, in order to establish a fully detailedlandslide susceptibility of the district.

Abstract

For mapping high risk zones of the study area, five factors namely rainfall, soil

type and depth, Land Use/Cover and slope have been considered. Each causal

factor with its level of influence has been analyzed and the outcome

demonstrates how enormously landslide hazards are distributed across the

entire region of Nyabihu district

It had been found with steep slope with the highest pick of almost 88 degrees in

North of the region, annual rainfall varies between 1000 and 1924 mm which

has greater influence in landslide occurrence, highly dominated by sandy soil

as type of soil, dominated with deep soil known to hold large amount of water

consequently resulting into slope failure and lastly land cover which is an open

Agriculture that occupied large surface of 40% of the total areas. Referring to

the analysis resulted from the computation of various essential parameters and

criteria necessary for its occurrence, landslide hazard map of Nyabihu district

has been generated using Spatial Multi-Criteria Evaluation in ArcMap. For

mapping high risk zones of the study area, five factors were assigned weighted

where rainfall 24%, soil type 18% and depth 12%, Land Use/Cover 14% and

slope 32% have been considered. Each causal factor with its level of influence

has been analyzed and the outcome demonstrates how enormously landslide

hazards are distributed across the entire region of Nyabihu district.

The quantification of three kind of selected elements namely social (schools,

hospital), and physical(roads) infrastructures and populations number has been

taken into consideration on the basis of each sector of Nyabihu district.

Each element categorized into ranges each with three classes and assigned

different values 1,2,3 representing sector with low risk, moderate, high risk

respectively through method known as rating. Rating and ranging were

classified according to the number or quantity of selected elements available in

each sector by ensuring the balance between elements being less, moderate

and highly affected.

Introduction

This research adopted the classification by rating and fit to be weighted overlay. During data analysis,

different factors were classified according to rating assigned to each factor causing landslide. A rating

between 1 and 3 was assigned to each key factor. This introduced, after getting the classification of all

key factors, each factor was assigned a weight depending to its own level of potential influence to cause

slope failures (MIDIMAR, 2015). It is indicated that at time landslide happened, different factors will

contribute depending at different level of their nature. A weight of 1 is given the meaning of absence

influence factor, 2 as a moderate influence while 3 implied highly presence influence of the factor as

these provided values were adopted on the basis of other related researches, field information and

analytical thinking. Here, is a detailed flowchart illustrating the methods used for a complete study of

landslide hazard mapping and risk assessment in Nyabihu district.

Methods and Materials

One of the major concern of this study was to analyse the key factors or parameterscausing landslide in Nyabihu district. Specifically, the research focused on fiveparameters including slope, rainfall, soil type, land cover/use and soil depth whichfinally used to assess areas prone to landslide by mapping landslide hazard in thisdistrict.

The influence of soil type on landslide occurrence goes hand in hand with soil depth,because the properties of soil is analyzed mostly on the basis of its type and depth.Through spatial Analyst in GIS, the above discussed factors were combined toproduce landslide hazard map. To combine these factors for producing such mapweighted overlay methods or approach has been used where by each factorassigned weighted value depend on its level of impact for landslide occurrence as itcan be indicated where these values adapted by referring to the literaturesresearches and the information gathered on the field.

Thus using ArcGIS spatial analysist module, the produced map was classified intothree classes namely low hazardous, moderate hazardous and high hazardous asindicated in the Figure 4, which clearly shown that most part of Nyabihu district arelikely to experience landslide especially in south east part though other areas alsoare subjected to high hazardous zones.

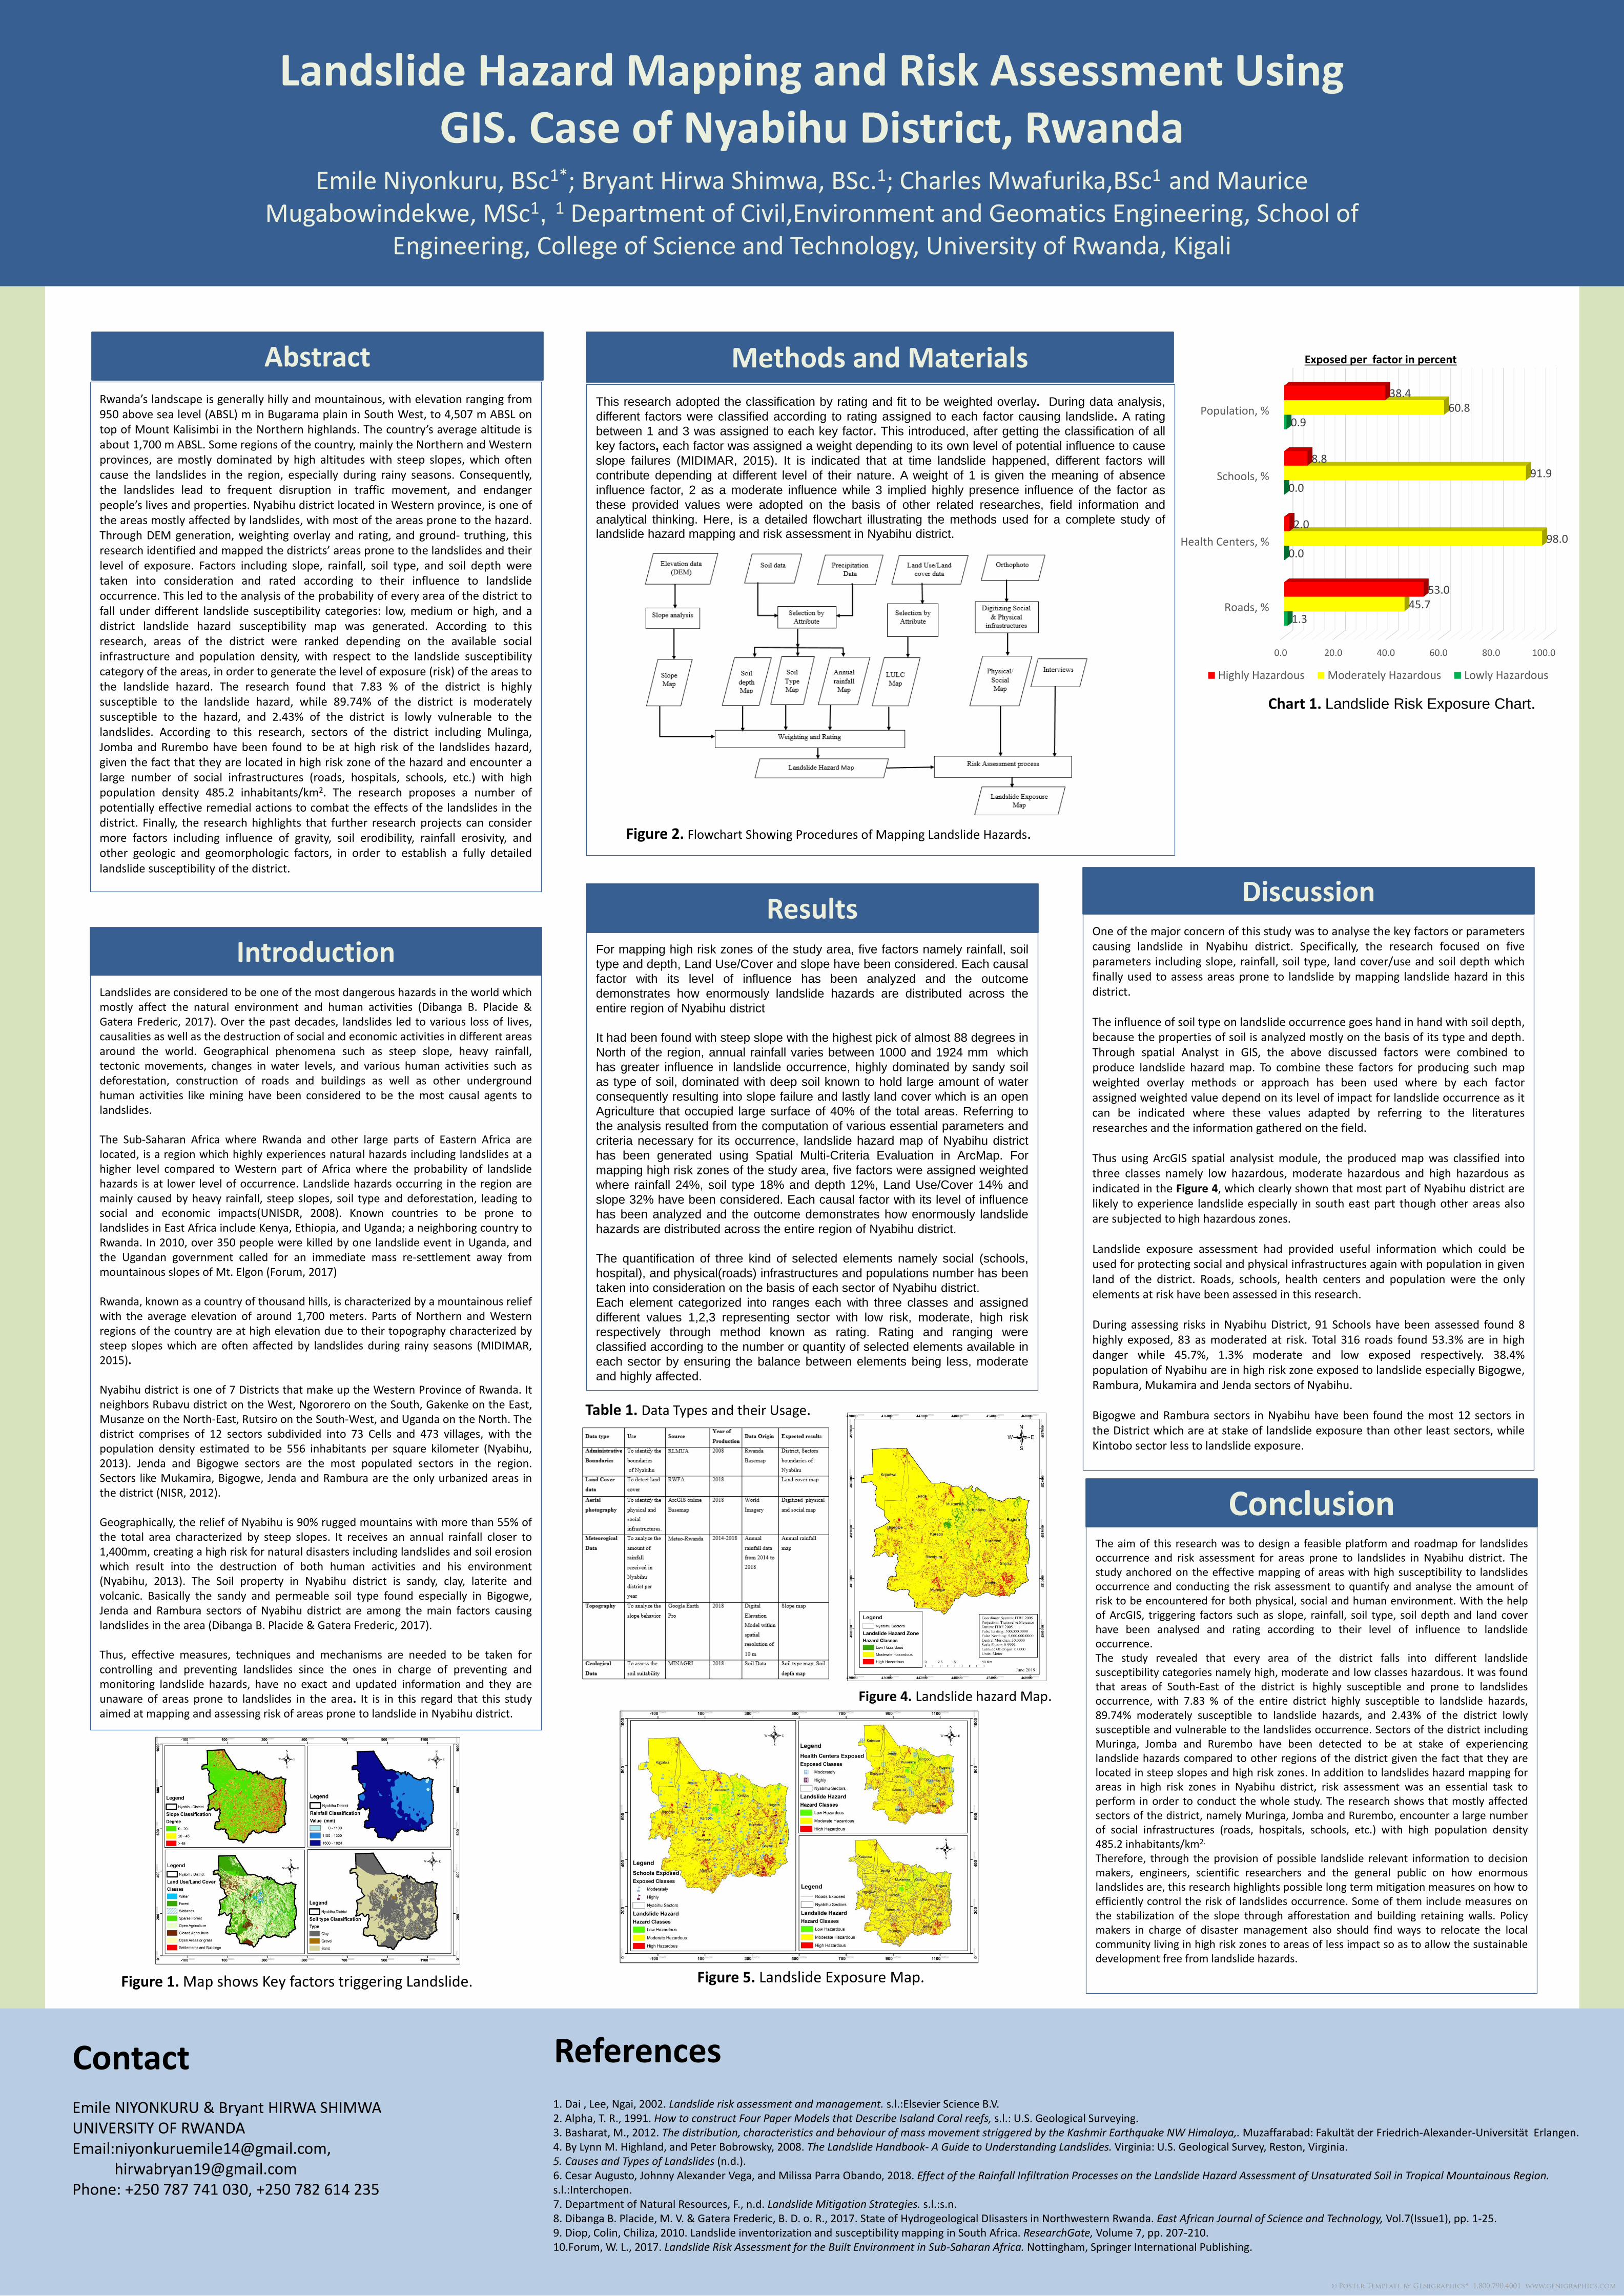
Landslide exposure assessment had provided useful information which could beused for protecting social and physical infrastructures again with population in givenland of the district. Roads, schools, health centers and population were the onlyelements at risk have been assessed in this research.

During assessing risks in Nyabihu District, 91 Schools have been assessed found 8highly exposed, 83 as moderated at risk. Total 316 roads found 53.3% are in highdanger while 45.7%, 1.3% moderate and low exposed respectively. 38.4%population of Nyabihu are in high risk zone exposed to landslide especially Bigogwe,Rambura, Mukamira and Jenda sectors of Nyabihu.

Bigogwe and Rambura sectors in Nyabihu have been found the most 12 sectors inthe District which are at stake of landslide exposure than other least sectors, whileKintobo sector less to landslide exposure.

Discussion

The aim of this research was to design a feasible platform and roadmap for landslidesoccurrence and risk assessment for areas prone to landslides in Nyabihu district. Thestudy anchored on the effective mapping of areas with high susceptibility to landslidesoccurrence and conducting the risk assessment to quantify and analyse the amount ofrisk to be encountered for both physical, social and human environment. With the helpof ArcGIS, triggering factors such as slope, rainfall, soil type, soil depth and land coverhave been analysed and rating according to their level of influence to landslideoccurrence.The study revealed that every area of the district falls into different landslidesusceptibility categories namely high, moderate and low classes hazardous. It was foundthat areas of South-East of the district is highly susceptible and prone to landslidesoccurrence, with 7.83 % of the entire district highly susceptible to landslide hazards,89.74% moderately susceptible to landslide hazards, and 2.43% of the district lowlysusceptible and vulnerable to the landslides occurrence. Sectors of the district includingMuringa, Jomba and Rurembo have been detected to be at stake of experiencinglandslide hazards compared to other regions of the district given the fact that they arelocated in steep slopes and high risk zones. In addition to landslides hazard mapping forareas in high risk zones in Nyabihu district, risk assessment was an essential task toperform in order to conduct the whole study. The research shows that mostly affectedsectors of the district, namely Muringa, Jomba and Rurembo, encounter a large numberof social infrastructures (roads, hospitals, schools, etc.) with high population density485.2 inhabitants/km2.

Therefore, through the provision of possible landslide relevant information to decisionmakers, engineers, scientific researchers and the general public on how enormouslandslides are, this research highlights possible long term mitigation measures on how toefficiently control the risk of landslides occurrence. Some of them include measures onthe stabilization of the slope through afforestation and building retaining walls. Policymakers in charge of disaster management also should find ways to relocate the localcommunity living in high risk zones to areas of less impact so as to allow the sustainabledevelopment free from landslide hazards.

Conclusion

Landslides are considered to be one of the most dangerous hazards in the world whichmostly affect the natural environment and human activities (Dibanga B. Placide &Gatera Frederic, 2017). Over the past decades, landslides led to various loss of lives,causalities as well as the destruction of social and economic activities in different areasaround the world. Geographical phenomena such as steep slope, heavy rainfall,tectonic movements, changes in water levels, and various human activities such asdeforestation, construction of roads and buildings as well as other undergroundhuman activities like mining have been considered to be the most causal agents tolandslides.

The Sub-Saharan Africa where Rwanda and other large parts of Eastern Africa arelocated, is a region which highly experiences natural hazards including landslides at ahigher level compared to Western part of Africa where the probability of landslidehazards is at lower level of occurrence. Landslide hazards occurring in the region aremainly caused by heavy rainfall, steep slopes, soil type and deforestation, leading tosocial and economic impacts(UNISDR, 2008). Known countries to be prone tolandslides in East Africa include Kenya, Ethiopia, and Uganda; a neighboring country toRwanda. In 2010, over 350 people were killed by one landslide event in Uganda, andthe Ugandan government called for an immediate mass re-settlement away frommountainous slopes of Mt. Elgon (Forum, 2017)

Rwanda, known as a country of thousand hills, is characterized by a mountainous reliefwith the average elevation of around 1,700 meters. Parts of Northern and Westernregions of the country are at high elevation due to their topography characterized bysteep slopes which are often affected by landslides during rainy seasons (MIDIMAR,2015).

Nyabihu district is one of 7 Districts that make up the Western Province of Rwanda. Itneighbors Rubavu district on the West, Ngororero on the South, Gakenke on the East,Musanze on the North-East, Rutsiro on the South-West, and Uganda on the North. Thedistrict comprises of 12 sectors subdivided into 73 Cells and 473 villages, with thepopulation density estimated to be 556 inhabitants per square kilometer (Nyabihu,2013). Jenda and Bigogwe sectors are the most populated sectors in the region.Sectors like Mukamira, Bigogwe, Jenda and Rambura are the only urbanized areas inthe district (NISR, 2012).

Geographically, the relief of Nyabihu is 90% rugged mountains with more than 55% ofthe total area characterized by steep slopes. It receives an annual rainfall closer to1,400mm, creating a high risk for natural disasters including landslides and soil erosionwhich result into the destruction of both human activities and his environment(Nyabihu, 2013). The Soil property in Nyabihu district is sandy, clay, laterite andvolcanic. Basically the sandy and permeable soil type found especially in Bigogwe,Jenda and Rambura sectors of Nyabihu district are among the main factors causinglandslides in the area (Dibanga B. Placide & Gatera Frederic, 2017).

Thus, effective measures, techniques and mechanisms are needed to be taken forcontrolling and preventing landslides since the ones in charge of preventing andmonitoring landslide hazards, have no exact and updated information and they areunaware of areas prone to landslides in the area. It is in this regard that this studyaimed at mapping and assessing risk of areas prone to landslide in Nyabihu district.

Results

Figure 1. Map shows Key factors triggering Landslide.

Figure 4. Landslide hazard Map.

Chart 1. Landslide Risk Exposure Chart.

Figure 5. Landslide Exposure Map.

0.0 20.0 40.0 60.0 80.0 100.0

Roads, %

Health Centers, %

Schools, %

Population, %

1.3

0.0

0.0

0.9

45.7

98.0

91.9

60.8

53.0

2.0

8.8

38.4

Exposed per factor in percent

Highly Hazardous Moderately Hazardous Lowly Hazardous

Table 1. Data Types and their Usage.

Figure 2. Flowchart Showing Procedures of Mapping Landslide Hazards.