ranjan regional scale landslide hazard - hils ‐pacific region november 11‐12, 2008, sendai,...
TRANSCRIPT

1
Cite this article as: Dahal R.K., Hasegawa S., Nonomura A., Yamanaka M., Bhandary N.P., Yatabe R., 2008, Regional scale landslide hazard
mapping in the Lesser Himalayan terrain of Nepal, proceeding of International conference on Management of Landslide Hazard in the
Asia‐Pacific Region November 11‐12, 2008, Sendai, Japan. Japan Landslide Society, Japan. 12p.
Regional scale landslide hazard mapping in the Lesser Himalayan terrain of Nepal Ranjan Kumar Dahal1, 2), Shuichi Hasegawa1), Atsuko Nonomura1), Minoru Yamanaka1),
Netra Prakash Bhandary3), Ryuichi Yatabe3)
Abstract
Landslide hazard mapping is a fundamental tool for disaster management activities in mountainous terrains of Himalaya. In this paper, the
weights-of-evidence and information value methods were applied, within a geographical information system (GIS), to derive landslide
hazard map of the Lesser Himalayan terrain of Nepal. South western marginal hills of Kathmandu valley was taken as an ideal site for the
hazard mapping and analysis. The main purpose of this paper is to evaluate the predictive power of weights-of-evidence and information
value methods for the landslide hazard assessment in the Lesser Himalayan terrain of Nepal. For study area in south western hills of
Kathmandu, a dataset was generated at scale 1:10,000. Relevant thematic maps representing various factors (e.g. slope, aspect, relief, flow
accumulation, distance to drainage, soil depth, engineering soil type, landuse, geology, distance to road and extreme one-day rainfall) that
are related to landslide activity were generated using field data and GIS techniques. The landslides events of 1970s, 1980s, and 1990s were
used in analysis with respect to causative factors. To assess the accuracy of the resulted landslide hazard map, it was crossed with map of
landslides triggered by 2002 extreme rainfall events. The accuracy of map was evaluated by area under the curve, success rate and
prediction rate. The resulted landslide hazard value calculated from old landslides data showed nearly 80% prediction accuracy. The both
weights-of-evidence and information value methods seem to have extensive applicability in Lesser Himalayan terrains of Nepal, with the
limitation that knowledge of the past landslides information to the methods affects the calculated final hazard value.
Keywords: Nepal, Lesser Himalaya, Monsoon rainfall, Landslides, GIS, Hazard map
Introduction The Himalaya is very vulnerable to natural and common hazards such as landslides, debris flows, and soil erosion primarily triggered by extensive rainfall of monsoon. Situated entirely in the Himalaya, Nepal suffers from tremendous landslide disaster problems every year, and a great number of people are affected by large- and small-scale landslides throughout the country, especially during monsoon periods. Sites that are particularly at risk for landslides should therefore be identified so as to reduce damage in the region. Landslide hazard assessment has become a vital subject for authorities responsible for infrastructural development and environmental protection. Much research has been carried out to prepare landslide susceptibility and landslide hazard maps. According to Varnes (1984), landslide hazard can be assessed in terms of probability of occurrence of a potentially damaging landslide phenomenon within a specified period of time and within a given area. Both intrinsic and extrinsic variables affect landslide hazards in an area (Siddle et al., 1991; Wu and Siddle, 1995; Atkinson and Massari, 1998; Dai et al., 2001). The intrinsic variables determining landslides hazards include bedrock geology, geomorphology, soil depth, soil type, slope gradient, slope aspect, slope curvature, elevation, engineering properties of the slope material, land use pattern, drainage patterns, and so on. Similarly, extrinsic variables include heavy rainfall, earthquakes, and volcanoes. Observations and experience show that the
1) Department of Safety System Construction Engineering, Faculty of Engineering, Kagawa University, Takamatsu, Japan (e-mail: [email protected]) 2) Department of Geology, Tribhuvan University, Tri-Chandra Multiple Campus, Ghantaghar, Kathmandu, Nepal 3) Department of Civil and Environmental Engineering, Graduate School of Science and Engineering, Ehime University, Matsuyama, Japan
2
probability of landslide occurrence depends on both intrinsic and extrinsic variables. However, extrinsic variables are site specific and possess a temporal distribution. In landslide hazard assessment practice, the term “landslide susceptibility mapping” is used when the extrinsic variables are not considered while determining the probability of occurrence of a landslide event (Dai et al., 2001). In this research, using statistical approach, landslide hazard maps were prepared by considering the extrinsic variable rainfall in addition to the intrinsic variables.
There are various methods in bivariate statistical approach of landslide hazard mapping, but in this study, the landslide hazard was evaluated through GIS techniques using information value (InfoVal) and weights-of-evidence (WoE) methods. The study area in the south-western hills of Kathmandu Valley suffered extensive landslide damage during the heavy monsoon rainfall of 2002, and thus it is a suitable ideal site for the evaluation of rainfall-induced landslide hazard in the Lesser Himalaya of Nepal.
Various models have been applied to landslide susceptibility and hazard mapping in the last 25 years (Guzzetti et al., 1999; Chung and Fabbri, 2003; Remondo et al 2003; Van Westen et al., 2003; Lee, 2004). In the most of the landslide susceptibility and hazard mappings, independent validation of statistical models for landslide hazard or susceptibility assessment is lacking. A time-based separation of landslides can be most appropriate for validation; in fact, use of older landslides for modelling and new landslides for validation is the most acceptable method of validation (Van Westen et al., 2003). One of the objectives of the present study is to overcome this deficiency, and in the existing few research attempts in the Himalaya, the same landslide data were used for both hazard assessment and validation. The main objectives of this paper are: 1) to employ information value (InfoVal) and weights-of-evidence (WoE) method to define the physical parameters contributing to the occurrence of landslides in the Lesser Himalaya, 2) to assess the effectiveness of InfoVal and WoE methods for landslide hazard evaluation in the Lesser Himalaya of Nepal, and 3) to prepare a classified landslide hazard map that possesses high prediction and success rates for the study area.
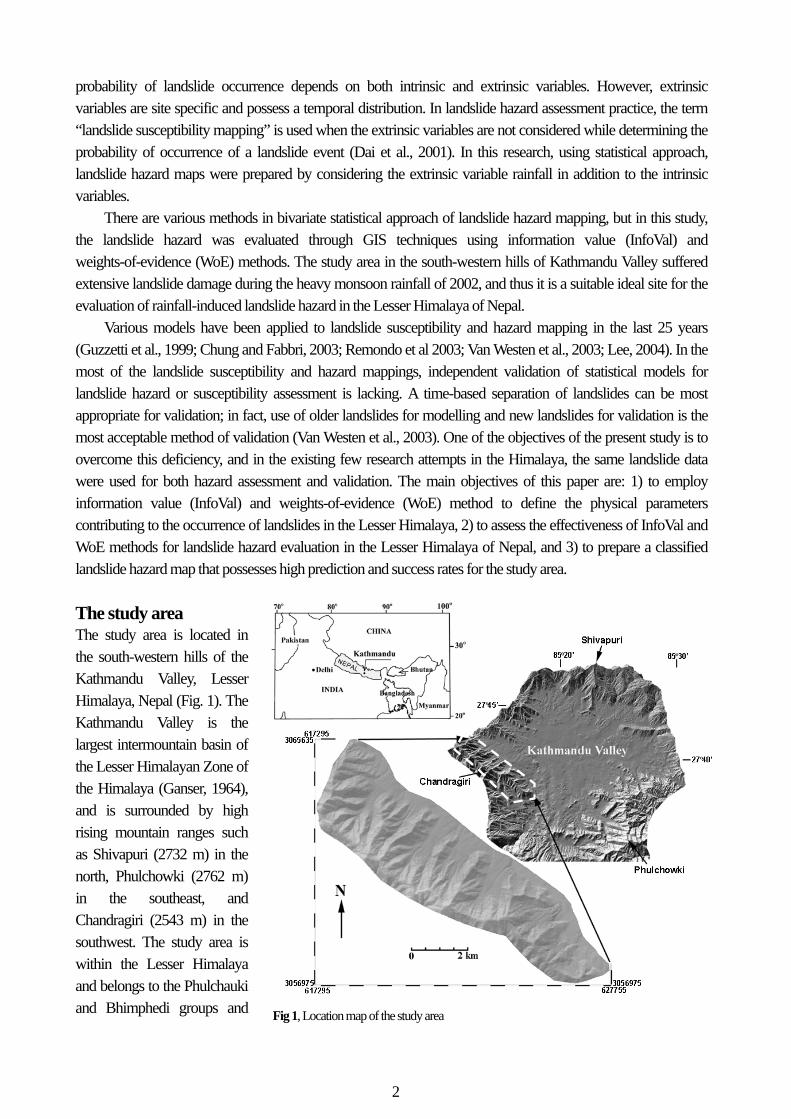
The study area The study area is located in the south-western hills of the Kathmandu Valley, Lesser Himalaya, Nepal (Fig. 1). The Kathmandu Valley is the largest intermountain basin of the Lesser Himalayan Zone of the Himalaya (Ganser, 1964), and is surrounded by high rising mountain ranges such as Shivapuri (2732 m) in the north, Phulchowki (2762 m) in the southeast, and Chandragiri (2543 m) in the southwest. The study area is within the Lesser Himalaya and belongs to the Phulchauki and Bhimphedi groups and Fig 1, Location map of the study area

3
Fig. 2, Geological map of south of Kathmandu valley (modified after Stöcklin, 1980) and
geological map of study area is shown in inset.
the southern hills of the Kathmandu Valley consist of intensely folded and faulted metasediments, mainly limestone with a subordinate amount of shale and sandstone of the Phulchauki Group (Fig 2). The study area ranges in elevation from 1400 m to 2,560 m, with an area of 18.9 km2. The mean annual precipitation of area ranges from 1500 to 2200 mm. Most of the slope faces north, and the slope gradient generally increases with increasing elevation. Colluvium is the main slope material above the bedrock. The area consists mainly of a dense forest of immature trees and thorny shrubs.
In 2002, the study area experienced extreme events of monsoon rainfall and faced huge losses of life and property. On July 23, 2002, monsoon rains dropped 300.1 mm of rain in a 24-h period. This was the highest precipitation in the area in the last 36 years. These rainfall events triggered 73 debris slides in the study area. Debris flows also occurred after the sliding. A single landslide occurred near the central part of the study area, killing 16 people (Dahal et al., 2006). The area is on the outskirts of Kathmandu Metropolitan city in Nepal, and settlement at the base of the hills has risen sharply over the last 10 years. Because of the panoramic view of the Himalayas to the north, many housing projects have been constructed without any consideration of landslide hazards. Some research has been conducted regarding landslide risk in the study area. Paudel (2003) described a disaster management scenario for the central part of the study area, giving examples of the disastrous landslides of 2002. Paudyal and Dhital (2005) performed a statistical risk analysis for the southern part of Kathmandu, including the study area, and categorized the levels of risk as low, moderate and high. Dahal et al. (2006) provided a comprehensive description of the study area with respect to rainfall and landslides.
InfoVal and WoE methods In this study, information value and weights-of-evidence methods were used for the landslide hazard mapping. Van Westen (1997) proposed the Information Value (InfoVal) method for landslide hazard analysis, which considers the probability of landslide occurrence within a certain area of each class of a landslide causative factor. This method is also regarded as the simplification of the method in Yin and Yan (1988), in which the weights of a particular class in a causative factor are determined as follow.
clasi e
map
logD
WD
…………………………….. . (1)
4
Where, Wi is the weight given to the all class of a particular landslide causative factor layer, Dclas is the landslide density within the landslide causative factor class, and Dmap is sum of the landslide density within the entire landslide causative factor class layer. InfoVal method is one of the familiar statistical methods of landslide hazard study in the Himalaya (Saha et al., 2005).
The weights-of-evidence method uses the Bayesian probability model, and was originally developed for mineral potential assessment (Bonham-Carter et al., 1988, 1989; Agterberg 1992; Agterberg et al., 1993; Bonham-Carter, 2002). This method has also been applied to landslide susceptibility mapping (Lee et al., 2002; Van Westen et al., 2003, Lee and Choi, 2004, Lee and Sambath, 2006; Dahal et al., 2008; Sharma and Kumar, 2008; Neuhäuser and Terhorst, 2007).
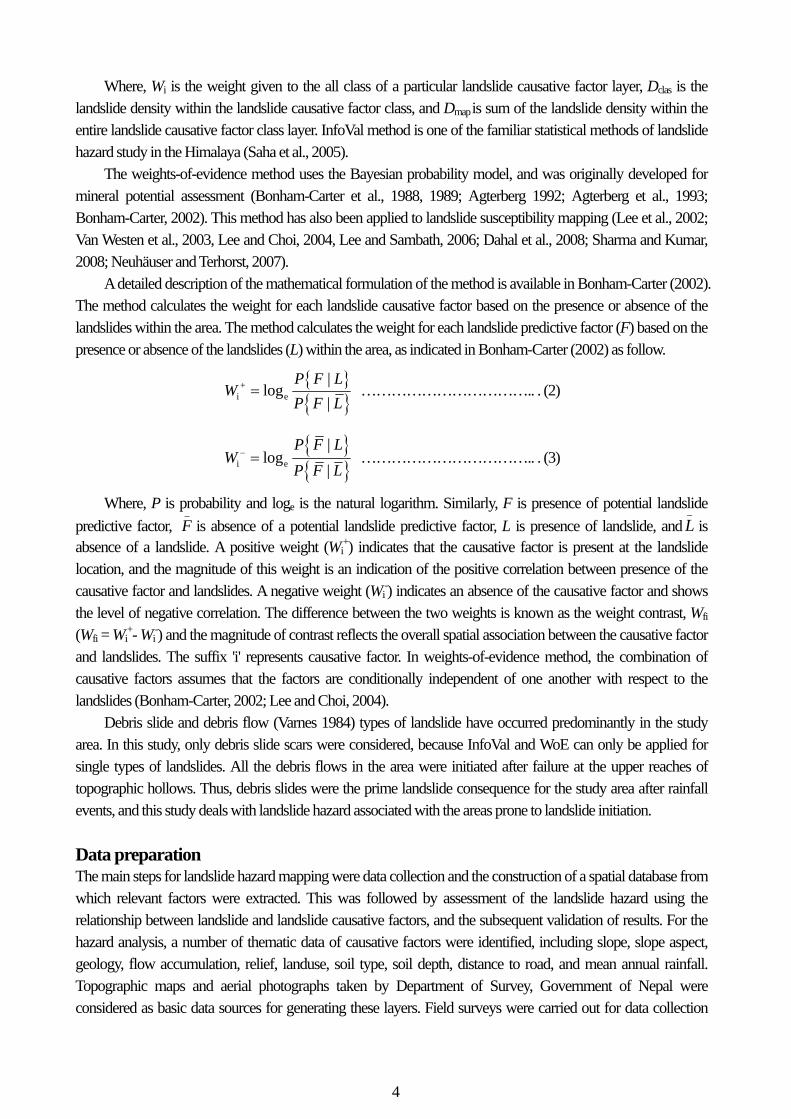
A detailed description of the mathematical formulation of the method is available in Bonham-Carter (2002). The method calculates the weight for each landslide causative factor based on the presence or absence of the landslides within the area. The method calculates the weight for each landslide predictive factor (F) based on the presence or absence of the landslides (L) within the area, as indicated in Bonham-Carter (2002) as follow.
+i e
|log
|
P F LW
P F L …………………………….. . (2)
i e
|log
|
P F LW
P F L …………………………….. . (3)
Where, P is probability and loge is the natural logarithm. Similarly, F is presence of potential landslide
predictive factor, _
F is absence of a potential landslide predictive factor, L is presence of landslide, and_
L is absence of a landslide. A positive weight (Wi
+) indicates that the causative factor is present at the landslide location, and the magnitude of this weight is an indication of the positive correlation between presence of the causative factor and landslides. A negative weight (Wi
-) indicates an absence of the causative factor and shows the level of negative correlation. The difference between the two weights is known as the weight contrast, Wfi (Wfi = Wi
+- Wi-) and the magnitude of contrast reflects the overall spatial association between the causative factor
and landslides. The suffix 'i' represents causative factor. In weights-of-evidence method, the combination of causative factors assumes that the factors are conditionally independent of one another with respect to the landslides (Bonham-Carter, 2002; Lee and Choi, 2004).
Debris slide and debris flow (Varnes 1984) types of landslide have occurred predominantly in the study area. In this study, only debris slide scars were considered, because InfoVal and WoE can only be applied for single types of landslides. All the debris flows in the area were initiated after failure at the upper reaches of topographic hollows. Thus, debris slides were the prime landslide consequence for the study area after rainfall events, and this study deals with landslide hazard associated with the areas prone to landslide initiation.
Data preparation The main steps for landslide hazard mapping were data collection and the construction of a spatial database from which relevant factors were extracted. This was followed by assessment of the landslide hazard using the relationship between landslide and landslide causative factors, and the subsequent validation of results. For the hazard analysis, a number of thematic data of causative factors were identified, including slope, slope aspect, geology, flow accumulation, relief, landuse, soil type, soil depth, distance to road, and mean annual rainfall. Topographic maps and aerial photographs taken by Department of Survey, Government of Nepal were considered as basic data sources for generating these layers. Field surveys were carried out for data collection

5
and to prepare data layers of various factors, as well as to prepare geological, soil depth, soil type and landuse maps. A landslide distribution map after the 2002 extreme monsoon rainfall events was also prepared in field. These data sources were used to generate various data layers using the GIS software ILWIS 3.3.
A landslide inventory map is the simplest output of direct landslide mapping. It shows the location of discernible landslides. It is a key factor used in landslide hazard mapping by InfoVal and WoE methods because the overlay analysis requires an inventory map. Two landslide inventory maps for new and older landslides were prepared. For the new landslide inventory map, landslides occurring after the 2002 rainfall events were recorded in field immediately after the events, and the landslide inventory map was prepared. As a consequence of 2002 extreme rainfall events, a total of 73 debris slide scars were detected in the study area. For the older landslide maps, aerial photographs from 1979, 1989 and 1995 at scales of 1:25000 and 1:15000 were taken as a data source. Landslide scars were identified with stereoscopes, and the GIS data layer was prepared. Similarly, for 1:15000 scale aerial photographs, epipolar stereo pairs were generated in ILWIS 3.3 and landslide inventory maps were prepared from screen digitisations. A total of 119 landslide scars were delineated from the 1979, 1989, and 1995 photos. Rainfall data from the nearest rainfall station suggested that there were comparatively high monsoon rainfall events in 1978, 1979, 1987, 1988, and 1993. These events might be responsible for triggering these old landslides. The landslide inventory maps of the both new and older landslides are given in Fig. 3.
For the geological data layer preparation, previous studies (Stöcklin and Bhattarai, 1977; Acharya, 2001) were consulted and geological boundaries of formations were checked and modified as per the field observations. A Digital Elevation Model (DEM) having 10 m × 10 m pixel size is used to generate various geomorphological parameters which influence the landslide activity in an area. From this DEM, geomorphological thematic data layers such as slope, aspect and relative relief, distance to drainage, and flow accumulation were prepared. The relative relief data layer was prepared from the difference in maximum (2500 m) and minimum elevation (1400 m) and was sliced into twelve classes at 100 m bin.
Fig. 3, Landslide inventory maps of the study area, A) Inventory map prepared
after 2002 extreme rainfall event, B) Inventory map prepared from aerial
photographs of 1979, 1989, and 1995.

6
Landuse is also one of the key factors responsible for the occurrence of landslides, since barren slopes are more prone to landslides. The landuse map was prepared in the field on a topographical map at 1:25,000 scale. Subsequently, the landuse data layer was generated as vector polygons and converted to a raster landuse map in GIS. Road construction activity is another controlling factor for the stability of slopes. Thus, a distance to road factor map was also prepared for analysis. Soil mapping was performed mainly for estimating soil depth and identifying engineering soil types. The study of landslides after the 2002 extreme rainfall events suggested mainly soil depths of 0.5 m to 2 m had maximum susceptibility to failure. The maps of soil depth and engineering soil types (silty gravel, low plastic clay, silty sand and clayey to silty gravel) were also prepared.
Rainfall is an extrinsic variable in hazard analysis, and the spatial distribution of mean annual rainfall is commonly used in statistical hazard analysis. But, the study area has many landslides triggered by extreme rainfall. Thus, to make this research more practical, extreme one day rainfall, for 11 stations around Kathmandu valley was used to prepare an extreme one day rainfall map.
Thus, a total of 11 factors maps (slope, aspect, relief, flow accumulation, soil depth, engineering soil type, geology, landuse, distance to drainage, distance to road and extreme one day rainfall) were selected as thematic data layers for analysis.
Analysis and Result To evaluate the contribution of each causative factor to landslide hazard, both new and old landslide distribution data layers were compared separately with various thematic data layers. For this purpose, Eq. (1) of InfoVal method was written according to numbers of pixels as follows.
aai e
b b
=LogNpixNpix
WNpix Npix
………………………….. (4)
Where, Wi is the weight given to a certain parameter class (such as, a rock type or slope class). Npixa is number of pixels which contain landslides, in a certain parameter class. Npixb is total number of pixels in a certain class in a causative factor. The natural logarithm is used to take care of the large variation in the weights.
Similarly, For WoE method, Eqs. (2), and (3) were also written according to numbers of pixels.
1
+ 1 2i e
3
3 4
+=Log
+
NpixNpix Npix
WNpix
Npix Npix ………………………….. (5)
2
1 2i e
4
3 4
+=Log
+
NpixNpix Npix
WNpix
Npix Npix
………………………….. (6)
Where, Npix1 is the number of pixels representing the presence of both a causative factor and landslides; Npix2 is the number of pixels representing the presence of landslides and absence of a causative factor; Npix3 is the number of pixels representing the presence of a causative factor and absence of landslides; Npix4 is the number of pixels representing the absence of both a causative factor and landslides.
7
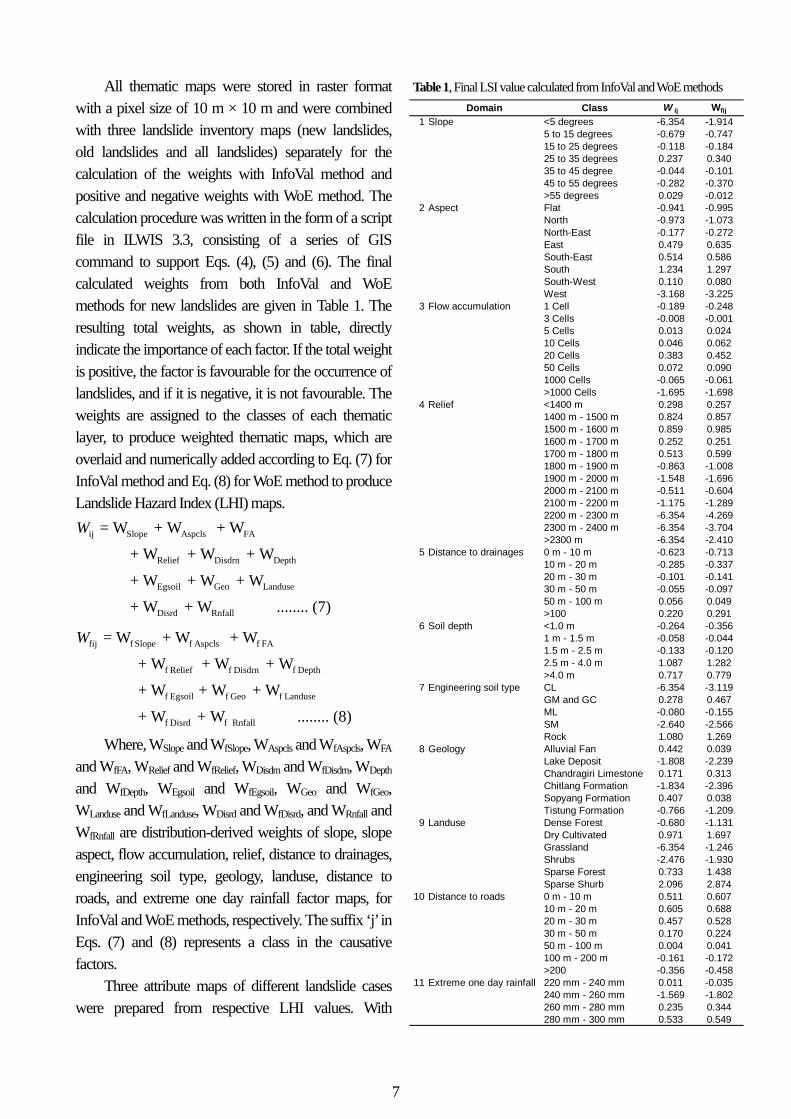
All thematic maps were stored in raster format with a pixel size of 10 m × 10 m and were combined with three landslide inventory maps (new landslides, old landslides and all landslides) separately for the calculation of the weights with InfoVal method and positive and negative weights with WoE method. The calculation procedure was written in the form of a script file in ILWIS 3.3, consisting of a series of GIS command to support Eqs. (4), (5) and (6). The final calculated weights from both InfoVal and WoE methods for new landslides are given in Table 1. The resulting total weights, as shown in table, directly indicate the importance of each factor. If the total weight is positive, the factor is favourable for the occurrence of landslides, and if it is negative, it is not favourable. The weights are assigned to the classes of each thematic layer, to produce weighted thematic maps, which are overlaid and numerically added according to Eq. (7) for InfoVal method and Eq. (8) for WoE method to produce Landslide Hazard Index (LHI) maps.
ij Slope Aspcls FA
Relief Disdrn Depth
Egsoil Geo Landuse
Disrd Rnfall
= W + W + W
+ W + W + W
+ W + W + W
+ W + W ........ (7)
W
fij f Slope f Aspcls f FA
f Relief f Disdrn f Depth
f Egsoil f Geo f Landuse
f Disrd f Rnfall
= W + W + W
+ W + W + W
+ W + W + W
+ W + W ........ (8)
W
Where, WSlope and WfSlope, WAspcls and WfAspcls, WFA and WfFA, WRelief and WfRelief, WDisdrn and WfDisdrn, WDepth and WfDepth, WEgsoil and WfEgsoil, WGeo and WfGeo, WLanduse and WfLanduse, WDisrd and WfDisrd, and WRnfall and WfRnfall are distribution-derived weights of slope, slope aspect, flow accumulation, relief, distance to drainages, engineering soil type, geology, landuse, distance to roads, and extreme one day rainfall factor maps, for InfoVal and WoE methods, respectively. The suffix ‘j’ in Eqs. (7) and (8) represents a class in the causative factors.
Three attribute maps of different landslide cases were prepared from respective LHI values. With
Table 1, Final LSI value calculated from InfoVal and WoE methods
Domain Class W ij Wfij
1 Slope <5 degrees -6.354 -1.9145 to 15 degrees -0.679 -0.74715 to 25 degrees -0.118 -0.18425 to 35 degrees 0.237 0.34035 to 45 degree -0.044 -0.10145 to 55 degrees -0.282 -0.370>55 degrees 0.029 -0.012
2 Aspect Flat -0.941 -0.995North -0.973 -1.073North-East -0.177 -0.272East 0.479 0.635South-East 0.514 0.586South 1.234 1.297South-West 0.110 0.080West -3.168 -3.225
3 Flow accumulation 1 Cell -0.189 -0.2483 Cells -0.008 -0.0015 Cells 0.013 0.02410 Cells 0.046 0.06220 Cells 0.383 0.45250 Cells 0.072 0.0901000 Cells -0.065 -0.061>1000 Cells -1.695 -1.698
4 Relief <1400 m 0.298 0.2571400 m - 1500 m 0.824 0.8571500 m - 1600 m 0.859 0.9851600 m - 1700 m 0.252 0.2511700 m - 1800 m 0.513 0.5991800 m - 1900 m -0.863 -1.0081900 m - 2000 m -1.548 -1.6962000 m - 2100 m -0.511 -0.6042100 m - 2200 m -1.175 -1.2892200 m - 2300 m -6.354 -4.2692300 m - 2400 m -6.354 -3.704>2300 m -6.354 -2.410
5 Distance to drainages 0 m - 10 m -0.623 -0.71310 m - 20 m -0.285 -0.33720 m - 30 m -0.101 -0.14130 m - 50 m -0.055 -0.09750 m - 100 m 0.056 0.049>100 0.220 0.291
6 Soil depth <1.0 m -0.264 -0.3561 m - 1.5 m -0.058 -0.0441.5 m - 2.5 m -0.133 -0.1202.5 m - 4.0 m 1.087 1.282>4.0 m 0.717 0.779
7 Engineering soil type CL -6.354 -3.119GM and GC 0.278 0.467ML -0.080 -0.155SM -2.640 -2.566Rock 1.080 1.269
8 Geology Alluvial Fan 0.442 0.039Lake Deposit -1.808 -2.239Chandragiri Limestone 0.171 0.313Chitlang Formation -1.834 -2.396Sopyang Formation 0.407 0.038Tistung Formation -0.766 -1.209
9 Landuse Dense Forest -0.680 -1.131Dry Cultivated 0.971 1.697Grassland -6.354 -1.246Shrubs -2.476 -1.930Sparse Forest 0.733 1.438Sparse Shurb 2.096 2.874
10 Distance to roads 0 m - 10 m 0.511 0.60710 m - 20 m 0.605 0.68820 m - 30 m 0.457 0.52830 m - 50 m 0.170 0.22450 m - 100 m 0.004 0.041100 m - 200 m -0.161 -0.172>200 -0.356 -0.458
11 Extreme one day rainfall 220 mm - 240 mm 0.011 -0.035240 mm - 260 mm -1.569 -1.802260 mm - 280 mm 0.235 0.344280 mm - 300 mm 0.533 0.549

8
InfoVal method, LHI values were found to lie in the range from -29.774 to 7.097 for the new landslides case, -15.916 to 5.510 for the old landslide case, and -16.654 to 5.692 for the all landslide case. Likewise, with WoE method, LHI values were found in -15.662 to 8.231 for the new landslides case, -12.483 to 6.769 for the old landslides case, and -13.023 to 6.926 for the case of all landslides. The ability of LHI values to predict landslide occurrences was verified using the success rate curve (Chung and Fabbri, 1999), prediction rate and effect analysis (Van Westen et al., 2003; Lee, 2004; Dahal et al., 2008). The success rate indicates what percentage of all landslides occurs in the classes with the highest value of susceptibility. When old landslides are used for LHI value calculation and new landslides are used for prediction, the calculated accuracy rate is called prediction rate (Van Westen et al., 2003; Lee et al., 2007) and is most suitable parameter for independent validation of the LHI values. Effect analysis helps to validate and to check the predictive power of selected factors that are used in hazard analysis.
Success rates and effect analyses The success rate curves of all three maps are shown in Fig 4. These curves are measures of goodness of fit. To obtain the success rate curve for each LHI map, the calculated landslide index values of all pixels in the maps were sorted in descending order. Then the pixel values in descending order (maximum to minimum LHI value) were categorised into 100 classes with 1% intervals. The class domain having 100 class groups and covering high to low LHI value were prepared and classified LHI maps were prepared with the slicing operation in ILWIS 3.3. These classified LHI maps (having 100 class groups) were crossed with the landslide inventory map. Number of landslide pixels in each class group (from 1% to 100%) was obtained from cross table value. Then, the success rate curves for both methods were created by plotting class group (from 1% to 100%) in x-axis and respective value of landslide pixel percentage in each class group in y-axis. Fig 4A represents success rate of InfoVal method and Fig 4B represent success rate of WoE method for new landslides, old landslides and all landslides cases. When InfoVal method was evaluated for success rate, in the case of new landslides, the success rate reveals that 10% of the study area where the LHI had a higher rank could explain 50% of total new landslides in 10% of hazard class. Likewise, 30% of higher LHI value could explain 89% of all landslides in 30% of hazard class. Similarly, for the cases of old landslides and all landslides, 30% high LHI value could explain about 78% of total landslides in 30% of hazard class.
Similarly, When WoE method was concerned, in the case of new landslides, the success rate reveals that 10% of the study area where the LHI had a higher rank could explain 50% of total new landslides in 10% of
Fig. 4 A) Success rate curves of landslide hazard values calculated with InfoVal method and B) WoE
method. The areas under the curve for all three cases were determined considering a total area under the
curve as 100×100 = 10, 000 units. Other details are in text.
0
10
20
30
40
50
60
70
80
90
100
0 10 20 30 40 50 60 70 80 90 100
Per
cent
age
of
ob
serv
erd
land
slid
es
Percentage of predicted landslides f rom high (1%) to low (100%) LHI
Success rates:NL, New landslides: 86.40%OL, Old landslides: 82.962%AL, All landslides: 81.98%
NL
OL AL
A)
0
10
20
30
40
50
60
70
80
90
100
0 10 20 30 40 50 60 70 80 90 100
Per
cent
age
of
ob
serv
erd
land
slid
es
Percentage of predicted landslides f rom high (1%) to low (100%) LHI
Success rates:NL, New landslides: 85.80%OL, Old landslides: 83.02%AL, All landslides: 81.89%
NL
OL
AL
B)
9
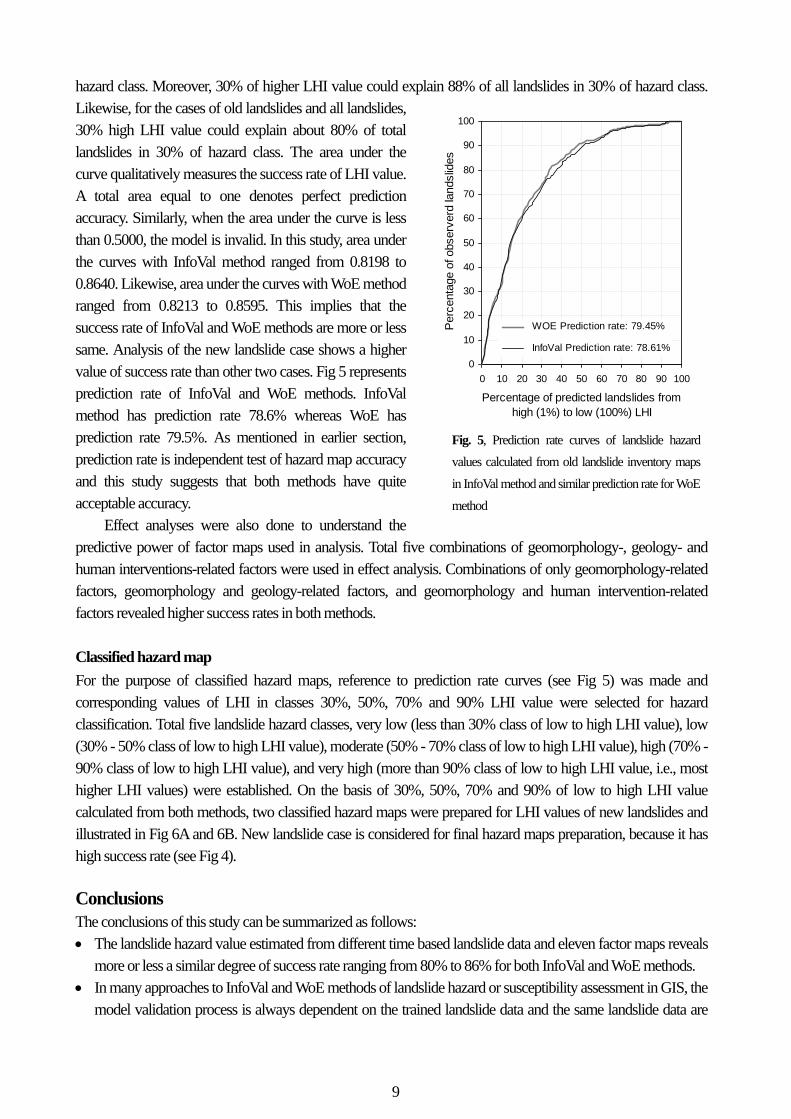
hazard class. Moreover, 30% of higher LHI value could explain 88% of all landslides in 30% of hazard class. Likewise, for the cases of old landslides and all landslides, 30% high LHI value could explain about 80% of total landslides in 30% of hazard class. The area under the curve qualitatively measures the success rate of LHI value. A total area equal to one denotes perfect prediction accuracy. Similarly, when the area under the curve is less than 0.5000, the model is invalid. In this study, area under the curves with InfoVal method ranged from 0.8198 to 0.8640. Likewise, area under the curves with WoE method ranged from 0.8213 to 0.8595. This implies that the success rate of InfoVal and WoE methods are more or less same. Analysis of the new landslide case shows a higher value of success rate than other two cases. Fig 5 represents prediction rate of InfoVal and WoE methods. InfoVal method has prediction rate 78.6% whereas WoE has prediction rate 79.5%. As mentioned in earlier section, prediction rate is independent test of hazard map accuracy and this study suggests that both methods have quite acceptable accuracy.
Effect analyses were also done to understand the predictive power of factor maps used in analysis. Total five combinations of geomorphology-, geology- and human interventions-related factors were used in effect analysis. Combinations of only geomorphology-related factors, geomorphology and geology-related factors, and geomorphology and human intervention-related factors revealed higher success rates in both methods.
Classified hazard map
For the purpose of classified hazard maps, reference to prediction rate curves (see Fig 5) was made and corresponding values of LHI in classes 30%, 50%, 70% and 90% LHI value were selected for hazard classification. Total five landslide hazard classes, very low (less than 30% class of low to high LHI value), low (30% - 50% class of low to high LHI value), moderate (50% - 70% class of low to high LHI value), high (70% - 90% class of low to high LHI value), and very high (more than 90% class of low to high LHI value, i.e., most higher LHI values) were established. On the basis of 30%, 50%, 70% and 90% of low to high LHI value calculated from both methods, two classified hazard maps were prepared for LHI values of new landslides and illustrated in Fig 6A and 6B. New landslide case is considered for final hazard maps preparation, because it has high success rate (see Fig 4).
Conclusions The conclusions of this study can be summarized as follows: The landslide hazard value estimated from different time based landslide data and eleven factor maps reveals
more or less a similar degree of success rate ranging from 80% to 86% for both InfoVal and WoE methods. In many approaches to InfoVal and WoE methods of landslide hazard or susceptibility assessment in GIS, the
model validation process is always dependent on the trained landslide data and the same landslide data are
Fig. 5, Prediction rate curves of landslide hazard
values calculated from old landslide inventory maps
in InfoVal method and similar prediction rate for WoE
method
0
10
20
30
40
50
60
70
80
90
100
0 10 20 30 40 50 60 70 80 90 100
Percentage of predicted landslides from high (1%) to low (100%) LHI
Per
cent
age
of o
bser
verd
land
slid
es
WOE Prediction rate: 79.45%
InfoVal Prediction rate: 78.61%

10
Fig. 6, Classified landslide hazard map of the south-western hills of Kathmandu valley after
A) InfoVal method and B) WoE method.
used for verification. In contrast, this study verified hazard maps independently with time-based new landslide data and results were very promising, having independent prediction rates nearly 80%. Moreover, prediction accuracy of WoE method is slightly more than InfoVal method (nearly 1% more). This validates both InfoVal and WoE methods (bivariate statistical approach) for landslide hazard assessment on the mountains of the Lesser Himalaya of Nepal.
The vigorous evaluation of predictive factors used in this study suggests that the role of geomorphology and human intervention-related factors is very significant for landslide processes in the Lesser Himalaya of Nepal.
The probability values estimated in these kinds of predictive methods are not absolute and represent relative degree of hazard. However, they can provide an appropriate and valid measure of landslide initiation locality on slopes of the Lesser Himalaya. Likewise, both InfoVal and WoE seems to have extensive applicability in the Lesser Himalaya of Nepal, with the limitation that knowledge of past landslide information affects the final probability values calculated by these methods.
References
Acharya, K.K. (2001) Geology and structure of the Pharping – Raniban area central Nepal, M. Sc. Thesis, Central Department of Geology, Tribhuvan University, Nepal, Unpublished, p. 58.
Agterberg, F.P., Bonham-Carter, G.F., Cheng, Q., and Wright, D.F. (1993) Weights of evidence modeling and

11
weighted logistic regression for mineral potential mapping. In: Davis, J.C., Herzfeld, U.C. (eds) Computers in geology, 25 years of progress, Oxford University Press, Oxford, p. 13–32.
Agterberg, F. P. (1992) Combining Indicator Patterns in Weights of Evidence Modeling for Resource
Evaluation, Natural Resources Research 1(1), 39–50. Atkinson, P.M. and Massari, R. (1998) Generalized linear modelling of landslide susceptibility in the Central
Apennines, Italy. Computer Geoscience 24(4), 373–385. Bonham-Carter, G.F., Agterberg, F. P. and Wright, D.F. (1988) Integration of geological datasets for gold
exploration in Nova Scotia. Photogram Eng Remo Sens 54, 1585–1592. Bonham-Carter, G. F., Agterberg, F.P. and Wright, D.F. (1989) Weights of evidence modelling: a new approach
to mapping mineral potential. Stat Appl Earth Sci Geol Survey Can Paper 89(9), 171–183. Bonham-Carter, G.F. (2002) Geographic information systems for geoscientist: Modelling with GIS. In:
Merriam, D.F. (Ed.), Computer Methods in the Geosciences, 13. Pergamon/Elsevier, New York, p. 302–334.
Chung, C.-J.F. and Fabbri, A.G.. (1999) Probabilistic prediction models for landslide hazard mapping,
Photogrammetric Engineering & Remote Sensing 65(12), 1389–1399. Chung, C.-J.F. and Fabbri, A. G (2003) Validation of spatial prediction models for landslide hazard mapping.
Natural Hazards 30, 451–472. Dahal, R. K., Hasegawa, S., Yamanaka, M. and Nishino, K. (2006) Rainfall triggered flow-like landslides:
understanding from southern hills of Kathmandu, Nepal and northern Shikoku, Japan. Proc 10th Int
Congr of IAEG, The Geological Society of London, IAEG2006 Paper number 819 :1-14 (CD-ROM). Dahal, R.K., Hasegawa, S., Nonomura A., Yamanaka, M., Masuda, T. and Nishino K. (2008) GIS-based
weights-of-evidence modelling of rainfall-induced landslides in small catchments for landslide
susceptibility mapping, Environmental Geology 54 (2): 314-324, DOI: 10.1007/s00254-007-0818-3. Dai, F.C., Lee, C.F., Li, J., and Xu Z.W. (2001) Assessment of landslide susceptibility on the natural terrain of
Lantau Island, Hong Kong. Environmental Geology 40, 381–391. Ganser, A. (1964) Geology of the Himalaya, Inter Science John Wiley, London, p. 289. Guzzetti F., Carrara A., Cardinali M., and Reichenbach P. (1999) Landslide hazard evaluation: a review of
current techniques and their application in a multi-scale study, Geomorphology 31, 181–216 Lee, S, Choi, J., Min, K. (2002) Landslide susceptibility analysis and verification using the Bayesian probability
model. Environmental Geology 43, 120–131 Lee, S. (2004) Application of likelihood Ratio and Logistic Regression Models to Landslide Susceptibility
mapping in GIS, Environmental Management 34(2), 223–232. Lee, S. and Choi, J. (2004) Landslide susceptibility mapping using GIS and the weights-of-evidence model. Int
J Geo gr Inf Sci 18, 789–814. Lee, S. and Sambath, T. (2006) Landslide susceptibility mapping in the Damrei Romel area, Cambodia using
frequency ratio and logistic regression models, Environmental Geology 50, 847-855 Lee, S., Ryu, J. and Kim, I. (2007) Landslide susceptibility analysis and its verification using likelihood ratio,
logistic regression and artificial neural network models: case study of Youngin, Korea. Landslides 4(4), 327–338.
Neuhäuser, B. and Terhorst, G.. (2007) Landslide susceptibility assessment using “weights-of-evidence” applied
to a study area at the Jurassic escarpment (SW-Germany), Geomorphology 86, 12–24. Paudel, P.P., Omura, H., Kubota, T. and Morita, K. (2003) Landslide damage and disaster management system
in Nepal. Disaster Prevention and Management 12 (5), 413–419.
12
Paudyal, P. and Dhital, M.R. (2005) Landslide hazard and risk zonation of Thankot – Chalnakhel area, central
Nepal, Journal of Nepal Geological Society 31, 43–50. Remondo, J., González, A., Ramón, J., Cendrero, A., Fabbri, A. and Chung, C.-J.F. (2003) Validation of
landslide susceptibility maps: examples and applications from a case study in Northern Spain. Natural
Hazards 30, 437–449. Saha, A.K., Gupta, R.P., Sarkar, I., Arora, M.K. and Csaplovics, E. (2005) An approach for GIS-based statistical
landslide susceptibility zonation - with a case study in the Himalayas, Landslides 2, 61–69. Siddle H.J., Jones D.B. and Payne H.R. (1991) Development of a methodology for landslip potential mapping
in the Rhondda Valley In: Chandler, R.J. (ed.) Slope Stability Engineering. London: Thomas Telford. P. 137-142.
Sharma, M. and Kumar, R. (2008) GIS-based landslide hazard zonation: a case study from the Parwanoo area,
Lesser and Outer Himalaya, H.P., India, Bull Eng Geol Environ, 67 (1), 129-137, DOI: 10.1007/s10064-007-0113-2.
Stöcklin, J. and Bhattarai, K.D. (1977) Geology of Kathmandu Area and Central Mahabharat Range Nepal Himalaya Kathmandu. HMG/UNDP Mineral Exploration Project, Technical Report, New York, p. 64.
Stöcklin, J. (1980) Geology of Nepal and its regional frame, Journal of the Geological Society London 137, 1-34.
Van Westen, C.J. (1997) Statistical landslide hazard analysis. In: Application guide, ILWIS 2.1 for Windows. ITC, Enschede, The Netherlands, p. 73–84.
Van Westen C.J., Rengers N. and Soeters R. (2003) Use of geomorphological information in indirect landslide
susceptibility assessment, Natural Hazards 30, 399–419. Varnes, D.J. (1984) Landslide Hazard Zonation: a review of principles and practice, Commission on landslides
of the IAEG, UNESCO, Natural Hazards No. 3, 61 pp. Wu, W. and Siddle, R.C. (1995) A distributed slope stability model for steep forested basins, Water Resource
Research 31, 2097–2110. Yin, K.L. and Yan, T.Z. (1988) Statistical prediction model for slope instability of metamorphosed rocks. In:
Proceedings of 5th Int Symp on Landslides, Lausanne, Switzerland (2), p. 1269–1272.