land resources allocation: general trends and …
TRANSCRIPT

LAND RESOURCES ALLOCATION: GENERAL TRENDS AND FUTURE SCENARIOS –
A WORLD WIDE PERSPECTIVE
by
Winfried E.H. Blum
Institute of Soil Research, Department of Forest and Soil Sciences, University of Natural Resources and Life Sciences
(BOKU) Vienna/Austria. [email protected]


GOODS AND SERVICES PROVIDED BY LAND AND SOIL
Soil
Ground Water
Biodiversity
Open Water
Atmosphere Biomass Production (e.g. food chain)
Human Health
W.E.H. Blum, 2004
Culture

Global map of land quality
Blum and Eswaran, 2004

GLOBAL LAND QUALITY WITH REGARD TO LAND SURFACE AND POPULATION DISTRIBUTION
Land Quality Class
Total Land Surface
World Population:
I 2,4 % 6,1 %
II, III 9,5 % 19,0 %
IV, V, VI 33,8 % 53,6 %
VII 9,0 % 11,5 %
VIII, IX 45,3 % 13,1 %
Blum and Eswaran, 2004

WORLD SOIL SUITABILITY FOR
SUSTAINING LIFE
~ 12 % of the land surface suitable for food and fiber production; ~ 24 % can be used for grazing ~ 31 % produce forests ~ 33 % unsuitable for any kind of sustainable use
(Buringh, 1998; FAO 1995)

LAND QUALITY CLASS (Percent of ice-free land surface) BIOMES
I II III IV V VI VII VIII IX Total
Tundra 15.62 15.62
Boreal 2.03 0.67 0.50 3.05 2.63 1.08 0.07 10.02
Temperate 2.14 2.55 0.70 1.31 4.76 1.66 2.01 0.15 15.29
Mediterranean 0.30 0.15 1.35 0.08 0.65 0.03 2.56
Desert 1.42 28.19 29.61
Tropical 0.25 2.43 1.51 1.83 9.90 8.53 2.31 0.16 26.90
Total 2.38 4.98 4.55 3.95 16.51 13.32 9.01 16.69 28.59 100.00
Percent of land area in major biomes as a function of land quality
Blum and Eswaran, 2004

Global map of land quality
Blum and Eswaran, 2004

6 MAIN GLOBAL TRENDS:
1.increase in world population and change in spatial distribution; 2. loss of fertile soils through urbanisation, industrialisation and further human impacts; 3. changing life style and demands for food;
4.increasing demands for bioenergy;
5.changes in world economy; 6.climate change; 7.decrease of fresh water supply.

1 Increase of world population and changes in its spatial distribution
• every year ~ 80-85 millions more = need for - more space; - more food; - more energy.
• every year 100-150 millions move from rural into urban areas or are born there: - loss of rural livelihoods (loss of subsistance farming); - increased pressure on the local, regional and world food markets
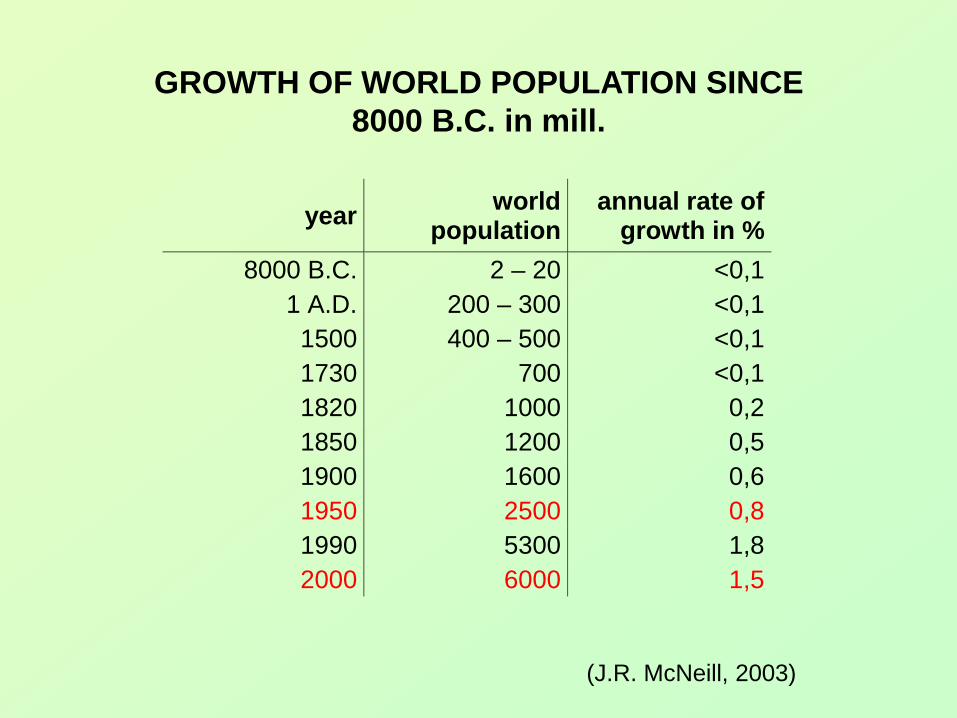
GROWTH OF WORLD POPULATION SINCE 8000 B.C. in mill.
year world population
annual rate of growth in %
8000 B.C. 2 – 20 <0,1 1 A.D. 200 – 300 <0,1 1500 400 – 500 <0,1 1730 700 <0,1 1820 1000 0,2 1850 1200 0,5 1900 1600 0,6 1950 2500 0,8 1990 5300 1,8 2000 6000 1,5
(J.R. McNeill, 2003)

Blum and Eswaran, 2004

2 Losses of fertile soils through urbanization, industrialisation and further human impacts

Global map of land quality
Blum and Eswaran, 2004

(Foley et al. 2005)


Europe’s built environment
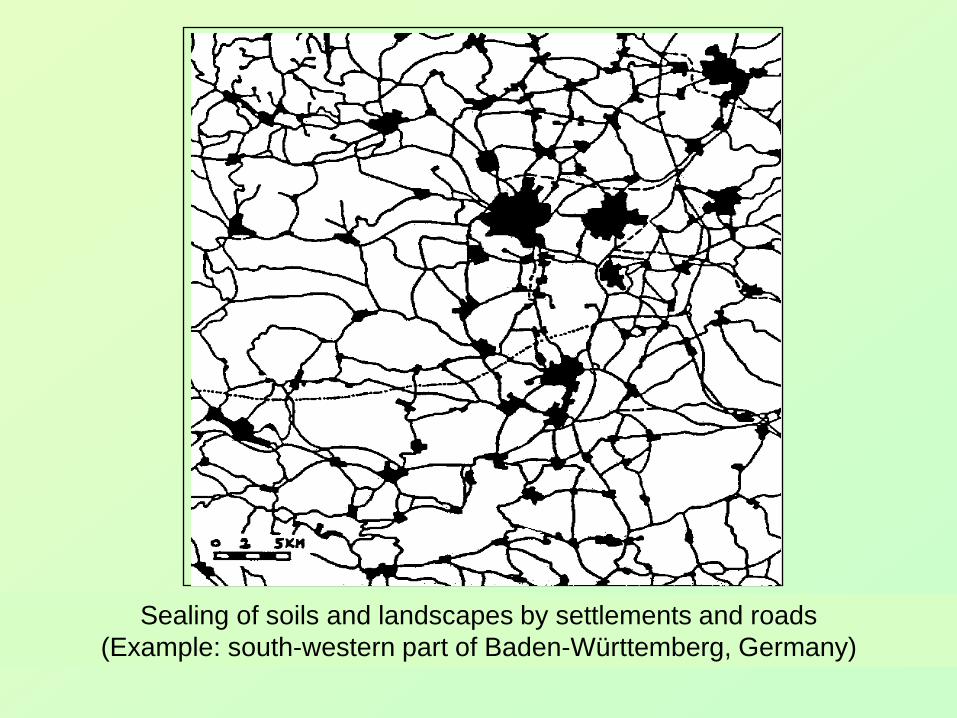
Sealing of soils and landscapes by settlements and roads (Example: south-western part of Baden-Württemberg, Germany)

Daily soil losses by urbanisation in the EU 27
(without additional losses through erosion, contamination, compaction, salinisation etc.)
Austria: ~ 9 - 11 ha
Germany: ~ 90 - 110 ha
Switzerland: ~ 6 - 8 ha
EU 27: ~ 350 – 400 ha

The impact of human activities on soil
Blocking of soil functions important to the ecology of the landscape Destruction of soil
Gradual destruction of soils Reduction in soil fertility
Manures and fertilisers
Sewage sludge
Gravel extraction
Compaction Gradual disappearance of farms
Pesticides & herbicides
Destruction of soil
Changes in the structure of soils Reduction in soil fertility
Sealing Destruction of humus
Accumulation/ Contamination
Contamination of soils and ground water with applied agrochemicals and atmospheric pollutants Changes in soil composition Adverse impacts on living organisms in the soil
Acidification
Release of toxic substances
Acids Diffuse input of contaminants as
particulates
Persistent substances
Salinisation
EU-JRC-IES-Ispra/Italy

3 Changes in life style and demand for food
- demand for more individual living space; - waste of food in industrialized countries and excessive food consumption, leading to obesity; - need for more grain because of increasing consumption of animal protein/meat etc.)

Grain for the production of animal protein:
- for 1 kg of chicken meat ~ 2-3 kg of grain
- for 1 kg of pork ~ 4-5 kg of grain
- for 1 kg of beef ~ 7-10 kg of grain

In compensation of all these demands, the average yields of cereals should be raised from 2.64 Mg/ha in the year 2000, to 3.60 Mg/ha in the year 2025, and to 4.30 Mg/ha in the year 2050, without taking into consideration other foodstuff (Lal, 2006).

4 Increasing demands for bioenergy [biogas, biofuel (biodiesel, ethanol), fiber]

BIOFUELS WORLDWIDE – 2011 (acc. to FAO/OECD)
13% of all grain } for ethanol 35 % of all sugar cane } production 16% of all vegetable oil for biodiesel Quotation: Pascal Lamy, Dir.Gen. WTO, Feb. 2011 in Berlin (Germany)

5 Impact of changes in world economy and emerging economic trends in food production and marketing
• increasing costs for agricultural land; • increasing production costs (energy, fertilizers, pesticides, agricultural machinery etc.; • new financial instruments for agricultural food/bioenergy production, e.g. hedging; • new financial instruments for agricultural production and marketing of agricultural products (speculative performances, e.g. hedging, derivates), causing volatilisation of prices, etc.; • land take in foreign countries = „land grabbing“ for agricultural production.

World
Country /Region
Farm, Household
Short-, medium- and long-term temporal scales
WTO (GATT) economic and social theories, property rights, price of energy
Market conditions, transport systems, social security, educational systems
Land tenure, family structure, family income, health care
Climate change, change in biodiversity
Macroclimate altitude, topography, biodiversity, soil distribution pattern, technical infrastructure
Microclimate, topography, soil quality, water resources, biodiversity
Cultural, Social and Economic Driving Forces
Ecological and Technical Driving Forces DIMENSION
OF SPACE
DRIVING FORCES OF LAND AND SOIL DEGRADATION - DIMENSIONS OF SPACE AND TIME

6. Climate change (temperature, precipitation, wind) and soil and land management

Climate change is causing
• global warming: - exceedence of temperature thresholds; - increased crop water requirements - increased incidence of pests and diseases; • alteration in precipitation patterns, soil moisture conditions and surface runoff; • increased occurrence of extreme weather events; • increased climate variability
0
5
10
15
20
25
30
1980 2000 2020 2040 2060 2080 2100
CO2 e
mis
sion
s G
tC
A1BA1FA2B1B2
300
400
500
600
700
800
900
1000
1980 2000 2020 2040 2060 2080 2100
CO2 p
pm
A1BA1FA2B1B2
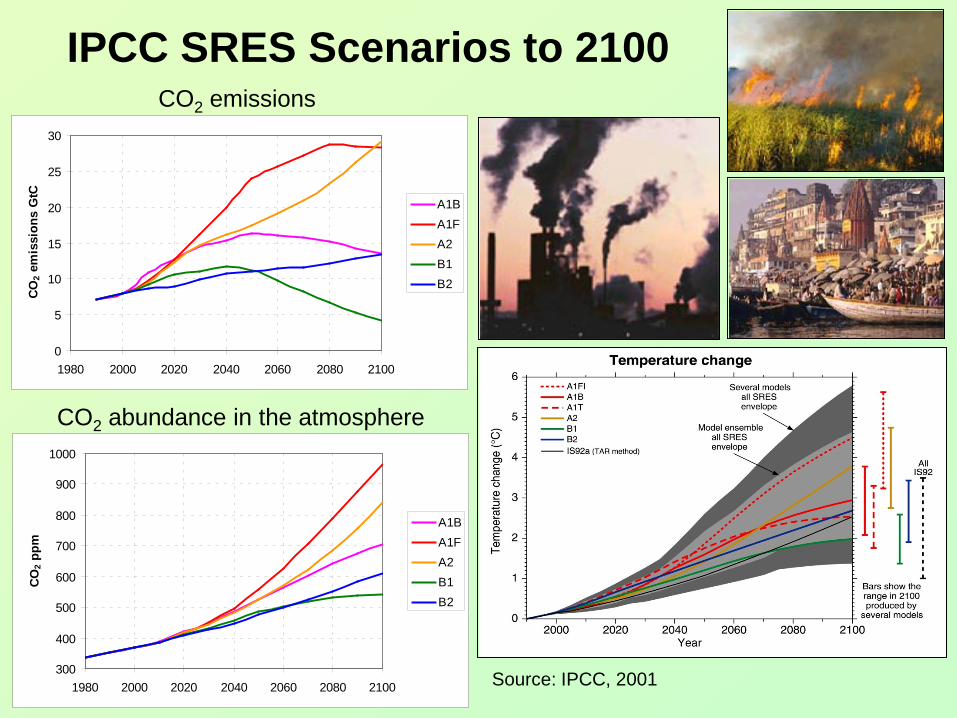
IPCC SRES Scenarios to 2100
CO2 abundance in the atmosphere
CO2 emissions
Source: IPCC, 2001

Annual mean temperature change: 2071 to 2100 relative to 1990
Source: IPCC, 2001.

Impacts of Climate Change on Multiple Cropping Production Potential of Rain-fed Cereals
Annual mean precipitation change: 2071 to 2100 relative to 1990 (Hadley Center)
Source: IPCC, 2001.

7 Decrease of fresh water supply
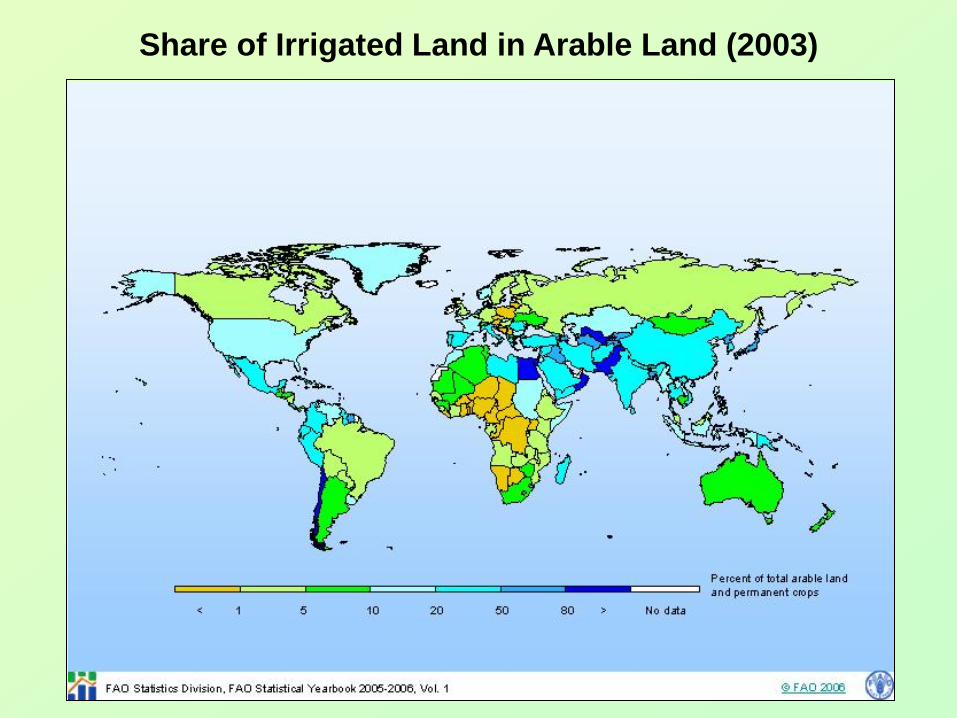
Share of Irrigated Land in Arable Land (2003)

SUMMARY AND CONCLUSIONS 1.The allocation of land resources is a complex task, because of its ecological, technical, social, economic and cultural dimensions and implications in space and time. 2.Future scenarios should be based on visible trends. However, uncertainties will remain, regarding the availability and acessibility of energy, changes in world economy and climate change. 3.Scientists cannot make decisions but can support politics and decision making by creating scenarios based on indicators developed by interdisciplinary and multidisciplinary approaches.
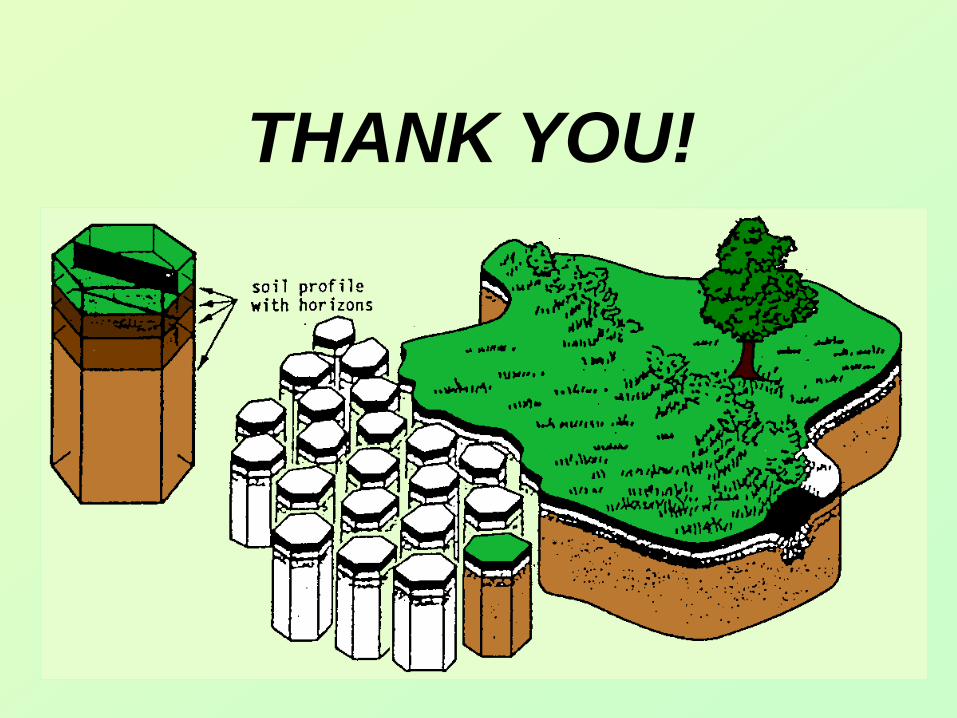
THANK YOU!