labviewtm core 1 exercises - usermanual.wiki · open flight delays.lvproj in the \labview core...
TRANSCRIPT

LabVIEWTM Core 1 Exercises
Copyright© 1993–2014 National Instruments. All rights reserved. Under the copyright laws, this publication may not be reproduced or transmitted in any form, electronic or mechanical, including photocopying, recording, storing in an information retrieval system, or translating, in whole or in part, without the prior written consent of National Instruments Corporation.
National Instruments respects the intellectual property of others, and we ask our users to do the same. NI software is protected by copyright and other intellectual property laws. Where NI software may be used to reproduce software or other materials belonging to others, you may use NI software only to reproduce materials that you may reproduce in accordance with the terms of any applicable license or other legal restriction.
End-User License Agreements and Third-Party Legal NoticesYou can find end-user license agreements (EULAs) and third-party legal notices in the following locations:
• Notices are located in the <National Instruments>\_Legal Information and<National Instruments> directories.
• EULAs are located in the <National Instruments>\Shared\MDF\Legal\Licensedirectory.
• Review <National Instruments>\_Legal Information.txt for more information onincluding legal information in installers built with NI products.

TrademarksRefer to the NI Trademarks and Logo Guidelines at ni.com/trademarks for more information on National Instruments trademarks.
ARM, Keil, and µVision are trademarks or registered of ARM Ltd or its subsidiaries.
LEGO, the LEGO logo, WEDO, and MINDSTORMS are trademarks of the LEGO Group.
TETRIX by Pitsco is a trademark of Pitsco, Inc.
FIELDBUS FOUNDATION™ and FOUNDATION™ are trademarks of the Fieldbus Foundation.
EtherCAT® is a registered trademark of and licensed by Beckhoff Automation GmbH.
CANopen® is a registered Community Trademark of CAN in Automation e.V.
DeviceNet™ and EtherNet/IP™ are trademarks of ODVA.
Go!, SensorDAQ, and Vernier are registered trademarks of Vernier Software & Technology. Vernier Software & Technology and vernier.com are trademarks or trade dress.
Xilinx is the registered trademark of Xilinx, Inc.
Taptite and Trilobular are registered trademarks of Research Engineering & Manufacturing Inc.
FireWire® is the registered trademark of Apple Inc.
Linux® is the registered trademark of Linus Torvalds in the U.S. and other countries.
Handle Graphics®, MATLAB®, Real-Time Workshop®, Simulink®, Stateflow®, and xPC TargetBox® are registered trademarks, and TargetBox™ and Target Language Compiler™ are trademarks of The MathWorks, Inc.
Tektronix®, Tek, and Tektronix, Enabling Technology are registered trademarks of Tektronix, Inc.
The Bluetooth® word mark is a registered trademark owned by the Bluetooth SIG, Inc.
The ExpressCard™ word mark and logos are owned by PCMCIA and any use of such marks by National Instruments is under license.
The mark LabWindows is used under a license from Microsoft Corporation. Windows is a registered trademark of Microsoft Corporation in the United States and other countries.
Other product and company names mentioned herein are trademarks or trade names of their respective companies.
Members of the National Instruments Alliance Partner Program are business entities independent from National Instruments and have no agency, partnership, or joint-venture relationship with National Instruments.
PatentsFor patents covering National Instruments products/technology, refer to the appropriate location: Help»Patents in your software, the patents.txt file on your media, or the National Instruments Patent Notice at ni.com/patents.
Support
Worldwide Technical Support and Product Informationni.com
Worldwide OfficesVisit ni.com/niglobal to access the branch office websites, which provide up-to-date contact information, support phone numbers, email addresses, and current events.
National Instruments Corporate Headquarters11500 North Mopac Expressway Austin, Texas 78759-3504 USA Tel: 512 683 0100For further support information, refer to the Additional Information and Resources appendix. To comment on National Instruments documentation, refer to the National Instruments website at ni.com/info and enter the Info Code feedback.

LabVIEW
Core 1
Participant Guide
© N
ational Instruments
|1-1
5
Exercise 1-1 Concept: Exploring a VI
GoalAs a class, identify the parts of an existing VI.
DescriptionYou received a VI from an employee that takes the seconds until a plane arrives at an airport and converts the time into a combination of hours/minutes/seconds. You must evaluate this VI to see if it works as expected and can display the remaining time until the plane arrives.
1. Open Flight Delays.lvproj in the <Exercises>\LabVIEW Core 1\Exploring A VI directory.
2. Open Seconds Breakdown.vi from the Project Explorer window.
3. On the front panel, identify the following items. How many can you find of each item?
Controls
Indicators
Free labels
Run button
Icon
Connector pane
4. Press <Ctrl-T> to view the front panel and block diagram at the same time or select Window»Tile Up and Down or Window»Tile Left and Right.
Tip To switch between the front panel window and the block diagram without tiling the windows, press <Ctrl-E>.
5. On the block diagram, identify the following items. How many can you find of each item?
Controls
Indicators
Constants
Free labels

Lesson 1N
avigating LabVIEW
1-1
6|
ni.com
6. Use the Context Help to learn more about the items on the block diagram.
Press <Ctrl-H> to open the Context Help window or select Help»Show Context Help.
Move the Context Help window to a convenient area where the window does not hide part of the block diagram.
Place your cursor over each of the different color wires to see which data type they represent.
The Context Help window content changes to show information about the object that your mouse is over.
7. Get detailed help for the Quotient & Remainder function.
Place your cursor over the Quotient & Remainder function. Read the Context Help window and click the Detailed Help link to launch the LabVIEW Help and learn more about this function.

LabVIEW
Core 1
Participant Guide
© N
ational Instruments
|1-1
7
8. Refer to Figures 1-1 and 1-2 to verify that you identified all items correctly.
Figure 1-1. Front Panel Items
1 Indicators 2 Control 3 Run Button 4 Connector Pane 5 Icon
2
3 4 5
1

Lesson 1N
avigating LabVIEW
1-1
8|
ni.com
Figure 1-2. Block Diagram Items
1 Free Labels 2 Control 3 Indicators 4 String Constants 5 Numeric Constants
1
5
3
5
4
2

LabVIEW
Core 1
Participant Guide
© N
ational Instruments
|1-1
9
9. Test the Seconds Breakdown VI using the values given in Table 1-1.
Enter an input value in the Total Time in Seconds control.
Click the Run button.
For each input, compare the given outputs to the outputs listed in Table 1-1. If the VI works correctly, they should match.
10. Save and close the VI and the LabVIEW Project.
End of Exercise 1-1
Table 1-1. Testing Values for Seconds Breakdown.vi
Input Numeric Indicators LED Indicator String Indicator
0 seconds 0 hours, 0 minutes, 0 seconds Off Delay less than 1 hour
60 seconds 0 hours, 1 minute, 0 seconds Off Delay less than 1 hour
3600 seconds 1 hour, 0 minutes, 0 seconds On Delay 1 hour or longer
3665 seconds 1 hour, 1 minute, 5 seconds On Delay 1 hour or longer

Lesson 1N
avigating LabVIEW
1-2
2|
ni.com
Exercise 1-2 Concept: Locating Controls, Functions, and VIsGoalLearn to use the palettes and search for controls, functions, and VIs.
Description1. Open a blank LabVIEW project.
Click the Create Project button in the LabVIEW Getting Started window and then click Blank Project.
Click Finish.
2. Create a blank VI and add it to the project.
Right-click My Computer in the Project Explorer window and select New»VI from the shortcut menu.
3. Select View»Controls Palette from the menu of the VI front panel window.
4. Customize the Controls palette.
Click the Customize button and select Change Visible Palettes.
Select the following palettes to add them to the Controls palette and click the OK button. Do not deselect any palettes.
– Silver
– Control & Simulation
– Signal Processing
Notice that the three palettes you just selected now appear in the Controls window.
5. Explore the Controls palette.
Use palettes to locate controls and functions when you want to explore the options available to you or when you are not sure of the name of the control or function you need.
Click the Search button.
Type string control in the search text box.
Click String Control (Silver) in the search results and drag it to the front panel window to place the object.

LabVIEW
Core 1
Participant Guide
© N
ational Instruments
|1-2
3
6. Open the block diagram and right-click anywhere on the block diagram to display the Functions palette.
Click the pin in the upper left-hand corner to keep the palette open.
Tip You can customize the Functions palette just like you customized the Controls palette.
7. Explore the Functions palette.
Locate trigonometric functions.
– Click the Search button.
– Search for the term cosine.
– In the search results, double-click Cosine <<Trigonometric Functions>> to display the function on the palette.
Locate file I/O functions.
– Search for the term file i/o.
– Double-click File I/O in the search results to display the File I/O palette.
– Drag the Write To Text File function from the palette to the block diagram.
8. Practice using the Quick Drop feature.
Use the Quick Drop feature when you know the name of the function or VI you want to use.
Press <Ctrl-Space> to open the Quick Drop dialog box.
Type Bundle By Name and double-click Bundle By Name in the search results. The cursor changes to a hand with the Bundle By Name function.
Click on the block diagram to place the Bundle By Name function.
Open the Quick Drop dialog box again.
Search for the Wait Until Next ms Multiple.
Double-click the function in the search results and place the function on the block diagram.
9. Practice using the global search feature.
Type Random in the Search bar in the upper right hand corner of the block diagram.
Note As you type, the global search automatically looks for matches in the LabVIEW Help and LabVIEW palettes. It also searches for online material related to your query.

Lesson 1N
avigating LabVIEW
1-2
4|
ni.com
Hover the mouse over the first result in the Palette section, Random Number (0-1). You now see the following three options:
– Drop—Allows you to place this function immediately on the block diagram
– Find—Locates the function on the Functions palette
– Help—Brings up the help topic for this function.
Click each of these options to observe the different behaviors.
10. Practice accessing similar functions.
Place an Add function on the block diagram.
Right-click the Add function and notice that Numeric palette is available from the shortcut menu.
Practice placing functions from the Numeric palette on the block diagram.
11. Close the VI and LabVIEW project. You do not need save the files.
End of Exercise 1-2

LabVIEW Core 1 Participant Guide
© National Instruments | 2-13
Exercise 2-1 Selecting a Tool
GoalBecome familiar with automatic tool selection and the Tools palette in LabVIEW.
DescriptionDuring this exercise, you complete tasks in a partially built front panel and block diagram. These tasks give you experience using the automatic tool selection.
1. Open Using Temperature.lvproj in the <Exercises>\LabVIEW Core 1\Using Temperature directory.
2. Open Using Temperature.vi from the Project Explorer window.
3. Select View»Tools Palette from the menu to display the Tools window.
Tip Press <Shift> and right-click the front panel to open the Tools palette temporarily.
Figure 2-5 shows an example of the front panel as it appears after your modifications. In steps 4 through 9 you increase the size of the waveform chart, rename the numeric control, change the value of the numeric control, and move the knob.
Figure 2-5. Using Temperature VI Front Panel

Lesson 2 Creating Your First Application
2-14 | ni.com
4. Expand the waveform chart horizontally using the Positioning tool.
Move the cursor to the right edge of the Chart waveform chart until you see the resizing nodes appear around the chart.
Move the cursor to the middle right resizing node until the cursor changes to a double arrow, as shown in Figure 2-6.
Figure 2-6. Resize Waveform Chart
Drag the repositioning node until the waveform chart is the size you want.
5. Rename the waveform chart using the Labeling tool.
Double-click the word Chart. LabVIEW highlights the word and automatically selects the Labeling tool in the Tools window.
Enter the text Temperature Chart.
Complete the entry by clicking outside the control label or clicking the Enter Text button on the toolbar.
Notice that LabVIEW automatically returns to the Positioning tool in the Tools window. The Positioning tool is the default tool. If LabVIEW does not switch back to the Positioning tool, click the Automatic Tool Selection button in the Tools window to enable automatic tool selection.
6. Rename the Numeric control to Number of Measurements using the Labeling tool.
Double click the word Numeric.
Enter the text Number of Measurements.
Complete the entry by clicking outside the control or clicking the Enter Text button on the toolbar.
7. Change the value of the Number of Measurements control to 100 using the Labeling tool.
Move the cursor to the interior of the Number of Measurements control.
When the cursor changes to the Labeling tool icon, click the mouse button.
Enter the text 100.
LabVIEW Core 1 Participant Guide
© National Instruments | 2-15
Complete the entry by clicking outside the control, clicking the Enter Text button on the toolbar, or pressing the <Enter> key on the numeric keypad,
Change the value of the Delay Multiplier knob using the Operating tool.
Move the cursor to the knob.
When the cursor changes to the Operating tool icon, press the mouse button and drag to the value you want.
Set the value to 1.
8. Change the color of the Delay Multiplier knob using the Coloring tool.
Click the background square in the Coloring button and select a color from the color picker.
When the cursor changes to a paintbrush, click the Delay Multiplier knob.
Click the Automatic Tool Selection button again to turn on automatic tool selection.
9. Try changing the value of objects, resizing objects, and renaming objects until you are comfortable with using these tools.
10. Open the block diagram of the VI.
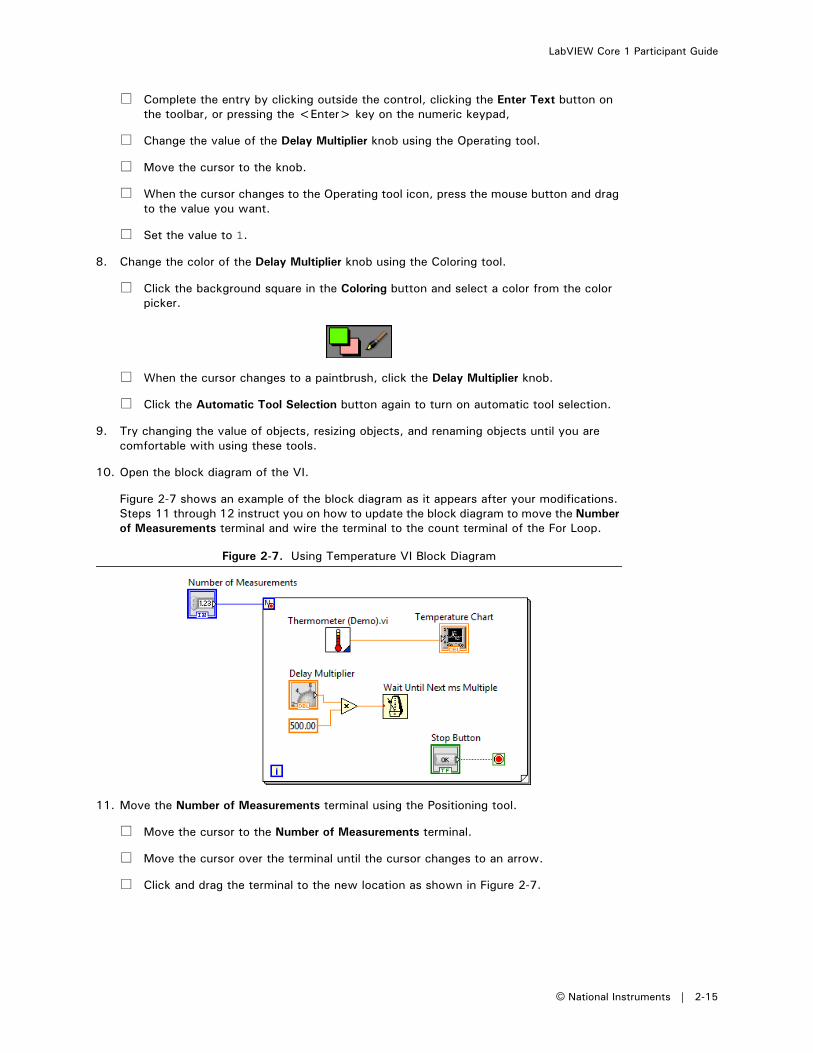
Figure 2-7 shows an example of the block diagram as it appears after your modifications. Steps 11 through 12 instruct you on how to update the block diagram to move the Number of Measurements terminal and wire the terminal to the count terminal of the For Loop.
Figure 2-7. Using Temperature VI Block Diagram
11. Move the Number of Measurements terminal using the Positioning tool.
Move the cursor to the Number of Measurements terminal.
Move the cursor over the terminal until the cursor changes to an arrow.
Click and drag the terminal to the new location as shown in Figure 2-7.

Lesson 2 Creating Your First Application
2-16 | ni.com
12. Wire the Number of Measurements terminal to the count terminal of the For Loop using the Wiring tool.
Move the cursor to the Number of Measurements terminal.
Move the cursor to the right of the terminal, stopping when the cursor changes to a wiring spool.
Click to start the wire.
Move the cursor to the count (N) terminal of the For Loop.
Click the count terminal to end the wire.
13. Try moving other objects, deleting wires and rewiring them, and wiring objects and wires together until you are comfortable with using these tools.
14. Automatically clean up the entire block diagram.
Click the Clean Up Diagram button on the LabVIEW toolbar.
Press <Ctrl-Z> to undo the clean-up.
Tip You can also select specific objects to clean up, such as wires or individual nodes. <Shift>-click to select multiple objects and then click the Clean Up Diagram button. LabVIEW cleans up only the objects that you select and not the entire block diagram. Configure how LabVIEW cleans up objects by selecting Tools»Options from the menu, clicking the Block Diagram category, and changing the options in the Block Diagram Cleanup section.
15. Change the Boolean text of the Stop button.
Note Boolean controls and indicators have Boolean text labels in addition to their control labels. Boolean text labels change depending on the value of the control or indicator. The label for the control or indicator does not change depending on the value of the control or indicator.

LabVIEW Core 1 Participant Guide
© National Instruments | 2-17
Right-click the Stop Button terminal and select Properties from the shortcut menu. Set the properties as shown in Figure 2-8.
Figure 2-8. Changing the Boolean Text for the Stop Control
Click the OK button to close the dialog box.
Right-click the Stop Button terminal and select Find Control from the shortcut menu. Notice the control label is Stop Button and the button text is End.
Tip You can also double-click the Stop Button terminal to find the button control on the front panel.
16. Click the Run button to run the VI.
The time required to execute this VI is equivalent to Number of Measurements times Delay Multiplier. When the VI is finished executing, the Temperature Chart displays the data.
17. Close the VI and click the Don’t Save - All button. You do not need to save the VI.
End of Exercise 2-1
1 Control label—This text identifies the terminal of the Boolean control for programming purposes. This text does not appear on the front panel unless you select Visible.
2 Boolean text—This text appears only on the front panel, and by default, appears in the center of the Boolean control.
1
2

LabVIEW Core 1 Participant Guide
© National Instruments | 2-23
Exercise 2-2 Simple AAV VI
GoalCreate a simple VI that acquires, analyzes, and displays data.
ScenarioYou need to acquire a sine wave for 0.1 seconds, determine and display the average value, log the data, and display the sine wave on a graph.
DesignThe input for this problem is an analog channel of sine wave data. The outputs include a graph of the sine data, a file that logs the data, and an indicator that displays the average data value.
FlowchartThe flowchart in Figure 2-9 illustrates the data flow for this design.
Figure 2-9. Simple AAV VI Flowchart
Implementation1. Prepare your hardware to generate a sine wave. If you are not using hardware, skip to
step 2.
Find the BNC-2120 and visually confirm that it is connected to the DAQ device in your computer.
Using a BNC cable, connect the Analog In Channel 1 to the Sine Function Generator, as shown in Figure 2-10.
Set the Frequency Selection switch and the Frequency Adjust knob to their lowest levels.
Acquire Data
DetermineAverage Value
ACQUIRE ANALYZE VISUALIZE
Display AverageValue
Display Data
Log Data

Lesson 2 Creating Your First Application
2-24 | ni.com
Figure 2-10. Connections for the BNC-2120
2. Open LabVIEW.
3. Create a blank project. Save the project as Simple AAV.lvproj in the <Exercises>\LabVIEW Core 1\Simple AAV directory.
4. Add a new VI to the project from the Project Explorer window and save the VI as Simple AAV.vi in the <Exercises>\LabVIEW Core 1\Simple AAV directory.
EL
RTTSNI
NAMUNOI A
STN_+ FloatingSource (FS) _+Ground Ref.
Source (GS)
AO
ANALOG OUTPUTS
ANALOG INPUTS
DIGITAL I/O
FUNCTION GENERATOR
Frequency Selection
Amplitude Adjust
Sine/Triangle TTL Square Wave
Frequency Adjust
GSFS GSFS
GSFS GSFS
GSFS GSFS
GSFS GSFS
AI 0 AI 1
USER 1
USER 2
P0.7
P0.6
P0.5
P0.4
P0.3
P0.2
P0.1
P0.0
D GND
AI 2
BNC
RES+AI GNDAI SENSERES-
1
2
3
4
Temp.Ref.
0.1-10 kHz
LO HI LO HI
1-100 kHz 13-1000 kHz
ThermocoupleBNC
RES
AI 3
BNC
AI 3
AI 4 AI 5
AI 6 AI 7
AO 0 AO 1
USER-DEFINEDSIGNALS*
*For BNC connections, wire anyTiming I/O or Digital I/O screw terminals here.
PWRBNC-2120TIMING I/O
PFI 0 / P1.0
96 Pulses/Rev
QuadratureEncoder
PFI 1 / P1.1
PFI 2 / P1.2
PFI 3 / P1.3
PFI 4 / P1.4
PFI 5 / P1.5
PFI 6 / P1.6
PFI 7 / P1.7
PFI 8 / P2.0
PFI 9 / P2.1
PFI 12 / P2.4
PFI 13 / P2.5
PFI 14 / P2.6
+5 V
PULSES
UP/DN
D GND
1.2.3.4.
!

LabVIEW Core 1 Participant Guide
© National Instruments | 2-25
In steps 5 through 6 you will build a front panel similar to the one in Figure 2-11.
Figure 2-11. Simple AAV VI Front Panel Window
5. Add a waveform graph to the front panel window to display the acquired data.
Press <Ctrl-Space> to open the Quick Drop dialog box.
Type Waveform in the text box and double-click Waveform Graph (Silver) in the search results list.
Place the graph in the front panel window.
6. Add a numeric indicator to the front panel window to display the average value.
Press <Ctrl-Space> to open the Quick Drop dialog box.
Type Numeric Indicator in the text box and double-click Numeric Indicator (Silver) in the search results list.
Place the indicator in the front panel window.
Change the numeric indicator label to Average Value.

Lesson 2 Creating Your First Application
2-26 | ni.com
In the steps 7 through 14 you build a block diagram similar to the one in Figure 2-12.
Figure 2-12. Simple AAV VI Block Diagram
7. Open the block diagram of the VI by selecting Window»Show Block Diagram.
Note The terminals corresponding to the front panel window objects appear on the block diagram.
8. Acquire a sine wave for 0.1 seconds by following the instructions in Table 2-1. If you have hardware installed, follow the instructions in the Hardware Installed column to acquire the data using the DAQ Assistant. If you do not have hardware installed, follow the instructions in the No Hardware Installed column to simulate the acquisition using the Simulate Signal Express VI.
Table 2-1. Instructions for Acquiring or Simulating Data
Hardware Installed No Hardware Installed
1. Press <Ctrl-Space> to open the Quick Drop dialog box.
1. Press <Ctrl-Space> to open the Quick Drop dialog box.
2. Type DAQ Assist in the text box and double-click DAQ Assistant in the search results list.
2. Type Simulate Signal in the text box and double-click Simulate Signal in the search results list.
3. Place the DAQ Assistant on the block diagram.
3. Place the Simulate Signal Express VI on the block diagram.
4. Wait for the DAQ Assistant dialog box to open.
4. Wait for the Simulate Signal dialog box to open.
5. Select Acquire Signals»Analog Input»Voltage for the measurement type.
5. Select Sine for the signal type.
6. Select ai1 (analog input channel 1) for the physical channel.
6. Set the signal frequency to 100.
7. Click the Finish button. 7. In the Timing section, set the Samples per second (Hz) to 1000.

LabVIEW Core 1 Participant Guide
© National Instruments | 2-27
Tip Reading 100 samples at a rate of 1,000 Hz retrieves 0.1 seconds worth of data.
9. Use the Statistic Express VI to determine the average value of the data acquired.
Press <Ctrl-Space> to open the Quick Drop dialog box.
Type statistics in the text box and double-click Statistics [NI_ExpressFull.lvlib] in the search results list.
Place the Statistics Express VI on the block diagram to the right of the DAQ Assistant (or Simulate Signal Express VI).
Wait for the Statistics Express VI dialog box to open.
Place a checkmark in the Arithmetic mean checkbox.
Click the OK button.
10. Log the generated sine data to a LabVIEW Measurement File.
Press <Ctrl-Space> to open the Quick Drop dialog box.
Type write to measurement in the text box and double-click Write to Measurement File in the search results list.
Place the Write to Measurement File Express VI on the block diagram below the Statistics Express VI.
Wait for the Write to Measurement File Express VI dialog box to open.
Leave all configuration settings in the Write to Measurement File dialog box as default.
Click the OK button.
Note Future exercises do not detail the directions for finding specific functions or controls in the palettes. Use Quick Drop, the palette search feature, or the global search to locate functions and controls.
11. Wire the data from the DAQ Assistant (or Simulate Signal Express VI) to the Statistics Express VI.
Place the mouse cursor over the data output of the DAQ Assistant (or the Sine output of the Simulate Signal Express VI) at the location where the cursor changes to the Wiring tool.
Click the mouse button to start the wire.
8. In the Timing Settings section, select N Samples as the Acquisition Mode.
8. In the Timing section, deselect Automatic for the Number of samples.
9. In the Timing Settings section enter 100 in Samples To Read.
9. In the Timing section, set the Number of samples to 100.
10. Enter 1000 in Rate (Hz). 10. In the Timing section, select the Simulate acquisition timing option.
11. Click the OK button. 11. Click the OK button.
Table 2-1. Instructions for Acquiring or Simulating Data (Continued)
Hardware Installed No Hardware Installed

Lesson 2 Creating Your First Application
2-28 | ni.com
Place the mouse cursor over the Signals input of the Statistics Express VI and click the mouse button to end the wire.
12. Wire the data to the graph indicator.
Place the mouse cursor over the data output wire of the DAQ Assistant (or the Sine output of the Simulate Signal Express VI) at the location where the cursor changes to the Wiring tool.
Click the mouse button to start the wire.
Place the mouse cursor over the Waveform Graph indicator and click the mouse button to end the wire.
13. Wire the Arithmetic Mean output of the Statistics Express VI to the Average Value numeric indicator.
Place the mouse cursor over the Arithmetic Mean output of the Statistics Express VI at the location where the cursor changes to the Wiring tool.
Click the mouse button to start the wire.
Place the mouse cursor over the Average Value numeric indicator and click the mouse button to end the wire.
14. Wire the data output to the Signals input of the Write Measurement File Express VI.
Place the mouse cursor over the data output wire of the DAQ Assistant (or the Sine output of the Simulate Signal Express VI) at the location where the cursor changes to the Wiring tool.
Click the mouse button to start the wire.
Place the mouse cursor over the Signals input of the Write Measurement File Express VI and click the mouse button to end the wire.
Note Future exercises do not detail the directions for wiring between objects.
15. Save the VI.
Test1. Switch to the front panel window of the VI.
2. Set the graph properties to be able to view the sine wave.
Right-click the waveform graph and select X Scale»Autoscale X to remove the checkmark and disable autoscaling.
Use the labeling tool to change the last number on the Time scale of the waveform graph to .1.
3. Save the VI.
4. Click the Run button on the front panel toolbar to run the VI. The graph indicator should display a sine wave and the Average Value indicator should display a number around zero. If the VI does not run as expected, review the implementation steps.
5. Close the VI.
End of Exercise 2-2

LabVIEW
Core 1
Participant Guide
© N
ational Instruments
|3-9
Exercise 3-1 Debugging
GoalUse the debugging tools built into LabVIEW.
DescriptionThe VIs in this exercise check the validity of a triangle and then calculate the area. For a triangle to be valid, all three sides must have a length that is greater than zero. The subVI in this exercise uses Heron’s formula to calculate the area of a triangle. You can use this method when you know the lengths of all three sides of a triangle.
Heron’s formula
where
The default values, which you will use to debug and test this VI, are Side A = 6, Side B = 8, Side C = 10. Therefore the correct values are as follows:
You might want to refer to this calculation as you debug the VI.
Complete the following sections to identify and fix edit-time and run-time issues. Use single-stepping and execution highlighting to step through the VI. Use breakpoints and probes to determine if the calculations are correct and figure out where an error originates.
A s s a–( ) s b–( ) s c–( )=
s a b c+ +2----------------------=
s 6 8 10+ +2
------------------------ 12= =
A 12 6 4 2××× 24= =

Lesson 3Troubleshooting and D
ebugging VIs
3-1
0|
ni.com
Edit-Time ErrorsLocate and correct errors that prevent the VI from running.
1. Open and examine the area and validity of a triangle VI.
Open Debug.lvproj in the <Exercises>\LabVIEW Core 1\Debugging directory.
Open Area and Validity of a Triangle VI from the Project Explorer window.
Figure 3-1. Area and Validity of a Triangle VI Front Panel
Notice the Run button on the toolbar appears broken, indicating that the VI is broken and cannot run.
LabVIEW
Core 1
Participant Guide
© N
ational Instruments
|3-1
1
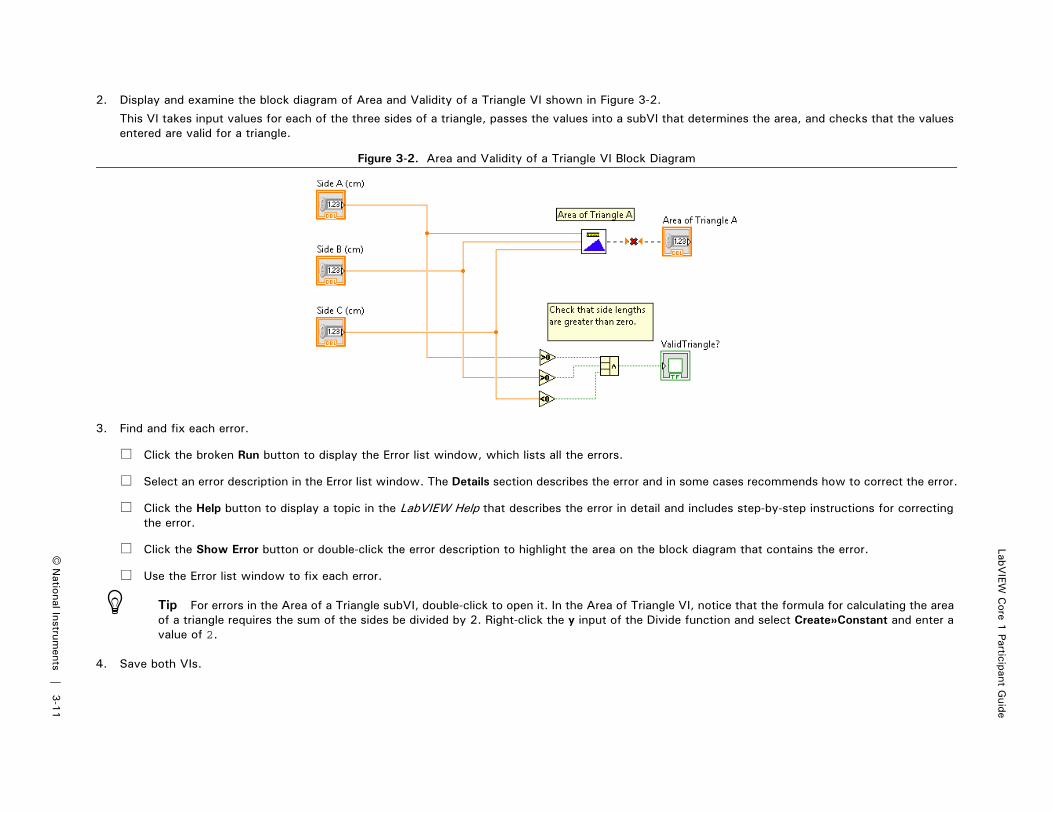
2. Display and examine the block diagram of Area and Validity of a Triangle VI shown in Figure 3-2.
This VI takes input values for each of the three sides of a triangle, passes the values into a subVI that determines the area, and checks that the values entered are valid for a triangle.
Figure 3-2. Area and Validity of a Triangle VI Block Diagram
3. Find and fix each error.
Click the broken Run button to display the Error list window, which lists all the errors.
Select an error description in the Error list window. The Details section describes the error and in some cases recommends how to correct the error.
Click the Help button to display a topic in the LabVIEW Help that describes the error in detail and includes step-by-step instructions for correcting the error.
Click the Show Error button or double-click the error description to highlight the area on the block diagram that contains the error.
Use the Error list window to fix each error.
Tip For errors in the Area of a Triangle subVI, double-click to open it. In the Area of Triangle VI, notice that the formula for calculating the area of a triangle requires the sum of the sides be divided by 2. Right-click the y input of the Divide function and select Create»Constant and enter a value of 2.
4. Save both VIs.

Lesson 3Troubleshooting and D
ebugging VIs
3-1
2|
ni.com
Run-Time ErrorsIdentify and correct errors that cause the VI to behave unexpectedly and return incorrect responses.
1. Test the VI.
Display the front panel by clicking it or by selecting Window»Show Front Panel.
Use the default values for each side. These values are valid measurements for a triangle.
Run the VI.
Notice that although the numbers you entered are valid, the LED is not illuminated and the Area of a Triangle indicator displays NaN.
2. Animate the flow of data through the block diagram.
Display the block diagram.
Click the Highlight Execution button on the toolbar to enable execution highlighting.
Click the Retain Wire Values button on the toolbar so you can see the last value passed on a wire.
Run the VI.
Notice that you can see how data flows through the wires. At the output of each node, you can see the data value displays momentarily. Because you have enabled the Retain Wire Values button, you can probe the last value in the wire.

LabVIEW
Core 1
Participant Guide
© N
ational Instruments
|3-1
3
3. Probe the wire values.
Right-click each of the input wires to the Compound Arithmetic Function and select Probe. This displays the Probe Watch Window.
Notice that one of the wire values is False as shown in Figure 3-3.
Figure 3-3. Probe Wires
Because you are checking to see that all three sides of the triangle have positive lengths, either the input value is invalid or the logic is incorrect. The input values were all positive numbers, so that means the logic is incorrect.
Notice that the node returning a value of False is a Less than Zero? function, but this section of code should be checking to see if the value is greater than zero.
Right-click the Less than Zero? function and select Replace»Comparison Palette»Greater than Zero?.

Lesson 3Troubleshooting and D
ebugging VIs
3-1
4|
ni.com
4. Test the VI.
Run the VI.
Notice that all the probe values are all True.
Display the front panel. Notice that the Valid Triangle? LED is illuminated, but the Area of Triangle indicator is still returning NaN.
The area of the triangle is calculated in the subVI, so you must continue debugging in the Area of a Triangle subVI.
5. Continue debugging the subVI.
Display the block diagram of the Area and Validity of a Triangle VI.
Click the Step Into button to start single-stepping through the VI. Execution highlighting shows the flow of data on the block diagram from one node to another. Nodes blink to indicate they are ready to execute.
Click the Step Over button after each node to step through the entire block diagram until you get to the subVI. Each time you click the Step Over button, the current node executes and pauses at the next node.
When you get to the subVI, click the Step Into button to open the block diagram of the Area of Triangle subVI. The subVI is paused.
Turn on Execution Highlighting and Retain Wire Values in the subVI.

LabVIEW
Core 1
Participant Guide
© N
ational Instruments
|3-1
5
Right-click the output of the Square Root function and select Breakpoint»Set Breakpoint as shown in Figure 3-4.
Figure 3-4. Set Breakpoint
6. Click the red pause button to resume the execution of the VI.
The VI continues executing until the breakpoint and then pauses again.
7. Examine the values on the wires
Move the cursor to hover over the input wire of the Square Root function. You should see a tip strip with a value of -576. You cannot take the square root of a negative number, which is why the Area of Triangle indicator returns NaN.
Tip If you cannot see the tip strip, you can click the wire to open the Probe Watch window to see the value.
Hover over other wires or use the Probe Watch window to examine other intermediate values.
Notice that the value on the (S-B) wire is also a negative number. If you look more closely, you notice that the inputs for the subtract function are reversed.
Click the Abort button to stop the VI.
Switch the inputs for the (S-B) Subtract function.
Tip Press <Ctrl> and click one of the inputs to switch them. When you press <Ctrl> and hover over an input, you see the cursor change.
8. Save the VI.
1 The breakpoint stops the VI after the Square Root node executes and before the value is output to the Area of Triangle indicator.
1

Lesson 3Troubleshooting and D
ebugging VIs
3-1
6|
ni.com
9. Test the Area of Triangle VI.
Run the VI again.
Check the intermediate values as the VI runs or hover over the wires after it pauses at the breakpoint and verify that the values returned are correct. The square root function should return a value of 24.
Right-click the breakpoint and select Breakpoint»Clear Breakpoint.
Turn off execution highlighting in the Area of Triangle VI and the Area and Validity of a Triangle VI.
Save both VIs.
Test
1. Test the Area and Validity of a Triangle VI using the values for Side A, Side B, and Side C in Table 3-1. For each set of test values, record the area you get when you run the VI.
2. Save and close the VI when you are finished testing.
End of Exercise 3-1
Table 3-1. Area and Validity of a Triangle Test Values
Side A Side B Side C Area
24 30 18
12 12 12
15 20 25
Table 3-2. Area and Validity of a Triangle Test Values - Area Answers
Side A Side B Side C Area
24 30 18 216
12 12 12 62.35
15 20 25 150

Lesson 4U
sing Loops
4-8
|ni.com
Exercise 4-1 Pass Data Through Tunnels
GoalUse a While Loop and an iteration terminal and pass data through a tunnel.
ScenarioCreate a VI that continuously generates random numbers between 0 and 1000 until it generates a number that matches a number selected by the user. Determine how many random numbers the VI generated before generating the matching number.
DesignUse the following flowchart and input/output list to create the VI for this exercise. The flowchart in Figure 4-1 illustrates the data flow for this design.

LabVIEW
Core 1
Participant Guide
© N
ational Instruments
|4-9
Figure 4-1. Auto Match Flowchart
No
Yes
Display Numberof Iterations
Display Valueto User
Round to NearestInteger Value
Multiply by 1000
Generate aRandom NumberBetween 0 and 1
Add 1 toIterationTerminal
= Numberto Match?

Lesson 4U
sing Loops
4-1
0|
ni.com
Inputs and OutputsThe following table describes the inputs and outputs for this exercise.
Implementation
1. Create a blank project and save it as Auto Match.lvproj in the <Exercises>LabVIEW Core 1\Auto Match directory.
2. Create a new VI in the project and save it as Auto Match.vi in the same directory as the project.
3. Build the front panel shown in Figure 4-2.
Figure 4-2. Auto Match VI Front Panel
Table 4-1. Auto Match VI Inputs and Outputs
Type Name Properties
Numeric control Number to Match Double-precision, floating-point between 0 and 1000, coerce to nearest whole number, default value = 50
Numeric indicator Current Number Double-precision, floating-point
Numeric indicator Number of Iterations Integer
1 Set the default value of the Number to Match control to 50—Enter 50 in the Number to Match control and then right-click the control and select Data Operations»Make Current Value Default.
2 Set Number of Iterations indicator to output a signed, long integer—Right-click the indicator and select Representation»I32.
1
2

LabVIEW
Core 1
Participant Guide
© N
ational Instruments
|4-1
1
4. Set the properties for the Number to Match control so that the data type is a 32-bit unsigned integer, the data range is from 0 to 1000, the increment value is 1, and the digits of precision is 0.
Right-click the Number to Match control and select Representation»U32 from the shortcut menu.
Right-click the Number to Match control and select Data Entry from the shortcut menu. Set the properties on the Data Entry and Display Format tabs as shown in Figure 4-3.
Figure 4-3. Number to Match Numeric Properties
1 Number to Match—Data Entry Properties 2 Number to Match—Display Format Properties
1 2

Lesson 4U
sing Loops
4-1
2|
ni.com
5. Set the representation of the Current Number indicator to an unsigned, 32-bit integer and set the digits of precision for the Current Number output to 0.
Right-click the Current Number indicator and select Representation»U32 from the shortcut menu.
Right-click the Current Number indicator and select Display Format. Set the properties as shown in Figure 4-4.
Figure 4-4. Current Number Indicator Display Format Properties

LabVIEW
Core 1
Participant Guide
© N
ational Instruments
|4-1
3
6. Create the block diagram shown in Figure 4-5.
Figure 4-5. Auto Match VI Block Diagram
Tip Coercion dots can cause a VI to use more memory and increase its run time, so try to keep data types consistent in the VIs you create.
1 Random Number (0–1)—Generates a random number between 0 and 1.2 Multiply—Multiplies the random number by the y input to produce a random number between 0 and y.3 Numeric Constant—Right-click the y input of the Multiply function and select Create»Constant. Enter a value of 1000. Because the Random Number
(0-1) function generates a double-precision, floating point number between 0 and 1, multiplying the number by 1000 produces a range of numbers between 0 and 1000.
4 Round To Nearest—Rounds the random number to the nearest integer.5 Equal?—Compares the random number with Number to Match and returns FALSE if the numbers are not equal. Otherwise, it returns TRUE.6 While Loop—Repeats the algorithm until the Equal? function returns TRUE because the Equal? function is wired to the conditional terminal, which is
set to Stop if True.7 Iteration terminal—Each time the loop executes, the iteration terminal increments by one. 8 Increment—Adds 1 to the While Loop count because the iteration starts at 0.9 Coercion dots—Red coercion dots appear on block diagram nodes when you connect a wire of one numeric type to a terminal of a different numeric
type. In this case, the output from Round To Nearest is a double-precision, floating point but Current Number is an integer.
1
3 4 5 6 7 8
2 9

Lesson 4U
sing Loops
4-1
4|
ni.com
7. Update the VI to remove the coercion dots.
Right-click the wire coming from the Round To Nearest function and select Insert»Numeric Palette»Conversion»To Unsigned Long Integer as shown in Figure 4-6. This inserts the To Unsigned Long Integer function on the wire.
Figure 4-6. Inserting the To Unsigned Long Integer Function on a Wire
1 Right-click the wire to display the shortcut menu.
1

LabVIEW
Core 1
Participant Guide
© N
ational Instruments
|4-1
5
8. Notice that converting the output from the Round To Nearest function removes all the coercion dots on the block diagram, as shown in Figure 4-7.
Figure 4-7. Completed Auto Match VI
9. Display the front panel.
10. Right-click the Current Number indicator and select Advanced»Synchronous Display.
Note If synchronous display is enabled, then every time the block diagram sends a value to the Current Number indicator, the block diagram stops executing until the front panel has updated the value of the indicator. In this exercise, you enable the synchronous display, so you can see the Current Number indicator get updated repeatedly on the front panel. Typically, the synchronous display is disabled to increase execution speed since you usually do not need to see every single updated value of an indicator on the front panel.
11. Save the VI.
Test1. Change the number in the Number to Match control to a number that is in the data range, which is 0 to 1000 with an increment of 1.
2. Run the VI.
3. Change the Number to Match value and run the VI again. Current Number updates at every iteration of the loop because it is inside the loop. Number of Iterations updates upon completion because it is outside the loop.
4. To see how the VI updates the indicators, enable execution highlighting.
On the block diagram toolbar, click the Highlight Execution button to enable execution highlighting.

Lesson 4U
sing Loops
4-1
6|
ni.com
5. Run the VI and observe the data flow.
6. Turn off execution highlighting to quickly finish executing the VI.
7. Try to match a number that is outside the data range.
Change the Number to Match value to a number that is out of the data range, 0 - 1000.
Run the VI.
Notice LabVIEW coerces the out-of-range value to the nearest value in the data range you specified in step 4 of the Implementation section.
8. Close the VI.
End of Exercise 4-1

LabVIEW
Core 1
Participant Guide
© N
ational Instruments
|4-2
1
Exercise 4-2 Calculating Average Temperature
GoalUse a While Loop and shift registers to average data.
ScenarioThe Temperature Monitor VI acquires and displays temperature. Modify the VI to average the last five temperature measurements and display the running average on the waveform chart.
DesignFigure 4-8 shows the Temperature Monitor VI front panel and block diagram.
Figure 4-8. Temperature Monitor VI Front Panel and Block Diagram
To modify this VI, you need to retain the temperature values from the previous four iterations of the While Loop and average the values. To accomplish this, you modify this VI as follows:
• Use a shift register with additional elements to retain data from the previous four iterations.
• Initialize the shift register with a reading from the simulated thermometer.
• Calculate and chart only the average temperature.

Lesson 4U
sing Loops
4-2
2|
ni.com
Implementation1. Test the VI.
Open Temperature Monitor.lvproj in the <Exercises>\LabVIEW Core 1\Temperature Monitor directory.
Open Temperature Monitor VI from the Project Explorer window.
Run the VI. Notice the variation in the simulated temperature reading.
2. Stop the VI by clicking the Stop button on the front panel.
3. Modify the VI to reduce the number of temperature spikes.
Display the block diagram.
Modify the block diagram as shown in Figure 4-9.
Figure 4-9. Temperature Monitor VI Block Diagram—Average Temperature
1 Shift Registers—Stacked shift registers collect multiple temperature readings. Right-click the border of the While Loop and select Add Shift Register. Drag the lower resizing handle of the shift register to display four shift registers.
2 Create a copy of the Thermometer (Demo) VI—Press <Ctrl> while dragging the subVI outside the While Loop to create a copy. The Thermometer (Demo) VI returns one temperature measurement and initializes the left shift registers before the loop starts.
3 Compound Arithmetic—Returns the sum of the current temperature and the four previous temperature readings. Resize the function to have five terminals.
4 Divide—Returns the average of the last five temperature readings.
1 3 4
2

LabVIEW
Core 1
Participant Guide
© N
ational Instruments
|4-2
3
Note You can create stacked shift register terminals on the left side of a loop to remember multiple previous iterations and carry those values to the next iterations. This technique is useful for averaging data points. Stacked shift registers can occur only on the left side of the loop because the right terminal transfers the data generated from only the current iteration to the next iteration.
4. Save the VI.
Test1. Run the VI.
During each iteration of the While Loop, the Thermometer (Demo) VI takes one temperature measurement. The VI adds this value to the last four measurements stored in the left terminals of the shift register. The VI divides the result by five to find the average of the five measurements—the current measurement plus the previous four. The VI displays the average on the waveform chart. Notice that the VI initializes the shift register with a temperature measurement.
2. Stop the VI by clicking the Stop button on the front panel.
3. Save and close the VI and the project.
End of Exercise 4-2

Lesson 4U
sing Loops
4-2
6|
ni.com
Exercise 4-3 Temperature Monitor VI—Plot Multiple Temperatures
GoalPlot multiple data sets on a single waveform chart and customize the chart view.
ScenarioModify the VI from Exercise 4-2 to plot both the current temperature and the running average on the same chart. In addition, allow the user to examine a portion of the plot while the data is being acquired.
DesignFigure 4-10 shows the front panel for the existing Temperature Monitor VI and Figure 4-11 shows the block diagram.
Figure 4-10. Temperature Monitor VI Front Panel

LabVIEW
Core 1
Participant Guide
© N
ational Instruments
|4-2
7
To allow the user to examine a portion of the plot while the data is being acquired, display the scale legend and the graph palette for the waveform chart. Also, expand the legend to show additional plots.
To modify the block diagram in Figure 4-11, you must modify the chart terminal to accept multiple pieces of data. Use a Bundle function to combine the average temperature and the current temperature into a cluster to pass to the Temperature History terminal.
Figure 4-11. Original Temperature Monitor VI Block Diagram
Implementation1. Open the Temperature Monitor VI you created in Exercise 4-2.
Open Temperature Monitor.lvproj in the <Exercises>\LabVIEW Core 1\Temperature Monitor directory.
Open Temperature Monitor.vi from the Project Explorer window.

Lesson 4U
sing Loops
4-2
8|
ni.com
2. Modify the block diagram so that it resembles Figure 4-12.
Figure 4-12. Temperature Monitor VI Block Diagram—Plotting Multiple Temperatures
1 Bundle—Passes the current temperature and average temperature to the Temperature History chart.
1

LabVIEW
Core 1
Participant Guide
© N
ational Instruments
|4-2
9
3. Modify the front panel so that it resembles Figure 4-13.
Figure 4-13. Temperature Monitor VI Front Panel—Plotting Multiple Temperatures
4. Save the VI.
Test1. Run the VI. Use the tools in the scale legend and the graph palette to examine the data as it generates.
2. Close the VI and project when you are finished.
End of Exercise 4-3
1 Show both plots in the plot legend—Use the positioning tool to resize the plot legend to show two objects. Double-click the label to edit the plot names. The order of the plots listed in the plot legend is the same as the order of the items wired to the Bundle function on the block diagram.
2 Change the plot type of Current Temperature—Use the Operating tool to select the plot in the plot legend. Click the plot icon, select Common Plots from the menu, and choose the plot you want.
3 Display Graph Palette—Right-click the Temperature History chart and select Visible Items»Graph Palette.4 Display Scale Legend—Right-click the Temperature History chart and select Visible items»Scale Legend.
4
1
3
2

Lesson 5C
reating and Leveraging Data S
tructures
5-1
2|
ni.com
Exercise 5-1 Manipulating Arrays
GoalManipulate arrays using various LabVIEW functions.
DescriptionYou are given a VI and asked to enhance it for a variety of purposes. The front panel of this VI is built. You complete the block diagram to practice several different techniques to manipulate arrays.
Implementation
1. Open Manipulating Arrays.lvproj in the <Exercises>\LabVIEW Core 1\Manipulating Arrays directory.
2. Open Array Manipulation VI from the Project Explorer window. The front panel, shown in Figure 5-1, is already built for you.
Figure 5-1. Array Manipulation VI Front Panel

LabVIEW
Core 1
Participant Guide
© N
ational Instruments
|5-1
3
3. Open the block diagram and complete each of the cases that correspond to the tabs on the front panel as shown in Figures 5-2 through 5-8.
Figure 5-2. Array Manipulation VI—Concatenate Channels Case
4. Switch to the front panel and test the Concatenate Channels case.
On the front panel, click the Concatenate Channels tab.
Run the VI and notice that the sine wave is concatenated with a square wave.
5. Stop the VI.
6. Switch to the block diagram and select the Add/Subtract Channels case.
1 Build Array—Expand this node to accept two inputs, and then right-click and select Concatenate inputs from the shortcut menu.2 Wire the sine wave and square wave outputs to the Build Array function to create a 1D array with both waveforms.
12
Lesson 5C
reating and Leveraging Data S
tructures
5-1
4|
ni.com
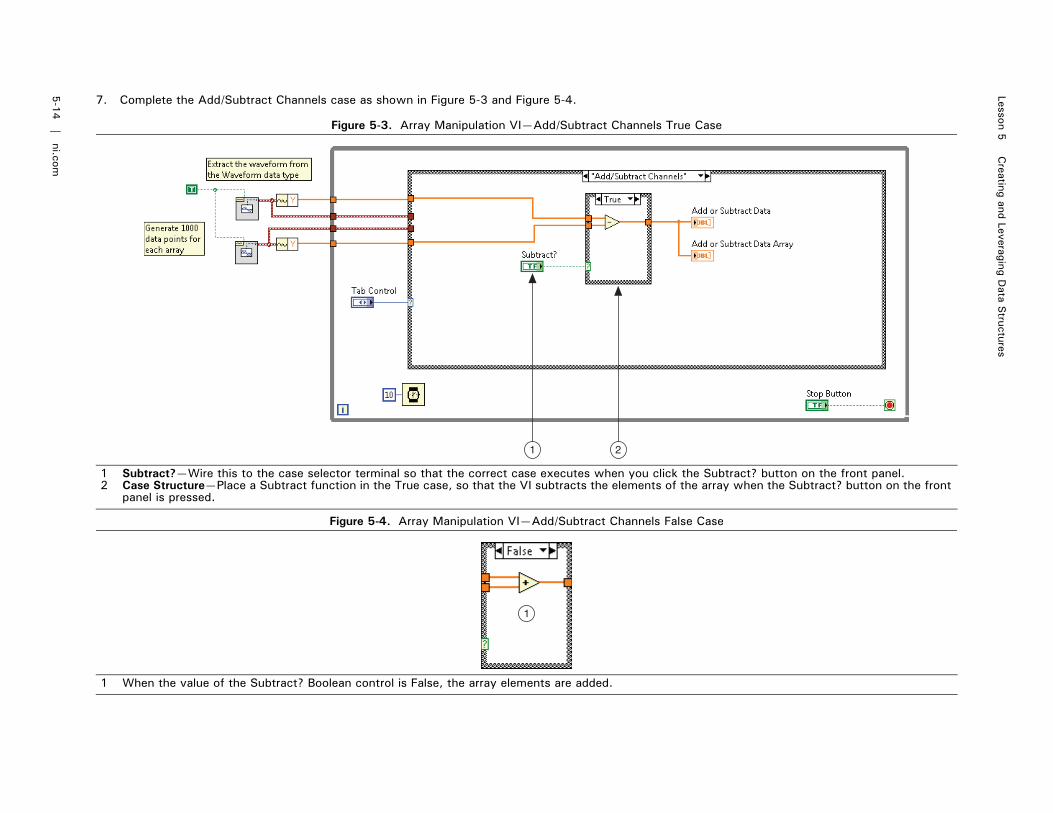
7. Complete the Add/Subtract Channels case as shown in Figure 5-3 and Figure 5-4.
Figure 5-3. Array Manipulation VI—Add/Subtract Channels True Case
Figure 5-4. Array Manipulation VI—Add/Subtract Channels False Case
1 Subtract?—Wire this to the case selector terminal so that the correct case executes when you click the Subtract? button on the front panel. 2 Case Structure—Place a Subtract function in the True case, so that the VI subtracts the elements of the array when the Subtract? button on the front
panel is pressed.
1 When the value of the Subtract? Boolean control is False, the array elements are added.
1 2
1
LabVIEW
Core 1
Participant Guide
© N
ational Instruments
|5-1
5
Note This case demonstrates polymorphic functionality by adding and subtracting elements of the array.
8. Switch to the front panel and test the Add/Subtract Channels case.
On the front panel, click the Add/Subtract Channels tab.
Run the VI.
Click the Subtract? button and observe the behavior of subtracting the square wave from the sine wave.
9. Stop the VI.
10. Switch to the block diagram and select the Select a Channel case.
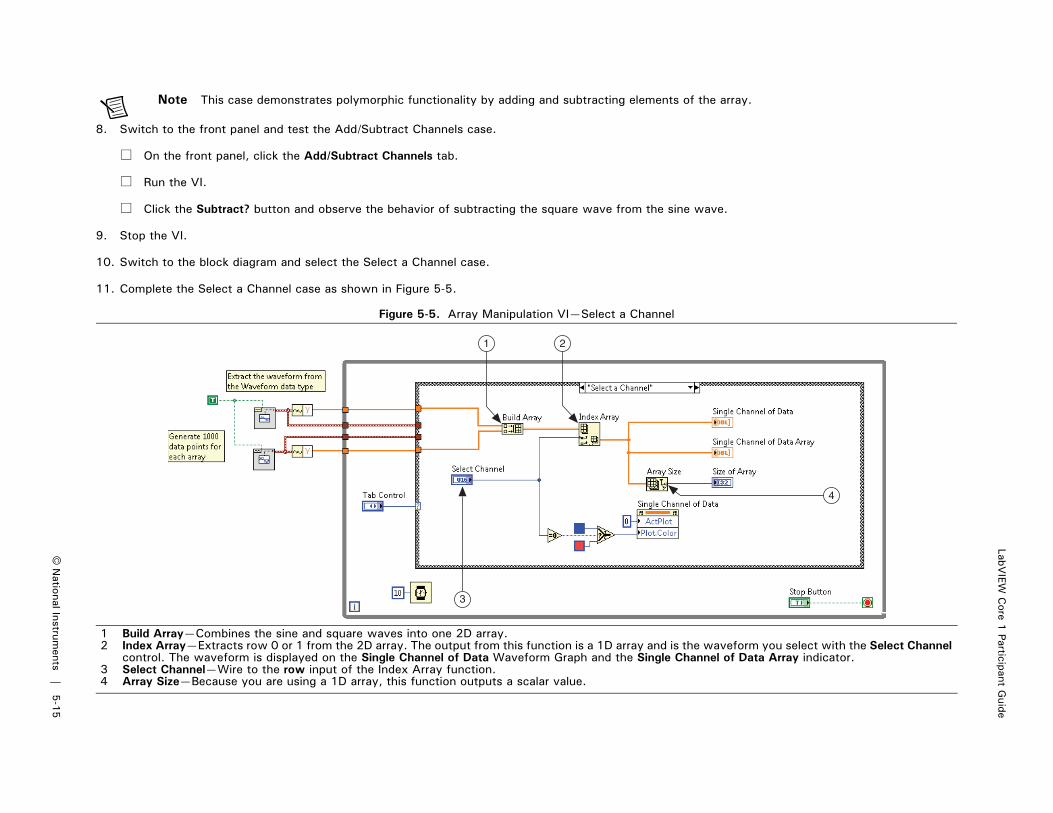
11. Complete the Select a Channel case as shown in Figure 5-5.
Figure 5-5. Array Manipulation VI—Select a Channel
1 Build Array—Combines the sine and square waves into one 2D array.2 Index Array—Extracts row 0 or 1 from the 2D array. The output from this function is a 1D array and is the waveform you select with the Select Channel
control. The waveform is displayed on the Single Channel of Data Waveform Graph and the Single Channel of Data Array indicator.3 Select Channel—Wire to the row input of the Index Array function.4 Array Size—Because you are using a 1D array, this function outputs a scalar value.
1 2
3
4

Lesson 5C
reating and Leveraging Data S
tructures
5-1
6|
ni.com
Note The Select a Channel case uses a property node to change the color of the graph plot. You learn about Property Nodes LabVIEW Core 2.
12. Switch to the front panel and test the Select a Channel case.
On the front panel, click the Select a Channel tab.
Run the VI.
Switch between Channel 0 and Channel 1 and notice the different values shown in the Single Channel of Data Array indicator.
13. Stop the VI.
14. Switch to the block diagram and select the Waveform Data case.
15. Complete the Waveform Data case block diagram as shown in Figure 5-6.
The waveform datatype is a special kind of cluster that contains additional timing information about the waveform.
Figure 5-6. Array Manipulation VI—Waveform Data
Note Polymorphism is the ability of VIs and functions to automatically adapt to accept input data of different data types, including arrays, scalars, and waveforms. VIs and functions are polymoprhic to varying degrees.
1 Add—Uses the value from the Offset control to modify the value of the waveform in the waveform datatype. Notice the value from the Offset control must be coerced to be used with the waveform datatype.
1

LabVIEW
Core 1
Participant Guide
© N
ational Instruments
|5-1
7
16. Switch to the front panel and test the Waveform Data case.
On the front panel, click the Waveform Data tab.
Run the VI.
Change the value of the Offset control and notice the square wave move on the Waveform Data chart.
17. Stop the VI.
18. Switch to the block diagram and select the All Data Channel case.
19. Complete the All Data Channel case as shown in Figure 5-7.
Figure 5-7. Array Manipulation VI—All Data
1 Add—Modify the same data in one array by adding the value of the Channel 1 Offset to each element of the array.2 For Loop—Extracts each element of the array using auto indexing so that the Add function in the For Loop can add the scalar value.3 Build Array—Takes the two 1D arrays and builds a 2D array. Each 1D array becomes a row in the 2D array.4 Array Size—Outputs a 1D array where each element shows the size of each dimension. In this exercise, you have 2 elements of data for the number
of rows and columns.5 All Data Channel and Data Channel Array indicators display the same data.
4
5
2 3
1

Lesson 5C
reating and Leveraging Data S
tructures
5-1
8|
ni.com
Note The polymorphic functionality of LabVIEW functions allows you to perform the same operation on each element without extracting the array elements, as you do with the two Add functions in the All Data Channel case.
20. Switch to the front panel and test the All Data Channel case.
On the front panel, click the All Data Channel tab.
Run the VI.
Change the value of the Channel 1 Offset control and observe the behavior.
21. Stop the VI.
22. Switch to the block diagram and select the Waveform Subset case.
23. Complete the Waveform Subset case as shown in Figure 5-8.
Figure 5-8. Array Manipulation VI—Waveform Subset
1 Array Subset—Extracts a subset of an existing array. In this exercise, you use this function to zoom in on a subset of the waveform you generated.2 Numeric Constant—These constants specify that the function extract the first two rows starting at element 0.3 Start Value—Sets the start index. The default value is set to start at element 0.4 Length—Sets the number of elements to extract. The default value is set to output 1000 elements.
3
4
12

LabVIEW
Core 1
Participant Guide
© N
ational Instruments
|5-1
9
24. Switch to the front panel and test the Waveform Subset case.
On the front panel, click the Waveform Subset tab.
Run the VI.
Change value of the Start Value and Length sliders and notice that the Subset Data waveform graph x-axis starts at zero and finishes at the number of elements in the new array. The x-axis starts at zero because the VI creates a brand new array and the graph does not know where the data was located in the original array.
25. Stop the VI.
Using the NI Example Finder to Learn More about Arrays
Use the NI Example Finder to browse or search examples installed on your computer or on the NI Developer Zone at ni.com/zone. Example VIs can show you how to use specific functions and programming concepts such as arrays and polymorphism.
Complete the following steps to use the NI Example finder to locate example VIs that demonstrate different ways to use the Array function.
1. Select Help»Find Examples to start the NI Example Finder.
2. Click the Search tab and enter the keyword array.
3. Click the Search button to find VIs using that keyword.
4. Click one of the example VIs in the search results list and read the description.
5. Double-click an example VI to open it.
6. Read through the comments on the front panel and block diagram to learn more about what this example VI demonstrates.
7. Run the example, examine the different cases, and click the Stop button to exit.
8. Close the VIs and the NI Example Finder when you are finished.
End of Exercise 5-1

LabVIEW
Core 1
Participant Guide
© N
ational Instruments
|5-2
5
Exercise 5-2 Temperature Warnings VI—Clusters
GoalCreate a cluster datatype containing the data to be passed around an application and, in the process, create scalable, readable code.
ScenarioAnother developer has created a VI that displays temperature warnings. This VI is part of the temperature weather station project studied throughout this course. Your task is to update this VI to use clusters instead of individual terminals for inputs and outputs.
DesignThe flowchart in Figure 5-9 illustrates the data flow for the design of the Temperature Warnings VI.

Lesson 5C
reating and Leveraging Data S
tructures
5-2
6|
ni.com
Figure 5-9. Temperature Warnings VI Flowchart
Current Temp>= Max Temp?
Yes
No
No
Yes
No
Warning ? = TrueWarning ? = False
WarningText = NoWarning?
Warning Text =Freeze Warning
Pass current valueof Warning Text
Current Temp<= Min Temp?
Warning Text =HeatstrokeWarning
Warning Text =No Warning
Yes

LabVIEW
Core 1
Participant Guide
© N
ational Instruments
|5-2
7
Create a cluster which contains the data used by the Temperature Warnings VI. You modify the Temperature Warnings VI to receive and return data in the form of that same cluster as shown in Figure 5-10. The modified VI works in a more modular fashion with other subVIs in the overall application.
Figure 5-10. Temperature Warnings VI with Clusters Front Panel

Lesson 5C
reating and Leveraging Data S
tructures
5-2
8|
ni.com
Implementation1. Open Weather Warnings.lvproj in the <Exercises>\LabVIEW Core 1\Weather Warnings directory.
2. Open Temperature Warnings VI from the Project Explorer window.
3. Place existing controls and indicators in a cluster named Weather Data as shown in Figure 5-11.
Figure 5-11. Create Cluster
1 Cluster—Use the Cluster control from the Silver palette and change the label to Weather Data.2 Select controls and indicators to include in the cluster. <Shift>-click to select multiple objects.3 Drag the controls and indicators into the Weather Data cluster.
31
2

LabVIEW
Core 1
Participant Guide
© N
ational Instruments
|5-2
9
4. Resize the cluster so that all the elements are visible and arranged vertically as shown in Figure 5-12.
Figure 5-12. Resize Cluster Control
1 Autosize cluster—LabVIEW can rearrange and resize the cluster for you. Right-click the border of the Weather Data cluster and select AutoSizing»Arrange Vertically.
1

Lesson 5C
reating and Leveraging Data S
tructures
5-3
0|
ni.com
5. Reorder the items in the cluster as shown in Figure 5-13.
Figure 5-13. Reorder Cluster
1 Right-click the edge of the cluster and select Reorder Controls in Cluster.2 Click the controls to toggle the order of the items in the cluster.3 Click the Confirm button to save the changes.
3
1
2

LabVIEW
Core 1
Participant Guide
© N
ational Instruments
|5-3
1
6. Modify the VI to receive and return cluster data.
Figure 5-14. Temperature Warnings—Weather Data In and Weather Data Out Clusters
1 Weather Data—<Ctrl>-click the Weather Data cluster and drag it to create a copy. Rename the copy Weather Data In.2 Weather Data—Right-click the original cluster and select Change to Indicator. Rename the indicator Weather Data Out.
21

Lesson 5C
reating and Leveraging Data S
tructures
5-3
2|
ni.com
7. Modify the block diagram as shown in Figure 5-15 to extract data from the input cluster.
Figure 5-15. Temperature Warnings with Clusters Block Diagram
Note If the order of the elements in the Unbundle By Name and the Bundle By Name functions is different than what you want, you can use the Operating tool to change the order.
8. Save and close the Temperature Warnings VI.
Test1. Enter values in the Current Temperature, Max Temperature and Min Temperature controls in the Weather Data In cluster.
2. Run the VI and verify that the Weather Data indicator displays correct values.
3. Save and close the VI
End of Exercise 5-2
1 Unbundle By Name—Wire the Weather Data In control and expand the Unbundle By Name function to display three items. Wire the outputs of the Unbundle By Name function to the broken wires in the order shown. Because you moved individual controls and indicators into a single cluster, you must use the Unbundle By Name function to wire the internal controls and indicators independently of each other.
2 Bundle By Name—Wire the Weather Data In cluster around the analysis code to the input cluster of the Bundle by Name function. Display two elements and use the Operating tool to select Warning? and Warning Text elements. Connect the broken wires to the Unbundle By Name inputs as shown.
1
2

LabVIEW
Core 1
Participant Guide
© N
ational Instruments
|5-3
5
Exercise 5-3 Temperature Warnings VI—Type Definition
GoalTo improve the scalability of your application by using type definitions made from custom cluster controls, indicators, and constants of a particular data type.
ScenarioAs a LabVIEW developer, you can encounter situations where you need to define your own custom data types in the form of clusters and enums. A challenge associated with using custom data types is that you may need to change them later in development. In addition, you may need to change them after they have already been used in VIs. For example, you create copies of a custom data type and use them as controls, indicators, or constants in one or more VIs. Then you realize that the custom data type needs to change. You need to add, remove, or change items in the cluster data type or the enum.
As a developer you must ask yourself the following questions:
• What should happen to the copies of the custom data types used in VIs that are already saved?
• Should the copies remain unchanged or should they update themselves to reflect changes to the original?
Usually, you want all the copies of the custom data type to update if you update the original custom data type. To achieve this you need copies of the custom data types to be tied to a type definition, which is defined as follows:
Type definition—A master copy of a custom data type that multiple VIs can use.
ImplementationIn this exercise, you modify the Temperature Warnings VI that you revised in Exercise 5-2 in such a way that the changes to the Weather Data custom data type propagate through the application.
When complete, the Weather Station application monitors temperature and wind information. This exercise modifies the Temperature Warnings VI. In the Challenge exercise, you modify the Windspeed Warnings VI.
1. Open Weather Warnings.lvproj in the <Exercises>\LabVIEW Core 1\Weather Warnings directory.
2. Open Temperature Warnings VI from the Project Explorer window.
3. Experiment with changing an existing cluster.
Place a File Path Control (Silver) in the Weather Data In cluster control.
Notice that the Temperature Warnings VI is broken. This is because the Weather Data In and Weather Data Out clusters are no longer the same data type.
Open the block diagram and notice the broken wire connected to the Weather Data Out terminal.
Press <Ctrl-Z> to undo the addition of the File Path Control.

Lesson 5C
reating and Leveraging Data S
tructures
5-3
6|
ni.com
4. Make a type definition.
Right-click the border of the Weather Data In control and select Make Type Def.
On the block diagram, the Weather Data In terminal now has a black triangle on the corner indicating that it is connected to a type definition.
Right-click the border of the Weather Data In control and select Open Type Def to display the Custom Control Editor window as shown in Figure 5-16.
The window looks like the front panel of a VI but it does not have a block diagram.
Figure 5-16. Custom Control Editor Window
Save the custom control as Weather Data.ctl in the <Exercises>\LabVIEW Core 1\Weather Warnings directory and close the control editor window.
On the block diagram of the Temperature Warnings VI, notice the coercion dot on the Weather Data Out indicator terminal. This indicates that the indicator is not tied to the type definition.
1 The control type is Type Def, which maintains the link between this file and the custom control copies used in VIs.
1

LabVIEW
Core 1
Participant Guide
© N
ational Instruments
|5-3
7
5. Tie the Weather Data Out indicator to the type definition.
Right-click the border of the Weather Data Out indicator on the front panel and select Replace»Select a Control from the shortcut menu.
Browse to and select the Weather Data.ctl file you just created.
Note You can no longer add or remove elements to or from the cluster control and indicator on the front panel. You must open the type definition and add or remove the element from the control editor window.
Save the Temperature Warnings VI.

Lesson 5C
reating and Leveraging Data S
tructures
5-3
8|
ni.com
6. Edit the Weather Data type definition to include unit information.
Right-click the border of the Weather Data In control and select Open Type Def from the shortcut menu.
Modify the front panel as shown in Figure 5-17.
Figure 5-17. Weather Data Type Definition with Temperature Units
Save the Weather Data type definition and close the control editor window.
Notice that the Weather Data In control and Weather Data Out indicator on the Temperature Warnings VI have been updated with the changes you made to the Weather Data type definition. Arrange the front panel of the VI as shown in Figure 5-18.
1 Enum (Silver)—Place an enum in the cluster and rename it Units. Right-click the enum and select Edit items. Create an item for Celsius and Fahrenheit.
1

LabVIEW
Core 1
Participant Guide
© N
ational Instruments
|5-3
9
Figure 5-18. Temperature Warnings VI with Type Def Controls and Indicators
7. Run and Save the Temperature Warnings VI.
ChallengeIn this challenge exercise, you modify the Windspeed Warnings VI to augment the Weather Station application.
1. Add the Windspeed Warnings VI to the Weather Warnings project.
In the Project Explorer window, right click My Computer and select Add»File from the shortcut menu.
Navigate to <Exercises>\LabVIEW Core 1\Weather Warnings\Support VIs and select Windspeed Warnings.vi.

Lesson 5C
reating and Leveraging Data S
tructures
5-4
0|
ni.com
2. Open the Windspeed Warnings VI.
3. Copy the Weather Data In cluster from the Temperature Warnings VI to the Windspeed Warnings VI.
4. Right-click the Weather Data In cluster and select Open Type Def from the shortcut menu.
5. Modify the Weather Data type definition with windspeed controls as shown in Figure 5-19.
Figure 5-19. Windspeed Warnings VI Type Definition Controls and Indicators

LabVIEW
Core 1
Participant Guide
© N
ational Instruments
|5-4
1
6. Modify the block diagram of the Windspeed Warnings VI to use the new Weather Data type definition instead of individual controls and indicators, as shown in Figure 5-20.
Figure 5-20. Windspeed Warnings VI Using Type Definitions
7. Open Temperature Warnings VI and notice that the Weather Data In control and Weather Data Out indicator is updated to include the Windspeed data.
8. Save and close the VI and the project.
End of Exercise 5-3

Lesson 6U
sing Decision-M
aking Structures
6-8
|ni.com
Exercise 6-1 Temperature Warnings With Error Handling
GoalModify a VI to use a Case structure to make a software decision.
ScenarioYou created a VI where a user inputs a temperature, a maximum temperature, and a minimum temperature. A warning string generates depending on the relationship of the given inputs. However, a situation could occur that causes the VI to work incorrectly. For example, the user could enter a maximum temperature that is less than the minimum temperature. Modify the VI to generate a different string to alert the user to the error: Upper Limit < Lower Limit. Set the Warning? indicator to TRUE to indicate the error.
DesignModify the flowchart created for the original Temperature Warnings VI as shown in Figure 6-3.
Figure 6-3. Modified Temperature Warnings Flowchart
You must add a Case structure to the Temperature Warnings VI to execute the code if the maximum temperature is less than or equal to the minimum temperature. Otherwise, the VI does not execute the code. Instead, the VI generates a new string and the Warning? indicator is set to TRUE.
Yes Yes
Create Error
OutputUpper Limit
< Lower Limitand TRUE
OutputHeatstroke
Warning andTRUE
Yes
OutputFreeze Warning
andTRUE
Min Temp >=Max Temp
NoMin Temp Max Temp
Min Temp >=Max Temp
NoCurrent Temp Max Temp
NoOutput
No Warning and
FALSE
Current Temp Min Temp

LabVIEW
Core 1
Participant Guide
© N
ational Instruments
|6-9
Figure 6-4. Original Temperature Warnings VI Block Diagram
Implementation1. Open Weather Warnings.lvproj in the <Exercises>\LabVIEW Core 1\Weather Warnings directory.
2. Open Temperature Warnings.vi from the Project Explorer window.
3. Open the block diagram and create space to add the Case structure.
Select the Weather Data In type-defined cluster terminal, the Unbundle by Name function, and the Error In terminal.
Tip To select more than one item press the <Shift> key while you select the items.
While the objects are still selected, use the left arrow key on the keyboard to move the controls to the left.
Tip Press and hold the <Shift> key to move the objects in five pixel increments.
Tip Press the <Ctrl> key and use the Positioning tool to drag out a region of the size you want to insert.
Select the Weather Data Out type-define cluster terminal, the Bundle by Name function, and the Error Out terminal.

Lesson 6U
sing Decision-M
aking Structures
6-1
0|
ni.com
While the terminals are still selected, use the right arrow key on the keyboard to move the indicators to the right.
Select the wire connecting the Weather Data In terminal and the Bundle by Name function.
While the wire is still selected, use the up arrow key on the keyboard to move the wire upward.
4. Modify the block diagram similar to that shown in Figure 6-5, Figure 6-6, and Figure 6-7. This VI is part of the temperature weather station project.
Figure 6-5. Temperature Warnings VI Block Diagram—No Error, False Case
1 Less?—Compares the Max Temperature and Min Temperature. Make sure the Less? function is outside the Case structure.2 Case Structure—Do not include the Weather Data In, Error In, Weather Data Out, or Error Out terminals in the Case structure because these controls
and indicators are used by both cases.3 Set True and False cases—With the True case visible, right-click the border of the Case structure and select Make this Case False.4 Case Structure—Wire the Error In terminal to the selector terminal to create No Error and Error cases. By default, the Case structure has True and False
cases. These cases change to Error and No Error cases only after you wire Error In to the selector terminal.
1
3
2
4

LabVIEW
Core 1
Participant Guide
© N
ational Instruments
|6-1
1
Figure 6-6. Temperature Warnings VI—No Error, True Case
5. Predict the values for Temperature Warning Text and Temperature Warning? given each set of inputs.
1 True case—If the Max Temperature is set lower than the Min Temperature, the True case executes. Click the case selector label to choose the True case.
2 True Constant—When the True case executes, the Temperature Warning? LED illuminates in the Weather Data Out cluster. 3 String Constant—If the Max Temperature is set lower than the Min Temperature, the warning Upper Limit < Lower Limit displays on the front
panel. Enter the text in the String Constant.
Table 6-1. Predict Values for Temperature Warnings VI
Current Temperature Max Temperature Min Temperature Temperature Warning Text Temperature Warning?
30 30 10
25 30 10
10 30 10
25 20 30
1
3
2

Lesson 6U
sing Decision-M
aking Structures
6-1
2|
ni.com
6. Create the Error case in the outer Case structure so this VI can be used as a subVI.
Figure 6-7. Temperature Warnings VI—Error Case
7. Save the VI.
Test1. Switch to the front panel of the VI.
2. Test the VI by entering values from Table 6-2 in the Current Temperature, Max Temperature, and Min Temperature controls and running the VI for each set of data.
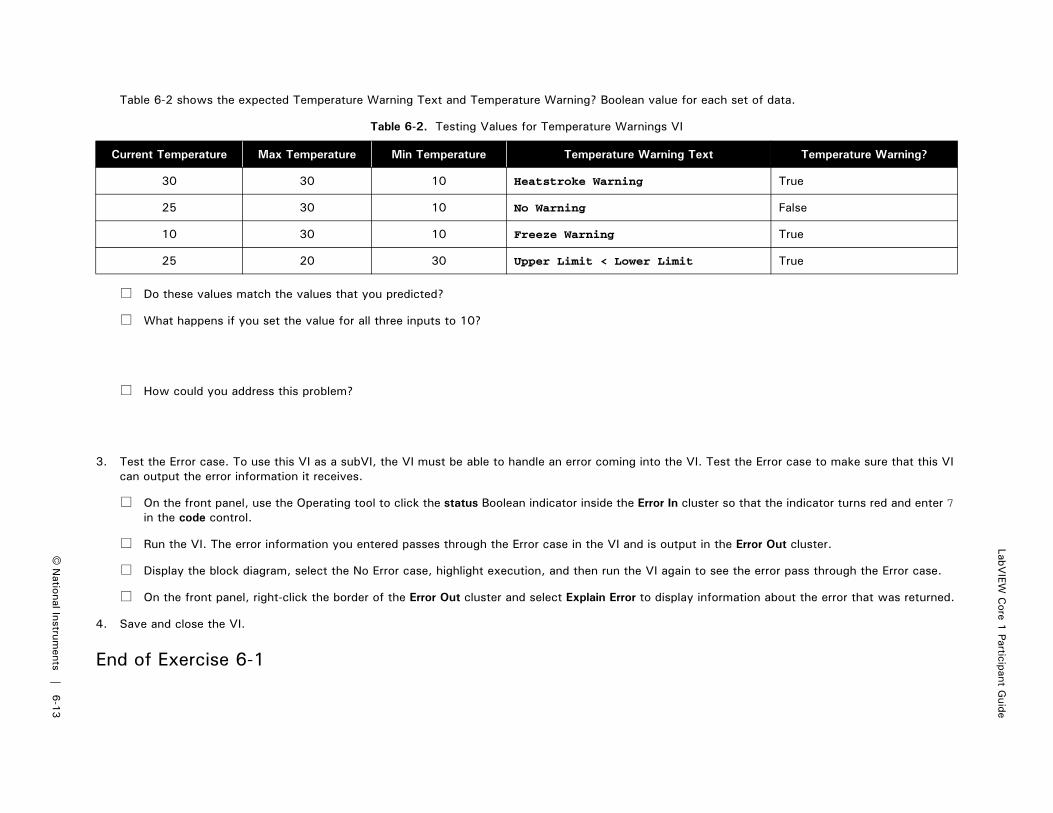
LabVIEW
Core 1
Participant Guide
© N
ational Instruments
|6-1
3
Table 6-2 shows the expected Temperature Warning Text and Temperature Warning? Boolean value for each set of data.
Do these values match the values that you predicted?
What happens if you set the value for all three inputs to 10?
How could you address this problem?
3. Test the Error case. To use this VI as a subVI, the VI must be able to handle an error coming into the VI. Test the Error case to make sure that this VI can output the error information it receives.
On the front panel, use the Operating tool to click the status Boolean indicator inside the Error In cluster so that the indicator turns red and enter 7 in the code control.
Run the VI. The error information you entered passes through the Error case in the VI and is output in the Error Out cluster.
Display the block diagram, select the No Error case, highlight execution, and then run the VI again to see the error pass through the Error case.
On the front panel, right-click the border of the Error Out cluster and select Explain Error to display information about the error that was returned.
4. Save and close the VI.
End of Exercise 6-1
Table 6-2. Testing Values for Temperature Warnings VI
Current Temperature Max Temperature Min Temperature Temperature Warning Text Temperature Warning?
30 30 10 Heatstroke Warning True
25 30 10 No Warning False
10 30 10 Freeze Warning True
25 20 30 Upper Limit < Lower Limit True

Lesson 6U
sing Decision-M
aking Structures
6-1
8|
ni.com
Exercise 6-2 Converting a Polling Design to an Event Structure Design
GoalTo convert a polling-based application to an event-based application and compare the different in performance.
DescriptionFirst you observe the behavior of a polling VI.
Next, you modify the polling VI to create a more efficient, event-driven VI and observe the changes in behavior.
Finally, you add different types of events to the VI.
Table 6-3 lists the events you will implement in the UI Event Handler VI you create.
Observing the Polling VI Behavior1. Open and run Polling.vi.
Open the Events.lvproj file in the <Exercises>\LabVIEW Core 1\Events directory and open the Polling VI from the project.
2. Examine the performance of a polling VI using the Windows Task Manager.
Press the <Ctrl-Alt-Delete> keys and select Start Task Manager from the menu.
Click the Performance tab in the Windows Task Manager window.
Run the VI.
Table 6-3. User Interface Events
Event Event Description
“Stop”: Value Change Stops the While Loop.
“Time Check”: Value Change Displays a time stamp when you click the Time Check button.
“Pane”: Mouse Down Displays the coordinates of the front panel point you click.
Panel Close? Handles the event in which the user tries to close the running VI by clicking the window close button.
“Stop”: Mouse Enter Produces a beep when the mouse cursor moves over the Stop button.

LabVIEW
Core 1
Participant Guide
© N
ational Instruments
|6-1
9
Notice how high the CPU usage is.
Stop the VI and notice how the CPU usage drops.
3. Open the block diagram, turn on execution highlighting, and run the VI again.
4. Notice how often the Time Check terminal sends data to the Case structure and how often the While Loop iterates.
5. Stop the VI and turn off execution highlighting.
Modifying the Polling VI to Use Events Instead of Polling1. Save Polling VI as UI Event Handler.vi so you can modify it.
Select Open additional copy and add the copy to the project.
2. Close Polling.vi.
3. Open the block diagram of UI Event Handler.vi and move the Stop terminal and the Time Check terminal outside the While Loop. You move these terminals into the appropriate event cases later in this exercise.
4. Delete the Case structure and clean up any broken wires.
5. Place an Event structure inside the While Loop between the iteration terminal and the conditional terminal.
6. Right-click the Event structure and select Edit Events Handled by This Case from the shortcut menu.

Lesson 6U
sing Decision-M
aking Structures
6-2
0|
ni.com
7. Configure the event as shown in Figure 6-8.
Figure 6-8. Configuring the "Stop": Value Change Event
8. Click OK to close the dialog box.
1 Click Stop in the Event Sources panel.2 Click Value Change in the Events panel.
1
2

LabVIEW
Core 1
Participant Guide
© N
ational Instruments
|6-2
1
9. Place a True constant inside the new "Stop": Value Change event and wire it to the conditional terminal of the While Loop as shown in Figure 6-9.
Figure 6-9. Event Structure with "Stop": Value Change Event
Observing the Behavior of the Event-Driven VI1. Run the VI.
2. Notice that the Iteration indicator does not increment.
3. Switch to the block diagram and enable execution highlighting.
4. Notice that the While Loop is executing the first iteration. The Event structure is waiting for an event.
5. Disable execution highlighting and switch back to the front panel.
6. Click the Stop button to stop the VI.
7. Notice that the VI stops running even though the Stop button is disconnected.
8. Notice that the Stop button stays depressed even though the mechanical action is set to Latch When Released. The reason the button stays depressed is because the VI stopped running after you clicked the button.
9. Reset the Stop button by clicking it again.
1 NewVal event data—Resize the event data items list so that only one item displays. Click the item and select NewVal.
1

Lesson 6U
sing Decision-M
aking Structures
6-2
2|
ni.com
10. Drag the terminal of the Stop button into the "Stop": Value Change event as shown in Figure 6-10.
Figure 6-10. “Stop”: Value Change Event with Stop Button Terminal
11. Run the VI and click the Stop button again.
12. Notice this time the VI stops and the button resets.

LabVIEW
Core 1
Participant Guide
© N
ational Instruments
|6-2
3
Programming the "Time Check": Value Change Event1. Add a new event case and create a “Time Check”: Value Change event as shown in Figure 6-11.
Right-click the event structure and select Add Event Case.
Figure 6-11. Event Structure with "Time Check": Value Change Event
2. Run the VI.
3. Click the Time Check button to see the current time display in the current time indicator.
4. Display the Task Manager window and notice that CPU usage has decreased when you use events instead of polling.
5. Stop the VI.
1 In the Edit Events window, select Time Check in the Event Sources panel and Value Change in the Events panel.2 Move the Time Check terminal from outside the While Loop into the "Time Check": Value Change event case.3 Get Date/Time In Seconds—Creates a time stamp in memory.4 Indicator—Displays the current time output of the Get Date/Time In Seconds function.
2
1
4
3

Lesson 6U
sing Decision-M
aking Structures
6-2
4|
ni.com
Adding More Notify Events to the VI1. Add a new event case and create a Mouse Down event as shown in Figure 6-12.
Figure 6-12. Event Structure with "Pane": Mouse Down Event
2. Run the VI.
3. Click on different parts of the front panel.
Notice that the Coords indicator displays the coordinates for each point you click.
Notice that the other events continue to behave as before.
4. Stop the VI.
1 In the Edit Events window, select Panes»Pane in the Event Sources panel and Mouse»Mouse Down in the Events panel. 2 Coords event data—Click the event data node and select Coords»All Elements.3 Coords indicator—Right-click the output of the Coords event data item and select Create»Indicator from the shortcut menu.
1
3
2

LabVIEW
Core 1
Participant Guide
© N
ational Instruments
|6-2
5
Adding Filter Events to the VI1. Add a new event case and create a Panel Close? event as shown in Figure 6-13.
Figure 6-13. Event Structure with Panel Close? Event
2. Save and run the VI.
3. Click the “X” at the top-right of the window of the front panel.
4. Notice that clicking the No button cancels the event and returns to the VI.
5. Clicking the Yes button stops and closes the VI.
6. Stop the VI if necessary.
Challenge1. If you have a sound card, add an event that produces a sound when the cursor is over the Stop button.
Tip Use Quick Drop to find the Beep VI.
End of Exercise 6-2
1 After you add the event, in the Edit Events window, select <This VI> in the Event Sources panel and Panel Close? in the Events panel.2 Event data node—Click the Event Data Node and select Source from the menu.3 Two Button Dialog function and Not function—Wire the T button? output to the Not function and wire the Not function to the Discard? event filter node.4 String constant—Wire Are you sure you want to close the window? to the message input.5 Yes and No string constants—Wire Yes to the T button name ("OK") input and wire No to the F button name ("Cancel") input.
1
3
2
4
5

Lesson 7M
odularity
7-1
2|
ni.com
Exercise 7-1 Temperature Warnings VI—As SubVI
GoalCreate the icon and connector pane for a VI so that you can use the VI as a subVI.
ScenarioYou have created a VI that determines a warning string based on the inputs given. Create an icon and a connector pane so that you can use this VI as a subVI.
DesignThe Temperature Warnings VI contains the following inputs and outputs:
Use the standard connector pane terminal pattern to assure room for future expansion.
Implementation1. Open Weather Warnings.lvproj in the <Exercises>\LabVIEW Core 1\Weather Warnings directory.
2. Open Temperature Warnings VI from the Project Explorer window.
3. Connect the inputs and outputs to the connector pane as shown in Figure 7-1.
Figure 7-1. Connector Pane Connections for Temperature Warnings VI
Table 7-1. Temperature Warnings VI Inputs and Outputs
Inputs Outputs
Weather Data In Weather Data Out
Error In Error Out
1 Connector Pane—Located in the upper right corner of the VI window, the connector pane displays potential terminals for the VI. The connector pane shown here displays the standard pattern of terminals. You can right-click the connector pane and select Patterns to choose different terminal designs.
2 Connections—The Context Help window displays the connections for the VI.
1 2

LabVIEW
Core 1
Participant Guide
© N
ational Instruments
|7-1
3
Using the Wiring tool, click the upper-left terminal of the connector pane.
Click the corresponding front panel control, Weather Data In.
Notice that the connector pane terminal fills in with a color to match the data type of the control connected to it.
Click the bottom-left terminal of the connector pane.
Click the corresponding front panel control, Error In.
Continue wiring the connector pane until all controls and indicators are wired, and the Context Help window matches that shown in Figure 7-1.
4. Create an icon.
Right-click the icon and select Edit Icon.

Lesson 7M
odularity
7-1
4|
ni.com
Use the tools in the Icon Editor dialog box to create an icon. Make the icon as simple or as complex as you want, however, it should be representative of the function of the VI. Figure 7-2 shows a simple example of an icon for this VI.
Figure 7-2. Sample Warning Icon
Tip Double-click the Selection tool to select the existing graphic. Press the <Delete> key to delete the graphic. Then, double-click the rectangle tool to automatically create a border for the icon.
Tip Double-click the Text tool to modify fonts. You can select Small Fonts to choose fonts smaller than 9 points in size.
Tip Select the Glyphs tab and filter the glyphs by the keyword temperature, then drag a thermometer glyph onto your icon. And then filter by the keyword warning and drag a warning glyph onto your icon.
5. Click OK when you are finished to close the Icon Editor dialog box.
6. Save and close the VI.

LabVIEW
Core 1
Participant Guide
© N
ational Instruments
|7-1
5
TestTest the Temperature Warnings VI as a SubVI.
1. Add files to the Weather Warnings LabVIEW project as shown in Figure 7-3.
Figure 7-3. Weather Warnings Project
Add an auto-populating folder to the Weather Warnings LabVIEW project. LabVIEW continuously monitors auto-populating folders and updates the folder in the Project Explorer window according to changes made in the project and on disk.
– Right-click My Computer in the Weather Warnings project and select Add»Folder (Auto-populating) from the shortcut menu.
– Navigate to <Exercises>\LabVIEW Core 1\Shared Files and click the Select Folder button.
The Shared Files folder contains shared files that you use in this and future exercises.
Add SubVI Tester.vi to the project.
– Right-click My Computer and select Add»File from the shortcut menu.
– Navigate to <Exercises>\LabVIEW Core 1\Weather Warnings\Test VIs\SubVI Tester.vi and click Add File.

Lesson 7M
odularity
7-1
6|
ni.com
2. Open the SubVI Tester VI and complete the block diagram as shown in Figure 7-4.
Figure 7-4. Test SubVI Block Diagram
1 Initialize shift register—Right-click the left shift register and select Create»Constant to initialize the shift register. Right-click the cluster and select View Cluster as Icon.
2 Enum Constant—Right-click the Units (0:Celsius) input of the Thermometer (Demo) VI and select Create»Constant. Creating the enum constant from the Thermometer (Demo) VI automatically populates the enum with the appropriate choices. Use the Operating tool to select Celsius.
3 Thermometer (Demo)—Locate this VI in the Shared Files folder in the Project Explorer window, drag it to the block diagram and wire it as shown. This VI generates sample temperature values.
4 Wire the Units (0:Celsius) constant to the Units element of the Bundle By Name function.5 Bundle By Name—Expand the node to display four elements. Use the Operating tool to select Units.6 Temperature Warnings—Because of the modifications you made to Temperature Warnings VI, you can use it as a subVI. Wire the Temperature Warnings
VI using the connections you just created.
1 543 62

LabVIEW
Core 1
Participant Guide
© N
ational Instruments
|7-1
7
3. Arrange the front panel as shown in Figure 7-5.
Figure 7-5. SubVI Tester Front Panel
4. On the front panel of the SubVI Tester VI, enter test values for the Max Temperature and Min Temperature controls.
5. Run the VI.
The Thermometer (Demo) VI generates sample temperatures, which the SubVI Tester VI displays on the Current Temperature indicator.
6. Notice how Temperature Warning Text indicator changes as the temperature rises and falls.
7. After you have finished testing, save and close the VI.
End of Exercise 7-1

LabVIEW Core 1 Participant Guide
© National Instruments | 8-5
Exercise 8-1 Using NI MAX to Examine a DAQ Device
GoalUse MAX to examine, configure, and test a device.
ImplementationComplete the following steps to examine the configuration for the DAQ device in the computer using MAX. Use the test routines in MAX to confirm operation of the device. If you do not have a DAQ device, you can simulate a device using the instructions in step 3.
Note Portions of this exercise can only be completed with the use of a real device and a BNC-2120, shown in Figure 8-1. Some of these steps have alternative instructions for simulated devices.
1. Launch MAX by selecting Start»Programs»NI MAX or by double-clicking the NI MAX icon on your desktop. MAX searches the computer for installed National Instruments hardware and displays the information.
2. If you have a DAQ device installed, skip step 3 and go to the Examining the DAQ Device Settings section.
3. Create an NI-DAQmx simulated device to allow you to complete the exercises without hardware.
Right-click Devices and Interfaces and select Create New from the shortcut menu.
In the Create New dialog box, select Simulated NI-DAQmx Device or Modular Instrument.
Click the Finish button.
In the Create Simulated NI-DAQmx Device dialog box, select M Series DAQ»NI PCI 6225.
Click the OK button.

Lesson 8 Acquiring Measurements from Hardware
8-6 | ni.com
BNC-2120 Terminal BlockA terminal block consists of screw or spring terminals for connecting signals or other sensors. A cable transports the signal from the terminal block to the DAQ device.
Figure 8-1. BNC-2120
1 RES/BNC Switch (AI 3)2 Resistor Measurement Screw Terminals3 Thermocouple Input Connector4 Temperature Reference5 BNC/Temp. Ref. Switch (AI 0)6 BNC/Thermocouple Switch (AI 1)7 Analog Input BNC Connectors8 FS/GS Switches9 Analog Output BNC Connector10 Frequency Range Selection Switch11 Sine/Triangle BNC Connector12 TTL Square Wave BNC Connector
13 Sine/Triangle Waveform Switch14 Frequency Adjust Knob15 Amplitude Adjust Knob16 Digital I/O Screw Terminals17 Digital I/O LEDs18 User-Defined Screw Terminals19 User-Defined BNC Connectors20 Timing I/O Screw Terminals21 Quadrature Encoder Screw Terminals22 Quadrature Encoder Knob23 Timing I/O BNC Connector24 Power Indicator LED
EL
RTTSNI
NAMUNOI A
STN_+ FloatingSource (FS) _+Ground Ref.
Source (GS)
AO
ANALOG OUTPUTS
ANALOG INPUTS
DIGITAL I/O
FUNCTION GENERATOR
Frequency Selection
Amplitude Adjust
Sine/Triangle TTL Square Wave
Frequency Adjust
GSFS GSFS
GSFS GSFS
GSFS GSFS
GSFS GSFS
AI 0 AI 1
USER 1
USER 2
P0.7
P0.6
P0.5
P0.4
P0.3
P0.2
P0.1
P0.0
D GND
AI 2
BNC
RES+AI GNDAI SENSERES-
1
2
3
4
Temp.Ref.
0.1-10 kHz
LO HI LO HI
1-100 kHz 13-1000 kHz
ThermocoupleBNC
RES
AI 3
BNC
AI 3
AI 4 AI 5
AI 6 AI 7
AO 0 AO 1
USER-DEFINEDSIGNALS*
*For BNC connections, wire anyTiming I/O or Digital I/O screw terminals here.
PWRBNC-2120TIMING I/O
PFI 0 / P1.0
96 Pulses/Rev
QuadratureEncoder
PFI 1 / P1.1
PFI 2 / P1.2
PFI 3 / P1.3
PFI 4 / P1.4
PFI 5 / P1.5
PFI 6 / P1.6
PFI 7 / P1.7
PFI 8 / P2.0
PFI 9 / P2.1
PFI 12 / P2.4
PFI 13 / P2.5
PFI 14 / P2.6
+5 V
PULSES
UP/DN
D GND
1.2.3.4.
!
10
16
17
1
5
7
9
8
4
6
2
12
14
13
11
15
19
20
23
22
24
21
3
18

LabVIEW Core 1 Participant Guide
© National Instruments | 8-7
Examining the DAQ Device Settings1. Expand the Devices and Interfaces section.
2. Select the device that is connected to your machine. Green icons represent real devices and yellow icons represent simulated devices. You might have a different device installed, and some of the options shown might be different.
MAX displays National Instruments hardware and software in the computer. The device alias appears in quotes following the device type. The Data Acquisition VIs use this device alias to determine which device performs DAQ operations. MAX also displays the attributes of the device such as the system resources that the device uses. Figure 8-2 shows the simulated PCI-6225 device.
Make sure the device you use is named Dev 1. To rename a device, right-click the device and select Rename from the shortcut menu.
Figure 8-2. MAX with Device and Interfaces Expanded
Tip The Show Help/Hide Help button in the top right corner of MAX is available for certain items. Click the Show Help/Hide Help button to hide online help or show the DAQ device information.
3. Select the Device Routes tab at the bottom of MAX to see detailed information about the internal signals that can be routed to other destinations on the device, as shown in Figure 8-3. This is a powerful resource that gives you a visual representation of the signals

Lesson 8 Acquiring Measurements from Hardware
8-8 | ni.com
that are available to provide timing and synchronization with components that are on the device and other external devices.
Figure 8-3. Device Routes
4. Select the Settings tab, as shown in Figure 8-4, to see information about the last time the device was calibrated both internally and externally. Not all devices contain calibration information.
Figure 8-4. Calibration
5. If you are using a physical device, right-click the NI-DAQmx device in the configuration tree and select Self-Calibrate to update the built-in calibration constants and calibrate the DAQ device using a precision voltage reference source. When the device has been calibrated,

LabVIEW Core 1 Participant Guide
© National Instruments | 8-9
information in the Self-Calibration section updates. Skip this step if you are using a simulated device.
Testing the DAQ Device Components1. Click the Self-Test button in MAX to test the device. The device should pass the test
because it is already configured.
2. Click the Test Panels button to test the individual functions of the DAQ device, such as analog input and output. The Test Panels dialog box appears.
Use the Analog Input tab to test the various analog input channels on the DAQ device. Click the Analog Input tab. Click the Start button to acquire data from analog input channel 0 and click the Stop button when you finish.
– If you are using the BNC-2120, make sure the switch over the AI 0 connector is in the Temp. Ref. position to connect the temperature sensor to ai0. Place your finger on the sensor to see the voltage rise.
– If you are using a simulated device, a sine wave is shown on all input channels.
Use the Analog Output tab to set up a single voltage or sine wave on one of the DAQ device analog output channels. Click the Analog Output tab.
– Select Sinewave Generation in the Mode drop-down menu and click the Start button. MAX generates a continuous sine wave on analog output channel 0.
– If you have hardware installed, you can read the sine wave that channel 0 outputs. On the BNC-2120, wire Analog Out Ch0 to Analog In Ch1. Click the Analog Input tab in the Test Panels dialog box and select Dev1/ai1 from the Channel Name drop-down menu. Click the Start button to acquire data from analog input channel 1. MAX displays the sine wave from analog output channel 0.
Use the Digital I/O tab to test the digital lines on the DAQ device. Click the Digital I/O tab.
– In the Select Direction section, set lines 0 through 3 as output as shown in Figure 8-5.
Figure 8-5. Digital I/O Line Direction
– Click Start to begin the digital output test, then toggle the switches in the Select State section shown in Figure 8-6. If you have a BNC-2120, toggling the switches turns the LEDs on or off. Notice that the LEDs use negative logic.
Figure 8-6. Digital I/O Switches
– Click Stop to stop the digital output test.
Use the Counter I/O tab to determine if the DAQ device counter/timers are functioning properly. Click the Counter I/O tab.

Lesson 8 Acquiring Measurements from Hardware
8-10 | ni.com
– If you have hardware installed, you can verify counter/timer operations by selecting Edge Counting from the Mode drop-down menu and clicking the Start button. The Counter Value indicator increments rapidly. Click Stop to stop the counter test.
Click the Close button to close the Test Panel dialog box and return to MAX.
End of Exercise 8-1

Lesson 8A
cquiring Measurem
ents from H
ardware
8-1
4|
ni.com
Exercise 8-2 Programming with the DAQmx API
GoalExplore a DAQmx example program that continuously acquires data, and modify it to wait on a digital trigger.
ScenarioExplore a DAQmx example program that continuously acquires a voltage signal on channel analog input 1 (AI1) of a DAQ device. Modify the VI to use a digital trigger. The VI begins measuring when the user sends a digital trigger to the device. In this exercise, the user sends a trigger by turning the Quadrature Encoder knob on the BNC-2120. The VI stops measuring when the user clicks the Stop button on the front panel of the VI.
Implementation—External Connections1. If you are using the BNC-2120, connect the Sine/Triangle output on the function generator to channel AI 1 with a BNC cable, and make sure the switch
on the function generator is set to the sine wave. Also, ensure that there is a wire connecting the UP/DN screw terminal to the PFI 1 screw terminal in the Timing I/O section.
Note The UP/DN terminal on the BNC-2120 outputs a high or a low signal indicating the rotation direction of the Quadrature Encoder knob. When you rotate the Quadrature Encoder knob clockwise, the UP/DN terminal outputs a high signal. When you rotate the Quadrature Encoder knob counterclockwise, the UP/DN terminal outputs a low signal. In this exercise, this signal triggers the VI to start acquiring data.
Open and Run a DAQmx Example1. Open Voltage - Continuous Input.vi in the <Exercises>\LabVIEW Core 1\Using DAQmx directory. This VI demonstrates how to acquire a
continuous amount of data from a DAQ device.
2. Select File»Save As to save the VI as <Exercises>\LabVIEW Core 1\Triggered Analog Input\Trigger AI Acquisition.vi. When prompted, select Copy - Substitute copy for original.

LabVIEW
Core 1
Participant Guide
© N
ational Instruments
|8-1
5
3. Open and explore the block diagram as shown in Figure 8-7.
Figure 8-7. Block Diagram of Original Voltage - Continuous Input VI
4. Set the default values and settings on the front panel.
Select Dev1\ai1 from the Physical Channel control.
Set Max Voltage to 1.
Set Min Voltage to -1.
5. Run the VI. The VI should begin acquiring data continuously.
Use the Frequency Selection switch and the Frequency Adjust knob on the BNC-2120 to change the frequency of the generated and acquired signal.
6. Click the Stop button to stop the VI.
1 DAQmx Create Virtual Channel VI—Click the pull-down menu and notice it is set to Analog Input»Voltage.2 Press <Ctrl-H> to open the Context Help window. Hover over each of the DAQmx functions to learn about each function. 3 Property Node—Gets or sets properties for a reference. You can learn more about Property Nodes in LabVIEW Core 2 or refer to the LabVIEW Help.
2
3
1

Lesson 8A
cquiring Measurem
ents from H
ardware
8-1
6|
ni.com
Add Triggering to the Example Program1. Modify the block diagram as shown in Figure 8-8 to add trigger functionality. After you modify this VI, the VI waits for a trigger before acquiring data.
Figure 8-8. Trigger AI Acquisition VI Block Diagram
1 DAQmx Trigger VI—Place to the right of the DAQmx Configure Logging VI. Delete the task out and error out wires from the DAQmx Configure Logging VI and then wire them through the DAQmx Trigger VI to the DAQmx Start Task VI.
2 Configure the trigger—Click the DAQmx Trigger VI pull-down menu and select Start»Digital Edge.3 Create controls—Right-click the source input and the edge input of the DAQmx Trigger VI and select Create»Control.4 Free label—Create a label and enter Trigger Settings.
12
3
4

LabVIEW
Core 1
Participant Guide
© N
ational Instruments
|8-1
7
2. Modify the front panel and set the default settings as shown in Figure 8-9.
Figure 8-9. Trigger AI Acquisition VI Front Panel
3. Save the VI.
4. Run the VI. Turn the Quadrature Encoder knob on the BNC-2120 counterclockwise then clockwise to begin the acquisition.
5. Stop and close the VI.
End of Exercise 8-2
1 Move the Acquired Data group—Select all the items in the Acquired Data group and shift them to the right. <Shift>-click to select multiple items and press <Shift-arrow key> to move them.
2 Create Trigger Settings group—Copy a container from another group, label the copy Trigger Settings, and place the edge and source controls in it. 3 Select Rising in the edge control.4 Select Dev1/PFI1 in the source control.
12 43

Lesson 8 Acquiring Measurements from Hardware
8-20 | ni.com
Exercise 8-3 Instrument Configuration with NI MAX
GoalLearn to use MAX to examine and communicate with an instrument using GPIB interface settings.
Set UpThis exercise uses the NI Instrument Simulator to simulate an instrument. Before MAX can recognize the NI Instrument Simulator as a device with a GPIB interface, you must configure the NI Instrument Simulator using the Instrument Simulator Wizard.
Complete the following steps to configure the NI Instrument Simulator to have a GPIB interface.
1. Configure the NI Instrument Simulator.
Power off the NI Instrument Simulator.
Set the configuration switch on the rear panel to CFG, as shown in Figure 8-10.
Figure 8-10. NI Instrument Simulator
Power on the NI Instrument Simulator using the power switch on the front of the unit.
Verify that the PWR LED is lit and the RDY LED is flashing.
Launch the NI Instrument Simulator Wizard from Start»All Programs»National Instruments»Instrument Simulator»Instrument Simulator Wizard.
Note This wizard is installed with the NI Instrument Simulator Software, available for download at ni.com.
Click Next.
Click Next.
On the Select Interface page, select GPIB Interface and click Next.
Select Change GPIB Settings and click Next.
Select Single Instrument Mode and click Next.
Set GPIB Primary Address to 1.
Set GPIB Secondary Address to 0(disabled).
Click Next.
Click Update.
Click OK when you get the message that the update was successful.

LabVIEW Core 1 Participant Guide
© National Instruments | 8-21
Power off the NI Instrument Simulator using the power switch on the front of the unit.
Set the configuration switch on the rear panel to NORM.
Power on the NI Instrument Simulator using the power switch on the front of the unit.
Verify that both the PWR and RDY LEDs are lit.
Implementation1. Launch MAX by either double-clicking the icon on the desktop or by selecting Tools»
Measurement & Automation Explorer in LabVIEW.
2. View the settings for the GPIB interface.
Expand the Devices and Interfaces section to display the installed interfaces. If a GPIB interface is listed, the NI-488.2 software is correctly loaded on the computer.
Select the GPIB interface.
Examine but do not change the settings for the GPIB interface.
3. Communicate with the GPIB instrument.
Make sure the GPIB interface is still selected in the Devices and Interfaces section.
Click the Scan for Instruments button on the toolbar.
Expand the GPIB interface selected in the Devices and Interfaces section. An instrument named Instrument Simulator appears.
Click Instrument Simulator to display information about it in the right pane of MAX. Click the Attributes tab. Notice the NI Instrument Simulator has a GPIB primary address.
Click the Communicate with Instrument button on the toolbar. An interactive window appears. You can use it to query, write to, and read from that instrument.
Enter *IDN? in the Send String text box and click the Query button. The instrument returns its make and model number in the String Received indicator as shown in Figure 8-11. You can use this communicator window to debug instrument problems or to verify that specific commands work as described in the instrument documentation.
Figure 8-11. Communication with the GPIB instrument
Enter MEASURE:VOLTAGE:DC? in the Send String text box and click the Query button. The NI Instrument Simulator returns a simulated voltage measurement.

Lesson 8 Acquiring Measurements from Hardware
8-22 | ni.com
Click the Query button again to return a different value.
Click the Exit button when done.
4. Set a VISA alias of devsim for the NI Instrument Simulator so you can use the alias instead of having to remember the primary address.
While Instrument Simulator is selected in MAX, click the VISA Properties tab.
Enter devsim in the VISA Alias on My System field. You use this alias later in the course.
Click Save.
5. Select File»Exit to exit MAX.
6. Click Yes if prompted to save the instrument.
End of Exercise 8-3

LabVIEW Core 1 Participant Guide
© National Instruments | 8-25
Exercise 8-4 Exploring Instrument Drivers
GoalInstall an instrument driver and explore the example programs that accompany it.
ImplementationInstall the instrument driver for the NI Instrument Simulator. After installation, explore the VIs that the instrument driver provides and the example programs that are added to the NI Example Finder.
Figure 8-12. NI Instrument Simulator
Install Instrument Driver and Open Project—Download from InternetIf you have internet access and have, or want to create, a user profile on ni.com, complete the following steps. Otherwise, install the driver from the course CD following the instructions in the Install Instrument Driver and Open Project—Extract from Disk section.
1. Select Help»Find Instrument Drivers.
2. Click the Login button.
3. If you have an ni.com profile, log in with your ID.
4. If you do not have an ni.com profile, follow the onscreen instructions to create one at this time. Be sure to make a note of the user ID and password you create.
5. After you log in, click the Scan for Instruments button. If you have an instrument connected, clicking this button detects the instrument and finds the correct driver. In this case, it detects the Instrument Simulator.
6. Double-click Instrument Simulator in the list and click the Search button.
7. Select Version 2.0 of the instrument driver from the Driver list.
8. Click the Install button.
9. Click the Start using this driver button.
10. Click the Open Project button.
11. Expand the Examples folder in the Project Explorer window.
12. Close the NI Instrument Driver Finder window and go to the Explore Instrument Driver section to continue this exercise.

Lesson 8 Acquiring Measurements from Hardware
8-26 | ni.com
Install Instrument Driver and Open Project—Extract from DiskIf you do not have Internet access or do not want to create a user profile, complete the following steps to install the instrument driver.
1. If you have it open, close LabVIEW and then navigate to the <Exercises>\LabVIEW Core 1\Instrument Driver directory. This folder contains a zip file with the LabVIEW Plug and Play instrument drivers for the Instrument Simulator.
2. Right-click the zip file and follow the wizard to extract all files to the <Program Files>\National Instruments\LabVIEW 2014\instr.lib directory.
3. Open National Instruments Instrument Simulator.lvproj in the <Program Files>\National Instruments\LabVIEW 2014\instr.lib\National Instruments Instrument Simulator directory.
4. Expand the Examples folder in the Project Explorer window.
5. Go to the Explore Instrument Driver section to continue this exercise.
Explore Instrument Driver1. Open National Instruments Instrument Simulator Acquire Single Measurement(DMM).vi
from the Examples folder in the Project Explorer window of the National Instruments Instrument Simulator project.
This VI reads a single measurement from the Instrument Simulator.
2. Verify that the PWR and RDY LEDs are lit on the Instrument Simulator.
3. Select devsim from the VISA Resource Name control on the front panel. You specified the VISA alias for this GPIB instrument as devsim in step 4 of Exercise 8-3, Instrument Configuration with NI MAX.
4. Run the VI.
5. Open the block diagram of the VI.
6. Open the Functions palette and navigate to the Instrument I/O»Instrument Drivers»National Instruments Instrument Simulator palette.
7. Explore the palette and subpalettes using the Context Help window to familiarize yourself with the functionality of functions on the palette.
8. Stop and close the VI. Do not save changes.
9. Open National Instruments Instrument Simulator Acquire Waveform(Scope).vi from the project. This VI reads a single waveform from the Instrument Simulator.
10. Select the same VISA resource name you selected in step 3.
11. Run the VI.
12. Select a different function from the Waveform Function control.
13. Run the VI again.
14. Explore the block diagram of the VI.
To familiarize yourself with the VI’s functionality, explore the block diagram using the Context Help window.
Double-click the Read Waveform VI to open it.

LabVIEW Core 1 Participant Guide
© National Instruments | 8-27
Open to the block diagram of the Read Waveform VI. Notice that it uses VISA functions to communicate with the instrument.
15. Close the VIs and project when you are finished. Do not save changes.
End of Exercise 8-4

LabVIEW Core 1 Participant Guide
© National Instruments | 9-5
Exercise 9-1 Exploring High-Level File I/O
GoalObserve how a high-level file I/O VI writes to a spreadsheet-readable file.
ScenarioThe Spreadsheet Example VI does the following:
• Generates sine, noise, and cosine data for 128 points
• Stores this data in a 2D array that is 128 rows × 3 columns.
• Displays the 2D array in a Table indicator with three columns (Sine, Noise, and Cosine) for the first 14 rows of the array.
• Plots each column in a Waveform Graph indicator.
• Uses the Write To Spreadsheet File VI to save the numeric 2D array in a text file so a spreadsheet application can access the file.
ImplementationComplete the following steps to examine how the Spreadsheet Example VI performs the tasks described in the Scenario section.
1. Open Spreadsheet Example.lvproj in the <Exercises>\LabVIEW Core 1\Spreadsheet Example directory.
2. Open Spreadsheet Example.vi from the Project Explorer window.
Figure 9-1. Spreadsheet Example VI Front Panel
3. Run the VI.
4. Save the file, when prompted, as wave.txt in the <Exercises>\LabVIEW Core 1\Spreadsheet Example directory and click the OK button. You examine this file later.
5. Display and examine the block diagram for this VI.

Lesson 9 Accessing Files in LabVIEW
9-6 | ni.com
Figure 9-2. Spreadsheet Example VI Block Diagram
• Sine Pattern VI—Returns a numeric array of 128 elements containing a sine pattern. The constant 90.0, in the second instance of the Sine Pattern VI, specifies the phase of the sine pattern which generates the cosine pattern.
• Uniform White Noise VI—Returns a numeric array of 128 elements containing a noise pattern.
• Build Array function—Builds the following 2D array from the sine array, noise array, and cosine array.
• Transpose 2D Array function—Rearranges the elements of the 2D array so element [i,j] becomes element [j,i], as follows.
• Write To Spreadsheet File VI—Formats the 2D array into a spreadsheet string and writes the string to a file. The string has the following format, where an arrow (→) indicates a tab, and a paragraph symbol (¶) indicates an end of line character.
• Number To Fractional String function—Converts an array of numeric values to an array of strings that the table displays.
6. Close the VI. Do not save changes.
Sine Array …
Noise Array …
Cosine Array …
S N C
… … …
S N C
® ® 
® ® 
® ® 
… … …
® ® 

LabVIEW Core 1 Participant Guide
© National Instruments | 9-7
Note This example stores only three arrays in the file. To include more arrays, increase the number of inputs to the Build Array function.
7. Open the wave.txt file using a word processor, spreadsheet application, or text editor andview its contents.
Open a word processor, spreadsheet application, or text editor, such as Notepad orWordPad.
Open wave.txt. The sine waveform data appear in the first column, the random(noise) waveform data appear in the second column, and the cosine waveform data appear in the third column.
8. Exit the word processor or spreadsheet application and return to LabVIEW.
End of Exercise 9-1

Lesson 9A
ccessing Files in LabVIEW
9-1
0|
ni.com
Exercise 9-2 Temperature Monitor VI—Logging Data
GoalModify a VI to create an ASCII file using disk streaming.
ScenarioYou have been given a VI that plots the current temperature and the average of the last three temperatures. Modify the VI to log the current temperature to an ASCII file.
Implementation1. Open Temperature Monitor.lvproj in the <Exercises>\LabVIEW Core 1\Temperature Monitor directory.
2. Open Temperature Monitor.vi from the Project Explorer window.

LabVIEW
Core 1
Participant Guide
© N
ational Instruments
|9-1
1
3. Modify the block diagram as shown in Figure 9-3.
Figure 9-3. Temperature Monitor VI with Logging Block Diagram
1 Open/Create/Replace File—Creates or replaces an existing file for the data log. Right-click the operation input and select Create»Constant. Set the constant to replace or create.
2 Format Into String—Formats temperature data into a string. Expand the node to accept two inputs.3 End of Line Constant—Adds an end-of-line constant after each piece of data so that data values are separated by line breaks.4 Write to Text File—Writes the data to a file.5 Or—Stops the VI when an error occurs or when the Stop Button is clicked.6 Close File—Closes the data log file created or replaced when the VI started running.7 Simple Error Handler—Indicates whether an error occurred. If an error occurred, this VI returns a description of the error and optionally displays a dialog
box.
1 2 6 753 4

Lesson 9A
ccessing Files in LabVIEW
9-1
2|
ni.com
4. Configure the Format Into String function as shown in Figure 9-4.
Figure 9-4. Configuring the Format Into String Function
5. Test the VI.
Run the VI.
Give the text file a name and a location.
Click the Stop button after the VI has been running for a few samples.
Navigate to the text file created and explore it.
6. Close the VI and text file when you have finished.
1 Format Into String—Double-click the Format Into String function to open the Edit Format String dialog box.2 Use specified precision—Place a checkmark in this checkbox and enter 3 in the text box to specify that data have a floating point precision of three
digits.3 Corresponding format string—This text box automatically updates based on the configuration you specify. After you click the OK button in the dialog
box, the block diagram updates to display the format string.4 Help button—Click the Help button for more information about format specifier elements, such as %3f, and configuration options for the Format Into
String function.
1
3
4
2

LabVIEW
Core 1
Participant Guide
© N
ational Instruments
|9-1
3
ChallengeObjective: Create Log File with Single Header
To improve the usability of the log file, you are asked to include a header at the top of the log file as shown in Figure 9-5.
Figure 9-5. Temperature Monitor VI Log File with Header
Modify the Temperature Monitor VI to include the header Current Temperature.
Hints: • Because you write the header to the text file only once, you should write to the header outside the While Loop.
• Use the functions on the Strings palette to manipulate and format a string for use in a word processing or spreadsheet application.

Lesson 9A
ccessing Files in LabVIEW
9-1
4|
ni.com
ChallengeObjective: Create Log File with Two Columns and Headers
Modify the VI to write both the current temperature and the average temperature to the log file. Separate the columns of data with a tab character and place a header at the top of each column as shown in Figure 9-6.
Figure 9-6. Temperature Monitor VI Log File with Two Columns and Headers
Hint: Use the Format Into String function and expand it to convert and format the data into a string.
End of Exercise 9-2
1 Tabbed columns in a text editor. 2 Tabbed columns in a spreadsheet application.
1 2

LabVIEW
Core 2
Participant Guide
© N
ational Instruments
|5-5
Exercise 9-3 Create File and Folder Paths
GoalModify a VI to programmatically create a folder if none exists or to replace the folder if it already exists.
Implementation1. Open the Create folder and file.lvproj located in the <Exercises>\LabVIEW Core 1\Create folder and file directory.
2. Right-click Create folder and file.lvproj in the Project Explorer window and select Explore. Notice the files in the folder and notice that there is no folder called Logged Data.
3. Open Create Data File.vi from the Project Explorer window.
4. Examine the block diagram, as shown in Figure 9-7.
Figure 9-7. Create Data File VI Block Diagram—Start
1 Application Directory—Returns the path to the directory containing the application. This is useful because you are using a subVI to create the data file.2 Build Path—Adds “Logged Data” to the file path name.3 Create Folder—If the Logged Data folder does not exist, this function creates it.4 Build Path—This instance of the Build Path function appends the auto generated file name Acquired Data <Date><Time>.txt to the file path.5 Open/Create/Replace File—Replaces or creates the file.6 Format Date/Time String—Generates a pre-formatted string containing the current date and time.7 Format Into String—Concatenates the strings to build the file name.
6 7
1 2 3 4
5

Lesson 5File I/O
Techniques
5-6
|ni.com
5. Use the Context Help and Detailed Help for the Format Date/Time String function to identify the meaning of the time-related format codes used in this VI.
Open the Context Help if it is not already open.
Move the cursor over the Format Date/Time String function and then click the Detailed Help link in the Context Help window.
Read the Format Date/Time String Function help topic to learn the meaning of the following codes:
– %b
– %d
– %y
– %H
– %M
6. Run the VI to test the functionality.
Turn on execution highlighting.
Run the VI once and watch the flow of data on the block diagram.
Open the <Exercises>\LabVIEW Core 1\Create folder and file directory and notice that a new folder named Logged Data was created and contains an empty file. Check that the filename includes the date and time formatted components created using the codes used in the VI.
7. Run the VI a second time.
Notice that an error occurs at the Create Folder function.
Open the front panel, right-click the Error Out cluster and select Explain Error. The error code 10 Duplicate Path is returned because the folder already exists.

LabVIEW
Core 2
Participant Guide
© N
ational Instruments
|5-7
8. Modify the code to check if the Logged Data folder already exists as shown in Figure 9-8.
9. Only if the folder does not exist, create it. Therefore, you enclose the Create Folder function in a Case structure. You use the output of the Check if File or Folder Exists VI to conditionally call the Create Folder function.
10. Modify the block diagram to conditionally create the folder.
Figure 9-8. Create Data File VI Block Diagram—Complete
11. Save the VI and run it again. Notice that a new .txt file is created and the VI doesn't return an error.
End of Exercise 9-3
1 Check if File or Folder Exists VI—Checks to see if the file or folder exists and outputs this information to the Create Folder function. 2 Case Structure—Add a Case Structure around the Create Folder function and then click the Case structure border and select Make this Case False. The
folder is created only if it does not already exist. Wire the reference and error wires through the True case.
1 2
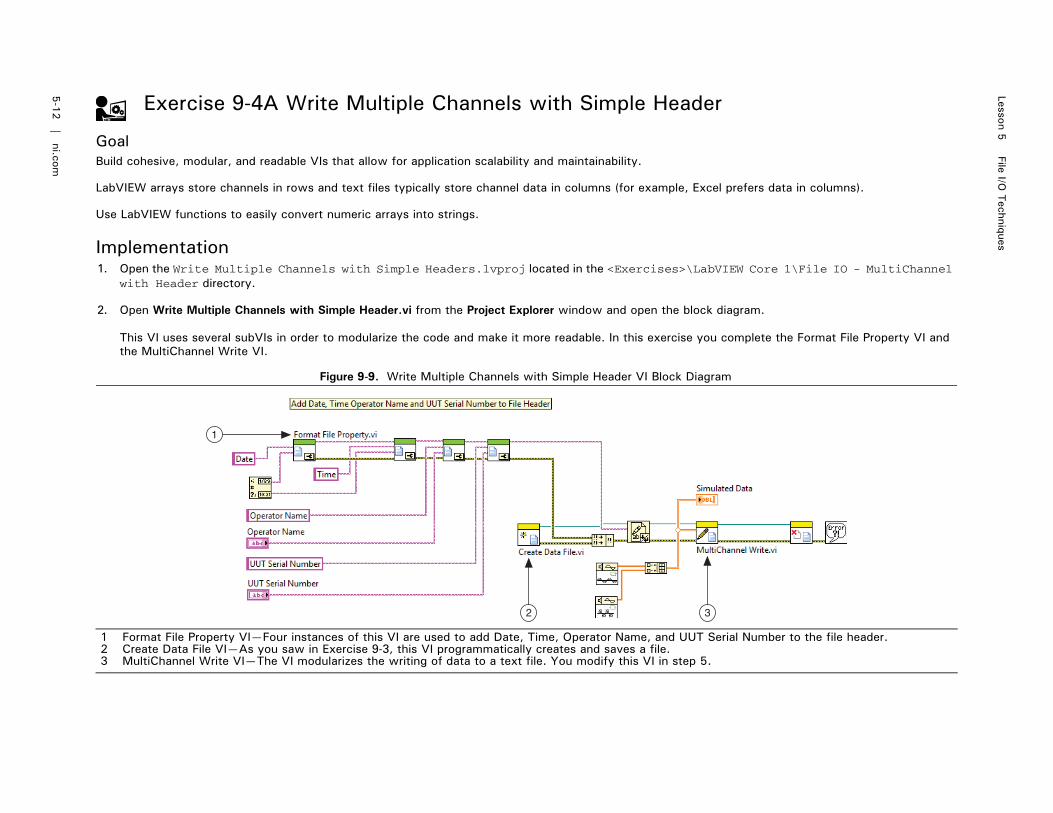
Lesson 5File I/O
Techniques
5-1
2|
ni.com
Exercise 9-4A Write Multiple Channels with Simple Header
GoalBuild cohesive, modular, and readable VIs that allow for application scalability and maintainability.
LabVIEW arrays store channels in rows and text files typically store channel data in columns (for example, Excel prefers data in columns).
Use LabVIEW functions to easily convert numeric arrays into strings.
Implementation1. Open the Write Multiple Channels with Simple Headers.lvproj located in the <Exercises>\LabVIEW Core 1\File IO - MultiChannel
with Header directory.
2. Open Write Multiple Channels with Simple Header.vi from the Project Explorer window and open the block diagram.
This VI uses several subVIs in order to modularize the code and make it more readable. In this exercise you complete the Format File Property VI and the MultiChannel Write VI.
Figure 9-9. Write Multiple Channels with Simple Header VI Block Diagram
1 Format File Property VI—Four instances of this VI are used to add Date, Time, Operator Name, and UUT Serial Number to the file header. 2 Create Data File VI—As you saw in Exercise 9-3, this VI programmatically creates and saves a file.3 MultiChannel Write VI—The VI modularizes the writing of data to a text file. You modify this VI in step 5.
1
2 3

LabVIEW
Core 2
Participant Guide
© N
ational Instruments
|5-1
3
3. From the block diagram of the Write Multiple Channels with Simple Header VI, double-click the Format File Property subVI and modify the block diagramas shown in Figure 9-10.
Figure 9-10. Format File Property VI Block Diagram
Note When you add operations to the Current format sequence in the Edit Format String dialog box, LabVIEW adds a space between each one by default. You can remove the spaces in the Corresponding format string section of the dialog box.
4. Save and close the Format File Property VI.
1 Tab Constant—Creates a constant string containing the ASCII HT (horizontal tab) value.2 End of Line Constant—Creates a constant string containing the platform-dependent end-of-line value. 3 Format Into String—Double-click the node to open the Edit Format String dialog box and select Format string (abc) from the Selected operation
(example) pull-down menu. Click the Add New Operation button three times to add three more Format string operations to the Current format sequence listbox.
Click OK to close the dialog box.
Notice that the Format Into String function now has four inputs.
21 3

Lesson 5File I/O
Techniques
5-1
4|
ni.com
5. From the block diagram of the Write Multiple Channels with Simple Header VI, double-click the MultiChannel Write subVI and complete the No Errorcase, as shown in Figure 9-11.
Figure 9-11. MultiChannel Write SubVI Block Diagram
6. Save and close the MultiChannel Write VI.
1 Transpose 2D Array—Because LabVIEW stores array data in rows by default, this function transposes your array to write the data into columns. 2 Array to Spreadsheet String—Converts the array to a table in string form.3 Write to Text File—Writes a string or an array of strings to lines in a file.
1
3
2

LabVIEW
Core 2
Participant Guide
© N
ational Instruments
|5-1
5
Test1. Run the Write Multiple Channels with Simple Header VI and create a data file.
This VI uses the Create Data File VI that you used in Exercise 9-3 to programmatically create the Logged Data directory and the data file in the same directory containing the application.
2. Add the Logged Data directory to your project.
In the Write Multiple Channels with Simple Header LabVIEW Project Explorer window, right-click My Computer and select Add»Folder (Auto-populating).
Navigate to <Exercises>\LabVIEW Core 1\File IO - MultiChannel with Header\Logged Data and click the Select Folder button.
Open the Logged Data directory from the Project Explorer window and notice that it contains the file you created when you ran the Write Multiple Channels with Simple Header VI.
Open and examine the generated file in the Logged Data directory.
3. Read the data file.
Run the Read Multiple Channels with Simple Header VI.
Navigate to <Exercises>\LabVIEW Core 1\File IO - MultiChannel with Header\Logged Data and select the data file you just created.
4. Save and close all open VIs. Save and close the Write Multiple Channels with Simple Header project.
Exercise 9-4B Challenge
GoalCreate a VI that takes the property name as input and returns the associated property value.
ScenarioYour file header includes a variable number of property names and values. After reading the file, you want to programmatically access the property value for a given property. For example, in this exercise, one of the properties was “UUT Serial Number”. You want to programmatically search for “UUT Serial Number” and then return the serial number value (e.g., “A12345”).
Description After reading the spreadsheet string into memory, use a modular approach to create a VI which finds the row index of a property name. Then use the row index to return the property value. If the property name isn't found, the VI should return a descriptive error.

Lesson 5File I/O
Techniques
5-1
6|
ni.com
Exercise 9-4C Challenge
GoalCreate a VI that creates tab-delimited column headers for an arbitrary number of channels.
ScenarioThe MultiChannel Write VI can write data for an arbitrary number of channels using a two dimensional array. You want to create a channel header for each channel of data. Since the number of channels is arbitrary, you need a scalable approach which allows for a variable number of channel headers. For example, if you have three channels of data—temperature, pressure, and strain—you want to write the data to a file with the following headers: Temperature, Pressure, and Strain. To format the file correctly, you want to use the same delimiters in the header as in the channel data. For example, if the channel data is tab-delimited with each line terminated with an end-of-line character, you want your header to be formatted the same way.
DescriptionCreate a Write Channel Data with Headers VI which you call prior to your MultiChannel Write VI that writes a channel header for each channel of data. The VI should take an array of strings as input. Your subVI should write the strings to file so that a tab separates each string and the line is terminated by an end-of-line character.
End of Exercise 9-4

LabVIEW
Core 2
Participant Guide
© N
ational Instruments
|5-2
1
Exercise 9-5 Write and Read TDMS Files
GoalLog data to a TDMS file and read the same TDMS file to access information about a specific channel.
ScenarioYou are given a TDMS Logger VI that generates measurement data for any number of units under test (UUTs). The UUT measurement data consists of a time domain waveform and the power spectrum of a waveform.
Run the TDMS Logger VI that accepts UUTs identified by serial numbers. The TDMS Logger VI retrieves the measurement data from the Generate Data VI, and logs the UUT data and additional properties to a TDMS file.
The TDMS file contains the author, timestamp, and two channel groups—Time Data and Power Spectrum Data. Each group contains a channel for each UUT. The serial number of the UUT names each channel and contains the matching signal data.
Saving data to a file serves no purpose unless you also can access the data. Create a reader VI to access data from the TDMS file you generated. The reader should return either time data or power spectrum data for a particular UUT serial number.
Note Optionally, if you have Microsoft Excel installed on your system, you can use the TDM Excel Add-In tool to load the TDMS file into Microsoft Excel.
Design—TDMS File Reference Information• File Level Information
– Time Stamp—contains the current time.
– Author—contains the test operator name, acquired through a front panel control.
– The file contains two channel groups, one for time data and one for the power spectrum data.
• Channel Group Level Information
– Name—contains Time Data or Power Spectrum Data. This identifies the channel group.
– Each channel group should contain a channel for each UUT.
• Channel Level Information
– Name—contains the UUT Serial Number, which associates the numeric data with a particular unit.
– Signal—contains an array of floating-point numeric data.
– Several other properties, such as the signal minimum and maximum, will automatically be calculated and added to the file.

Lesson 5File I/O
Techniques
5-2
2|
ni.com
Design—TDMS Reader Inputs and Outputs
Your VI should begin by opening the TDMS file and reading the author and time stamp file properties, then read the time data or power spectrum data for the specified UUT and display the data on the Channel Data waveform graph.
Table 9-1. TDMS Reader VI Inputs and Outputs
Type Name Properties
String Control Serial Number —
Combo Box Data Set Item 1 = “Time Data”Item 2 = “Power Spectrum”
Waveform Graph Indicator Channel Data —
String Indicator Test Operator —
Time Stamp Indicator Time of Test —

LabVIEW
Core 2
Participant Guide
© N
ational Instruments
|5-2
3
Implementation—TDMS Logger1. Open TDMS Logger.vi from the TDMS Logger and Reader Project located in the <Exercises>\LabVIEW Core 1\TDMS Logger and Reader
directory. This VI is pre-built for you as shown in Figure 9-12.
Figure 9-12.TDMS Logger Front Panel
2. Test the TDMS Logger VI.
Enter your name in the Test Operator field.
Enter A001, A002, and A003 in the UUT Serial Numbers control.
Run the TDMS Logger VI and save the file as test.tdms in the <Exercises>\LabVIEW Core 1\TDMS Logger and Reader directory.
When you save the TDMS file, the TDMS File Viewer window opens.

Lesson 5File I/O
Techniques
5-2
4|
ni.com
View the logged data in the TDMS File Viewer window.
Expand the test.tdms item in the File contents pane of the window and then expand the Time Data and Power Spectrum items and view the sampledata for each of the UUT serial numbers you entered.
Click Quit to close the TDMS File Viewer window.
View the front panel of the TDMS Logger VI, which also displays a plot for each serial number you enter.
Examine the block diagram.
Close the TDMS Logger VI. Do not save any changes.
Implementation—TDMS Reader VI1. Open the TDMS Reader VI from the Project Explorer window of the TDMS Logger and Reader project.
2. The front panel is shown in Figure 9-13.
Figure 9-13. TDMS Reader Front Panel
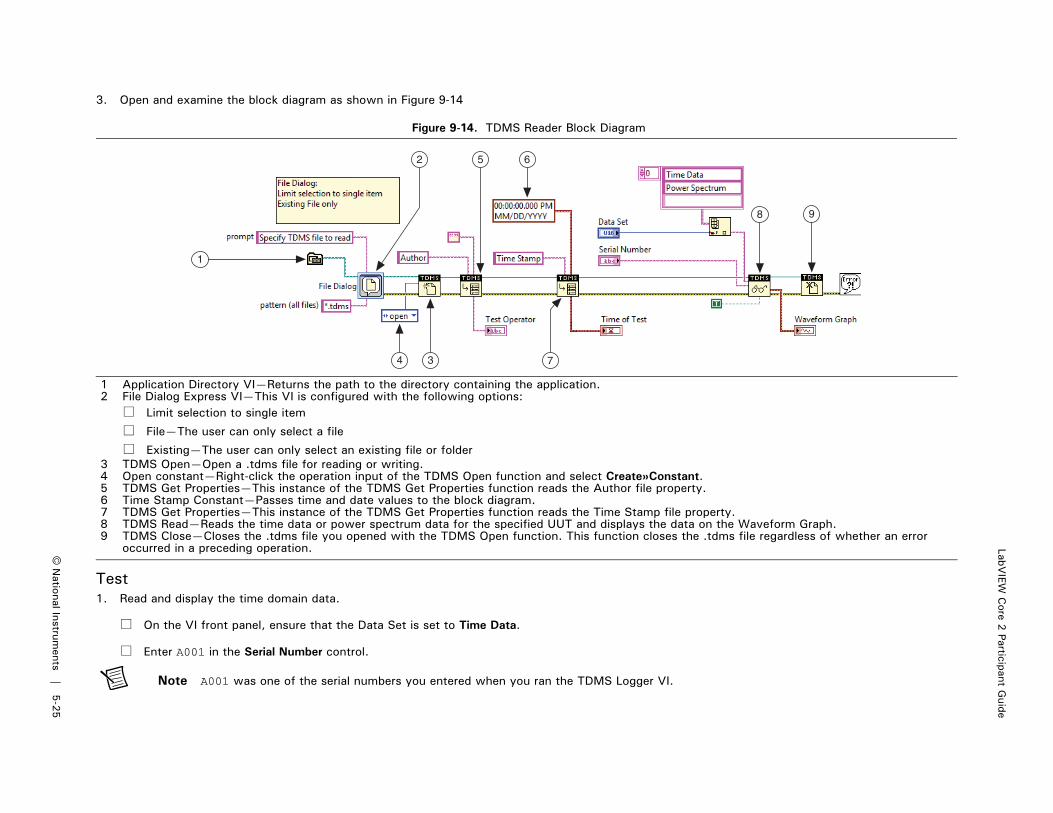
LabVIEW
Core 2
Participant Guide
© N
ational Instruments
|5-2
5
3. Open and examine the block diagram as shown in Figure 9-14
Figure 9-14. TDMS Reader Block Diagram
Test1. Read and display the time domain data.
On the VI front panel, ensure that the Data Set is set to Time Data.
Enter A001 in the Serial Number control.
Note A001 was one of the serial numbers you entered when you ran the TDMS Logger VI.
1 Application Directory VI—Returns the path to the directory containing the application.2 File Dialog Express VI—This VI is configured with the following options: Limit selection to single item
File—The user can only select a file
Existing—The user can only select an existing file or folder3 TDMS Open—Open a .tdms file for reading or writing.4 Open constant—Right-click the operation input of the TDMS Open function and select Create»Constant.5 TDMS Get Properties—This instance of the TDMS Get Properties function reads the Author file property.6 Time Stamp Constant—Passes time and date values to the block diagram.7 TDMS Get Properties—This instance of the TDMS Get Properties function reads the Time Stamp file property.8 TDMS Read—Reads the time data or power spectrum data for the specified UUT and displays the data on the Waveform Graph.9 TDMS Close—Closes the .tdms file you opened with the TDMS Open function. This function closes the .tdms file regardless of whether an error
occurred in a preceding operation.
1
34
2
8 9
6
7
5

Lesson 5File I/O
Techniques
5-2
6|
ni.com
Run the VI and select the test.tdms file you saved in <Exercises>\LabVIEW Core 1\TDMS Logger and Reader. The following information is displayed on the front panel:
– Waveform Graph—sine wave
– Test Operator—your name
– Time of Test—time stamp from when you ran the TDMS Reader
Change the Serial Number to A002.
Run the VI. A different sine wave should display.
2. Read and display the power spectrum data.
Change the Data Set control to Power Spectrum.
Run the VI and select your TDMS file. Power spectrum data should display in the Waveform Graph.
3. Close the VI.
TDM Excel Add-In (Optional)
Note This exercise requires Microsoft Excel version 2003 or 2007 and the TDM Add-in Tool available on ni.com.
1. Launch Microsoft Excel.
2. Click the Add-Ins tab and select the TDM Importer: Import a TDM(S) File icon in the Custom Toolbars section.
3. Browse to find the TDMS file you created earlier: <Exercises>\LabVIEW Core 1\TDMS Logger and Reader\test.tdms. The property information is displayed on the first worksheet. The Time data and Power Spectrum data are displayed on separate worksheets.
4. Exit Microsoft Excel and return to LabVIEW.
End of Exercise 9-5

LabVIEW
Core 1
Participant Guide
© N
ational Instruments
|10-9
Exercise 10-1 Weather Station Project
GoalCreate a VI that implements a state machine using a type-defined enum.
ScenarioYou must design a VI for a user interface state machine. The VI acquires a temperature every half second, analyzes each temperature to determine if the temperature is too high or too low, and alerts the user if there is a danger of heatstroke or freeze. The program logs the data if a warning occurs. If the user has not clicked the stop button, the entire process repeats. The state machine must also allow for expansion, because processes may be added in the future.
DesignUse a flowchart and states list to create the VI in this exercise. The flowchart in Figure 10-1 illustrates the data flow for this design.

Lesson 10
Using S
equential and State M
achine Programm
ing
10-1
0|
ni.com
Figure 10-1. Temperature Warnings VI Flowchart
Initialize
Acquistion
Data log
Analysis
TimeCheck
Time Elapsed = FALSEand
Stop = FALSE
Stop = TRUE
Warning = TRUE
Time Elapsed = TRUEand
Stop = FALSE
Warning = FALSE

LabVIEW
Core 1
Participant Guide
© N
ational Instruments
|10-1
1
The following table describes the states in this state machine.
Implementation1. Open Weather Station.lvproj in the <Exercises>\LabVIEW Core 1\Weather Station directory.
2. Open Weather Station UI.vi from the Project Explorer window.
State Description Next State
Acquisition Set time to zero, acquire data from the temperature sensor Analysis
Analysis Read front panel controls and determine warning level Data Log if a warning occursTime Check if no warning occurs
Data Log Log the data in a tab-delimited ASCII file Time Check
Time Check Check whether time is greater than or equal to .5 seconds Acquisition if time has elapsedTime Check if time has not elapsed
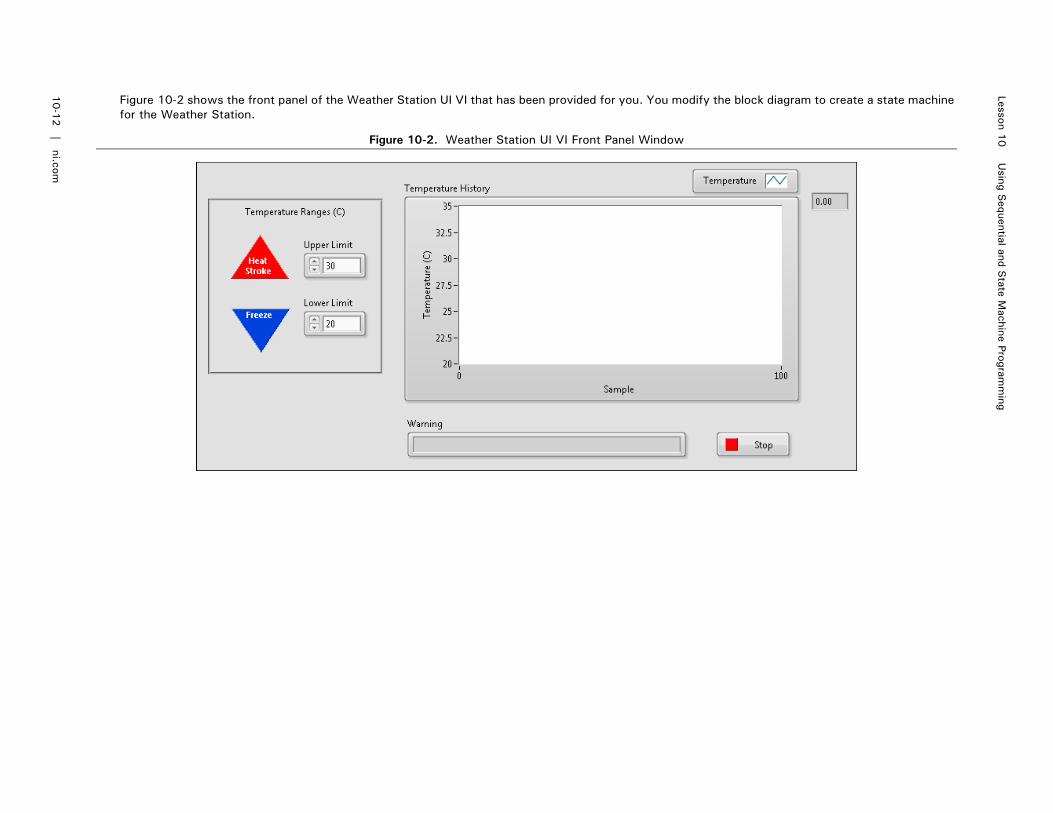
Lesson 10
Using S
equential and State M
achine Programm
ing
10-1
2|
ni.com
Figure 10-2 shows the front panel of the Weather Station UI VI that has been provided for you. You modify the block diagram to create a state machine for the Weather Station.
Figure 10-2. Weather Station UI VI Front Panel Window

LabVIEW
Core 1
Participant Guide
© N
ational Instruments
|10-1
3
Figure 10-3 shows the starting point of the block diagram for the Weather Station UI VI. You edit this block diagram to implement a state machine for the Weather Station application.
Figure 10-3. Weather Station UI VI Block Diagram Starting
1 You use these controls and indicators to program different cases.
1

Lesson 10
Using S
equential and State M
achine Programm
ing
10-1
4|
ni.com
3. Create a new type definition to control the Weather Station application.
Open the block diagram and create an Enum constant to the left of the While Loop.
Type Acquisition in the constant.
Right-click the constant and select Edit Items from the shortcut menu.
Add the items shown in Figure 10-4 and click OK.
Figure 10-4. Weather Station States Type Def
Right-click the enum constant on the block diagram and select Make Type Def.

LabVIEW
Core 1
Participant Guide
© N
ational Instruments
|10-1
5
4. Modify the new type definition and add it to the Weather Station project.
Right-click the enum constant and select Open Type Def.
Change the label on the Enum control to States.
Save the type definition as Weather Station States.ctl in the <Exercises>\LabVIEW Core 1\Weather Station\Supporting Files directory.
Close the control editor window.
In the Project Explorer window, notice that Weather Station States.ctl has been added to your Supporting Files folder because that folder is an auto-populating folder.
5. Control the state machine with the type-defined enum and update the framework as shown in Figure 10-5.
Figure 10-5. Weather Station UI VI Block Diagram
Note After you finish wiring the Acquisition case in step 6, some tunnels are empty because not all cases are wired yet.
1 Shift Register—Right-click the While Loop and select Add Shift Register.2 Enum type definition constant—Right-click and select Visible Items»Label. Change the label to Beginning State. Wire the Beginning State constant
to the shift register to initialize the shift register to the Acquisition state. Wire the shift register to the case selector of the Case Structure.3 Add more cases—Right-click the Case structure and select Add Case For Every Value to create different cases for each value in the enum.4 Weather Data In—Drag Weather Data.ctl from the Project Explorer window to the block diagram to create a type definition cluster constant. Right-click
the cluster and select View Cluster As Icon. 5 Shift Register—Place a shift register on the While Loop and wire the Weather Data In constant to it.
5
4
2
1 3

Lesson 10
Using S
equential and State M
achine Programm
ing
10-1
6|
ni.com
6. Complete the Acquisition state shown in Figure 10-6.
Figure 10-6. Weather Station UI VI Acquisition State
1 Thermometer or Thermometer (Demo)—Drag one of these VIs from the Shared Files folder in the Project Explorer window to the block diagram. Drag the Thermometer VI if you have hardware and drag the Thermometer (Demo) VI if you do not have hardware.
2 Temperature History—Move this indicator into the Acquisition state of the Case structure.3 Bundle By Name—Wire the Temperature Value output of the Thermometer VI to the Current Temperature input.4 Next State enum—<Ctrl>-click the Beginning State enum and drag a copy into the Acquisition case. Rename this copy of the Weather Station States
type definition Next State. Set the enum to Analysis and wire it through a tunnel on the Case structure to the shift register on the While Loop.5 True Constant—Create a True constant and wire it through the Case structure to the Elapsed Time shift register. The True constant resets the Elapsed
Time counter every time the VI executes the Acquisition case.
1 2 3 4
5

LabVIEW
Core 1
Participant Guide
© N
ational Instruments
|10-1
7
7. Complete the Analysis case as shown in Figure 10-7.
Figure 10-7. Weather Station UI VI—Analysis Case
1 Upper Limit and Lower Limit—Move these controls from outside the While Loop.2 Bundle By Name—Replaces the Max Temperature and Min Temperature items with the values from the Upper Limit and Lower Limit controls. The
Bundle By Name function makes it possible to wire the Upper Limit and Lower Limit values to the Weather Data In input of the Temperature Warnings VI.3 Temperature Warnings—Drag the Temperature Warnings VI from the Supporting Files folder in the Project Explorer window.4 Unbundle By Name—Returns the value of specific items from the cluster.5 Select—Determines which state to execute next depending on whether or not a warning occurs.6 Weather Station States—Wire two copies of the Weather Station States type definition to the Select function. You can create these copies from the
Beginning State enum.7 Warning—Move this indicator from outside the While Loop.
72 431
6
5

Lesson 10
Using S
equential and State M
achine Programm
ing
10-1
8|
ni.com
8. Complete the Data Log case as shown in Figure 10-8.
Figure 10-8. Weather Station UI VI—Data Log Case
1 Unbundle By Name—Returns the value of specific items from the cluster.2 Tab Constant—Inserts a tab in the string. The log file you create contains tabs between values.3 End of Line Constant—Inserts a platform-specific end-of-line value at the end of the string. The log file you create uses the End of Line constant to
insert line breaks between data.4 Format Into String—Expand the node to accept eight inputs. 5 Write to Text File—Writes the text that you formatted into a log file.6 Next State—Create a copy of the Weather Station States enum, label it Next State, and set the next state to Time Check.
5 6
1 2 43

LabVIEW
Core 1
Participant Guide
© N
ational Instruments
|10-1
9
9. Complete the Time Check case as shown in Figure 10-9.
Figure 10-9. Weather Station UI VI—Time Check Case
10. Save and test the VI.
1 Next State—Wire two copies of the Weather Station States type definition to the Select function.2 Select—Determines which state to execute next depending on whether or not time has elapsed.3 Stop Button—Move the Stop Button terminal from outside the While Loop. Wire the Stop Button terminal to the Or function outside of the Case
structure.4 Next State wire—Wire the tunnel for the Next State wire to the shift register.5 Use default if unwired—Right-click these tunnels and select Use Default If Unwired.
3
2 41
5

Lesson 10
Using S
equential and State M
achine Programm
ing
10-2
0|
ni.com
Test1. Run the VI.
Name the log file when prompted.
Enter values for the Upper Limit and Lower Limit controls and observe the behavior of the VI. Does it behave as expected?
2. Stop the VI.
3. Navigate to the Weather Warning Log.txt file and open it.
4. Notice the changes in the upper and lower limit values and the placement of tabs and line breaks.
5. Close the log file.
6. Save and close the VI and the project.
End of Exercise 10-1