labour market outcomes in the uk,nz, … · discussion paper no. 401 may 1999. labour market...
TRANSCRIPT

LABOUR MARKET OUTCOMES IN THE UK,NZ,AUSTRALIA AND THE US: OBSERVATIONSON
THE IMPACT OF LABOUR MARKETAND ECONOMIC REFORMS
R.G. Gregory
DISCUSSION PAPER NO. 401
May 1999

Labour Market Outcomes in the UK, NZ, Australia and the US:
Observations on the Impact of Labour Market
and Economic Reforms*
R. G. Gregory
Economics Program
Research School of Social Sciences
Australian National University
DISCUSSION PAPER NO. 401
May 1999
ISSN: 0725 430X
ISBN: 0 7315 2265 61
* This paper is forthcoming in Bell, S. (ed) The Unemployment Crisis: WhichWay Out?, Cambridge University Press, 1999.

CONTENTS
Page
Introduction 1
I A Brief Guide to the Reforms 3
II Reforms and Changes in the Macro Economic Growth Rate 5
The History of GDP per Capita 5
The long sweep 1960-1996 5
The shorter period 8
III Measures that Focus on Labour Market Impacts 10
Employment Outcomes 10
The long sweep 1960-1996 10
Wage changse 15
V Concluding Remarks 17
References 20
Recent CEPR Discussion Papers 21

Labour Market Outcomes in the UK, NZ, Australia and the US:
Observations on the Impact of Labour Market
and Economic Reforms
There is no doubt that large changes in government policy towards economic reform
are vitally important: some two decades ago Myanmar (Burma) was among the Asian
nations with the highest per capita income but, by turning away from economic
reform, government policy prevented the economy from opening to the world,
accepting foreign investment and developing a free enterprise culture. As a result
Myanmar has not shared in the rapid rise in income in Asia. China is another example.
Once economic reform began and international trade and domestic product markets
were liberalised, economic growth began to proceed quite rapidly. But how much
influence do less radical shifts in economic reform policy have on the macro economies
of mature democracies with a high standard of living? Do increases in the pace of
reform deliver a noticeable increase in the rate of economic growth in countries such as
New Zealand, Australia and the UK?
Once the task of assessing the impact of economic reforms is begun a number of
important lessons are learnt very quickly. Perhaps the most important is that
assessment is not a straightforward exercise.
One problem is that the potential gains from reform are exaggerated during the
process of gathering support for the changes. This process often leads to a loss of
objectivity after the reforms, as assessors of the outcomes often tend to produce
evidence that is consistent with their initial position as supporters or opponents of
the reforms. All economies experience good and bad changes through time and by the
appropriate selection of facts it is always possible to tell good or bad stories. Putting
together what would be widely regarded as a balanced assessment is very difficult.
Another problem relates to the timing of the assessments. It is often suggested that
the costs of reform occur quite quickly—job displacement and business failures for
example—and that the gains take longer. New businesses do not grow up and thrive
overnight and new jobs take time to be created. But there is no clear view as to how
long it will take before reforms pay off. Hence, when faced with disappointing
evidence, reform advocates often say that the evaluation is too soon. In the longer
term, when reforms are likely to have their greatest permanent impact, there is often a
new political agenda and the careful linking of current outcomes to reforms in the
distant past is often not a high priority. Longer run balanced assessments of reforms
are often quite scarce.

Finally, in many countries, and in so many instances, post reform macro outcomes
seem surprising and disappointing which suggests either that reforms do not deliver
promised results or that their impact is easily swamped by other influences on the
economy. The impact of non reform factors on the economy, and their potential to
mask post reform outcomes, raises the difficult problem of the counterfactual, that is,
what would have happened to the economy if the reforms had not taken place.
Perhaps the lack of good outcomes from reforms is the result of negative non-reform
factors swamping good reform outcomes.
The isolation of reform impacts is a difficult problem that is often handled by
construction of a computer model of the pre-reform economy that is then subject to
the reform change and the reform results simulated. The obvious inadequacy with this
approach is that the model is often designed to deliver good results from the reforms.
The arguments for the reforms and the design of the model are based on the same
theoretical view of the economy. The counterfactual problem therefore will always
remain.
These difficulties suggest that it would be unwise to be too dogmatic when
evaluating reforms, that inevitably there is no escape from exercising considerable
judgement and that the assessment of outcomes may change over time as new evidence
is accumulated. The difficulty of the task explains, in part, why there are often large
differences in opinion as to whether particular reforms are a success or a failure.
In this paper we focus on labour market and economic reforms and their impact on
economic growth, employment and wage outcomes in the longer term. To make the
task more manageable we describe the economic growth experiences of four English
speaking countries. We look at the impact of the Thatcher reforms in the UK, the
Douglas reforms in New Zealand, and the Hawke Accord period and subsequent
labour market reform in Australia. The US is taken as a comparison country that has
not been subject to substantial shifts in government introduced labour market and
economic reforms except, perhaps, in the area of immigration and very recently in the
area of welfare reforms. The welfare reforms are substantial but it is too early for
them to impact significantly on our comparisons.
We adopt a very aggregative approach. The focus is on four series taken from the
OECD Economic Outlook data base: The analysis is based on measures of
i) output produced for the residents of each country (GDP per capita);
ii) the proportion of the population employed (the employment-population
ratio)
iii) the changing living standards of the employed population (the rate of
growth of real compensation per employee); and
iv) the changing distribution of full time weekly earnings.
It is important to present the macro data because it helps set the framework for
other chapters in this volume.1
The major advantage of this aggregative analysis is that it provides a macro
framework that acts as a constraint on exaggerating the losses and gains that may be
identified from a more piecemeal assessment. The disadvantage, of course, is that the
diversity of experience within the aggregates is lost.
I. A Brief Guide to the Reforms
For the past forty years at least, governments always seem to have been promising
that a new bout of economic reform will quickly lead to faster economic growth,
higher incomes and more jobs. This strong belief in the suddenness of the large ‘pay
off’ from government induced economic reform became clearly apparent in the UK
during the 1960s. Harold Wilson, the Labour leader, promised all that if elected, he and
the Labour Party would reform the British economy and the electorate would
experience the white heat of a technological and economic revolution. All would gain.
Reform was to be achieved by more government involvement in the economy
especially in the planning of economic growth and the development of new
technologies.
A decade and a half later, in 1979, Prime Minister Thatcher was also to promise
radical reform and gains to all in the UK but the meaning of economic reform had
changed in a very fundamental way. Reform now meant that the economy should
become less subject to government involvement and all should be less dependent on
government. The labour market was to be subject to special attention. Where possible,
centralised wage fixing authorities were to be weakened and more of the responsibility
for wage outcomes and employment conditions was to be negotiated between
individual firms and their workers. The power of unions was to be reduced.
This shift in the nature of reform has occurred in most OECD countries. Economic
reform is now primarily thought of as a change from more to less government
intervention and as a process that frees up product and labour markets. This change in
emphasis has also occurred in Australia, although the change was not quite as stark as
in the UK and the timing was different. The Whitlam Labor government during the
1 The volume is Bell, S. (ed) The Unemployment Crisis: Which Way Out, CUP, 1999

early 1970s initially promised more government intervention in the economy and
faster economic growth that would benefit us all. But, once in office, the government
tended to pursue less regulation and intervention by implementing policies, such as
tariff reductions and less restrictive immigration, which led to more involvement in the
world economy. After the defeat of the Whitlam Government there was, for a while, a
move back to more government intervention in the economy. Industry policy became
more interventionist and wage outcomes became more centralised. But from 1983
onwards, the new Hawke Labor Government slowly began the process of economic
reform and policy was increasingly directed towards integrating Australia more with
Asia and increasing the degree of competition in product markets. Tariffs were
reduced and exchange rate targeting abandoned. It was hoped that Australia would be
dragged upwards by the faster economic growth of the Asian region. The emphasis on
government involvement with the labour market was to continue in the context of an
Accord with the unions and, unlike the UK reforms, not a great deal was done to
deregulate the labour market.
More recently, the Howard Liberal and National government has accelerated the
process of economic reform and, like the Thatcher Government, has been advocating
the benefits of labour market reform and less government involvement in the economy.
Industrial relations legislation has been changed and public utilities privatised.
Wherever possible more competition has been introduced to the government and
private sector. Our political leaders believe that we should all become less dependent
on government for education, health and industry assistance.
Across the Tasman, the New Zealand experience has been similar. During the late
1970s government intervention into the economy and ‘think big’ strategies were to
save New Zealand. Then, following upon the lack of success, the New Zealand
government became the most radical of free market reformists in an attempt to move
the economy away from government dependency towards more competition and more
expansion into world markets. The reforms, which began in 1984 with the election of a
Labour government, have been quite exceptional in their extent, consistency, and
speed and for the level of intervention from which they began. Among OECD
countries the New Zealand reforms represent an extraordinary experiment. The
reforms were also unusual in that they were based on a ‘new’ theoretical structure of
economics which stressed contestability in markets, transaction costs and public
accountability (see the Reserve Bank Act 1989 and the Financial Responsibility Act
1994).
The initial New Zealand reforms of 1984-86 began in the capital and financial
sectors and in international trade and monetary policy. During those years wage, price
and interest rate controls were removed and the exchange rate initially devalued by 20

per cent and set free to float. These changes were followed by reforms to taxation,
corporatisation and public expenditure. The labour market reforms were introduced
during 1990-91. The introduction of the 1991 Employment Contracts Act
decentralised the New Zealand labour market and replaced multi-employer collective
contracts with individual and single employer agreements. The legislation abolished
centralised wage setting and made compulsory unions illegal. More recently, radical
welfare reforms have been introduced2.
Finally, the US has also been subject to similar advocacy for reform but the ability
of government to intervene or withdraw from the economy is more limited and it is
more difficult to marshal political coalitions for reform. Although the US has
embarked on extensive and radical welfare reforms that have impacted on the labour
market these changes have only recently occurred and do not impact on our analysis.
The US economy therefore provides a counterfactual or a backdrop against which the
evolution of the other economies can be judged.
II Reforms and Changes in the Macro Economic Growth Rate
Many of the reforms could and should be evaluated on a micro basis. Thus, where a
public utility is privatised, the evaluation should focus on such things as changes in
price and quality of customer service and changes in the cost of production and
workplace practices. There are some studies that adopt this approach (see various
chapters in Silverstone et al (1996)) but in the rhetoric associated with reforms there is
clearly a macro focus and a belief that the reforms will speed up the process of
economic growth. The Productivity Commission in Australia, for example, always
argues that Australian living standards in aggregate will noticeably drop behind those
of other countries unless the process of reform is continued and perhaps increased. In
this paper therefore we adopt a macro focus and search for interrelationships between
periods of reform and changes in the macro economic growth rate.
The History of GDP per Capita
The long sweep 1960-1996
The purpose of most economic reform is to increase the amount of goods and services
available for the citizens of the country. Therefore, as a first approximation, the
reforms might be assessed by their impact on the growth of GDP per capita, that is,
the amount of goods and services produced per man woman and child. Of course, this
2 We cannot list all the new Zealand reforms here. A good description of the reforms and their date
of introduction can be found in Evans et al (1996), and Silverstone, Bollard and Lattimore (1996)
is not an ideal measure of economic progress. GDP, as conventionally measured, does
not take into account many of the economic costs of reform such as loss of well being
and perhaps ill health associated with job displacement, changes to the environment,
movements towards a less desirable income distribution, and so on. Furthermore,
GDP per capita does not take into account the cost of producing the output. The
same GDP per capita with more voluntary leisure is obviously better than the same
GDP per capita produced by more workers, longer hours of work and less voluntary
leisure. Nevertheless, GDP per capita is probably the best place to begin.3
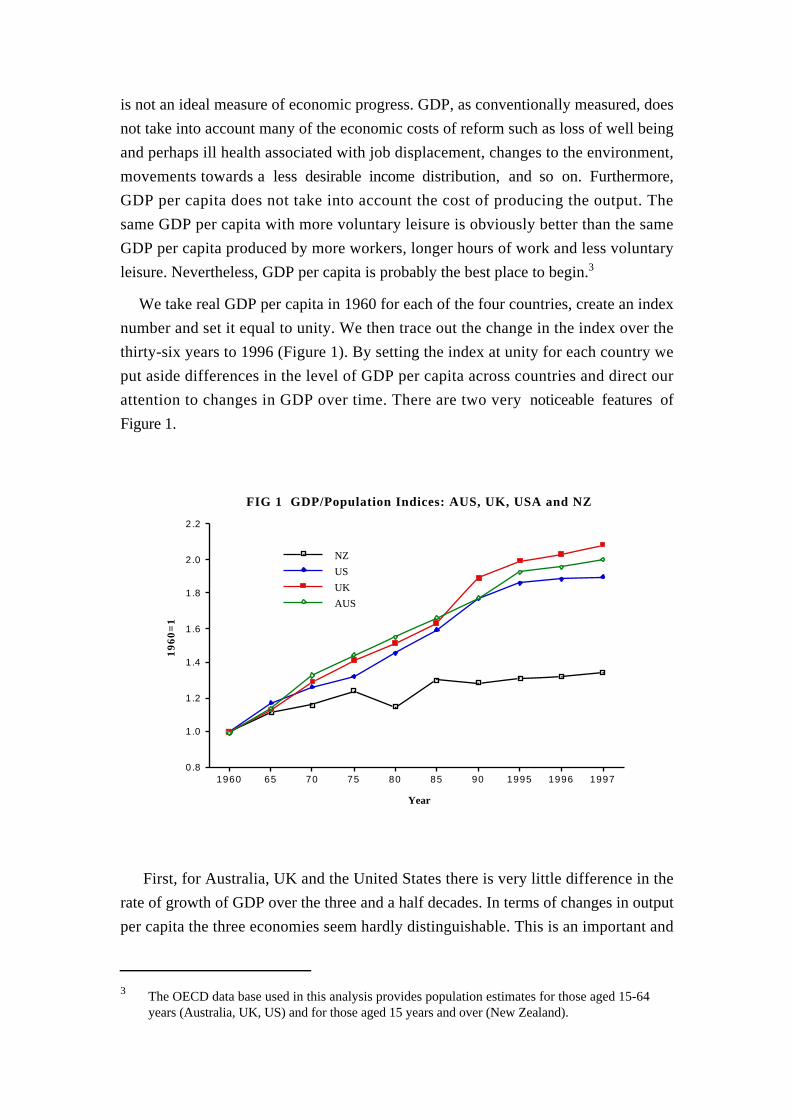
We take real GDP per capita in 1960 for each of the four countries, create an index
number and set it equal to unity. We then trace out the change in the index over the
thirty-six years to 1996 (Figure 1). By setting the index at unity for each country we
put aside differences in the level of GDP per capita across countries and direct our
attention to changes in GDP over time. There are two very noticeable features of
Figure 1.
First, for Australia, UK and the United States there is very little difference in the
rate of growth of GDP over the three and a half decades. In terms of changes in output
per capita the three economies seem hardly distinguishable. This is an important and
3 The OECD data base used in this analysis provides population estimates for those aged 15-64
years (Australia, UK, US) and for those aged 15 years and over (New Zealand).
1960 65 70 75 80 85 90 1995 1996 19970.8
1.0
1.2
1.4
1.6
1.8
2.0
2.2
NZ
US
UK
AUS
FIG 1 GDP/Population Indices: AUS, UK, USA and NZ
Year
19
60
=1

somewhat surprising result. The average growth rate of GDP per capita from 1960 to
1996 is 1.8, 1.9 and 1.7 per cent for Australia, the UK and the US respectively. The
difference in growth rates is less than .02 per cent.
The following observations seem to follow from the fact that three countries have
experienced similar growth rate outcomes.
_ Per capita income growth seems to be largely independent of population growth.
Over this period the population of Australia doubled, that of the US increased
60 per cent and that of the UK increased 11 per cent. And yet, the growth of
GDP per capita is approximately the same in each country.
_ The reformist periods may not have had far reaching effects on these economies.
In terms of GDP per capita growth rates the Australian and UK histories do not
seem very different from that of the US. Of course, if the reforms had not
occurred the time path followed by GDP per capita may have been different
across countries but it is doubtful this would have occurred.
_ Because the GDP growth rates are similar across the three countries there has
been no obvious and consistent income catch-up to the US. Australian and UK
income levels are still approximately 20-30 per cent lower than the US. It is
possible that with increases in the rate of international capital flows and
technology across countries that the income gaps between the US, UK and
Australia might have narrowed in a way that was noticeable. The hope that as
Australia becomes more linked into the world economy our growth rate would
increase and income levels would approach those of the US, has not been
fulfilled.
_ There seems to be some advantage from looking at a long period of time because
there are sub-periods when one country does better than the others only to fall
back again during a later period.
_ The data for Australia, UK and the US trace out a relationship with time that
seems to be linear. Consequently, in growth rate terms, there is evidence of a
slowing down in the GDP per capita growth rate, although this reduction is not
very substantial. The average rate of growth of GDP per capita of the three
economies averaged 2.5 per cent between 1960 and 1975 but only 1.0 per cent
between 1975 and 1996.
The second noticeable feature of Figure 1 is that the New Zealand growth
performance is clearly quite different from that of the other three countries. Among
OECD countries, and especially over the last two and half decades, New Zealand has
been the worst performer by a very large margin. This deterioration stemmed largely

from the separation of the New Zealand economy from the UK primary product
markets during the 1970s. The deterioration in growth rates created a sense of crisis in
New Zealand and established the preconditions for radical reform over a decade later4.
Quite clearly something was wrong. Government felt that something must be done in
an attempt to increase the growth rate. Initially, during the 1970s, New Zealand tried
the interventionist policies of Prime Minister Muldoon but as these policies failed the
pressure to do something else was growing with each passing year5. This is an
important point. The better performance in Australia during the 1970s and 1980s
helps to explain, in part, why reform was not as radical here and was introduced more
slowly. There seemed to be less need for change in Australia.
The Shorter Period
Although it appears that any reform influence is slight when measured against the long
sweep of history, and in terms of per capita GDP growth rates, reform effects may be
more apparent if the period of analysis is shortened. To examine the effects of the
Thatcher reforms we rebase the GDP per capita indices at unity in 1979, the first year
of the Thatcher government. We then subtract the UK GDP per capita index from that
of Australia and express the difference as a proportion of the UK GDP per capita
index. This indicates the change in the GDP/per capita between the two countries
relative to 1979. Then the gains and losses of UK output, relative to Australia, are
accumulated by applying a running sum to the gaps (Figure 2).
For the first six years after 1979 the increase in the GDP per capita index was
greater in Australia, then the UK gradually narrows the gap. If the difference in the
path of GDP per capita between the countries was only a product of the reforms then
at the beginning of the period we expect to see the usual costs of reforms, in terms of
lost GDP, but the eventual improvement in GDP some years later. This is the pattern
we observe.
4 The crisis came to a peak in June 1984 when the Reserve Bank of New Zealand announced, the
day after the election, that it was ceasing to convert NZ dollars into foreign currency.5 The poor growth rate performance of New Zealand was not a new phenomenon. It has been
estimated that in 1939 New Zealand GNP per capita was 92 per cent of that of the US. Half acentury later it was about 50 per cent of the US level (Maddison 1989)

It was 11 years after the reforms began before the UK made up for lost output,
relative to Australia, and then the UK continued to gain an additional increment in
approximately two months, the equivalent of a little less than an additional three
days work for each of the twenty years. A similar calculation shows a falling behind
of the UK relative to the US in the early period and a catch up later. But over the
period as a whole the accumulated gains and losses of output per capita offset each.
These are obviously crude calculations—they attribute all the differences between
Australia and the UK and between the UK and the US to the greater pace of reforms
in the UK. Despite their crudity they do suggest that the differences in GDP per
capita growth rates between the countries are very small and that promises of large
changes in growth rates in response to reform seem astray. The calculations suggest
that relative to Australia there was a very small gain from the Thatcher reforms but
the gains took at least six years to become evident. Relative to the US there was no
gain.
To focus on the New Zealand reforms we perform the same calculations but rebase
the indices at 1984, when the NZ reforms began (Figure 2). The story is very different
from that generated by the UK reforms. The relative deterioration of New Zealand
growth of GDP per capita is very marked since 1984 and there is no evidence of a
recovery relative to any of the other three countries. New Zealand has increased its
output per person ratio by 4 per cent over the 13 years while the UK and Australia
19981996199419921990198819861984198219801978
-1.2
-1.0
-0.8
-0.6
-0.4
-0.2
0.0
0.2
0.4
UK-AU GDP/POP
NZ-AU GDP/POP
FIG 2 Running Sums NZ-AU and UK-AU GDP/POP Indices
Year
Ru
n S
um
s %
NZ
, U
K G
DP
/PO
P I
ND
EX

have increased their output per person ratios by 34 and 23 per cent respectively.
Thirteen years after the reform process began New Zealand has lost one and a quarter
years of GDP per person relative to Australia and the loss continues to grow. A
similar story is evident from a comparison of NZ with the US.
These crude calculations present us with the first set of puzzles. Why were the
gains from reforms in the UK so small, relative to Australia and non-existent, relative
to the US? Why is New Zealand so different and why has New Zealand lost so much
relative to the other countries? It is not clear how these questions can be easily
answered but given the high hopes for the New Zealand reforms, their consistency,
their wide ranging nature and their development against a consistent theoretical model
the results must be extremely disappointing to New Zealanders and to those who
advocated the reforms. Indeed it is perhaps difficult to believe that the outcomes could
have been worse if there were no reforms at all.
III Measures that Focus on Labour Market Impacts
GDP per capita is only one macro measure of the potential impact of reforms6. We
now turn our attention to other measures that focus on labour market impacts. We
begin with employment outcomes and then turn our attention to changes in the
average wage and its distribution.
Employment Outcomes
The long sweep 1960-1996
Since the mid 1970s the average unemployment rate among OECD countries has
increased. Among our four countries all except the US have experienced large increases
in unemployment and for Australia and New Zealand the increases, relative to the
very low unemployment rates of the 1950s and 1960s have been very large. For all
except the US unemployment seems to have moved to a new range approximately
between 6 per cent and 10 per cent.
Much of the advocacy for labour market and other economic reforms has been
based on the belief that economic reform will increase employment and reduce
unemployment. The commonly heard phrases are ‘reforms will lead to faster
6 Economists have also emphasised many other objectives of reform such as moving the
government deficit into a surplus, reducing the rate of inflation, reducing the size of thegovernment sector and encouraging user pay charging practices for government services and stateowned enterprises. Most of these objectives should not be thought of as final objectives but asmeans to increase GDP per capita. It is surprising therefore to see so much emphasis placed onthese intermediate objectives and no discussion of the GDP per capita growth rate in the majorsurvey of New Zealand reforms by Evans, Grimes, Wilkinson and Teese (1996).

economic growth’ and ‘faster economic growth will create more jobs’. The
relationship between employment and economic growth, which we measure as the
growth of GDP per capita, can be summarised by the following identity,
Q/P ≡ E/P – Q/E (1)
where Q/P is GDP divided by the population, E/P the employment-population ratio
and Q/E the level of labour productivity. This identity can be rewritten in growth rate
terms as
q ≡ l + p (2)
that is, the rate of growth of GDP per capita, q, is identically equal to the sum of the
rate of growth of the employment-population ratio, l, and labour productivity, p.
It is clear from (2) that an increase in economic growth, q, need not be associated
with a faster rate of job creation. The identity is consistent with a wide range of
possible relationships between the variables. Faster economic growth, for example,
may be associated with a faster rate of productivity growth and if the increase in the
productivity growth rate exceeds the increase in the economic growth rate then
employment will fall, relative to the population.
In the economic literature there is little theory applied specifically to the impact
of economic reform on the division of the growth of GDP per capita between the two
right hand components of equation (2). There are different theories for different sets
of circumstances. Here are some examples to illustrate the point. When considering
economic development in Asia it is usual to think of the two terms on the right hand
side as independent and assume that reforms to free up labour and product markets
will increase labour productivity and GDP per capita but not reduce the employment-
population ratio. This relationship seems to prevail not only in Asia but wherever low
income countries begin to experience fast economic growth.
But what might be expected from labour market and economic reform in the high
income English speaking countries? Here there seem to be many different possibilities.
One story that is told is the same that is applied to economic development in Asia. It
is argued that labour market reform will increase labour productivity and leave the
employment-population ratio unaffected. Under these circumstances increases in
labour productivity are unambiguously a good thing.
Another story, often told by Treasurers and Prime Ministers who are advocating
more reform, is that labour productivity increases will add to both employment and
GDP per capita. The positive impacts of labour market and other economic reforms
proceed along two channels to increase GDP per capita. Once again reform is
unambiguously a good thing.

Finally, it might be argued that reforms that lead to productivity increases,
generated by job shedding, may give rise to lower employment levels and not affect
the rate of growth of output. The impact of reform, under these circumstances, is on
the two right hand side variables of equation (2). The effects are equal and offsetting.
This is a version of the Luddite view of technical progress. The Luddites—a group of
textile workers based around Nottingham in the early 1800s—believed that new textile
technology reduced employment. In response, they set about destroying machines.
For nineteenth century Britain and for the macro economy as a whole we know that
the Luddites were wrong. Productivity growth added to income per capita and did not
detract from employment
In the short to medium run, it is still possible that lower employment levels may
accompany productivity increases. If so, it is important to know whether the
reduction in is involuntary and adds to unemployment or whether the extra leisure is
valued and taken as shorter working hours or additional holidays. Where the additional
leisure is not valued, and reform reduces employment and increases unemployment,
productivity improvements may not be a positive force for increased well-being.
The reason why so many different views can be held as to the relationship
between economic reforms, productivity and employment is that equation (2) is an
identity and not a theory. As an identity equation (2) describes how variables must be
related together. To understand the links among the variables a theory is needed along
with additional equations to embody that theory. We will not go down this path but
instead focus on actual outcomes7.
Figure 3 plots the four country history of the first term of the right hand side of
the identity, the employment-population ratio. The employment-population ratio at
1960 is set equal to unity for each country. So, once again, the focus is on changes
through time rather than on the level of the employment population ratio in each
country. Five features are noticeable from Figure 3.
First, during the 1960s and into the mid 1970s, each country maintained
approximat constancy in its employment-population ratio. Economic cycles and
variations in economic growth exerted little influence on the employment- population
ratio. The large swings in the employment-population ratio date from the mid 1970s
and this instability has continued in all countries.
Second, the New Zealand employment experience has been very poor and
noticeably different from the other three countries. Over the six years following 1984,
when the New Zealand reforms began, the employment-population ratio fell 10
7 For an introduction to some of the literature see Basu, Fernald and Kimball (1998).

percentage points. New Zealand did not share in the rapid employment growth that
was widespread throughout the OECD during this period. There was a strong
employment recovery in New Zealand from the 1991 recession but this recovery is
not enough to return the employment-population ratio to previous levels.
Third, the Australian and UK experiences are very similar until 1980. Then,
during and after the Thatcher reforms, the UK employment performance deteriorates
relative to Australia. The deterioration appears concentrated in the two periods 1980-
1983 and post 1993, when UK employment does not significantly recover from the
recession.
Fourth, it is noticeable that the UK and New Zealand employment performances
were very poor during the five to seven years after the reforms began. The UK
experienced the worst employment outcomes from 1979-1984, and New Zealand
experienced the worst employment outcomes from 1985-1992.
Fifth, the US is very different from the other countries in our sample. Since 1975
the US employment-population ratio has increased 20 per cent while the Australian
and UK ratios are not very different from early 1970 levels. The last two decades have
seen unprecedented US job growth. It is not true therefore that the introduction of
20001995199019851980197519701965196019550.8
0.9
1.0
1.1
1.2
US E/P Index
UK E/P Index
AU E/P Index
NZ E/P Index
FIG 3 Employment/Population Indices 1960-1997
Year
19
60
=0

computers, or the development of new technologies, has led to job shortages in all
developed countries. The US, which has led or shared the adoption of new
technologies, has a very different job growth experience from other OECD countries.
For the US the relevant question is how has the economy achieved such an envious
job growth? For Europe, the UK and Australia the relevant question is just the
opposite. Why has their employment record been so poor relative to the increased
demand for employment?
It was shown earlier that the UK, Australia and the US experienced similar
growth paths in GDP per capita. That is, there appears to be a fixed relationship
across these countries in the right hand variable of equation (2). But the growth paths
of the employment-population ratio are very different. If these differences can be
attributed to economic and labour market reforms then it appears that reforms exert
their most significant impact on employment rather than output.
Given that the growth rates of GDP per capita are similar but the growth rates of
the employment-population ratios are different, it follows, from equation (ii), that the
labour productivity performance must be different across these countries. For these
three countries the dominant experience has been that changes in the two terms on the
right hand side of equation (2) have been offsetting to maintain the identity. Where the
employment-population ratio has increased most the labour productivity index has
increased least. Since the mid 1970s therefore the relationship between the
employment-population ratio and productivity across these countries seems
consistent with a Luddite view of macro outcomes.
This is a very disturbing and surprising result. It follows that the US has achieved
a much better employment outcome not by faster economic growth but by lower
labour productivity growth. To produce the same rate of output growth as the UK
and Australia the US needed to employ more workers. For the UK the marginally
worse employment-population growth rate, relative to Australia, has been offset by a
marginally better labour productivity performance. These results suggest that the
major differences among these countries relate to employment issues and not different
growth rates of GDP per capita.
Does this suggest that we should attempt to prevent technical change and
productivity improvements to preserve employment? That would not seem to be a
desirable response because the resources being freed by productivity improvements
represent opportunities for additional output or additional and desirable leisure if the
economy can find ways of utilising these resources. The traditional way of doing this
was to increase government involvement in the economy either in training of workers
to increase their employability or adding to demand by producing labour intensive

community outputs. Unfortunately the present political climate seems to discourage
government activity in this area and consequently it is not clear how these unutilised
labour resources can be harnessed for the private and public good.
Wage Changes
In most economies increases in labour productivity are usually associated with
increases in average wages. This relationship is very noticeable among our four
countries as seen in Figure 4 which plots the real compensation per. The New Zealand
data are available only from 1972 and therefore 1972-1997 is adopted as the period of
analysis. The Figure tells the following story.
From the mid 1970s, before the Thatcher reforms, the real wage series in the UK
grows strongly and this growth continues until 1990 and then the growth is arrested.
In terms of real wage increases the UK has performed so much better than the other
three economies. It alone has managed to maintain substantial real wage increases
through the 1980s. The growth is quite spectacular and, although the growth seems to
have begun before the reforms, this experience does lend support to the argument that
the UK reforms have increased labour productivity and increased substantially the real
wages of the employed workforce.
Australian and UK real wages increase at much the same rate until the early 1980s
and then from the beginning of the Accord period the path of wages in Australia
20001995199019851980197519700.8
1.0
1.2
1.4
1.6
1.8
UK
AU
US
NZ
FIG 4 Real Wage Compensation Indices 1972-1997
Year
19
72
=1

deviates from that of the UK and there is approximate real wage constancy. The
Australian government adopted the policy that real wage moderation was necessary to
foster employment growth and while Australian employment grew faster than that of
the UK the additional employment growth was not as great as the additional wage
growth in the UK.
New Zealand outcomes are again very poor. Real wages in 1997 are lower than in
1974 and 1975 and there is no clear evidence of the labour market and economic
reforms being associated with average real wage increases.
Finally, it is surprising how sluggish real wage growth has been in the US. By
1996 US real wages are only 11 per cent higher than in 1972. The US real wage series
also appears to have much less variation over time suggesting a very different type of
labour market. What may be said about the distribution of wages among the
employed? There is a marked tendency for the distribution of wages to widen in each
of these labour markets. There are no adequate data from NZ so the focus is placed on
the US, UK and Australia.
The tendency for the wage distribution to widen is documented from the full-time
weekly earnings for males and females. Weekly earnings are ranked from the lowest to
the highest in each country and the ratio calculated for the 90th to the 10th percentile.
Table 1 presents this ratio for a number of years. The wage distribution is widest in
the US, narrowest in Australia. The UK wage distribution lies somewhere in between.
Table 1: Full-time Weekly Earnings: Ratio of 90th to 10th Percentile
Wage and Salary Earners 20-64 years
1983 1991 1996 Change1983-96
Males
Australia 2.43 2.47 2.76 13UK 2.75 3.15 3.75 36USA 4.00 4.31 4.64 16
Females
Australia 2.32 2.29 2.60 12UK 2.70 3.02 3.36 24USA 3.28 3.69 4.09 24
Source: US: March, Current Population Surve.yUK: General Household Survey, Office of Population and Census Surveys.Australia: Weekly Earnings of Employees (Distribution), ABS Catalogue No.
6310.0.
The greatest increase in wage inequality occurred in the UK. The gap between
the male wage at the 10th and 90th percentile increased 36per cent between 1983 and
1996. The increase in inequality is a little less in the US and a little less again in
Australia. It appears that in Australia the Accord process may have slowed the
tendency for the wage distribution to widen but since the early 1990s the rate of
growth of inequality has accelerated.
Although the real wage distribution has widened it is only in Australia and the US
that wages have fallen in real terms among the low paid. In the UK wages among the
low paid have fallen relative to the median but the increase in the median wage has
been sufficient for wages of the low paid to have continued to increase in real terms.
V. Concluding Remarks
It is important, when evaluating reforms, that we keep our eye on the big picture to
clearly establish the macro outcomes. In any economy – those that produce good
macro outcomes and those that produce bad macro outcomes - there are always some
success stories of individual firms, plants and products. The big picture, however,
cannot present all the outcomes and must inevitably involve some simplifications.
Nevertheless a very powerful picture emerges with very clear and bold brush strokes.
The major result is that over a period of three and a half decades the UK,
Australia and the US have experienced very similar growth rates of GDP per capita
which seem largely independent of labour market and economic reforms. It is as
though these countries are all linked together in output terms. It is not as though those
countries which have introduced the most wide ranging reforms have grown any faster.
This does not mean that labour market and economic reforms do not affect output, or
are not worthwhile in output terms, it is just that the macro effects are not great
enough to be easily observed. The promise of a noticeable change in GDP growth per
capita following reforms has not been delivered. We should be very sceptical therefore
of claims that particular institutional changes, which may be worthwhile in their own
right, will noticeably affect the growth rate of GDP per capita.
Unlike GDP per capita growth rates there are significant differences in labour
market outcomes. The employment history is very similar across these three countries
until the mid 1970s and then employment paths diverge. It appears as though labour
market institutions and reforms are capable of affecting employment-population ratios
without substantially affecting GDP per capita. Since the mid 1980s UK labour
productivity has increased relative to Australia and, given that the rate of growth of
output seems unresponsive to the reforms, UK employment has fallen, relative to
Australia. Something similar has occurred in Australia relative to the US. Australian

labour productivity performance has been superior to that of the US and, given that
output growth rates do not differ significantly across these countries, the effect of a
better labour productivity performance is a worse employment performance.
The real wage history also differs substantially across the countries. The UK has
managed to achieve substantial real wage increases throughout the 1980s. By 1990 real
wages in the UK are 50 per cent higher than in 1972. This is by far the best
performance among these countries and suggests that the reform process may have
substantially advantaged those with jobs. The New Zealand experience, however,
does not support this conjecture. Average real wages in 1997 are lower than in the
early 1970s. There does not seem to be a simple relationship between the extent of
economic reforms and real wage growth.
The three countries for which data are available share a growing inequality of
wages. The change is greatest in the UK. Despite the Accord process and centralised
wage fixing Australia has also experienced increased inequality, especially post 1990.
New Zealand presents us with the largest puzzle. The country with the greatest
rate of reform has experienced the worst economic outcomes and has lost considerable
ground to Australia, the UK and the US in terms of the growth rate of GDP per
capita. The reforms have not delivered any noticeable improvement. Employment
losses relative to the other three countries far exceed anything that has been seen in
any other period over the last fifty years. It now appears, in growth rate terms, that
the falling employment-population ratio relative to Australia, the UK and the US may
have ceased but there is no obvious evidence of any clawing back of the accumulated
losses to date. Real wages have failed to increase in NZ.
The issue for New Zealand commentators therefore is to begin with the
knowledge that the reforms have not been successful in terms of the macro aggregates
presented here and to try and establish why. What could have been done better? The
need to understand what happened in New Zealand is fundamental. After all the
reforms there were consistent with the advice emanating from the World Bank, the
IMF, the OECD and most economists. It might be argued that the rate of GDP per
capita decline in New Zealand, relative to Australia and the UK, has substantially
slowed and that this is the positive outcome from the reforms. But there is no closing
of the GDP per capita gap that existed between New Zealand and our sample of
countries.
For the UK the reform story is more complicated. In GDP terms the UK seems
to have gained marginally since 1979. In terms of employment though the losses have
been significant but the evidence suggests that the rate at which employment losses
are accumulating may have stabilized. Both NZ and the UK share this common

experience of early employment losses but no subsequent clawing back of
employment losses. The UK however has at least gained very large real wage
increases.
In terms of output per capita and employment growth what went wrong in these
two countries? Why was the promise of a faster rate of GDP per capita not fully
realised? Why were all outcomes so poor in New Zealand? These questions are
difficult to answer. I offer the following observations.
First, in both New Zealand and the UK inflation control was a dominant concern
in the early reform period rather than labour market reform. Perhaps, therefore, a
considerable amount of the failure to increase the growth rate is related to the role of
monetary policy and the costs of reducing inflation. If this is a large part of the reason
for the poor performance then the evidence suggests that the New Zealand monetary
reform was particularly poor. Monetary policy has been too tight throughout the
whole period and the costs of establishing credibility of monetary policy far higher
than the authorities would have imagined.
Second, perhaps despite all the rhetoric and promises, labour market and
economic reforms exert a very small influence on economic growth in a high income
country where the degree of regulation is not that restrictive and product and factor
markets are well developed. Growth rates respond more to other more basic factors
such as technical change and saving rates.
Third, despite the clear evidence of the macro data presented here there is by no
means a unanimous view on reform outcomes for New Zealand (Bates and Snape,
1998). Some authors are more optimistic. They tend to focus on other variables,
believe that the reforms will take longer to pay off and emphasise that accepting
macro outcomes from Australia, the UK and the US as implicit counterfactuals is
misleading. It is argued, with some validity, that the need for reform in New Zealand
was so great that any reforms must have a high short run cost. The disjuncture
between the old New Zealand economy and that needed for a modern high income
country was too great for the adjustment to be smooth and relatively costless. The
major mistake was to believe that the change in the New Zealand economy could be
made without paying a high price.

References
Basu S., J Fernald and M Kimball (1998) Are Technology ImprovementsContractionary? International Finance Discussion Papers 625, Board of Governorsof the Federal Reserve System.
Bates, W. and Snape, R. (1998) Discussants, ‘Microeconomic Reform: The NewZealand Experience’, in Micro Economic Reform and Productivity Growth,Workshop Proceedings, Productivity Commission and Australian NationalUniversity, Canberra. 182-191.
Conway, P. and B Hunt (1998) Productivity Growth in New Zealand: EconomicReform and the Convergence Hypothesis, Reserve Bank of New Zealand, June1998
Easton, B. (1998) Microeconomic Reform: The New Zealand Experience, in MicroEconomic Reform and Productivity Growth, Workshop Proceedings, ProductivityCommission and Australian National University, AusInfo, Canberra. 155-182.
Evans, L., Grimes, A., Wilkinson, B., Teece, D. (1996), Economic Reform in NewZealand 1984-95: The Pursuit of Efficiency, Journal of Economic Literature,December 1996, XXXIV(4), 1856-1902.
Maddison, A.(1989) The World Economy in the 20th Centur, OECD, Paris.
Productivity Commission (1998) Micro Economic Reform and Productivity Growth,Workshop Proceedings, Productivity Commission and Australian NationalUniversity, AusInfo, Canberra.
Silverstone, B., Bollard, A., and R. Lattimore (eds) (1996) A Study of EconomicReform The Case of New Zealand, North Holland.