laboratory ubrarydigital.lib.lehigh.edu/fritz/pdf/205a_32.pdf · laboratory ubrary a dissertation...
TRANSCRIPT
INELASTIC LATERAL-TORSIONAL BUCKLING
OF BEAM-COLUMNS
by
Yuhshi Fukumoto
FRITZ ENGINEERINGLABORATORY UBRARY
A DISSERTATION
Presented to the Graduate Faculty
of Lehigh University
in Candidacy for the Degree of
Doctor of Philosophy
Lehigh University
1963
'.,
,.'
"')',.....
Approved and recommended for acceptance as a dissertation in
partial fulfillment of the requirement for the degree of Doctor of
Philosophy.
(Date) Theodore V. GalambosProfessor in Charge
Accepted , .,.--_-:- _(Date)
Special committee directing the doctoralwork of Mr. Yuhshi Fukumoto
Professor Roy J. Leonard, Chairman
Professor Chih Co Hsiung
Professor George Co M. Sih
Professor William J. Eney
Professor Theodore Vo Galambos
i
A C K NOW LED GEM E N T
The author is deeply indebted to Dr. Theodore V. Galambos,
professor in charge of this dissertation, for his encouragement, ad
vice, and helpful suggestions during the preparation of this report.
The guidance of Professors Roy J. Leonard, Chih C. Hsiung, George C.M.
Sih,and William J. Eney, chairman and members of the Special Committee
directing the author's doctoral work, is gratefully acknowledged.
The work described in this dissertation is part of a project
on "Welded Continuous Frames and Their Components" being carried out
under the general direction of Dr. Lynn S. Beedle. The project is
sponsored jointly by the Welding Research Council and the U. S. Navy
Department under an agreement with the Institute of Research of Lehigh
University. Funds are supplied by the American Institute of Steel Con
struction, Office of Naval Research, Bureau of Ships, and the Bureau of
Yards and Docks. The Column Research Council of the Engineering Founda
tion acts in an advisory capacity. The work was done at Fritz Engineer
ing Laboratory, of which Professor Lynn S. Beedle is Director. Profes
sor William J. Eney is Head of the Department of Civil Engineering and
Fritz Engineering Laboratory.
The author expresses his thanks to the Bethlehem Steel Company
for permission to use their IBM 7074 Digital Computer for part of the
computations. The help of Mr. Marshall Warner of IBM in Bethlehem in
programming and using the computer is sincerely appreciated.
ii
He also wishes to acknowledge all his associates in Fritz Lab
oratory for contributing fruitful discussions throughout this investi
gation o
The manuscript was typed with great care by Miss Grace E. Mann.
Her cooperation is appreciated.
I.
TAB L E
ABSTRACT
INTRODUCTION
o F CON TEN T S
iii
Page
1
2
II.
III.
BASIC EQUATIONS OF LATERAL-TORSIONAL BUCKLING
II.l Definition of the Problems
II.2 Assumptions
II.3 Derivations of the Basic DifferentialEquations
II.4 Basic Equations for Specified LoadingConditions
II.4.1 Equal End Moments withAxial Thrust
II.4.2 One End Moment with AxialThrust
DETERMINATION OF THE CROSS-SECTIONAL PROPERTIES
III.l Basic Concepts
III.2 Material and Cross-Sectional Properties
III.3 Moment-Curvature-Thrust Relationships
III.4 Variation of Stiffness Parameters DuringPartial Yielding
5
5
7
9
16
16
.18
20
20
22
24
27
III.4.1
III.4.2
III.4.3
III.4.4
Definition of StiffnessParameters
Weak Axis Bending Stiffness, By
Torsional Stiffness, ~
Warping Torsional Stiffness, Cw
27
29
30
32
III.5 Determination of the Shear CenterDistance, y 34
III.6 Determinati~n of the Coefficient, J~S2dA 35
iv
Page
111.7 Graphical Representation of the Latera1-Torsional Stiffness Coefficients 38
111.8 Column Deflection Curves 40
111.9 Computational Procedure 42
IV. LATERAL-TORSIONAL BUCKLING STRENGTH
IV.1 Beams with Equal End Moments (j = 1)
IV.1.1 Elastic Buckling with ResidualStresses
IV.1.2 Inelastic Buckling
IV.2 Beams with One End Moment (J= 0)
IV.2.1 Elastic Buckling with ResidualStresses
IV.2.2 Inelastic Buckling
IV.3 Beam-Columns with Equal End Moments
IV.3.1 Elastic Buckling with ResidualStresses
IV.3.2 Inelastic Buckling
IV.4 Beam-Columns with One End Moment
45
46
46
48
50
50
51
51
51
54
60
IV.4.1 Elastic Buckling with ResidualStresses 60
IV.4.2 Inelastic Buckling 62
V.,
INTERACTION CURVES FOR THE BEAM-COLUMN STRENGTH
V.1 Interaction Curves for Lateral-TorsionalBuckling Strength of the 8WF31 Section
V.2 Simplification for the Calculation of theLateral-Torsional Buckling Strength withEqual End Moments
V.3 Influence of the End Moment Ratio
V.3.lElastic Lateral-TorsionalBuckling
67
68
69
71
72
V.3.2 Inelastic Lateral-TorsionalBuckling 72
V.4 Comparison with an Interaction Equation 76
v
Page
VI. COMPARISON WITH TEST RESULTS 80
VI.1 University of Liege Tests 81
VI.2 Recent Lehigh Tests 82
VII. SUMMARY AND CONCLUSIONS 84
VIII. NOMENCLATURE 87
IX. REFERENCES 92
X. TABLES AND FIGURES 96
XI. VITA 144
A B S T RAe T
This dissertation presents the theoretical analysis of the
inelastic lateral-torsional buckling strength of steel wide-flange
beam-columns. Emphasis is placed on the case when the beam-columns
are subjected to an axial thrust. and to unequal end bending moments.
The solutions are obtained on the basis of a finite differ
ence approximation of the differential equations with variable co
efficients, the resulting characteristic determinant being solved
numerically by a digital computer.
A residual stress reduction in the elastic lateral-torsional
buckling strength is found to be negligible for practical purposes,
however, a large reduction in the inelastic buckling results as a
presence of residual stresses.
General relationships of the inelastic lateral-torsional buck
ling strength for different end bending moment ratios are presented.
The comparisons are made between the theoretical results and
the experimental results. It is shown that good correlation exists
between them.
-1-
I. IN T ROD U C T ION
When structures are designed or analyzed by plastic design
methods, each member must undergo considerable inelastic deformation
in order for the whole frame to develop its full strength at failure as
a kinematic mechanism.
These inelastic deformations of the members may cause.pre
mature failure by various types of instability. Such types of fail
ure can be:
(1) Failure by excessive bending in the plane of the
applied end moments.
(2) Failure initiated by lateral-torsional buckling.
(3) Failure by local buckling.
Failure which is initiated by lateral-torsional buckling is
one important type of instability especially when the beam-columns
are not braced laterally along the length of the members. This type
of insta:bility generally will occur for wide-flange sections, inW'hich
the moment .of inertia in the strong direction is much larger than in
the weak direction.
At a certain critical end moment, which is applied about the
strong axis, these beam-columns, having heretofore deflected in the
-2-
-3
plane of load, will start to deflect laterally out of the plane of
bending. This is accompanied by twisting of the member. This type
of instability is known as lateral-torsional buckling. After the
initiation of the lateral-torsional buckling the beam-column is in
the post-buckling range and the member is in general still able to
carry an increased load until unloading has taken place. However,
this load is only slightly above the load causing the initiation of
the lateral-torsional buckling, and therefore this latter load is
used in defining the buckling strength of the beam-columns.
Elastic lateral-torsional buckling of the beam-columns has been
investigated thoroughly for various cross sectional profiles and for
different loading and boundary conditions by many investigators. Refer
ence is made to Refs. (1), (2), and (3)* for the general introduction
to the elastic lateral-torsional buckling problem. These references
also contain an extensive listing of references and a historical treat
mentof the development of the theory.
For the inelastic lateral-torsional buckling, that is, buckling
occurring after parts of the member have already commenced to yield, a
variation of the stiffnesses of the member due to the partial yielding
of the cross section must be considered. The problem has been solved
for equal end moments with an axial thrust(4) and the results showed
*The numbers in parentheses refer to the list of references (Chapter IX).
-4
very good agreement with existing experimental results.* However,
no comprehensive theoretical solution is yet available for other
loading cbnditions in which a more complicated analytical procedure
is required.
The objectives of this dissertation can be summarized as
fbllows:
To investigate the inelastic lateral-torsional buck-
ling strength of the beam-column which is subjected to an
axial thrust and unequal end moments, and to discuss the
relationships of the buckling strength between different
loading conditions.
*General introduction tb inelastic lateral buckling (nb axial thrustexists) is made in Refs. (3), (4), (5) and (6). These referencesalso include a thorough listing of the pertinent literature.
II. BAS IC E QUA T ION S o F
LA T.E R A L TOR S ION A L BUCKLING
11.1 DEFINITION OF THE PROBLEMS
The phenomenon of lateral-torsional buckling can be explained
with the aid of the. example of a beam-column under one end moment Mo
with axial thrust P as shown in Fig. 11.1. In this figure the
schematic relationship between the applied end moment M and the reo
suIting end slope Q is shown for a singly symmetric member bent about
its strong (x-x) axis. The length as well as the axial thrust P is
assumed to remain constant as the moment M is increased from zero too
its maximum value and past the maximum moment into the unloading zone.
Failure, that is unloading of the moment, may be generally
initiated by lateral-torsional buckling of the member and by local
buckling of the compressive plate elements of the cross section if no
lateral bracing is provided along the length of the beam-column. Their
occurrence maybe postponed by appropriate lateral bracing until the
required moment and rotation capacity are reached.*
In Fig. 11.1 two branch curves are shown: (1) The upper branch
curve shows the Mo -Q relationships for the member which is completely
*The lateral bracing requirements of the beams in the plastic design ofsteel structures have been the subject of another research project atLehigh University. (5) ,(7)., (6), (8), (9)
-5-
~6
prevented from lateral movement. Failure will be due to excessive
bending in the plane of the applied moment~lO),(ll) The correspond-
ing maximum moment is M.2 'o max.
(2) The lower branch curve is for
the member for which no lateral bracing is provided. Failure will be
due to lateral-torsional buckling, and the resulting maximum moment
MO
'l will be lower than M 2max. 0 max.The maximum point on this lower
curve is reached after bifurcation of the equilibrium occurs at a mo-
mentequal toMo cr At the attainment of the moment M it iso cr
possible for the member to remain in neutral equilibrium in which the
displacement and twist in the lateral directions are infinitesimal.
These two curves represent the tWd major failure types of the beam-
column.
Failure due to local buckling may be postponed until the.ma-
teria1,reaches strain-hardening by prdper proportioning df the width-
( 12) (13)thickness r.gtios of each of the plate elements ,. and this occurs
after the unloadingst.grtsfor the common wide-flange beam_columns~l4)
The tWdmaJor 'failure types can a1sd be explained by end mo-
ment-versus - slenderness ratio curves for a specified constant axial
thrust as shown in Fig. 11.2. In this figure curve D represents the
failure due to excessive bending and each point .. on curve D corresponds
to Mo2 with a certain slenderness ratio in Fig. ILL Pdint (1)max.
is the plastic hinge ,moment modified by the axi.gl thrust. Curve 3-4
is elastic lateral-torsional buckling curve and point (4) corresponds
to the slenderness ratio df the Euler buckling load in the weak
-7
direction. In the inelastic .range three curves 1-3 are shown: The
lower curve Ais obtained on the basis of the tangent modulus concept
which gives the lower bound values for the failure initiated by in-
elastic lateral-torsional buckling. This curve gives the critical
moment M at which the equilibrium bifurcates. The upper curveo cr
B represents the upper bound values or the reduced modulus buckling
load.* Curve C in Fig. 11.2 is the maximum strength curve and it
corresponds to M 1 with different slenderness ratios as showno max.
in Fig. 11.1. Determination of curve C is an involved step-by-step
calculation based on the biaxial bending theory in the inelastic
range, and present knowledge does not as yet yield a solution to
this problem for the complex loading case considered here o
This dissertation is concerned with the determination of Mo cr
causing the inception of lateral-torsional buckling (curve A in Fig.
11 0 2) after portions of the member have already yielded.
II 02 ASSUMPrIONS
The differential equations of lateral-torsional buckling de-
rived herein are based on the following specified conditions and
assumptions:
*These concepts are well developed for axially loaded column bucklingin the inelastic range.(15),(lo)
-8
A) Specified Conditions:
(1) No transverse loads are applied between the supports.
(2) The bending moments M.are applied at the ends of the
member, such that they cauSe bending about the major
axis of the cross section.
(3) The members are as-rolled steel wide-flange shapes which
are initially free of crookedness and for which the cross
sectional dimensions do not vary with the length.
(4) The ends of the member are simply supported with respect
to lateral-torsional buckling. The boundary conditions
are therefore
u .= utI =·0 ~ = ~"= 0 at Z,- 0 andz= L (11.1)
where u is the lateral disp1acement:of the.shear center,
~is the twisting angle of the cross .section about the
shear center,.. and z is the distance along the length of
the. member.
B) Assumptions:
(1) The axial thrust P acts along the originalcentroidal axis
of the member even after a portion of the member has yield
ed. It retains this direction after 'buckling has taken
place.
-9
(2) The stress-strain diagram of the member is ideally elastic-
plastic, that is, it consists of an elastic portion, and a
flat plastic portion after the yield stress ~is reachedy
(Fig. II. 3) •
(3) The cross section retains its original shape during the
buckling process, that is, any distortion of the cross
section will not be allowed.
(4) Cooling residual stresses are present along the member.
The residual stress distributions are symmetric on any
cross section and the yield pattern is at least symmetric
about the y-y axis.
(5) The displacements are small in comparison to the cross sec-
tional dimensions of the member.
11.3 DERIVATION OFTRE BASIC ,DIFFERENTIAL EQUATIONS
In the following derivation,.. equilibrium equations will be for-
mulated for a deformed member with a symmetrical cross section about
the y axis under an axial thrust.P with eccentricities e atz =0yB
and eyT atz = L (Fig. 11.4).
Buckling of the member is taken to occur by twisting and bend-
ingdeformations. The buckled form is specified by the components of
displacements u, v.of the.shear center S of the cross section, and a
torSional rotation '~ about the shear center.
-10
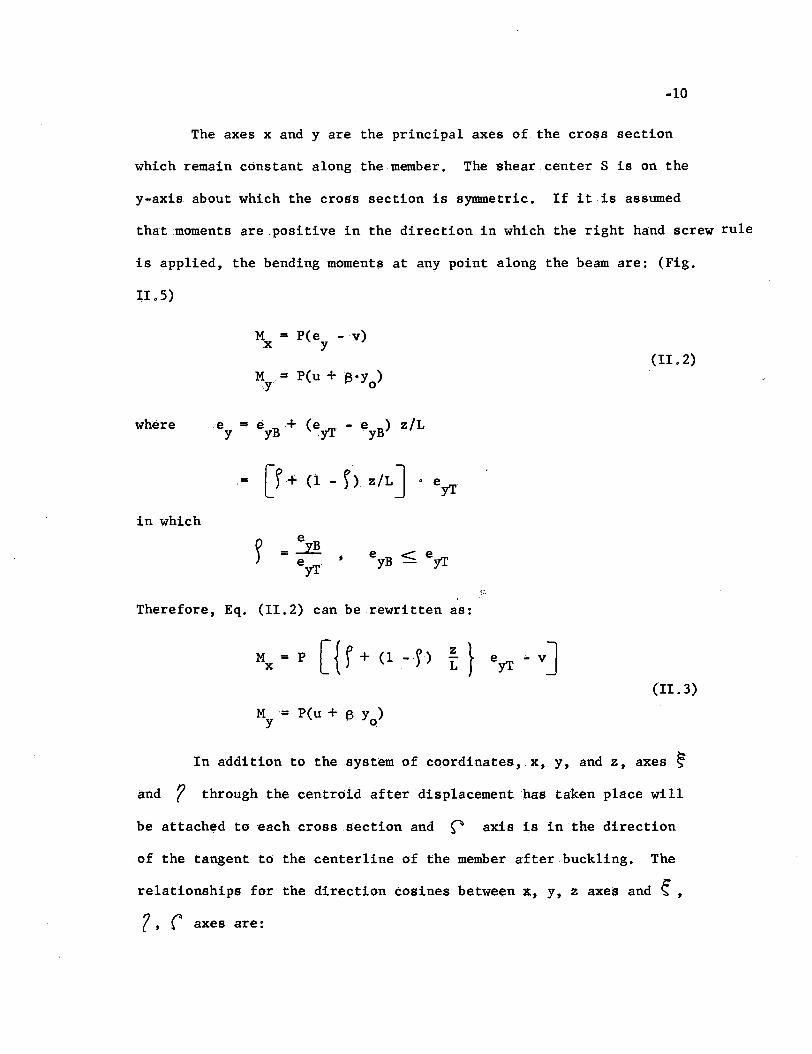
The axes x and yare the principal axes of the cross section
which remain constant along the member. The shear center S is on the
y-axis about which the cross section is symmetric. If it is assumed
that moments are positive in the direction in which the right hand screw rule
is applied, the bending moments at any point along the beam are: (Fig.
II 05)
M = Pee -v).x y
(II. 2)M= P(u + ~.y )
y 0
where
= [r + (1 - f) Z/LJ . eyT
in which
.,
Theref~re, Eq. (11.2) can be rewritten as:
(II.3)
In addition to the system ~f co~rdinates,.x, y, and z, axes ~
and ( through thecentr~id after displacement has taken place will
be attached to each cross section and ~ axis is in the direction
~f the tangent t~ the centerline of the member after buckling. The
relationships for the direction cosines between x,. y, z axes and ~ ,
?, r axes are:
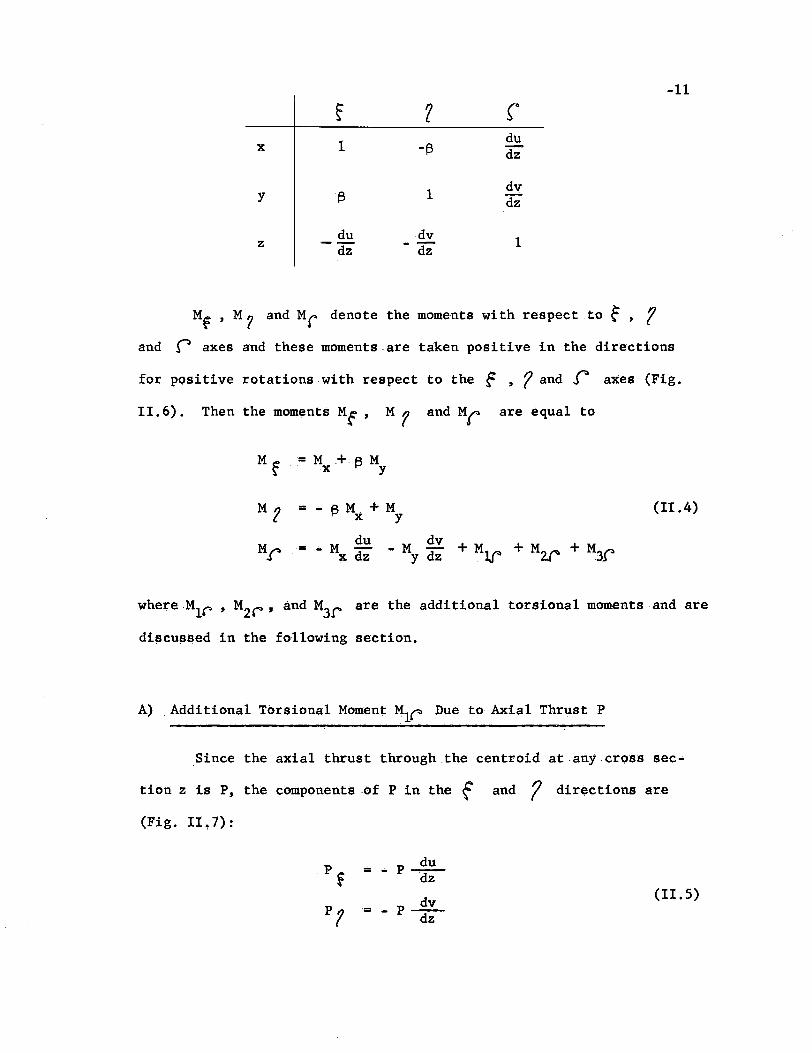
-11
f ? r1 du
x -t3 dz
1dv
Y t3 dz
du dv 1z - dz --dz
M~ , M 'I and Mr denote the moments with respect to ~ , ?and ~ axes and these moments-are taken positive in the directions
for positiye rotations with respect to the f , '1 and .r axes (Fig.
11.6). Then the moments Mf' M 1 and Mr are equal to
Ml: =M + t3 M\x Y
M 2 = 13 Mx + My
M~= M 2!. .. M dv + M + M + M.J X dz y dz Jr . ~ 3.('
(II .4)
whereMl~ , M2C", and M
3f' are the additional torsional moments and are
di~cu~8edin the following section.
A) ,Additional Torsional Moment Ml~ Due to Axial Thrust P
Since the axial thrust through the centroid at any cross sec
ticin z is P, the components of P in the f and ? directions are
(Fig. II ~ 7) :
Pf
= - P ..22....-dz
P ...2.!....(11.5)
P? '= - dz
-12
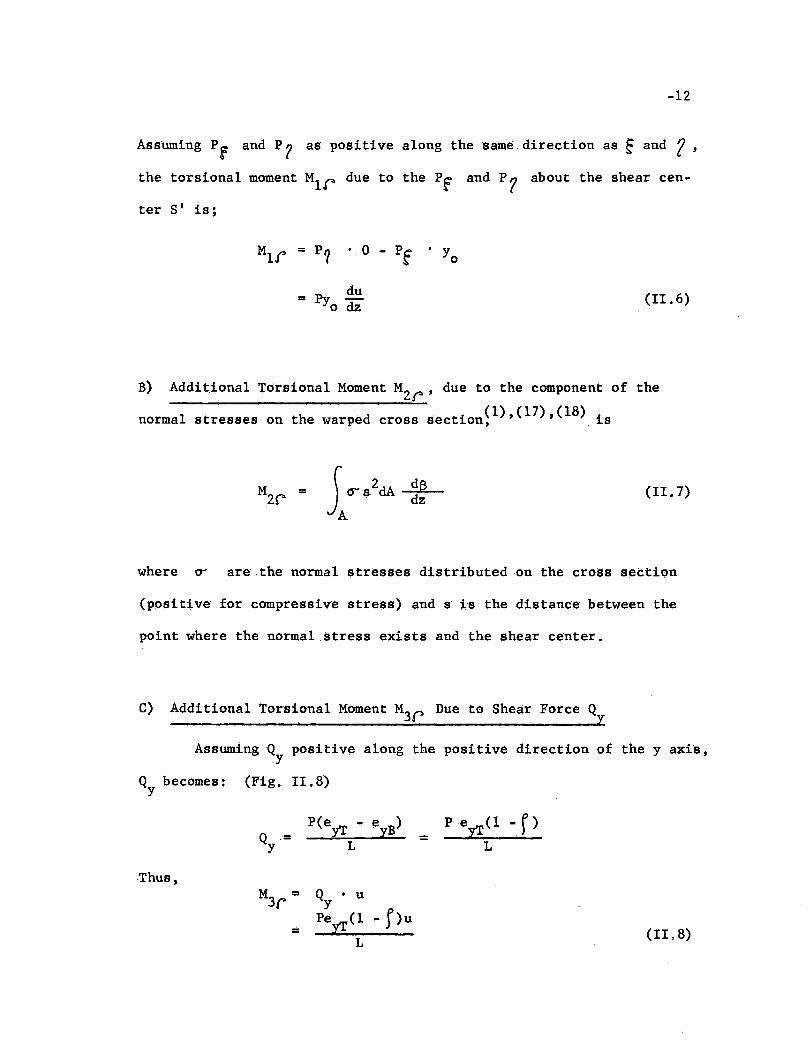
Assuming Pf and P? as positive along the same .direction as E and ( ,
the torsional moment M1r due to the Pf and P 7 about .the shear cen
ter S' is;
• yo
= Py duodz
(II.6)
B) Additional Torsional MomentM2~' due to the component of the
normal stresses on the warped cross section~1),(17h(18)is
(II.7)
where cr are the normal stresses distributed on the croSs section
(positive for compressive stress) and s is the distancE!' between the
point where the normal stress exists and the shear center.
C) Additional Torsional Moment M3f> Due to Shear Force Qy
AssumingQ positive along the positive direction of the y axis,y
Qy
becomes: (Fig. II. 8)
Thus,
P(eyT - e B)- Y
L
Q • uy
pey!(l - f)uL
=peyT(l - f)
L
(II, 8)
(11.10)
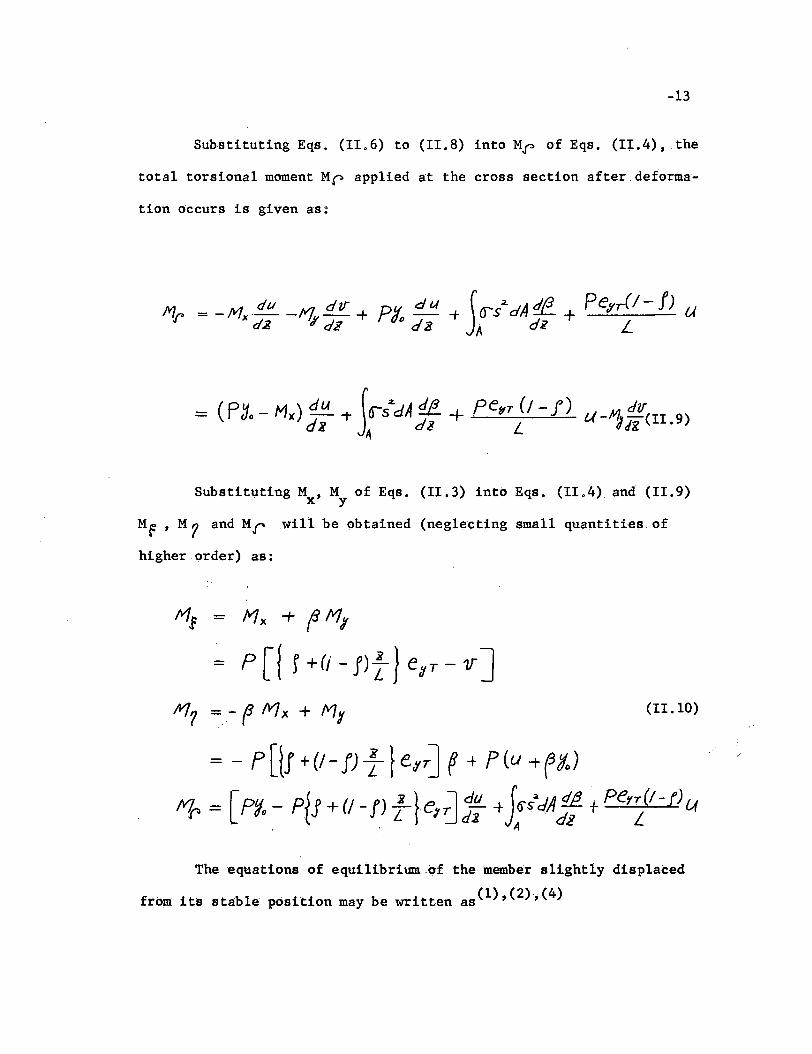
-13
Substituting Eqs. (II.6) to (II.8) into Mr of Eqs. (II.4),the
total torsional moment M~ applied at the cross section after deforma-
tion occurs is given as~
Substituting M ,M of Eqs. (II.3) into Eqs. (II.4) and (II.9)x y
Mr ' M7 and Mr .will be obtained (neglecting small quantities of
higher order) as:
M: - M x + f 111
- P [{ f +0 - f)~ } edT - 1T]
fV17 ~,,- (3 fVJ x + M¥
= - pDs +(1- fJ 1}eJ'T] ~ + P(u +~~)
f1. = [ P'fo - pis + (J - fJ I le,a:: +jrJt<lA51 t perrI-f) U. . A
The 'equations ofequilibriumo-f the member slightly displaced
from its stable position may be written as (1), (2), (4)
-14
cr"- ~ di~
= YlrT + fYlrw = CT 1- -elY;;~
(11.11)
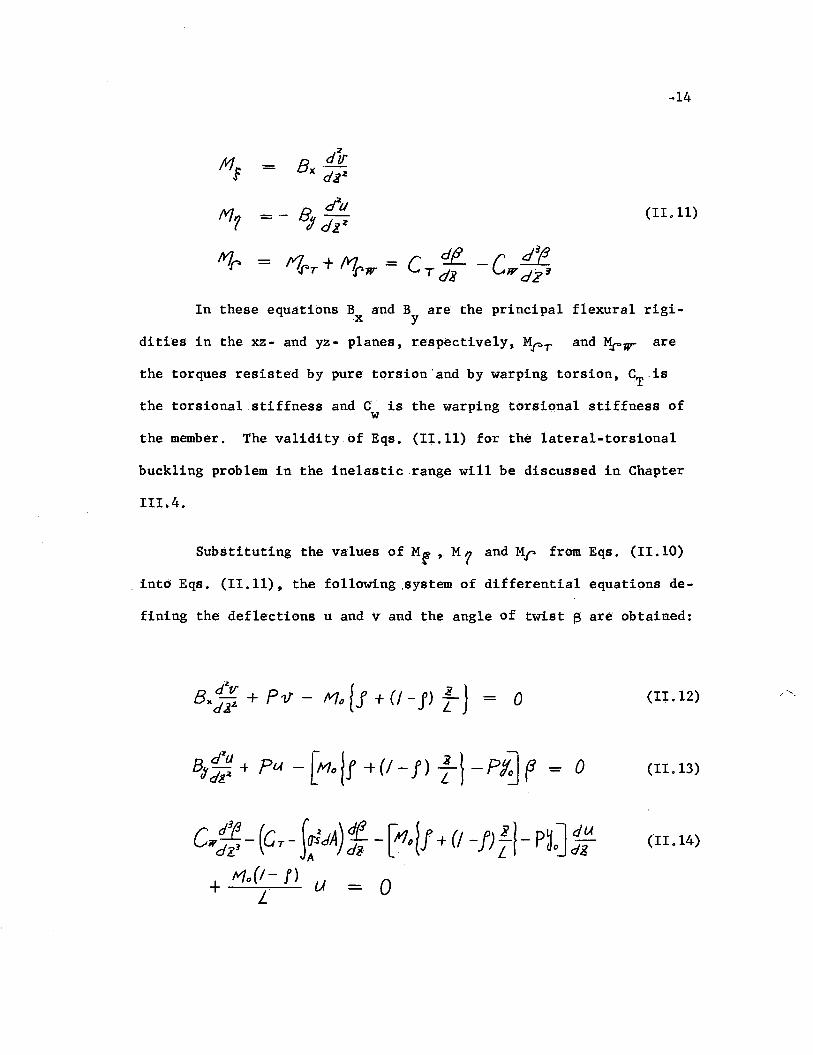
In these equations Band B are the principal flexural rigi-x y
dities in the xz- and yz- planes, respectively, M'p, and ~w- are
the torques resisted by pure torsion 'and by warping torsion, CTis
the torsional stiffness and C is the warping torsional stiffness ofw
the member. The validity of Eqs. (11.11) for the lateral-torsional
buckling problem in the inelastic .range will be discussed in Chapter
II1. 4.
Substituting the values of H~ , M7 and Mr from Eqs. (11.10)
. into Eqs. (11.11), the following .system of differential equations de-
fining the deflections u and v and the angle of twist $ are obtained:
o (II.12)
(II.B)
(11.14)
~15
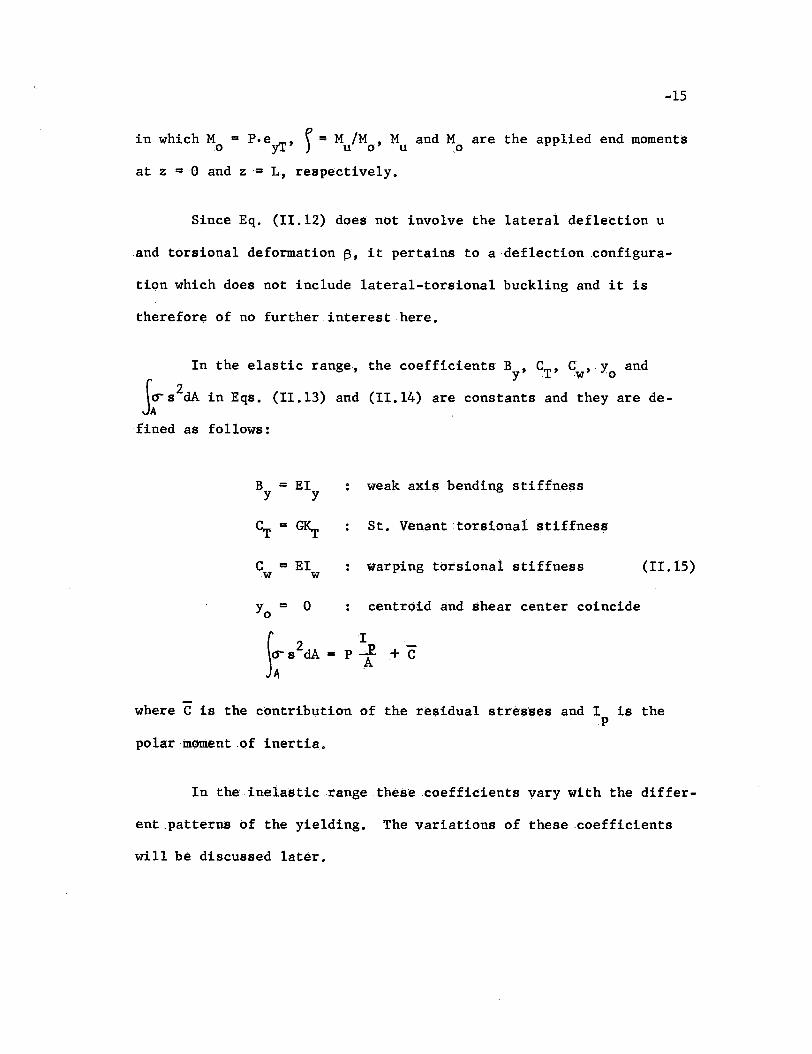
in which M. = P.eyT' e= M 1M ,M and M are the applied end momentso ) u a U 0
at z =0 and z= L, respectively.
Since Eq. (II.12) does not involve the lateral deflection u
and torsional deformation ~, it pertains to a-def1ectionconfigura~
tion which does not include lateral-torsional buckling and it is
therefore of no further interest here.
In the elastic range, the coefficients B , C.T ,. C ,y andywo
J~S2dA in Eqs. (11.13) and (11.14) are constants and they are de~
fined as follows:
B .= EI weak axis bending stiffnessy y
CT = GK.r St. Venant -torsional stiffnes~
C = EI warping torsional stiffness (11.15)w w
Yo = 0 centroid and shear center coincide
where C is the contribution of the residual stresses and I is thep
polar mOment of inertia.
In the inelastic .-range these -coefficients vary with the differ-
ent_patterns of the yielding. The variations of these coefficients
will be discussed later.
-16
II.4 BASIC EQUATIONS FOR SPECIFIED LOADING CONDITIONS
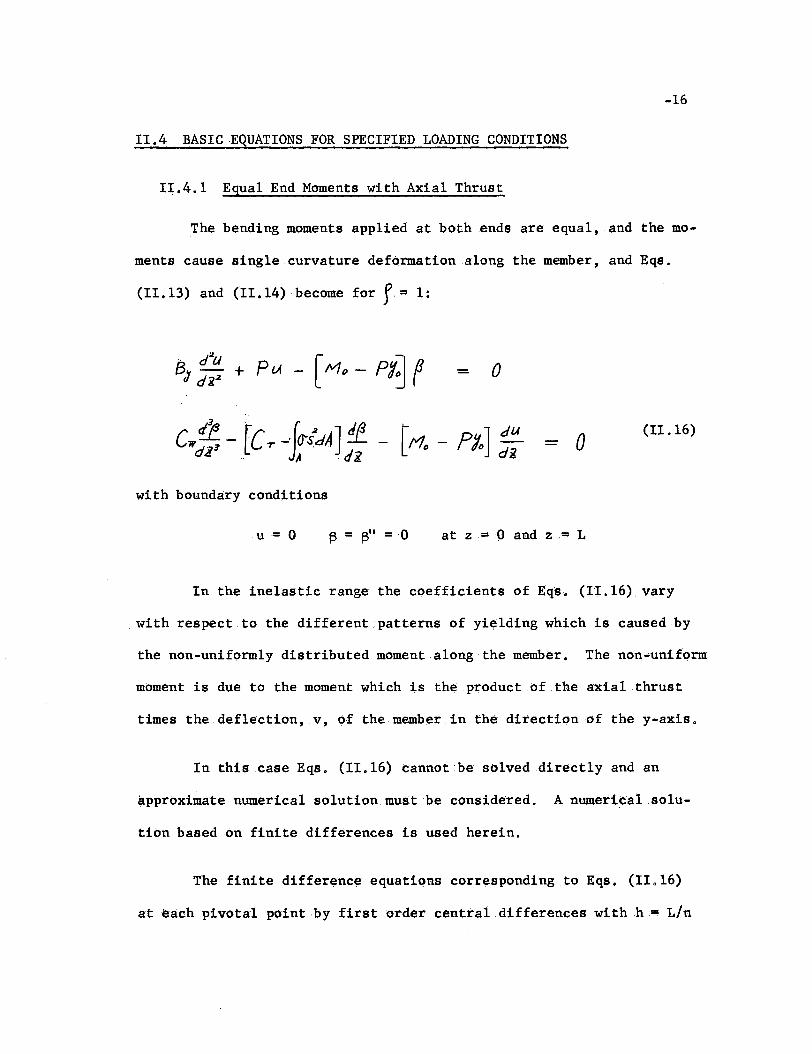
11.4.1 Equal End Moments with Axial Thrust
The bending m()ments applied at both ends are equal, .and the mo-
ments cause single.curvature deformation along the member, and Eqs.
(11.13) and (11.14) become for f = 1:
o
with boundary conditions
o (11.16)
u= 0 t3 = t3" =0 at z=O and z= L
In the inelastic range the coefficients of :egs. (II.16) vary
. with respect to the different_patterns of yi~lding which is caused by
the non-uniformly distributed moment along the member. The non~uniform
moment is due to the moment which is the product of the axial thrust
times the.deflection,.v, of the member in the direction of the y-axis.
In this case Eqs. (11.16) cannot be solved directly and an
approximate numerical solutionmustbeconside'red. A numericalsolu-
tion based on finite differences is used herein.
The finite difference equations corresponding to Eqs. (11 0 16)
at each pivotal point by first order central differences withh:= LIn
-17
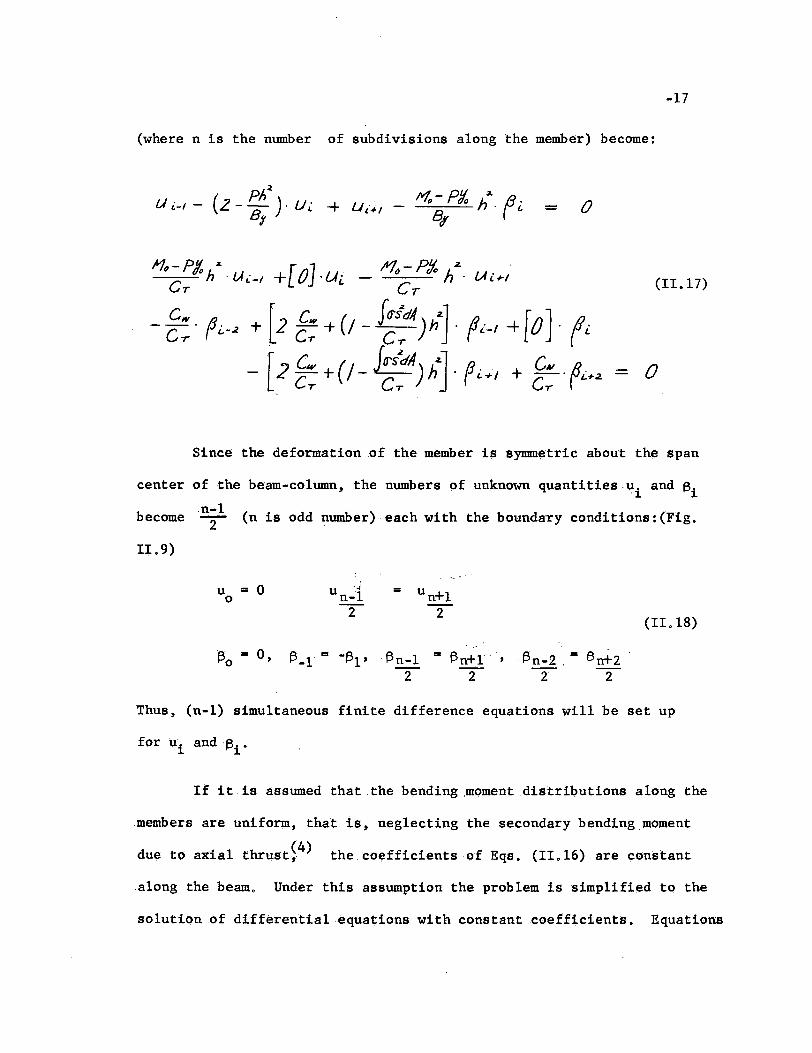
(where n is the number of subdivisions along the member) become:
Ph:1.U i-I - (2 - B, ). U i. +
Cw__ 0
C.,..
U·., - /Vfo - PX h2o. 13 it+/ B (
~
o
(I1.l7)
o
Since the deformation of the member is synnn¢tric about t~ span
center of the beam-column, the numbers of unknown quantities.ui and ~i
becomen;l (n is odd number) each with the boundary conditions:(Fig.
II.9)
u =0o
Q' = 0,fJo
=
~n-l
2= ~n+l
2.~n-2 , = ~n+2
2' 2
(II. 18)
Thus, (n-l) simultaneous finite difference equations will be setup
for tii and~i.
If it is assumed that the bending ,moment distributions along the
.members are uniform, that is, neglecting the secondary bending moment
due to axial thrust~4) the coefficients-of Eqs. (II.16) are constant
along the beam. Under this assumption the problem is simplified to the
solution of differential equations with constant coefficients • Equations
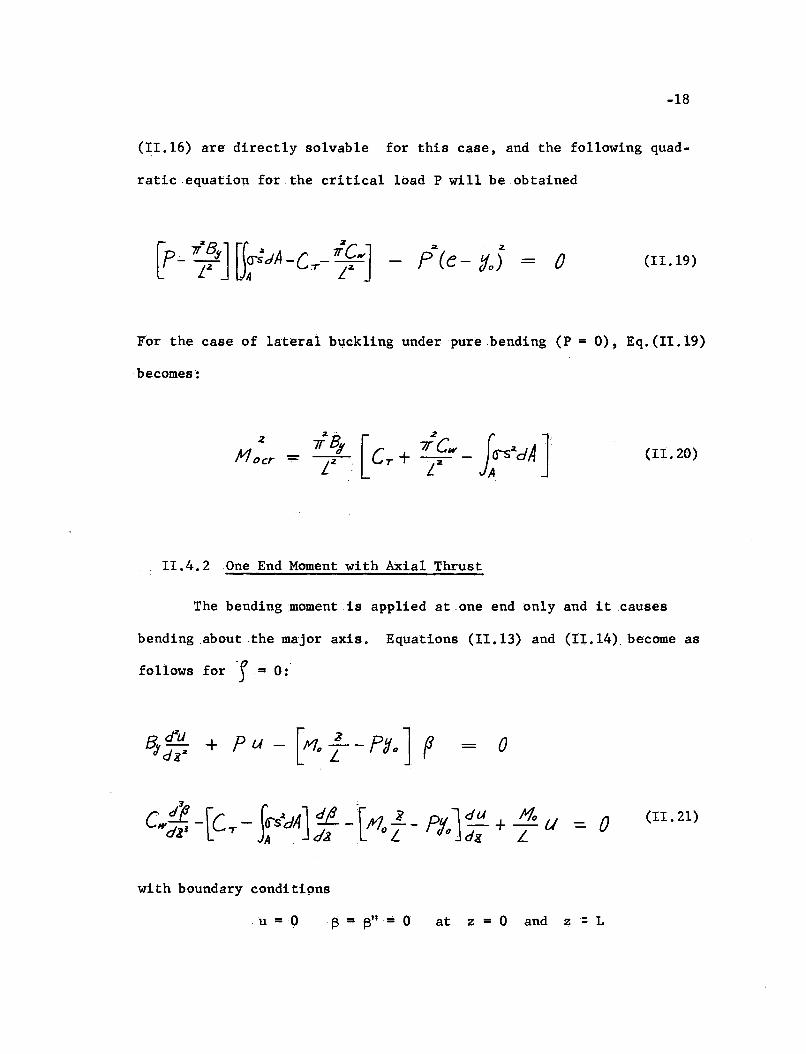
-18
(I1.l6) are directly solvable for this case, and the following quad-
raticequation for the critical load P will be obtained
o (11.19)
For the case of lateral buckling under pure bending (P =0), Eq.(II.19)
·becomes:
2
Mocr (II. 20)
11.4.2 One End Moment with Axial Thrust
The bending moment is applied atone end only and it .causes
bending .aboutthe major axis. Equations (I1.13) and (tI.14) become as
follows forJ= 0:
o
o (II.2l)
with boundary conditions
.1.1= ~ ·13 = 13" == 0 at z = 0 and z:·L
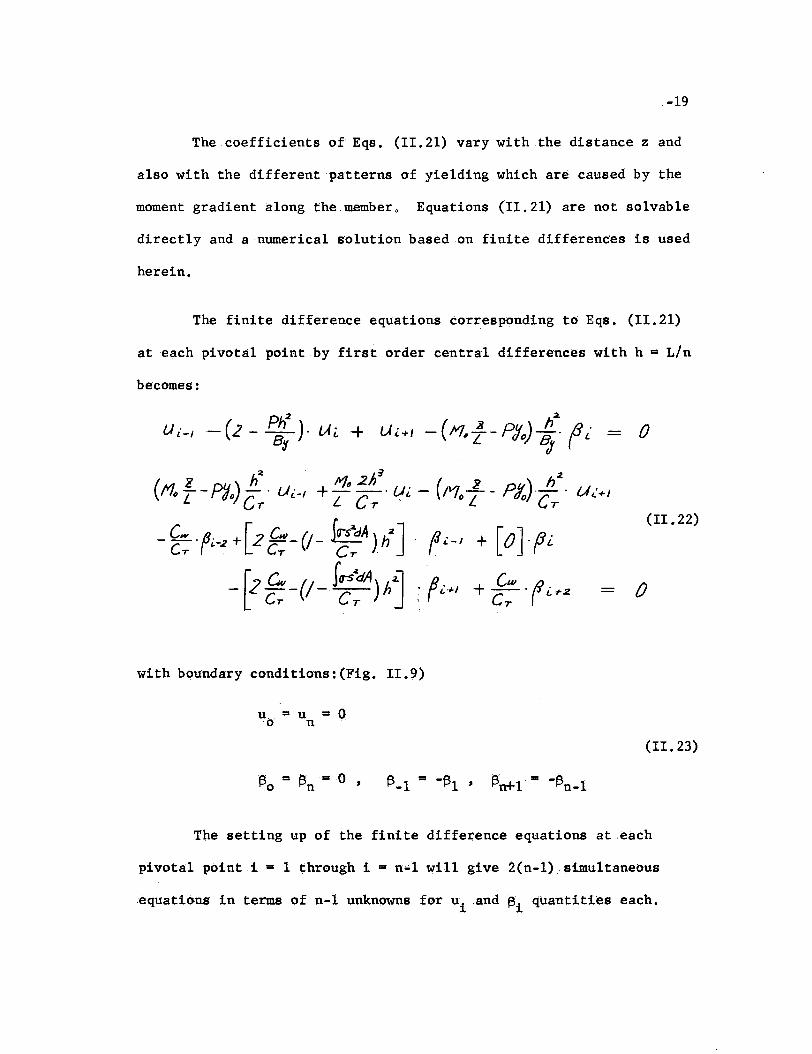
-19
The coefficients of Eqs. (11.21) vary with the distance z and
also with the different patterns of yielding which are caused by the
moment gradient along the member. Equations (11.21) are not solvable
directly and a numerical solution based on finite differences is used
herein.
The finite difference equations corresponding to Eqs. (11.21)
at each pivotal point by first order central differences with h= Lin
becomes:
o
(II. 22)
o
with boundary conditions: (FIg. II. 9)
U = u = 0() n .
(II. 23)
Q. = 1:1=01-'0 I-'n '
The setting up of the finite difference equations at each
pivotal pointi = 1 through i = n-1 will give 2(n-1) .. simultaneous
equatio.ns in terms of n-l unknowns for uiand ~i quantities each.
III. D E T E RMI NAT I ON o F T HE
C R 0 8 8 - 8 EC T I 0 NA L
111.1 BA8ICCONCEPT8
P RO PER TIE ,8
In the preceding chapter the basic differential equations and
also the corresponding finite difference equations were developed for
the inelastic lateral-torsional buckling of simply supported wide-
flange beam-columns.
The coefficients B , ~, C , Py and SA<1"'S2dA occurring iny ~T w 0
Eqs. (11.12) to (11.14) are constant only as long as the member re-
mains elastic. With yielding these coefficients change their value,
. and since yielding is a function of the bending moment distribution
along the length of the member, these coefficients will nOt be the Same
at every point for which the finite difference equations are written.
The coefficients can be thought of as cross-sectional properties, and
they are fully defined if the distribution of the yield zones at.every
cross section is known.
If for a given beam-column an axial thrust .and end moments are
specified first, the corresponding deflected shapea.nd moment.diagram
can be computed. It is now possible to determine the inelastic regions,
and from this knowledge the coefficients of the finite difference equa-
tions can be .calculated at the diStinct points for which the~e .equations
-20-
-21
are written. There are (n-l) finite difference equations for the beam-
column under equal end moments and 2(n-l) finite difference equations
for only one end moment. The symbol n is the number of subdivisions
along the length of the member, and if the originally chosen combina-
tions of P and M are also the critical combinations for lateral-toro
sional bucklingj then the determinant of the coefficients of the finite
difference equations is equal to zero. This wi 11, of course,. not gen-
eral1y occur at the first trial, and several values of Mo for a constant
value of Pare tried until one correct answer is obtained. The analy-
tical process of the solution of the problem is outlined in the flow
chart of Fig. III. 1. The various steps, which wi11 sub~equentlybe dis-
cussed in more detail, are as follOwS:
(1) Establish the moment-curvature-thrust (M-0-P) relation-
ships about the strong axis for the given wide-flange
cross section and the given material properties for
several different types of yield patterns.
(2) Determine the moment and thrust versus yield pattern rela
tionships (M, P vs. Ci" 'I , 1f/ , Y where (). r-J;J repre-
sent the extent of yielding in the flanges and in the web
as shown in Fig. 111.3.).
relationshipS.
the yield, pattern versus B,. C- t C, Py. andy ~Tw 0
(3) Establish
)ACf' S 2dA
(4) .' By combining the results oflJteps (2) and (3), determine
the relationships between these coefficients and the axial
thrust and the bending moment acting at any yielded cross
section.
(5) Construct the column deflection curves (CDC-s) from the
M..0... p curves obtained instep (1) for beam-columns with
specified given values of P and Mo. The CDC-s give the
deflection and the moment at evenly spaced intervals along
the length of the member.
(6) 'the appropriate coefficients from step (4) are selected
for the CDC from step (5) and the finite differenceequa
tions are set up for a specified value of P and L.
(7) The value of the determinant is tested in this Step. If
it is equal to zero, one point on the desired critical com
bination of axial thrust-end moment-length curve isesta
bUshed, if it is not a new CDC·is chosen and the process
is repeated until a correct answer is obtained for the
specified value of P and L.
III. 2 MATERIAL AND CROSS-SECTIONAL PROPERTIES
In FIg:'. II.3 is shown a typical stress-strain diagram for ideal
elastic-plastic behavior of the material, corresponding to the behavior
of ordinary.structura:l grade steel. Stress and strain are proportional
in the elastic range, .and the stress remains .constant at cr ='a-"yin
the.plastic range until the beginning of the strain hardening range.
)
-23
The follOwing average material constants are used in the basic
numerical calculations.
E.= 30 x 103 ksi
G= 11.5 x 10³ ksi
(T' ,= 33 ksi (ASTM-A7 steel)y
The question of what happens for ·IT ." 33 ksi will also be dealty
with after the basic numerical data have been developed for l1"" = 33 kef.y
In Fig. III.2 is shown an idealized wide-flange cross section
wh~re the variation in the thickness of the flanges and the fillets at
the toe are neglected for the numerical calculations.
Since the buckling.behaviorof structural steel members may be
modified considerably by the presence ·of residualstresses~4),(16) the
presence ()f residual stresses is also included in this work. Residual
stresses in as-rolled steel members are of two basic types:(19)
(1) Those due to differentialcoo"lingo.f the member during
and after the rolling process, and
(2) those due to.cold bending of the specimen while being
.straightened or during fabrication.
An assumedresidualstre~s distribution on the cross section due
to cooling is shown in Fig. III. 2 for the wide-flange section~19) .' Thia
stress distribution is assumed to be uniform along the length of the
member. Across each flange it is assumed that residual stress decrease
linearly from a maximum compressive, o;;c ,.at .the flange edge to a·
-24
tensile residual .stre.ss,.~ , at.theweb junction. Also it is assumedrt
that the tensile stress is constant across the web.
The following relationship is required for the static equili
brium of the cross section: (19)
.where b, t, d, and ware the dimensions of the cross section. Avalue
of a- = 0.3 0- is used in the numerical calculations. This assumedrc y .
residual stress distribution and magnitude ha~ been found to be reason-
a.ble for wide-flange shape's in the as-rolled condition~l9)
III.3 MOMENT-CURVATURE-THRUST RELATIONSHIPS
The determination of the M-~-P relationships is accomplished by
assuming a specific stress distribution, and thus a yielded pattern,
. and then computing .the corresponding value of P, Mand 0 from geometry
M'=
,~=
and equilibrium, that is ,
p.= fa-dA'A
)A I'f' y dA
£,- C:z.d
(rrI.2)
where Eland E2 are strains at the extreme fibers of the cross sec
tion.
-25
As the end moment is increased under a given constant axial
thrust which is present even as M = 0, yielding will first occur ato
the outside tips of the compression flange, and 'as M is increased, ito
will continue to penetrate through this flange. Eventually yielding
occurs on the tension flange and web" and finally the full plastic
condition is developed.
M0 PThe non-dimensiondiZed - - -;r relationships about. theMyVJy Pystrong axis have been determined for the following five different stages
of yielding in wide-flange sections containing residual stresses:
(1) Elastic case (Fig. III.3a)~
(2) Partial yielding in the compression flange, with yielding
progressing from the flange tips towards the center while
the web and the tension flange remain elastic (Fig.III.3b).
(3) Partial yielding in the compression flange, in the tension
zones of the web and in the tensii;>n flange (FIg. III.3c).
(4) Partial yielding in the compressed part of the web, while
the remainder of .the web and the tension flange are elas-
tic and the compression: flange is fully plastic (Fig.III.3d).
(5) Partial yielding in both thecompres~ion and tension zones
of the web, and full plasticity in the compression and
tension flanges (Fig. III.3e).
The five yielded patterns enumerated above do not include allf
the stages of yielding which are encountered in a wide-flange shape which
.contains the residual stresses shown in Fig. 111.2, but they perntit the
construction of the M-0-p curves over the ranges of most imp<;>rtance.
· -26
The resulting equations for M-~-P relationships are quite com-
plicated and cumbersome, and a semi-graphical method has been used pre
viously to determine M-~-P curves for specified cross sections~19),(4)
Since it was desired to utilize a digital computer for the work
described in this report; the equations here were solved analytically.
The formulas are summarized in Table 1. The table contains the follow-
iug items for each different yielding patterns as shown in Fig. III.3:
(1) Given parameters (that is, cross-sectional dimensions,
(4) The moment .equations which correspond to the specified
curvature, thrust and the yield pattern.
The M-~-P relationships can be presented as a family of curves,
with M!M as the ordinate and ~/f/J as the abscissa; each curve is fory y
a constant value of p!p • Such curves for the 8WF31 section are showny
in Fig. 111.4 and numerical ya1ues are tabulated in Table 2. AlsO
shown on the curves in Fig. 111.4 are the zones in which the various
patterns of yielding given in Fig. 111.3 occur. It can be seen that
yield patterns (b) and (c) are the most.preva1ent ones for the M-!6
curve for p/py =0 and yield patterns (b) and (d) are the mostpreva
lent ones if an appreciable axial thrust exists (P!P-y> 0.2).
The analytical procedure of obtaining the M-f/J-P curves in Fig.
lII.4.consisted ·of a direct.solution of the equations by a Royal-McBee
-27
LGP-30 digital computer in the Computing .Laboratory, Lehigh University.
The details df programming .are on file under Project 205A, Fritz Engin-
eeringLaboratory, Lehigh University.
111.4 VARIATIONOl StIFFNESS PARAMETERS DURING PARtIAL YIELDING
111.4.1 Definition of Stiffness parameters
the coefficients By' CT and Cw
representstiffnesses of the mem
ber, that is, weak axis banding stiffness;, st. Venanttorsiona:lstiff-
ness, andwarpirig torsiousl$tiffness, res~ctively.
FoI:' the prC,lblem of 1ateral;o,torSit)nal instability:, ,th¢ m.oments
Mp, Mrr and M('w are not· presentun.til the mem.ber att~ins rteutral
equtlibrium with regard to lateral-tor~iona:lbuck1ing. 'the stiffnesses
By' G.r. and ~ware, therefore" thestiffnesseswhich resist the ineap
Hem. Qf lateral-torslonalbuekHng.whiIe thaapplie.d lQads .remain J con
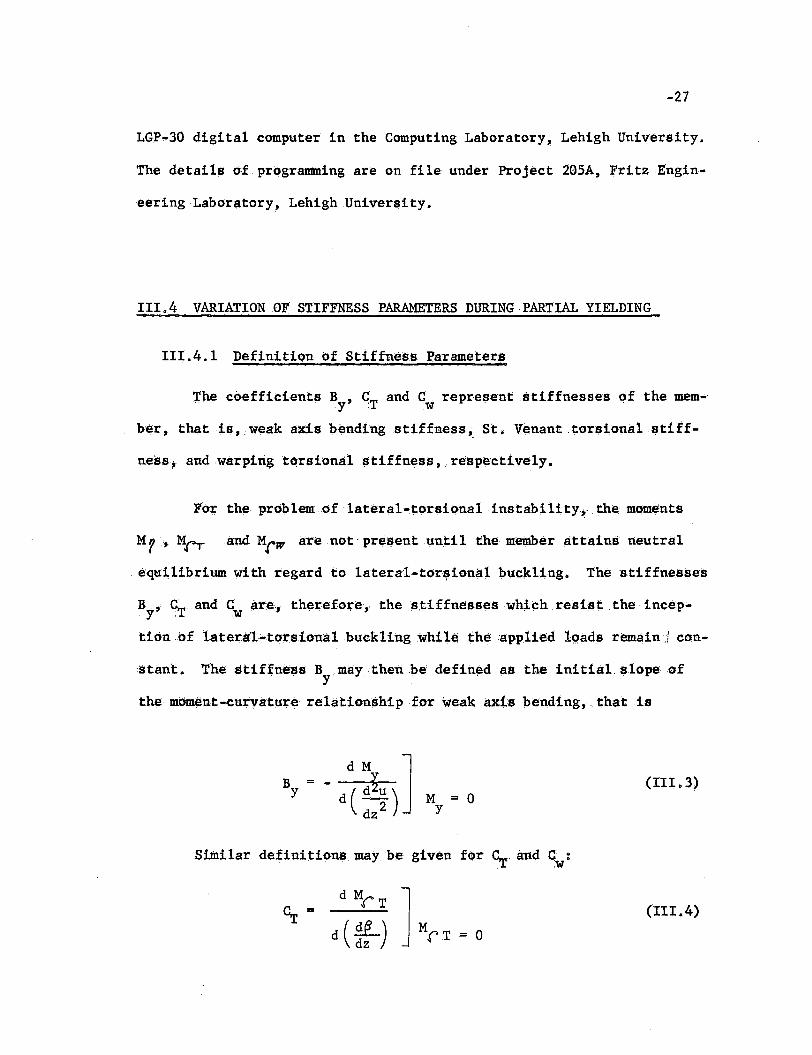
'stant. The stiffness By may then be defined as the initial ~lope of
the moment-eurvature relatiortshipfQr· weak axis bending,., that is
(III. 3)
Similar definitions. maybe given for ~. and C,w:
(III. 4)
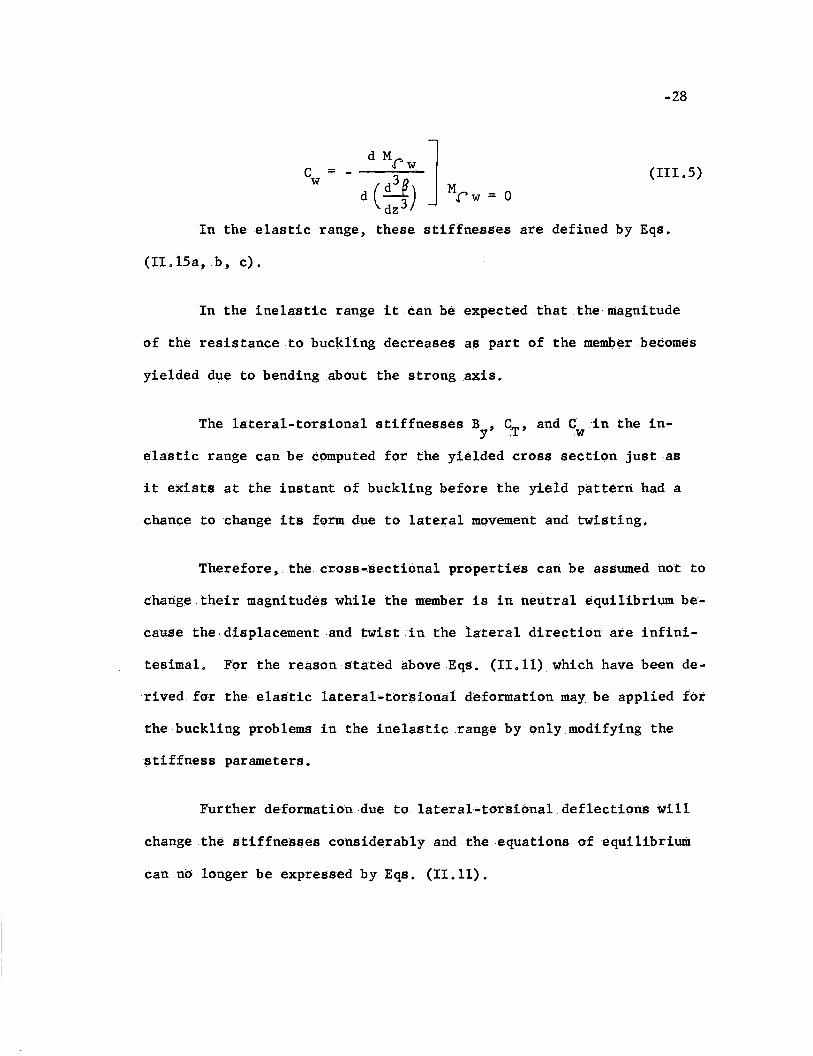
(IlLS)
-28
Ow = - dd(~) lMr w = 0
dz 3
In theelastic range, these stiffnesses are defined by Eqs.
(II •15a, .b, c).
In the inelastic range it can be expected that the magnitude
of the resistance to buckling decreases as part of the member becomes
yielded due to bending about the strong axis.
The lateral-torsional sti£fnesses B , C-, and Cin the in-y ~:T ,w
e'lastic range .can be computed fQr the yielded cross section just as
it exists at the instant of buckling ,before the yield pattern had a
chance to change its form due to lateral movernentand twisting.
Therefore, the cross-sectional properties can be assumed not to
change their magnitudes while the member is in neutral eqUilibrium be-
cause the.displacementand twist in the lateral direction are infini-
tesimal. For the reason stated a.boveEqs. {II. H) lIthichhave been de-
rived for the elastic lateral-torsional deformation maybe applied for
the buckling problems in the inelastic range by only modifying the
stiffness parameters.
FUrther de£ormationdue to lateral-t9rsional deflections will
change the stiffnesses considerably and the equations ofequilibriUUl
canna longer be expressed by Eqs. (11.11).
-29
III.4.2 Weak Axis Bending Stiffness, By
The stiffness B which is defined by Eq. (111,3) as the initialy
slope of the moment-curvature relationship about the weak axis may be
determined by applying an infinitesimal bending moment dMyto the
cross section which has already yielded due t<> the presence of a bend-
ing momerttM about the strong axis and an axial thrustP. The resisx
tance to the infinitesimal moment is a' .measure of the bending stiffness
B at the instant of buckling.y
By applying the infinitesimal bending moment dMy ' the infini
tesimal stresses are superimposed on the already present stresses
caused by M and P: Ort the compressive side due to dM , the yieldx y
zones will be increa~ed a small amount,;while on the tension side some
unloading will take place ·on the already yielded zones. If now the
small increase of the yield ·zones and the unloading of an already
yielded zone are neglected, the momentdMy is resisted only by the part
of the cross section which is elastic~20),(21),(4) This latter assump-
tion is analogous to the tangent modulus concept .of the axially loaded
column theory. Permission ofunloading(22),(23) leads to the reduced
modulus concept.
Thus the bending stiffness Bis the stiffness of the unyieldedy
portion of the.cross section, and this is equal to the modulus of elas-
ticity E, times the moment of inertia of the unyielded elaStic portion
about the y-axiS.
yielding are:
Theequ'ations for B for the most prevalent cases ,of, ,. y
-30
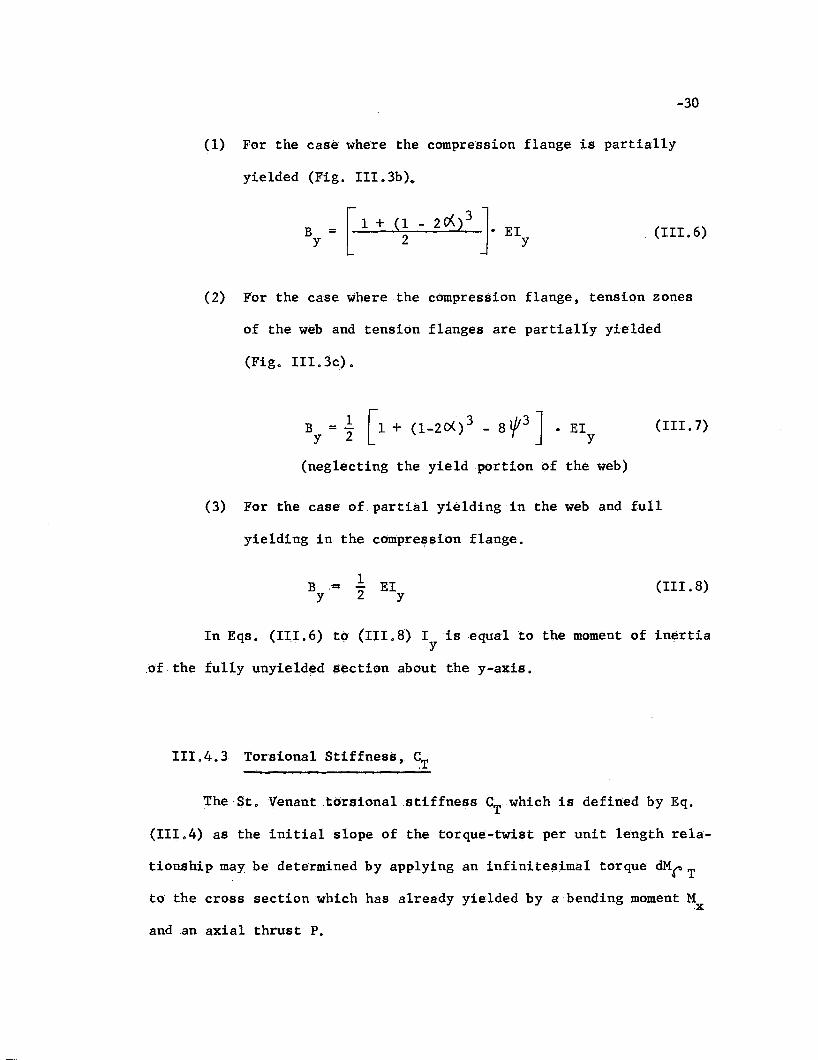
(1) For the case where the compre~sion flange is partially
yielded (Fig. III.3b).
(III.6)
(2) For the case where the compression flange, tension zones
of the web and tension flanges are partially yielded
(Fig. III. 3c).
1 [ . 3 3 ]By = '2 1 + (1-20<) - 8 t . Ely
(neglecting the yield portion Qf the web)
(III.7)
(3) For the case of partial yielding in the web and full
yielding in the·compreE,Jaion flange.
B ,= 1 EIY 2 y
(III.8)
In Eqs. (III. 6) to (III. 8) I is equal to the moment of inertiay
.of the fully unyielded section about the y-axis.
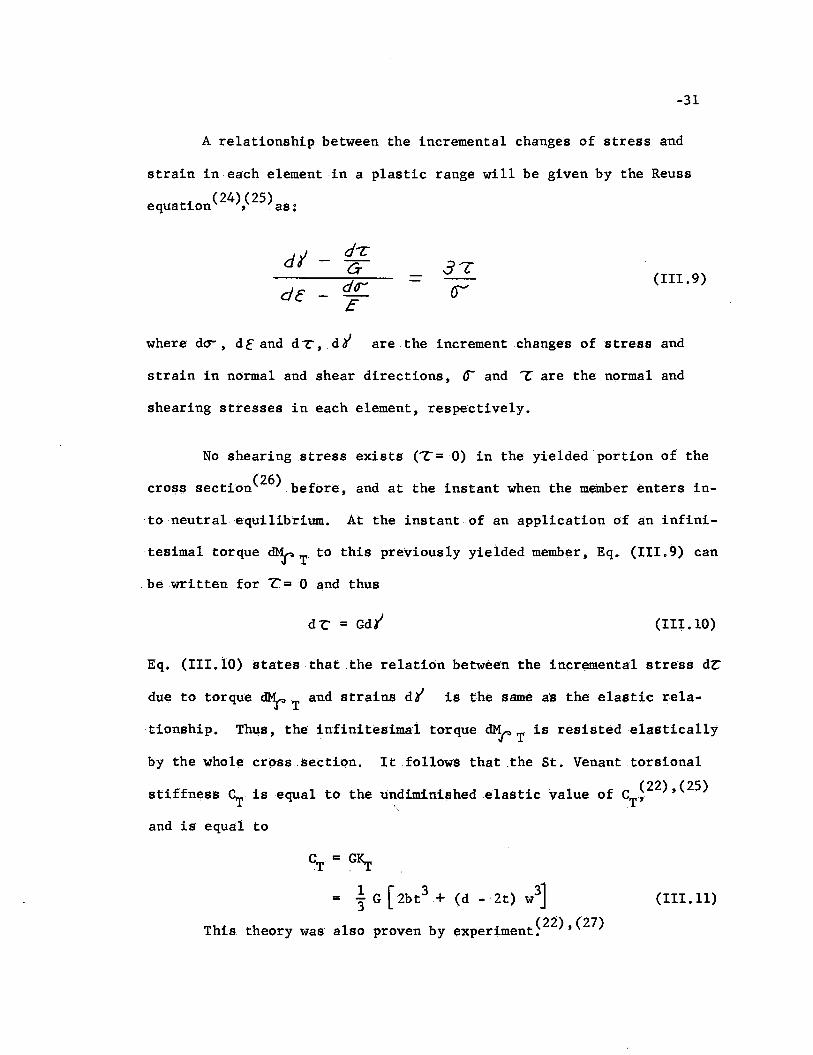
111.4.3 Torsional Stiffness, ~
The St. Venanttdrsionalstiffness CTwhich is defined by Eq.
(III.4) as the initial slope of the torque-twist per unit length rela-
tionship may be determined by applying an infinitesimal torque dMrT
td the cross section which has already yielded by a bending moment Mx
and .anaxial thrustP.
-31
A relationship between the incremental changes of stress and
strain in each element in a plastic range will be given by the Reuss
equation(24)!25)as:
dlde dr
E
(III.9)
where do-, dE and dT, d I are the increment changes of s tress and
strain in normal and shear directions, 0- and lr are the normal and
shearing stresses in each element, respectively.
No shearing stress exists ("7:=0) in the yielded portion of the
cross section(26) before, and at the instant when the member enters in-
to·neutralequilibrium. At the instant of an application of aninfini-
tesima1 torque dMr T to this previous 1y yie lded member, Eq. (III. 9) can
be written for T= 0 and thus
dL' = Gdt (III .10)
Eq. (111.10) states that .the relation between the incremental stress dr
due to torque ~ T and strains deY is the same a's the elastic rela
tionship. Thus, the infinitesimal torque dM~T is resisted elastically
by the whole crdss.section. It .follows that .the St. Venant .torsiona1
stiffness S is equal to the undiminished elastic value of cT
F2) , (25)'\
and is equal to
c=T GK.r
= ~ G [ 2bt3 + (d - 2t) w
3JThis theory was also proven by experiment~22),(27)
(III.ll)
-32
This result has been applied to the lateral instability problems
by several investigators~22),(28),(20),(2l),(4)
In Ref. (4), however" the magnitude of CT has been shown to
have a small affect on the inelastic lateral-torsional buckling strength
for wide-flange members.
After some twisting deformation occurs, the St. Venant torsional
stiffness ~ will decrease considerably due to the presence of shear
ing ,stress from MjTwhich now has a definite magnitude.
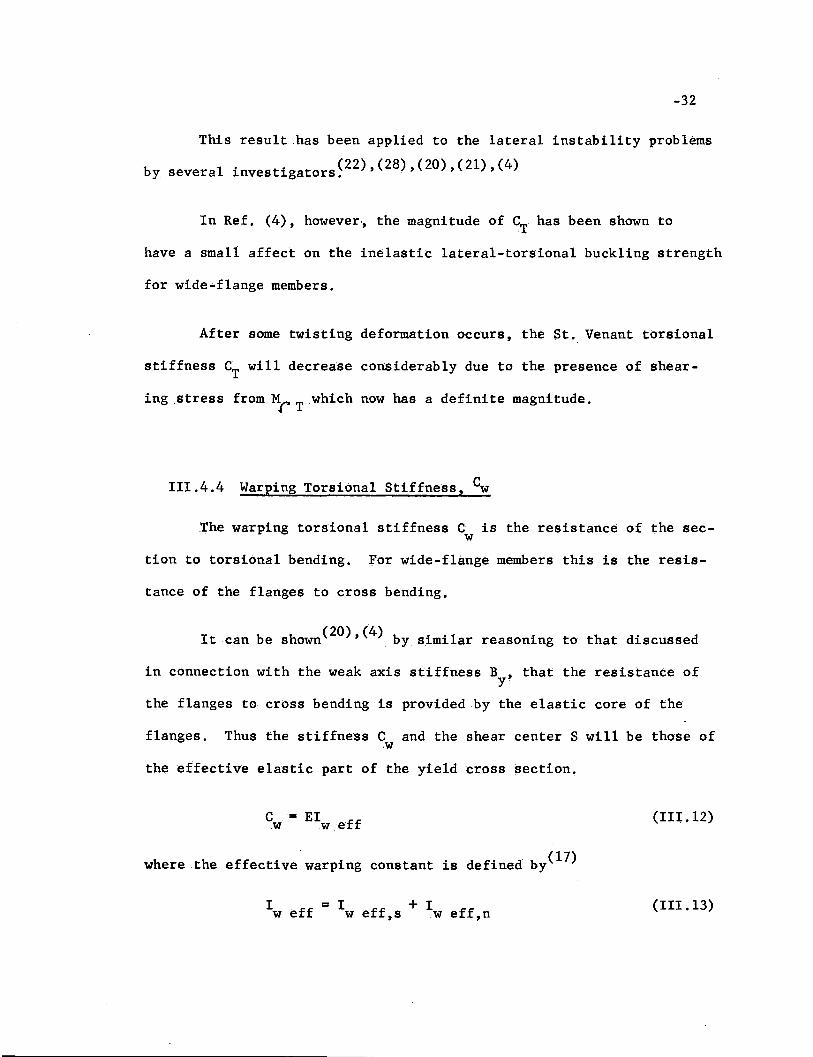
111.4.4 Warping Torsional Stiffness, Cw
The warping torsional stiffness C is the resistance of the secw
tion to torsional bending. For wide-flange members this is the resis-
tance of the flanges to cross bending.
It can be shown(20), (4) by similar reasoning to that discussed
in connection with the weak axis stiffness B , that the resistance ofy
the flanges to cross bending is provided by the elastic core of the
flanges. Thus the stiffness Cand the shear center S will be those of,w
the effective elastic part of the yield cross section.
C= EI.ww.eff
where the effective warping constant is defined by(l7)
I = I + Iw eff w eff,s w eff,n
(III.l2)
(III 013)
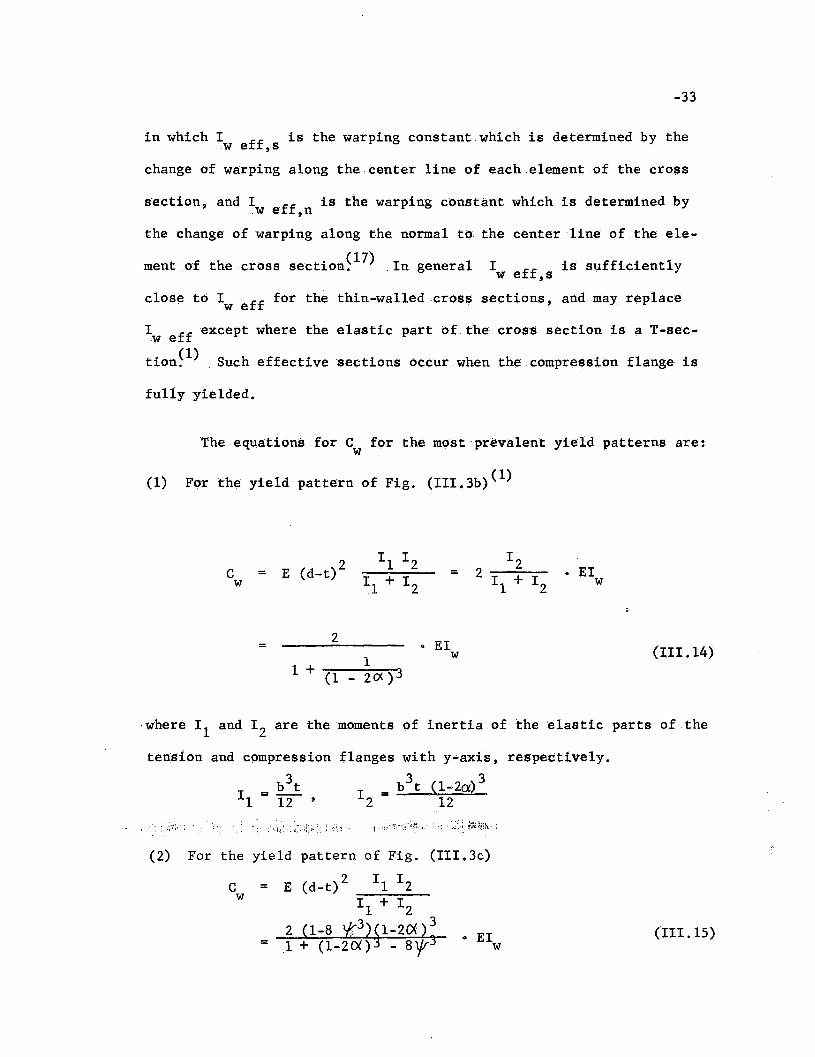
-33
in which I is the warping constant which is determined by thew eff,s
change of warping along the center line of each element of the cross
section, and Iw effn is the warping constant which is determined by,the change of warping along the normal to the center line of the ele-
mentof the crosssection~17) In general I is sufficientlyw eff,s
close to Iw eff for the thin-walled cross sections, and may replace
Iweffexceptwhere the elastic part of the cross section is a T-sec
tion~l) Such effective sections occur when the compression flange is
ful1y yielded.
The equations for Cw for the m()stprevalentyield patterns are:
(1) For the yield pattern of Fig. (III.3b)(1)
E (d_t)ZII I Z
ZI Z EIC = =
w II + I Z II + I Z w
Z • EI= (III. 14)1
w1 + (1 _ ZO< )3
,where II and I Z are the moments of inertia of the elastic parts of the
tension and compression
b3tII = 12
flanges with y-axis,
I = b3t (1_Zo:)3Z lZ
respectively.
(Z) For the yield pattern of Fig. (III.3c)
C = E (d_t)Z II I Zw
II + I Zy;:3) , 3 (111.15)Z (1-8 AP-2()() . EI= 1 + (I-ZOO - 8'1/3 w
-34
where
,12 12
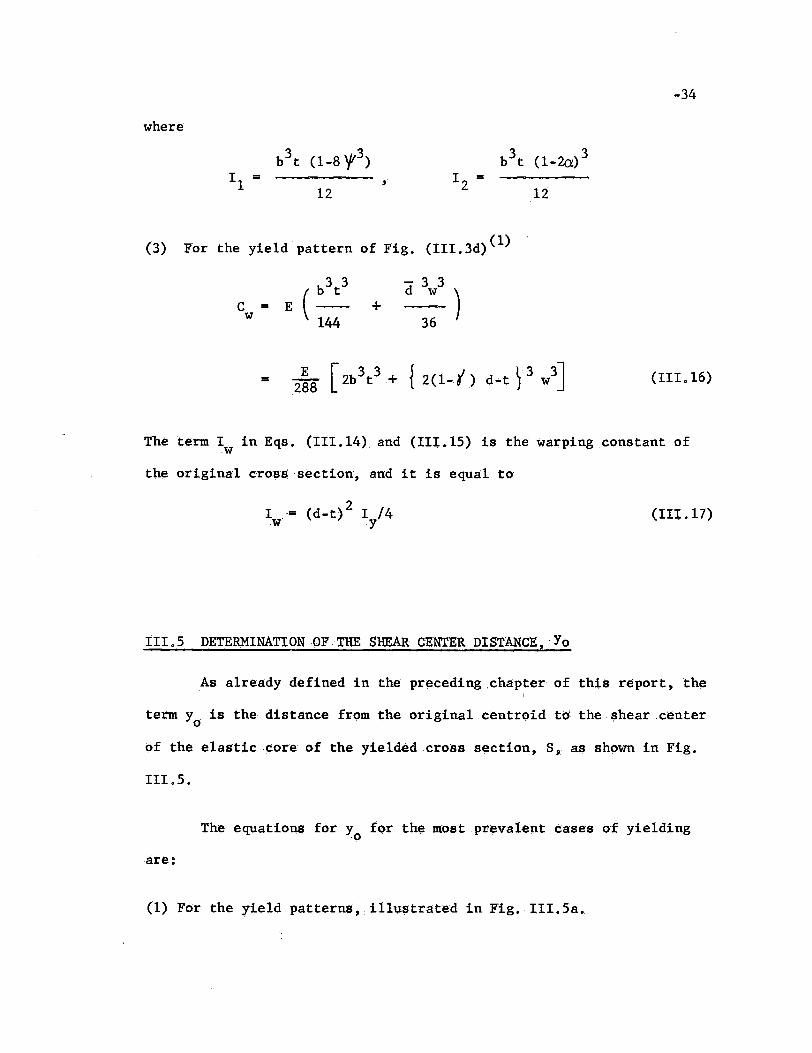
. (3) For the yield pattern of Fig. (III. 3d) (1)
C =w
+- 3 3d w
36)
= (111.16)
The term I in Eqs. (111.14) and (111.15) is the warping constant of.w
the original crosS section, and it is equal to
1= (d_t)2 I /4w .y
IIL5 DETERMINATION OF THE SHEAR CENTER DISTANCE, Yo
(III .17)
As already defined in the preceding chapter of this report, the
term y. is the distance from the original centroid to' the shear centero
of the elastic~oreof the yielded cross section, S, as shown in Fig.
IlLS.
The equation,s for Yo for the most prevalent cases of yielding
are:
(1) For the yield patternB,i11ustrated in Fig. III.5a.
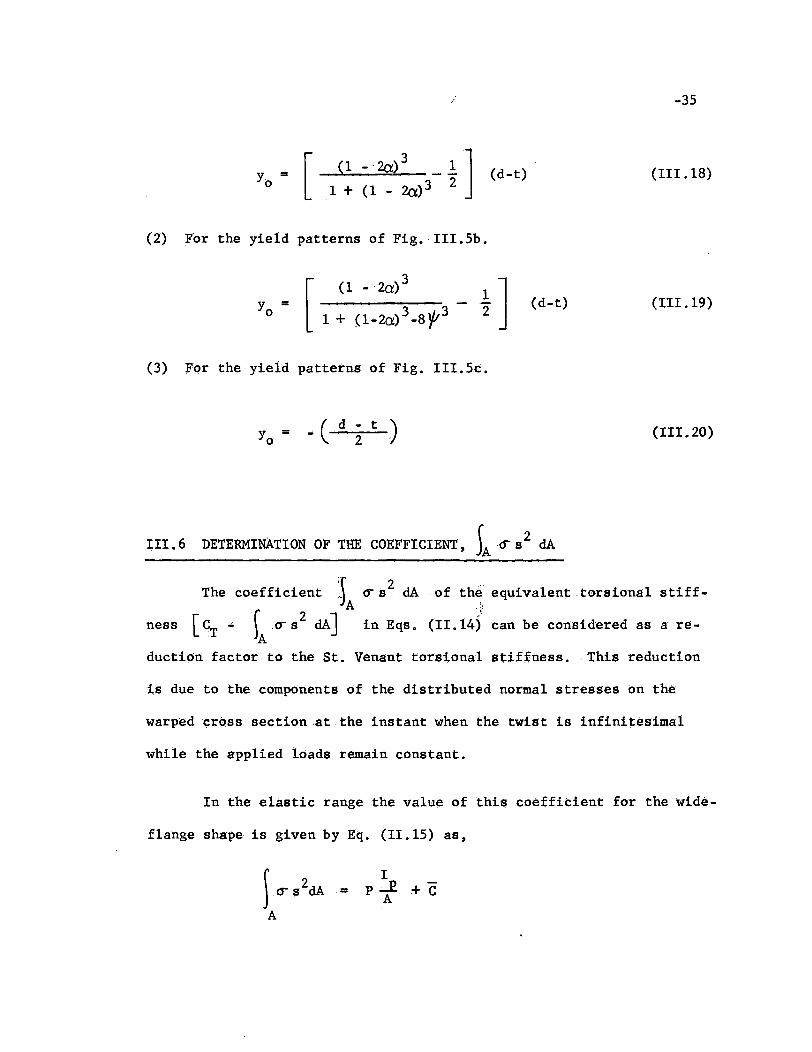
(1 _20:)3 _ 1:.]1 + (1- 20:)3 2
(d-t)
-35
(III.18)
(2) For the yield patterns of Fig.· III.5b.
(3) For the yield patterns of Fig. III.5c.
_(d;t .)Yo =
(d-t) (IlL 19)
(III.20)
III.6 DETERMINATION OF THE COEFFICIENT, JA·IS s2 dA
The coefficient :~A (5" s2. dA ·of th~ equivalent torsional stiff
ness [S.. }A CT s2 dAJ in EqS. (11.14) can be considered as a re
duction factor to the St. Venant torsional stif:fness•. This reduction
is due to the components of the distributed normal stresses on the
warpedcr()ss sectionat.the instant when the twist is infinitesimal
while the applied loads remain constant.
In the elastic range the value of this coefficient for the wide-
flange shape is given by Eq. (11.15) as,
Ip~ +c
A
-36
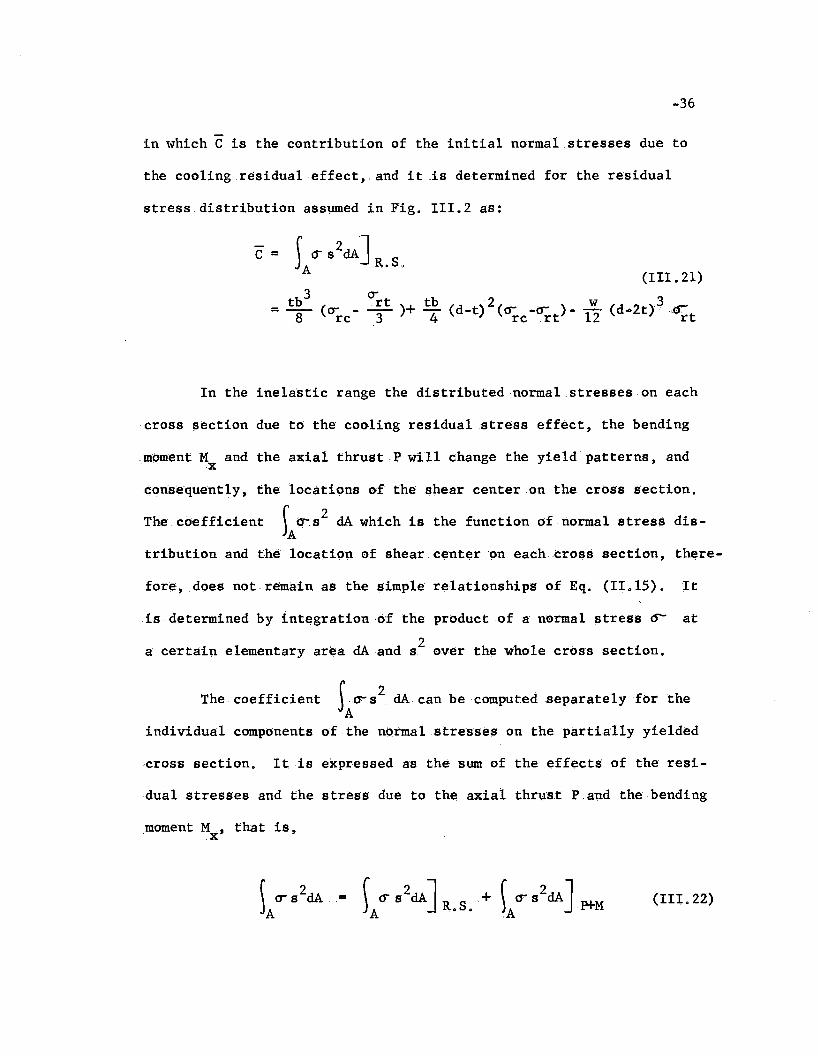
in which C is the contribution of the initial normal stresses due to
the cooling residual effect, and iti8 determined for the residual
stress distribution assumed in Fig. 111.2 as:
tb 3= - (08 rc
0-rt tb 2 .- )+ - (d-t) (0- -cr )-3 4 rc rt
(III.21)
w . ·3IT (d..2t) "~t
In the inelastic range the diStributed normal streSses on each
cross ~ection due to the cooling residual stress effect, the bending
mi:>ment Mxand the axial thrustP will change the yield patterns, and
c()Rsequently, the locations of the shear center On the croSs section.
Thecdefficient ~AdrS2 dAwhich is the function of normal stress dis
tribution and the location of shear center on eachcros8 section, there-
for¢, does not remain as the simple relationships of Eq. (11.15). It
is determined by integration 'of the product of a normal stress ~ at
a certain elementary area dAand s2 over the W'hole cross section.
The. coefficient 1cr82 dAcan be computed separately for theA
individual components of.the normal stresses on the partially yielded
cross section. It is expressed as the sum of the effects of the resi-
dual stresses and the stress due to the axial thrl1St P and the.bending
,moment M , that is,x
(III.22)
-37
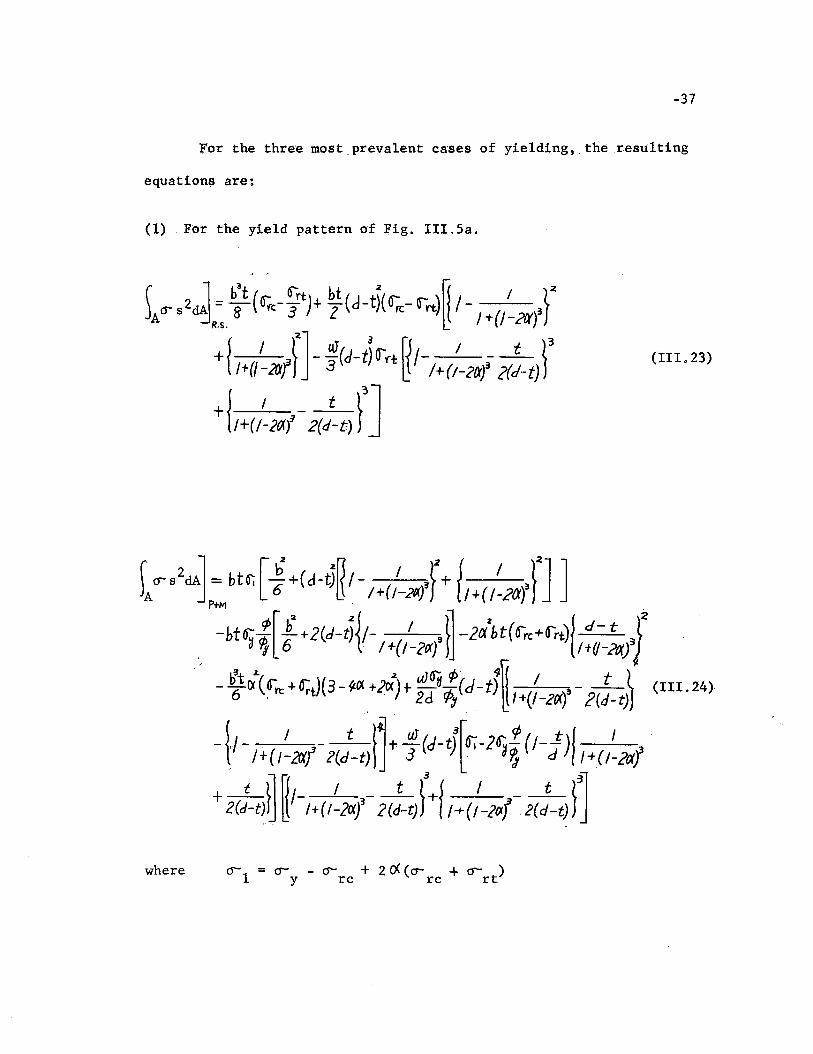
For the three most.prevalent cases of yielding, the resulting
equations are:
(1) F<>r the yield pattern of Fig. 11I.5a.
(III. 23)
r()82dAl = btfi [6b+(d-tjIT{- r' ,I.+ { / ,,\2J]
)A J ~ /+ /-2{1.) f /+(/-2fJ)P+M .
-ht~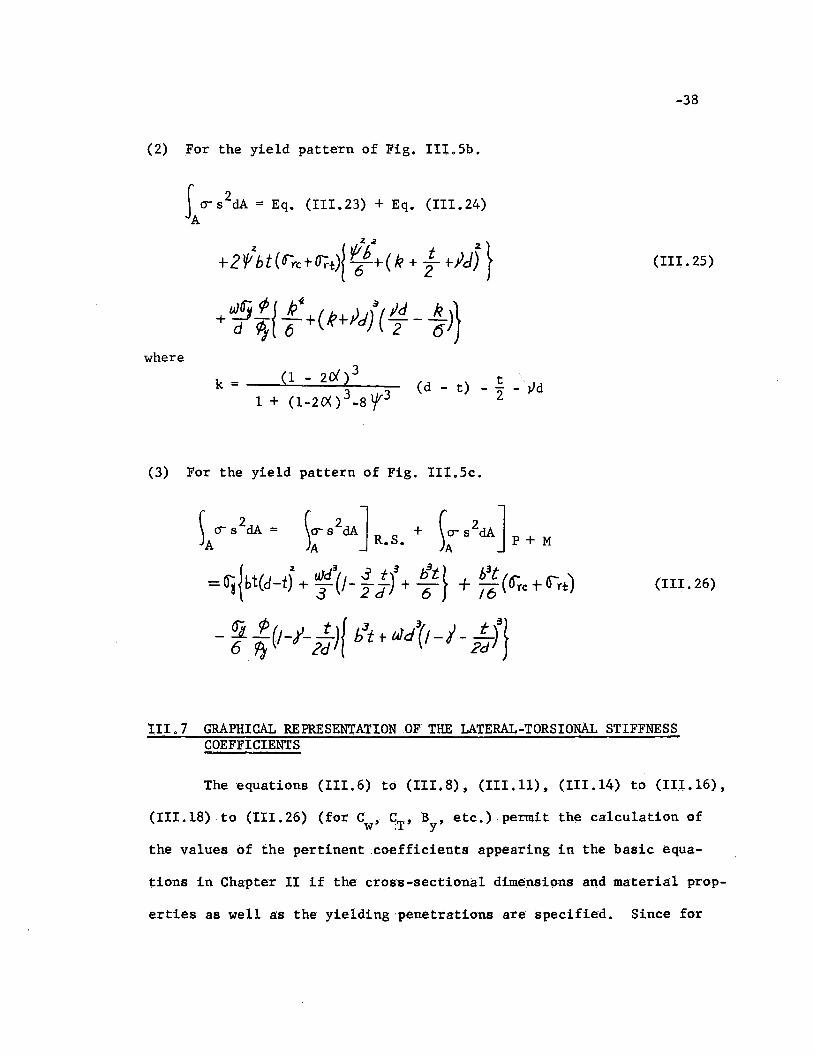
-38
(2) For the yield pattern of Fig. III.Sb.
10- 82dA = Eq. (III. 23) + Eq. (III. 24)
A
where
(III.2S)
t(d - t) - '2 - vd
(3) For the yield pattern of Fig. III.Sc.
~Ao-s2dA = ):S2dAJR.S. + ~~,-g2dA] P+ M
{~ uJd3 ..3 t 3 I:!t} h3t
=(Jg bt(d-t)+3"(J-2d)+6 + /6 (tf;.c+Ort)
- ~; (1-.r-2:J{ b3t tlNd{/-t- ~rJ
(III. 26)
111.7 GRAPHICAL REPRESENTATION OF THE LATERAL-TORSIONAL STIFFNESSCOEFFICIENTS
The equations (111.6) to (III.8), (IILll), (III.l4) to (II'I.l6),
(III.l8) ,to (III.26) (for Cw' qT' By' etc.) ,permit the calculation of
the values of the pertinent coefficients appearing in the basicequa-
tions in Chapter II if the cross-sectional dimensions and material prop-
erties as well as the yielding'penetrations are specified. Since for

-39
these same yield patterns the corresponding moment and a){ial thrust
are known from the previous step where M-0-p relationships were com-
puted, it is possible to combine these results and set up families of
curves where each curve gives the correlation between any of the co-
efficients .gnd the moment for constant values of pip. Such curvesy
for the 8WF3l section are shown for pip = 0, 0.2, 0.4 and 0.6 in Figs.y
111.6 to 111.9. Figure 111.6 gives the curve M/M versus Bfor dif-y Y
ferent pip values. Figure IIr.7 shows the curve M/M versus C I CT· ,Y . Y w .
the curve M/M versus y Id is illustrated in Fig. 111 0 8, and finally,y 0
. the curves in Fig. III. 9 give the relationships between M/M and
leO .~9"" s2dA Also shown.on thecu,rves for pip = 0.6 in t~eSefigUreS~. y
are the zones in which the various patterns of yielding given in Fig.
111.5 occur. Thesecurv.es are shown here to illustrate the variation
of the coeffidents in the inelastic range. In the elastic range the
coefficients are constant.
The availability of such curves as are shown in Figs • 111.6 to
III.9 would permit the determination of the requiredcross-section.gl
properties for any given value of the moment and the axi.gl thrust. It
should be pointed out that these curves represent intermediate steps in
the calculation, and they need not be actually conStructed. They were
computed as a subroutine by the LGP-30 digital computer, and as such
these calculations were part of the total computer program.
-40
111.8 COLUMNDEFLECTIONCURVES
The relationships discussed in the previous part.of this chapter
were those existing between any of the cross-sectional coefficients
(B , C , etc.) and the momentMfor specified values of pip. Next,y wx y
the bending moment distribution along the member must be determined for
given end moments and a given axial thrust and length. This is done
with the aid of the column deflection curves (CDC-s). A CDC is the
shape that a compressed member will assume if it is held in a bent con
figuration by axial thrust at its ends~28) Any real beam-columndeflec-
ted in the plane of symmetry can be thought .of as being a segment of
.such a CDC~29)
Two CDC-s are .shown in Fig. III.10(a).Axial thrust P is ap-
plied at the two column ends, and this axial thrust holds the member
in a deflected .shape. Since the bending moment at anypoingwithin the
curve is proportional to the deflection, the deflectibn curve can also
represent the bending .moment diagram. The length of the CDC-s of Fig.
111.10 is non-dimensionalized as the strong slenderness ratio L/r ,x
and all deformations take place in the plane of the paper.
There are an infinite number of possible CDC-s for any given
symmetric cross section and a specified constant axial thrust P. These
various curves are differentiated from each other by the slbpe,Q ato
the.end of the cblumn.
Beam-Columns with Equal End Moments
The relationship between the beam-columns with equal end moments
-41
and the CDC-s is illustrated by Fig. 111,10. Both ends of the beam-
column are situated a distance equal to its half length from the maxi-
mum point ·of the CDC. The moments at both ends are equal to M. Thereo
are an infinite number of CDC segments which can be placed on the beam-
column length for any given axial thrust and L/r. One of these segx
ments will correspond to the maximum end moment M whichthe.membero max
can sustain if failure occurs by excessive bending in the plane of the
applied moments (Fig. 111.11) and the locus of these maximum end moment
points for different beam-column lengths,.shown by a dotted line in Fig.
lILlO" corresponds to the interaction curve for ultimate strength(10)
if failure is due to excessive bending in the plane of.bending. Another
CDC will correspond to the case where both end moments areM ,.thato cr
is, at which lateral-torsional buckling is innninent. As shown in Fig.
111.11 there are two CDC-s which have M as their end moments: One'0 cr
(b) is located on the loading zone of the in-plane M-Q curve in Fig.
111.11 and the other (c). is located on the descending branch, that is,
in the unloading zones. Of these two only the first is of interest here.
Beam-Columns with One End Moment
Figure 111.12 illustrates the relationships between the beam-
columns with one endmomentMo and the CDC-so The pinned end of the
beam-column coincides with the end of the CDC. The other end is located
at a distance equal to the beam-column length along the CDC. The moment
.at this end ~s equal to Mo. The dotted line in Fig. 111.12 represents
the locus of the maximum end moment points for failure occurring by
-42
excessive bending. As shown in Fig. 111.12 there are two CDC-s which
haveM as their end moment: One is located on the loading zone ino cr
the M-Q curve such as shown in Fig. 11.1, and the other is on the un-
loading zone.
.here.
The M which is in the loading range is of interesto cr
The column deflection curves are obtained from the M-0-Pcurves
b.y numerical integration, giving the value of the deflection, the
slope, the moment and the curvature at evenly spaced discrete points
along their whole lengths. The construction of CDC-s for the 8WF3l
section f()r the values ()f pIp = 0.2, 0.4 and 0.6 has been: carried outy
by the LGP-30 digital computer. The detailednumericgl data for these
CDC-s and the. programming are filed in the Project 205A, Fritz Engineer-
ing Laboratt;>ry, Lehigh University. These CDC-s have been computed by
. .. ... (28) (30)hand and the results are also available in nom()graphic form. '
From this knowledge, it is then possible to compute the various
.cr()ss-sectional coefficients along the inelastic beam-columns under the
specified end moment and the axial thrust.
III.9 COMPUTATIONAL PROCEDURE
The complete calculations from the M-0.Pcurves thro~gh to the
setting up of the determinant of the coefficients of the finite differ-
ence equgtions were performed by the LGP·30 computer. The process of
-43
calculation for one particular problem was essentially as follows:
(1) An 8WF3l section of A-7 steel was chosen as the member.
The input into the computer consisted of the cross-sec-
tional dimensions, b, d, t, and w, and of the material
properties ~=33 ksi, 0- =0,3 a- , E=30,000 ksiy rc y
and G = 11,500 ksi.
(2) Next an axial force and a length were selected. The
following values of Pwere used in the computations:
0.2 P , 0.4 P and 0.6 P, The length was usuallyy 'y y
selected to be a multiple of 2rx or 3rx "since this
has been shown to be spacing resulting in adequate
accuracy~28)
(3) FrOm the input of step (1) above and for the specified
axial thrust the M~~ curve was computed.
(4)
(5)
Several CDC-s having different end slopes 0 were como
puted by numerical integration from the M-0 curve of
step (3).
One of the CDC-s, with a reasonable value of 0 waso
selected from the curves of step (4).* With P/Py
and
.0'0 known" the value af M 1M for the length L/rwasoy , x
determined from the CDC o Within the length of the beam-
columns, the moment and the curvature are now also knOWn
at evenly spaced points.
*This initial choice of 0 will be discussed in Cha'pter Voo
-44
(6) Knowledge of the moment, curvature, and axial thrust at
these .points also includes knowledge of the distribution
of the yield zones (step (3) above), and from this the
values of the sectional properties were computed at each
point.
(7) The final results of this computational routine were the
coefficients for the finite difference equations, and the
axial thrust, length, and the end moments of the beam
column.
The steps outlined above were computed essentially in one con
tinuous operation with one digital computer (LGP-30).
IV. L.A T E R AL - TORS 10 N.A L B U C ,K LIN G S T RE NGT H
In this chapter the lateral-torsional buckling strength of steel
wide-flange beam-columns will be determined for sever.al particular
loading .conditions. The results obtained in Chapter III, that is, the
relationships between bending moment, axial thrust, and the cross- sec-
tional properties,. will be used to solve the basic equations for the
critical axial thrust-length-endmoment (P-L-M ) ,combination of lao
teral-tdrsional buckling. These relationships were developed in Chap-
ter II.
The final results of the c<>m.putations will be presented here
for one particular wide-flange shape. This shape is the 8WF3l section.
The influence of the cross-sectional size on the buckling curves will
be discussed in Chapter V.
The following particular loading conditions will be discussed
for the determinationoi the buckling strength:
Lateral buckling (P=O)
(1) Equal end moments (~= 1)
(2) One end moment (f= 0)
.Lateral-torsional buckling (P.~ 0)
(1) Equal end moments ( r= 1)
(2) . One end moment ( f= 0)
-45-
-46
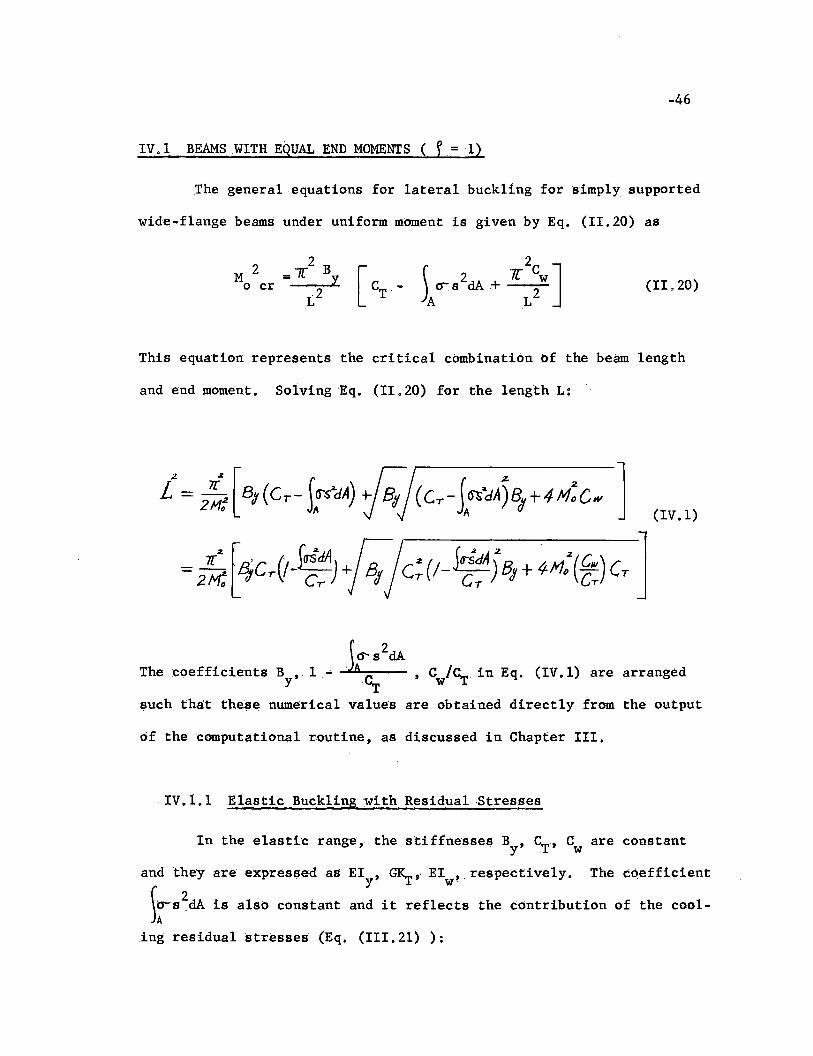
IV.I BEAMS WITH EQUAL END MOMENTS ( f=l)
.The general equations for lateral buckling for simply supported
wide-flange beams under 'uniform moment is given by Eq. (11.20) as
2 2 BM =7[ Y
o cr 2L [ C-,T
(11020)
This equation represents the critical combination of the beam length
and end moment. SoIvingEq. (11.20) for the 1engthL:
>f S2dAThe coefficients By' 1- . '4r ,Cw'C-r in Eq. (IV. 1) are arranged
,?uch that the~~ numerical values are obtained directly from the output
of thecomputgtional routine, as discussed in Chapter III.
IV.I.I Elastic Buckling with Residual Stresses
In the elastic range". the stiffnesses By'S, Cw are C(>llstant
and they are expressed as EI , GIL" EI ,respectively. The coefficienty --LW
~~S2dA is also constant and it reflects the contribution of the cool-
ing residual stresses (Eq. (III.21) ):
-47
This effect of the residual stresses on the elastic buckling
strength can be expressed as a reduction of the St. Venant torsional
stiffness CT, and the equivalent torsional stiffneSs H is equal to
(IV.2)
The ratio of the critical end moments with the residual stress
effect to the value of (M ) without residual stresses (Mw/o )o cr R.S.
is determined from Eq. (II.20); that is,
2 CH+
7[ w
( M ) L2o ...
M"';/~ R.S. :~ 2 C
GK.r+7[ w
L2
lcr s2dA
= 1 -GK.r
(IV.3)
1 +7[ 2 Cw
L2
G K.r
For the 8WF31 section and for the assumed residual stress dis-
tribution wi th a- .== 0.3 0- as. shown in Fig. III. 2, M becomes:rc y 0 cr
Mo cr = (M w/o R.S.)cr 1 -0.0617
27,807.1+
L2
-48
(IV.4)
The most severe case in Eq. (IV.4) is L~OO and even for this
case Mo cr = 0.97 Mw/o R.S.' that is, the reduction of the buckling
strength due to the residual stresses is atmost3%,of the buckling
strength of a member which is stress relieved. It is also apparent
from Eq. (IV.4) that the reduction within the elastic range is not
,very sensitive to L. In Fig. IV.l the critical length versus moment
curves are shown for the 8WF31 section ( (M 1M) ,vs L/r). In thiso y cr x
figure the elastic buckling curves apply for the case when M 1M <0.7.,0 y-
Above this value of Me yielding,results. The solid line shows the
curve
'Bents
with the effect of residua-l stresses and the dashed line ,repre-
, . . . . . r 2the curve without the residual stress effect, that is, J:-s dA=O.
IV.!. 2 Inelastic Buckling
In the inelastic range yielding ,sta.rts to penetrate from the
tips of the compression flange and the nermalstress distribution
across the cross section becomesunsymme'trical about the x-axis be-
cause of the presence of the residual stre$ses (See Fig. III.3).
The term \~$2dA in Eq. (I!. 20). nc;w is equd to Eq. (111.22).
The expressions for (0- s2dA ] R SandJ~ . .
by Eqs. (111.23) to (111.26) for different yield
-49
)<rs2dAJ M are given
A '
patterns for the
specified value p!p = o.y
The cross-sectional coefficients
Eq. (IV.l) are obtained directly by the
ir S2dAB , 1 ~ e" ,etcT inyw '
Tcomputational procedure as
described in Chapter 111.9 for different M!M values and for pIp = O.y Y
The variations of these coefficients with the moment M!Min the iny
elastic range are also illustrated in Figs. 111.6 to lII.9.
The computed inelastic portion of the buckling curve for the
8WF3l section is also shown in Fig. IV.l (solid curve). The chain
line in Fig. IV.1 shows the buckling curve where the effects of
~:,s2dA due t~ the residual stresses snd the normal atress caused
by the end moments (Eq. III.22) are not included, that is, \;S2dA =0
in Eq. (11.20)~ but the reduction of Band C due to the residualyw
stresses are included~3l)
From Fig. IV.l the following ,conclusions can be drawn:
(1) The residual stress effect on the elastic buckling
.strength is practically negligible.
(2) However, the presence of the residual stresses in the
member limits the elastic buckling moments at MtM = 0.7y
under the assumed maximum compressive r~sidual stress
0-= 0.3 0- •, rc y
-50
(3) In the inelastic range, the residual stress distribu-
tiongives an unsymmetrical normal stress distribution
on the cross section about the x-axis. This partially
yielded stress distribution causes the reduction of
stiffnesses, B . and C , of the member. This.unsymme-y ,w
tricstress distribution also causes a relatively large
reduction due to the term ~~.2dA.
IV.2 BEAMS WITH ONE END MOMENT (r=0)
IV.2.1 Elastic Buckling with Residual Stresses
The elastic solutiQn for lateral buckling without.residual
stresses and for one end moment have ~ been obtained in Ref. 32 by
using the theorem of stationary potential energy.
As already,stated in the preceding .section, the effect ·of the
residual stresses on the buck1ing strength can be expressed as are-
duction of St. Venant tdrsionalstiffness. The numerical ta:bleswhich
are listed in Ref. 32 are available when the His replaced by Eq.(IV.2)
. for the buckling including the residual stress effect. The ratio
(M/M ) for the 8WF3l section is almost the same for the00 wfo R.S. cr
case of equal end mqments. For the pra~tical purposes, the reduction
of 3% ,is negligible.
-51
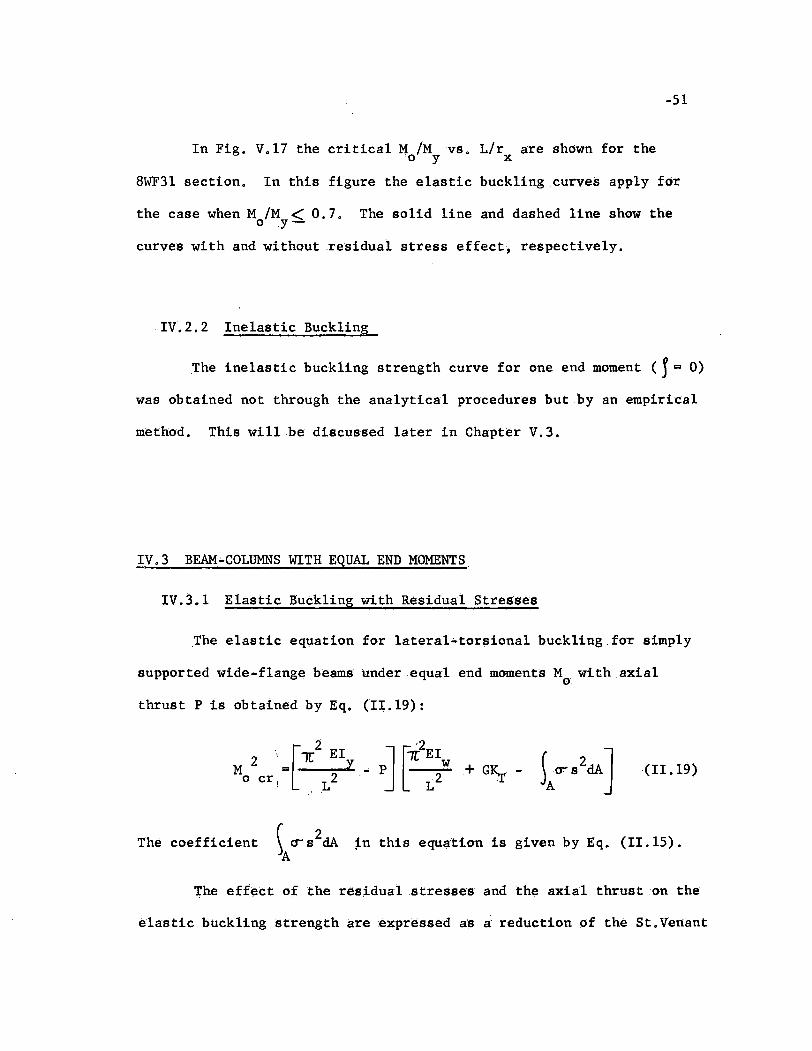
In Fig. V.17 the critical M 1M VS. L/r are shown for theo y x
8WF3l section. In this figure the elastic buckling curves apply for
the case when M /M < 0.7. The solid line and dashed line show theoy-
curves with and without residual stress effect, respectively.
IV.2.2 Inelastic Buckling
.The inelastic buckling strength curve for one end moment (j = 0)
was obtained not through the analytical procedures but by an empirical
method. This will be discussed later in Chapter V.3.
IV.3 BEP.M,;,COLUMNS WITH EQUAL END MOMENTS
IV.3.1 Elastic Buckling with Residual Stresses
The elastic equation for latera1,;,tor~iona1buckling for simply
supported wide-flange beams under equal end moments Mo with axial
thrust P is obtained by Eq. (II .19) :
+ GK.r - (II .19)
The coefficient \crs2dA ~n this equation is given by Eq. (11.15).'A
The effect of the residual stresses and the axial thrust on the
elastic buckling strength are expressed as a reduction of the St.Venant
-52
torsional stiffness, that is, the equivalent torsional stiffness 11t is
11t = HI C
Iwhere HI = GK.r p..J!.
A
The ratio of the critical end moments including the residual
stress effect to those without the residual stress effect is given
1[2 EIby Eq. (IV.5) for a constant\Talue of P for which P .~ y
L2
2 EI7[. w
+ HI - C
(Mo w~: R.S. )L2
=cr 2 EI
7[ w+ HI
L2
(IV.5)
cGK.r
2 EI7[ w
+L2 G K.r
1 -=
7[ 2 EIIf p~=y which gives the Euler buckling load in the
L2
weak direction, M. . = (M wfo R S ) .=0 in ~q. (n.19).o cro • • cr
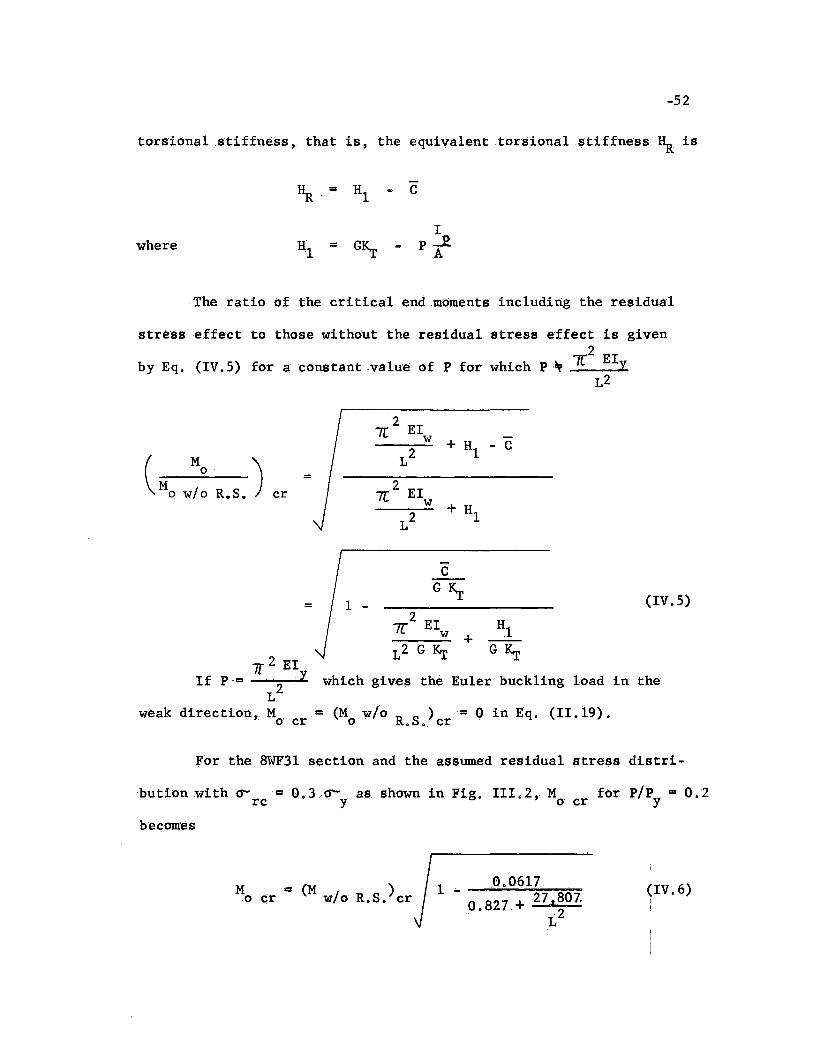
:For the 8WF31 section and the assumed reSidual s~ress distri-
button with (1-rc = 0.3 c o-y as shown in Fig. IIL2, Mo cr for pfPy = 0.2
becomes
I.. 0.0617o. 827 +27,~07.
L
IV.6)
-53
The most severe case in Eq. (IV.6) is when Lapproaches the
Euler buckling length in the weak direction for pip =0.2, that is,y
the reduction M= 0.97 (M w/o R S). of the elastic bucklingo cr • • cr
strength due to the residual stress effect is practically negligible.
For other pIp values. similar results are obtained.y
The critical combinationS of the length and end moments for the
specified axial thrust P/Py = 0.2, 0.4 and 0.6 are shown in Fig. IV.2
for the 8WF3l section. In this figure the elastic buckling curves
end at M/M ~ 0.5, 0.3 and 0.1, respectively. The solid lines Showy
the curves with the residual stress effect, and the dashed lines show
the curves without the residualstres8 effect. In the elastic range
the residual stress reduction is for all practical purpbses negli ..
gible.
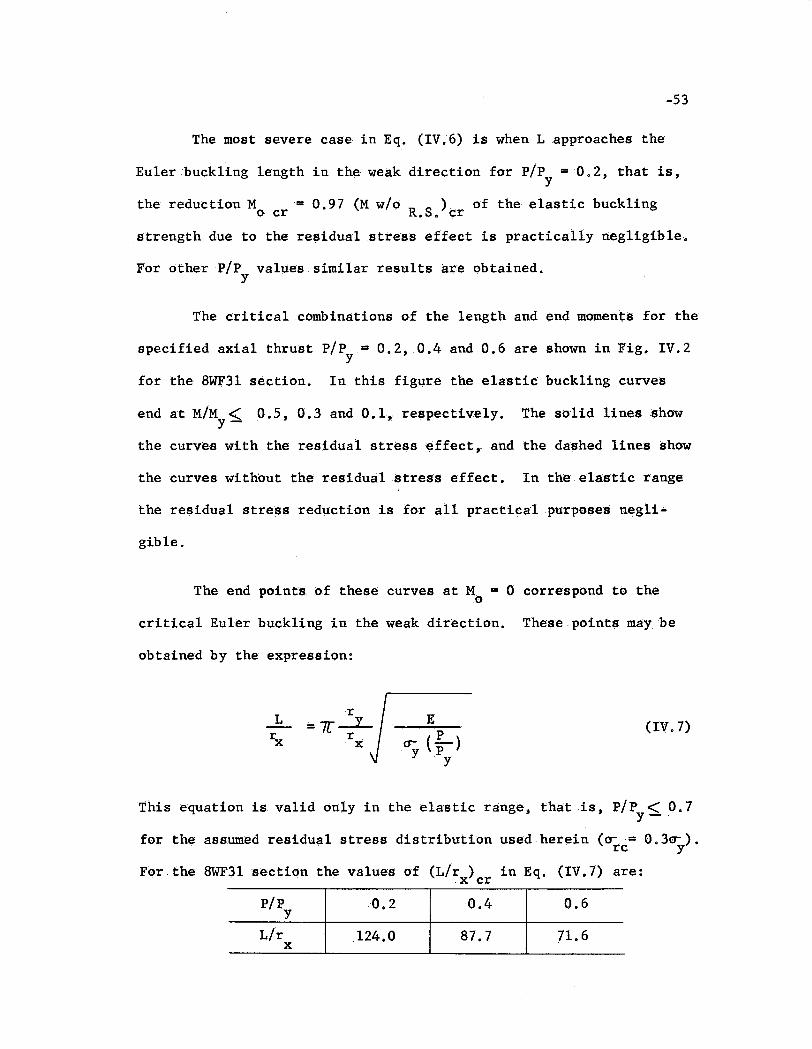
The end points of these curves at M = 0 correspond tb theo
critical Euler buckling in the weak direction. These.points maybe
obtained by the expression:
E (IV.7)
This equation is valid only in the elastic range, that is, pIp < 0.7y_.
for the assumed residual stress distribution used herein (cr= 0.3cr).rc y
For the 8WF31 section the values of (L/rx)cr in Eq. (IV.7) are:
pip 0.2 0.4 0.6Y
L/r 124.0 87.7 71.6x
-54
IV.3.2 Inelastic Buckling
Since the bending.nroment along the beam-column is equal to the
sum of the applied end bending moment M. and the product of the axiala
thrust .times the deflection, the moment alang the beam-column will
not be uniform. Ilowever, a considerable' simplification of the compu-
tational procedure results if the stiffnesses along the length of the
beam-column are taken as uniform~4)
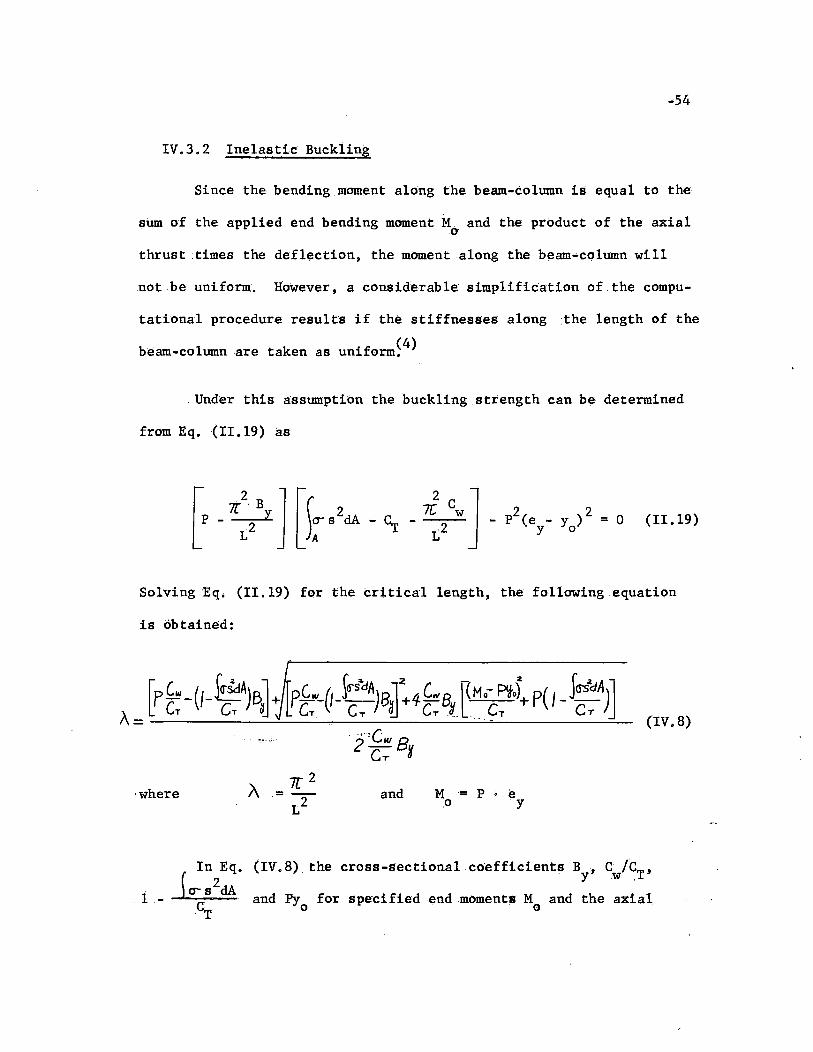
. Under this assumption the buckling strength can b~ determined
from Eq. (II .19) as
l 2 1[ 2 J7[ , B 2 7C C 2 2p - . Y (a- s cIA - C _ w - P (e - Y )
L2 )~ T L2 Y 0= 0 (11.19)
SolvingEq. (II.19) for the critical length, the following equation
is obtained:
(IV. 8)
'where2A 7[
= L2and M '= P • e
.0 y
(IV.8) the cross-sectional coefficients By' Cw/CT,
and Py for specifiedendmomentB M and the axialo 0
-55
thrust P are obtained directly by the computational procedure described
in Chapter III. 9. The variations of these coefficients with themo-
ment M !Min the inelastic range are also available from: Figs. 111.6o y
to III. 9 •
The critical combination of slenderness ratio L!rand endx
bending moment ratio M!M for inelastic lateral-torsional bucklingy
are presented in Fig. IV.2 for the 8WF31 section. The values ofP!P. y
are 0.2, .0.4 and 0.6. The chain lin.es in these figures are the curv.es
fram Ref. 4 where the residual stress effect in the term JA
o-·s2dA
was neglected. The light solid lines are the ultimate .str~ngth.curves
for pIp .=0.2 for the beam-column with equal end moments failing byy
excessive bending in the plane of the web~IO)
The end points of ·thesecurves where L!r= 0 correspond tox
the plastic hinge moment modified to include the effect of axial
thrust, M These points may be obtained by the expression: (13)pc
.. MpC ... fM
Y(IV.9)
forO ~ P!Py
<w(d .. 2t)!A
M A (1.-...E.£. = f .M
Y
P!P) [dy
2 Z(IV.IO)
for w(d - 2t)!A <: pIp <1.0y-
-56
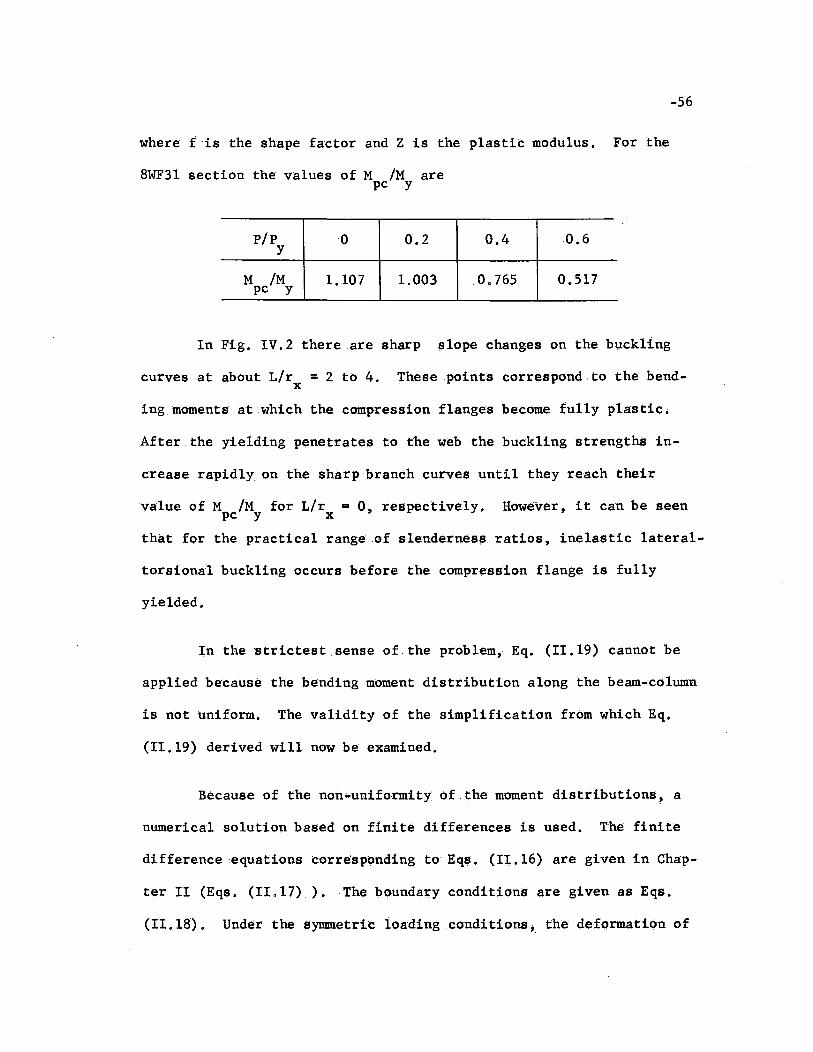
where fis the shape factor and Z is the plastic modulus. For the
8WF3l section the v~lues of M 1M arepcy
pIp 0 0.2 0.4 0.6y
M 1M 1.107 1.003 .0.765 0.517pc y
In Fig. IV.2 there are sharp slope changes on the buckling
curves at about L/r =2 to 4. Thesepoint8 correspond to the bendx
ingmoments at which the compression flanges become fully plastic.
After the yielding penetrates to the web the buckling strengthS in-
crease rapidly on the sharp branch curves until they reach their
value of M 1M for L/r = 0, respectively. However, it can be seenpc y x
that for the practical range of slenderness ratios, inelastic lateral-
torsional buckling occurs before the compression flange is fully
yielded.
In the strictest sense of the problem, Eq. (II .19) cannot be
applied because the bending m()ment distribution along the beam-cd1umn
is n()t uniform. The validity of the simplification from which Eq.
(II .19) derived will now be examined.
Because of the non-uniformity of the moment distributions, a
numerical solution based on finite differences is used. The finite
difference ,equations corresponding to Eqs. (11.16) are given in Chap-
ter II (Eqs. (11,17». The bound~ry conditions are given as Eqs.
(11.18). Under the synunetric loading conditions, the deformation of
-57
. the beam-column is symmetric about .the center line of the member.
Thus the setting up of the finite difference equations at each pivotal
pointi = 1 through i= n-l/2 (n is odd number) gives (n-l) simultan-
eous equations in terms of n-l/2 unknown ui and l3i quantities each.
This set of simultaneous equ~tions may be written in matrix notation
as
In this equation the matrix [AJ is a set of the coeffidents
Aij representing non-dimensional combinations of the cross-sectional
properties (By' CT, Cw' Pyo and ),f" s2dA), the load parameters (Pand
M ), and the length of the member. If the value of the determinanto
IAlis equal to zero, ,then the as.sumed combination of P, M and Lo
is one which ca.u.se~ the bifurcation of the equilibrium, that is., the
start of lateral-torsional buckling.
Usually it is not possible to estimate the critical combina
tiOll of F, M and Lsuch IAI= 0 at the first trial. ,Several valueso
of M are tried for given const~nt:values of Pand L, and the finalo
correct answer is obtained by interpolation.
In Fig. IV.3several Column Deflection Curves (CDC-s).forend
slopes Q = 0.04, 0 0 047. and 0.05 .are plotted on the buckling curve foro· •
P/Py=O.i from Fig. IV.2. In this figure the values of L/r in the, x
absdssa. for the GDC-s show half ,of the actual scale from the M/M axisy
about which the CDC-s are symmetric. As already explained in Fig. III. 10
-58
the ordinates of a CDC.represent the bending.II1oment distribution
along the beam-columns f()r the specified values of P, Land M •o
For L ... 30 r (that is, 15 r from the centerline axis on thex x
CDC) in Fig. IV.3, the assumed end moments are M 1, M .2' and M 3·ono 00
the CDC-s (00 = 0.04, 0.047 and 0.05, respectively). For the assumed
end moments, Mol on the CDC for °0
,- 0.04, the cross-sectional co
efficients, Aij , at each pivotal point can be obtained directly by
the c()mputational procedure ·o·f Chapter III. 9. The number of the
pivotal points within the span is 15, that is, the unknown ui and ;3i
quantities are (15-1)[2 - 7 each. Therefore, the characteristic de-
terminant ·of the cross-sectional coefficients AiJ
, IA I ,becomes
14 x 14 determinant. The computation of the values of these deter-
m.inants was performed by an IBM 7074 digital computer. The resu1t-
ing values o'f IA I versus M. i curves for L/r = 30 are shown in Fig.ox
IV.4. Similarly in this £igureareshown the curves for L/r = 60x
and 90, respectively.
The resulting eritical end moment·versus~lengthcurvesfor
pip =0.2 are shown in Fig. IV.5, in which one curVe (1) is obtainedy
by the 'Simplified solution ()f Eq. (IV. 8). Another curve (2) isob-
tained by the finite difference equations (11.17) where the variation
of stiffnesses along the member was taken int() account.
Point B in the figure is the point beyond which the lateral-
torsional buckling occurs in the inelastic range. The combination of
-59
the end moments and the length L at point Bproduces the bendingmo-
ment M at the elastic limit, (M /M=O.5), at the mid-span ofmax max y
the beam-column. This point may be obtained by the fol10wingexpres-
sion: (16)
where
M = M +.max 0
= Mo
1 + r:.o1 -
(IV.11)
7[2 £.EI___.,,;,,0.,...-_ _ 1
ML2o
(IV.12)
for uniform moment.
= 0.23
M is the end moment, P is the axial thrust,o
6Q
is the center deflection of the beam-column. under the end moments
M ..' only, PE
is the :guler buckling in the direction -of the applied end,0 ~
moment, PE
= 7[ Ix1.
2
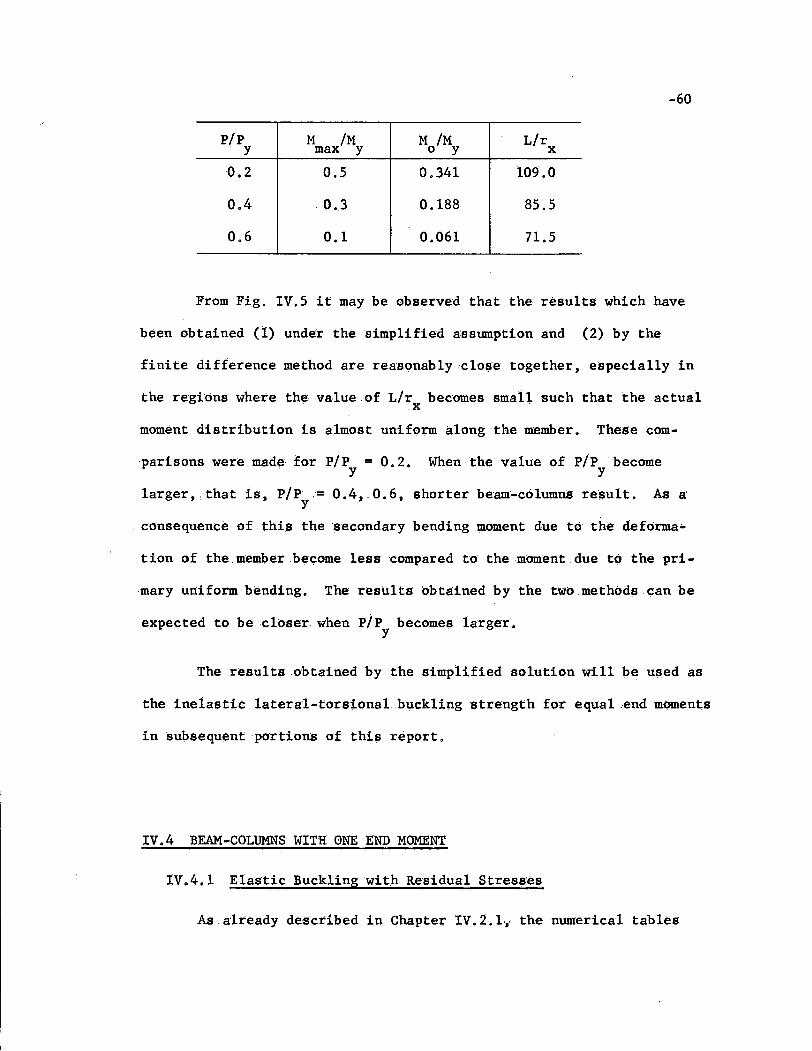
Fbllowing is the M 1M - L/r . values at.the -elastic limit foroy x
the 8WF31 section.
-60
pip M 1M M 1M L/ry max y o y x
0.2 0.5 0.341 109.0
0.4 0.3 0.188 85.5
0.6 0.1 0.061 71.5
From Fig. IV.5 it may be observed that the results which have
been obtained (1) under the simplified assumption and (2) by the
finite difference method are reaspnab1y'c1ose together, especially in
the regions where the value of L/r becomes small ,such that the actual, x
moment distribution is almost uniform along the member. These com·
parisonswer~ made for pip = 0.2. When the value of pjPbecomey y
larger, ,that is; P!Py ,=0.4,.0.6, ~horter beam·co1umns result. As a
consequenee of this the secondary bending moment due to the deforma-
tion of the,memberb~come less compared to the moment due to the pri.
mary uniform bending. The results obtained by the two methods can be
expected to be closer when pip becomes larger.y
The results obtained by the simplified solution will be used as
the inelaStic lateral-torsional buckling strength for equal .end moments
insubsequf;lnt portions of ' this report.
IV.4BEAM-COLUMNS WITH ONE ~ND MOMENT
IV.4.1 Elastie Buckling with Residual Stresses
As already described in Chapter IV. 2.1" the numerical. tables
-61
which are listed in Ref. 32 are .applicable when His replaced by Eq.
(IV.2) for the elastic lateral-torsional buckling including the resi"
dual stress effect.
M'The ratio ( . (} ) for the 8WF3l section is almost. the
Mw/o KoS. cr
same for the case of equal end moment with an axial thrust"and the
residual stress reduction is for all practical.purposes negligible.
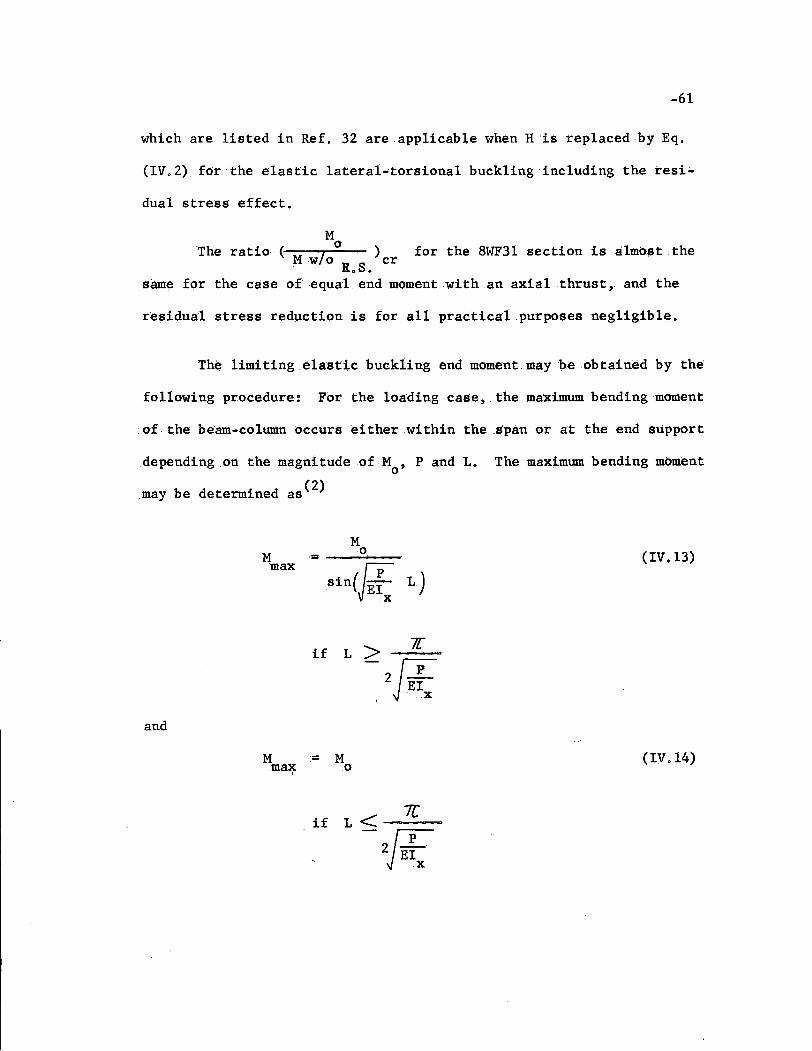
The limiting .elastic buckling end moment maybeobtdned by the
following procedure: For the loading case, the maximum bending moment
of the beam-column occurs either within the span or at the end support
depending on the magnitude of Mo
' P and L. The maximum bending moment
may be determinedas(2)
MM .= 0
max
sin(jE~x L)
if L > 7l
- zJEix
and
M .= Mmax .0,
L< 7[if
- 2JE~ ..x
(IV. 13)
(IV. 14)
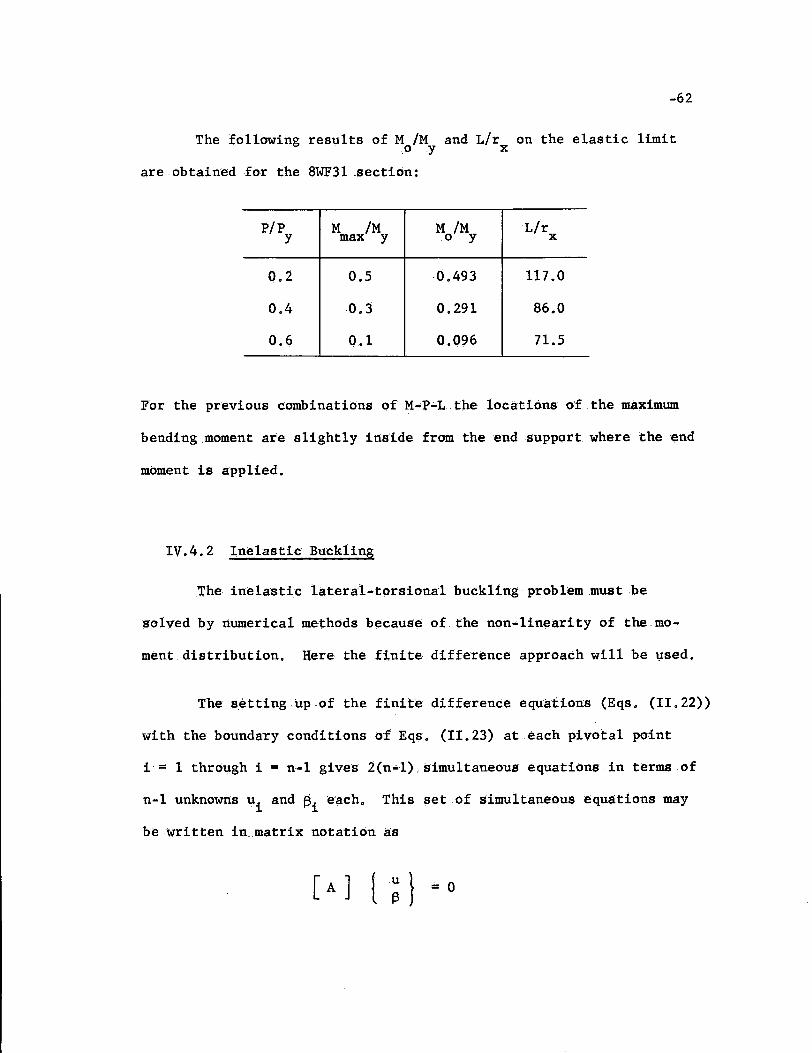
-62
The following results of M 1M and L/r on the elastic litnit.oy x
are obtained .for the 8WF31 .section:
pip M 1M M 1M L/ry max y o y x
0.2 0.5 0.493 117.0
0.4 0.3 0.291 86.0
0.6 0 .. 1 0.096 71.5
For the previous combinatidns of M-P"'L the locations o'f the maximum
bending ,tndment are slight1yins'ide from the end support where the end
moment is applied.
IV.4.2 Inelastic Buckling
'l'he inelastic lateral-torsional buckling' problem must be
solved by rtumerical methdds because of the non-linearity df the md-
ment distribution. Here the finite· difference approach will be l,lsed.
The setting up of the finite difference equations (Eqs. (II. 22»
with the boundary conditions of Eqs. (II. 23) at each pivotal point
i= 1 thrdughi =n-1 gives 2 (n..l) , Simultaneous equations in terms of
n ... l unknowns ui
and ~i e'ach. This set of simultaneous equations may
be written in. matrix ndtation as
-63
In this equation the matrix [A] is a set of the ca~fficients Aij
representing non-dimensional combinations of thecross-sfi!ctional
properties, the load parameters (P and M ), numbers of the subdivio
sion"and the length of the member. If the value of the determinant
IA lis equal to zero", then the assumed combination of P~ Mo and L
is one which causes the bifurcation of the equilibrium, that is, the
start of lateral-torsional b~ckling.
Usually it is not pos,sible to estimate the critical combina-
tion of P, Mo and L ,such that IA 1= 0 at the first trial. Several
values of Mo are tried for given consta:nt values of Pand L"and the
final correct an~er is obtained by interpolation. The initial choice
of Mo' is ,made easier by the existence of knownupPfi!r and lower bounds.
The upPfi!r bound is determined from the fact thatM,.o cannot becr
larger than th~endmomentcorresponding,tofail~re by excessive bend-
ingin the plane of the applied -moments (M 2 .in Fig. 11.1). Ao _max
lower bound is provided by the knOWledge that the most severe loading
,condition exists when two equal ,end moments cause the member to be
bent in single curvature deform~tioh. Since ine1astic,lateral .... tor-
sional buckling solutions for this ca:se have been discussed in the
preceding Chapter IV. 2. 2" the lowest passibleva:lu'e -0£ Mo cr can be
fOUnd.
The upper and lower bounds furnish two envelopes between which
the truea1;1swer must lie. TheseenveloPfi!sare shown as heavy dashed
line's in Fig. IV.6. This figure illustrates the various relationships
-64
which are involved in the solution of the problem. The curves are all
for the 8WF3l shape bent about its strong axis, and they are for a
'constant axial load of 0.2 P •Y
The heavy Hnes in this figure represent the curves of end mo-
ment (Mo/My ' as the ordinate) versus the length of the member (L/rx '
as the abscissa). The upper dashed line gives the upper bound envel-
ope for the case of a beam-column subjected to one end moment only
and failing by excessive bending. At the right end this envelope is
intersected by another dashed line which originates atL = 124 rx
when M = 0, and this curve represents elastic lateral-tOrsional buck()
ling a's mO'dified by the residual stresses. The terminal. point of this
curve at·M . = 0 corresponds to weak axis buckling.tinder axial load.0'
only.
The lower dashed line is for the critical moment tinder equal
.end moments (lower bound) if failure is due to lateral ...torsional buck-
ling. The terminalp()ints of this curve are the criticalwea:k axiS
buckling length 124 rwhen M . == 0, and the plaStic hinge moment modixo
fiedto include the ixial thrust M for L = O.pc
The heavy solid line in Fig. IV.6 represents the solution to
the problem. The circled points are the critical mOments which were
computed by trial and error.
Also'!ilhdwn in this figure are several column deflecttoncurves
(light.solid lineS) having various initial slopes Qo. The values of
-65
all the necessary coefficients in the determinant IA I are known at
discrete points (marked p~ints 0 to 16) along these CDC-s from the
previous calculations.
The detennination of a point on the critical M - L curve iso
achieved by the following procedure for L = 48 r: The value of thex
determinant IA jis determined for several CDC-s whichtermina.te at
L .=48 r between the upper and the lower bound envelopes. In thisx
particular case the computations were made .for the CDC-s having end
slopes Q between 0.07 and 0.09 radians. The critical point is ob'0
tained by linear interpolation of the values of the determinant IA I,as shoWn for the case of P= 0.2 P in Fig. IV.7. For L = 48r, for
y x
example,. four CDC-s were tried, and it .can beseEm that the value 6f
IA I equals zero at M= 0.88 M. The computation of all other pointsy
was performed in the same way, and the resulting IA Iver~JUs Mo cr
curves for various lengths areshQWU in Fig. IV" 7 for P= 0.2 P , iny
Fig. IV.8 for p;= 0.4 P ,.and in Fig. IV.9 for P= 0.6 P.Y Y
The computation of the value of the determinant IAlwas per-
formed with an IBM 1a74 digital computer. For each specific beam-
col~n length the spacing of .the pivotal points on the CDC-s waS
chosen such that the finaLmatrixalways resulted in a 30 x30 array
o-f numbers. The number of. pivotal points within the span is thus
always equal to 15.
The a'ccuracy of the results by finite difference method maybe
improved considerably with.the increase of numbers 6f the subdivisions,
-66
n, along the length of the member. In Ref. 33 the different buckling
problems for the equations with variable eqefficients have been solyed
by finite differenee method, and the advantage to determine the criti-
cal strengths of columns or beams with variable moment of inertia has
been demonstrated. In this refernce, n = 7 was used as a maximum
number of the subdivisions for the axially loaded column with variable
cross sections, and the results were obtained within an error of 2%
as compared with the results by energy method o n = 15 which is used
for the problems in this report will be believed to give a suffiCient
accuracy to the final results of the buckling strength.
,The M-L, curves showing the final results "that is, the curves
for failure by excessive bending" for lateral-torsional buckling with
,one end moment, and for lateral ..torsional buckling with two endmo-
ments are shown in Flg. IV.10, IV.ll and IV.12, for P ,= 0.2 P ,Y
004 Pand 0.6 P " res,pe'ctively. These curves show that lateral-y y
torsional buckling can indeed reduce the strength of the 8WF3l beam-
columns considerably in the inelastic range. The furtherinterpre-
tationof these results will be di,scuss-ed in more detai 1 in Chapter V.
V. I N T ERA C T ION CURVES FOR THE
B E A M - COL U M N STRENGTH
The column
There are two ways of graphical representation of the strength
of the beam-columns: One is to present the critical combinations of
the end moment, M , and the slenderness ratio, L/r , with the axialo x
thrust, P, and the end moment ratio, f ' kept constant. Such curves
may be called column curves. Another way of the presentation is to
give the critical combinations of P and M with L/r and ~ kept conox)
stant, and such curves may be called interaction curves for the beam-
column strength.
In the preceding chapter the solutions of the lateral-torsional
buckling equations were presented for f = 1 and) = O.
curves under the specified values of pip = 0, 0.2, 0.4 and 0.6 werey
shown for the buckling strength of the 8WF3l section.
In this chapter these solutions will be further investigated
and the applicability of the results to other wide-flange shapes and
also to other loading conditions will be discussed. The following
topics will be considered:
(1) Interaction curves for 8WF3l beam-columns failing by
lateral-torsional buckling.
(2) Simplifications for obtaining the interaction curves of
lateral-torsional buckling under equal end moments.
-67-
-68
(3) The influence of the end moment ratios on the lateral-
torsional buckling strength.
(4) Comparison of the theoretical buckling strengths with an
empirical interaction equation.
V.l INTERACTION CURVES FOR LATERAL-TORSIONAL BUCKLING STRENGTH OF THE8WF3l SECTION
In Figs. V.l and V.2 the interaction curves for lateral-tor-
sional buckling strength of the 8WF3l section are presented. These)
curves are obtained from the column curves which have been presented
in the preceding chapter.
Figure V.l shows the interaction curves for equal end moments,
and Fig. V.2 is for one end moment. In both figures the terminal points
of these curves at M/M = 0 correspond to weak-axis buckling under axialp
thrust only. The relationship between axial thrust and slenderness
ratio that occur beyond the elastic limit (pip :>0.7) are obtained byy
considering the residual stress effect on the buckling strength~34) The
relationships of pip and Llr for weak axis buckling under the assumedy x
residual stress pattern (Fig. 111.2) is plotted in Fig. V.3.
Another terminal point of the interaction curves at pip = 0y
correspondsto the lateral buckling strength (P = 0). These points in
Figs. V.l and V.2 are taken from Fig. IV.l and V.17, respectively.

-69
In these figures (Figs o Vol and VoZ) the limiting elastic buck-
ling is also given by shaded 1ines o The lines are obtained from the
tables in Chapter IV.3 and IV 0 4 0 Elastic buckling occurs below the
shaded lines and inelastic buckling above the shaded lines. It is ap-
parent from these figures that the lateral-torsional buckling will be
governed in most practical cases by the inelastic behavior o
V0 2 SIMPLIFICATION FOR THE CALCULATION OF THE LATERAL-TORSIONALBUCKLING STRENGTH WITH EQUAL END MOMENTS
A simple approximate method for obtaining the inelastic 1atera1-
torsional buckling strength of any wide-flange shape under equal end
moments has been deve10ped~4)
It has been shown (4) that the variation of the non-dimension-
a1ized cross-sectional properties
B-:i.EI
Y
,C
w
EI (d - t)ZY
(Vo 1)
fall within a narrow band for all beam type sections (r /r ~ Zo16)x y-
and for all column type sections (r /r ~ 2 0 16), respectively.x y
For column type sections the cross-sectional properties of the
8WF31 section (r /r= 1. 73) could be used for the simplified columnx y
-70
curves. B1-,_B2-, B
3-, and B
4- M/M
pcurves have been obtained by using
the relationships presented in Figs. 111.6 to 111.9. These curves are
shown again in Figs. V.4 to V.7.
The following lateral-torsional buckling equation has been ob-
tained from Eq. (11.19) after manipulating Eq. (V.1):
(V.2)
oThe values of coefficients B1 to B
4in Eq. (V.2) maybe determined
from Figs. V.4 to V.7 for the specified M/M and PIP, respectively.p y
2The influence of the cross-sectional constant ~/Ad on the
buckling strength is predominant compared with other sectional para
meters (1 - tId) and Z/Ad~4) Thus, the lateral-torsional buckling
for different wide-flangeThe values of DT
=2meter ~/Ad •
strength of wide-flange beam-column is primarily governed by the para
~ x 106
Ad 2
shapes have been calculated and they were listed in Ref. 4.
In Fig. V.8 a comparison is made between the inelastic buckling
strength of the 14WF142 (DT = 1580) section computed by the analytical
methods of Ref. 4, and the simplified method are obtained from Eq.(V.2)
and by Figs.V.4 to V.7. The simplified results give a good agreement
with the results which have been obtained through the complicated com-
putationa1 procedure. In Fig. V.8 the column curve of the 8WF31 sec-
tion (DT = 925) is also shown. The difference of cross-sectional dimen-
-71
sions (reflected mainly in the variations of the values of DT) between
the 14WF142 and the 8WF31 sections show that a considerable difference
of the buckling strength exists between these two sections.
V.3 INFLUENCE OF THE END MOMENT RATIO
In Figs. IV.1O to IV.12 the column curves have been presented
for f = 1 and also for J = o. It is obvious that the critical end
moment for ) = o is always higher than that for Y = 1 if the axial
thrust and the beam-column length are held constant.
It is desirable to know the buckling strength of the member
under any arbitrary ratio of end moments without going through the
complicated procedures presented in Chapter IV for each loading case,
and to be able to estimate the buckling strength from the known strength
for ) = 1 which can be obtained directly from the approximate buckling
equations discussed previously.
As an index of the relationships of critical end moments for
different end moment ratios the "Equivalent Moment" concept has been
'd 1 d(35),(36),(16)WI. e y use • The "Equivalent Moment" may be defined as
the modified critical equal end moments by which the unequal end mo-
ments are replaced if the axial thrust and the member length are held
constant.
The problem is as follows; it is required to find a relationship
between the two equivalent equal end moments, Mo f l' and the actual
end moments, Mo r ' if P and L are held constant, at failure.
-72
The results are present in such a form that the ratio
V.3.1 Elastic Lateral-Torsional Buckling
The relationships between Mo r = 1 and Mo f in the elastic
range have been thoroughly investigated~33),(35),(36),(37) These re-
suits are plotted for I and wide-flange shapes in Fig. V.9.
Mo f=l
Mo fdoes not depend on the values of P and Llr for each specified end
x
moment ratio,j. These empirical curves in Fig. V.9 are close to-
gether for f > O. However, for f -< 0 the relationship between
Mo f = 1 and Mo f gives quite different results for each empirical
curve.
V.3.2 Inelastic Lateral-Torsional Buckling
In Fig. V.10 the ratio M (J 1M fo ) = 1 0 = 0
as ordinate versus
pip as abscissa is shown for end moment ratio y = O. The points whichy
are designated by the symbol. for pip =0.2,0.4 and 0.6 representy
the theoretical results for the 8WF31 section and the symbol .& for
pip = 0.3, 0.4, 0.5 and 0.6 represent the test results for the DIE20y
bt ' d' R f 35 * I h' f' M ' . (35)** ,o a~ne ~n e. • n t ~s ~gure assonnet s equat~on g~ves
*The detailed presentation of the test results will be included inChapter VI.
0.548 Mo f =0 Mo r =0'= 0

-73
M~ = I f = 0
00.548 for=M
0 f = 0
and the AISC's(38)
M f = I00.6M
0 r= 0
are also shown as horizontal lines.
It can be seen that the values due to Massonnet and the AISC
are conservative when compared with the actual theoretical and the
test points. The scatter of these points is caused by the different
values of L/r and p/p , and thus Massonnet's and AISC's values,x y
which have been developed for elastic buckling, are no longer valid
in the inelastic range.
If these same points are replotted against another parameter
----------=M:~J f= 1M:~t.) y= 0
M p.ult. I = 1
Mult. f = 0
as ordinate which is shown in Fig. V.II, the scatter of these new
points in Fig. V.II become considerably smaller. A horizontal line
0.88
-74
is obtained by taking the mean value of the theoretical points. This
parameter is nearly independent of P and also L/r •x Mult f = 1 and
Mult f = 0 are the maximum end moments if failure occurs due to exces
sive bending in the plane of the web under equal end moments and one
end moment t respectively. These moment values correspond to Mo max
in Fig. 1I1.ll for f = 1 and M02
in Fig. 11.1 for r = O. The nu-max
merical values tabulated for M for differentare ult. L PM
vs vs.,P. (39) r
end p x ymoment rat~os.
From Fig. V.ll the relationships between inelastic lateral
torsional .buckling strength of wide-flange shapes for r= 1 and for
) = 0 will be expressed in ~ simple
against the parameter :0 r =1 /o f =0
dependent quantities of P and L/r •x
form if the values are plotted
Mult • r =1 and they are the inMult • f =0
The relationship will become as
Mo r =1M
o f =0= 0.88
Mult • r =1Mult. f =0
(V.3)
The moment Mo f = 0 is thus determined by Eq. (V.4) empirically
without going through the complicated procedures if the values of
M c> It M 1 Oland M 1 c> __ 0 are known.o ) = u t ) = u t JThus
= 1.14 M (Mult . f=o )o 0=1 M
J ult.f=l":',(V.4)
Comparison will next be made between the results which are ob-
tained by the analytical method described in Chapter IV and by the
)=
~=
-7S
simplified equation (V.4). In Figs. V.12 to V.lS the interaction
curves for Mult ~= l' Mult f= 0' Mo f= l' Mo f= 0 and for Mo f = 0
which is calculated by Eq. (V.4) are plotted for specified L/r • Thex
simplified solution Mo f= 0 gives a good agreement with the theore
tical value of Mo f = o·
The general relationships of the buckling strength between
1 and ) = iwi1l be determined by extending the results between
p Mo Y=1 ! Mu1t f=:l1 and ) = O. In Fig. V.16 M M versus the endof=i u1tf=!
moment ratio ) i shown for ) = -1 to +1. The curve for negative
values of f is linearly extrapolated from those values for r= 1 to O.
The relationship between Mo f = 1 and Mo f for an arbitrary
value of f = i may be expressed by one of the empirical curves in Fig.
V.9 in the elastic range and the corresponding relationships in the
inelastic range can be represented by Fig. V.16.
The influence of the end moment ratio on the inelastic buck-
ling strength, therefore, will be represented by the following formula.
Mo
( 0.88 + 0.12 ) ) (V .. S)
Thus, Mor ' the critical end moment which is taken as the nu
merically larger of the two moments under an arbitrary end moment ra
tio ) , will be determined by Eq. (V.S) if the Mu1t
for the end moment
ratio r is known.
-76
As a special case) if no axial thrust is applied to the member)
Mu1t r= 1 = Mu1t f = Mp in Eq. (V.5), and this leads to the follow
ing relationship in the inelastic range:
0.88 + 0.12 )' (V.6)
In this case Mo f = 1 corresponds to the lateral buck1:i,ng strength
under pure bending in the inelastic range. Equation (V.6) gives the
inelastic lateral buckling strength Mo f for unequal .end moment ratio
f if Mo ) = 1 is known.
For ) = 0 Eq. (V.6) becomes equal to Eq. (V.6.1») that is
(V.6.1)
In Fig.V.17 the inelastic lateral buckling curve is shown for
)= 0 which is determined from Eq. (V.6.1). In this figure the buck
ling curve for f = -1 which is obtained from Eq. (V.6) for) = -1 is
also shown.
V.4 COMPARISON WITH.AN INTERACTION.EQUATION
Since a rigorous analytical solution of the beam-column strength
is generally too complicated for estimating the critical combination of
M-P-L for each different loading conditions 7 an approximate empirical
-77
formula may be established for practical design purposes. In this
section comparison is made between the theoretical results of this
report and such an empirical interaction equation.
The following equation is one that has been suggested(3S),(40)
as a design formula for I and wide-flange beam-columns (similar equa-
. d di d· ·f·· 116),(38)t~ons were a opte n current es~gn spec~ ~cat~ons:J
PP
o+
M .egu~
M(1 --p-.)o P:E
= 1 (V.7)
In non-dimensionalized form
P Megui
P MY Y
+ 1P M ( P!p )0 o yP My 1 - PiE/ P
yY
(V.8)
where P = axial thrust
Euler load for elastic buckling in the planeof the web, that is,
2 EI7C x
L2
PE--=P
Y
8,970
(L/r )2x
(V.9)
P = maximum axial load for the axially loaded column.o It represents the Engesser-Shanley formula for in-
elastic buckling in the weak direction.
Mo
= maximum bending moment for the member subjectedto pure bending.

M .equ~
= equivalent end moment applied to the memberas described in the preceding section.
-78
A comparison will be made between the interaction equation,
Eq. (V.8) and the calculated points for the 8WF3l section. The com-
ponent parts of the interaction equation are obtained as follows:
po
py
Mo
My
M .equ~
My
weak axis buckling including the residual stresses, asobtained for each specified L/r from Fig. V.3.
x
lateral buckling strength, as obtained for eachspecified L/r from Fig. IV.l.
x
equivalent end moment, calculated for differentloading cases:
M .e9u~ =M
Y
(1) for equal end momentsobtained from Fig. IV.2.
Mo f=l
MY
as
(2) for one end momentby Massonnet!ls formula
Mequi = j 0.3 (M12+M2
2) + 0.4 MlM2
= 0.548 Mo r=0
by the proposed formula
(Mult f .=1 )
M i = 0.88 M p 0 Mequ 0 I = ult r =0
(V.lO)
(V. 11)
M .eMu~ is calculated by both equations (V.lO) and (V. 11) where
yMo r=0 can be taken from Fig. IV.lO to IV.12.
In Fig. V.18 the interaction equation and the theoretical re-
suIts are presented for pip as ordinate against M i/M (l-P/P.E") aso equ 0
-79
abscissa. The interaction equation~ Eq. (V.7), is shown as a straight
line between the points (0.1) and (1.0)! Following are the summarized
results from Fig. V.18:
(1) For the points for equal end moments which are designated
by the symbol 0,6 ~O Eq. (V.7) gives results on the con-
servative side. Equation (V.7) is too conservative for
several points.
(2) If Mo f = 0 is replaced by the Mequi = Mo f = 1 by some
exact method~ the points for f = 0 should coincide with
the points for -r:;; 1 in Fig. V.18.
(3) If Mo f = 0 is replaced by Massonnet I s formula, Eq. (V.10),
M . = 0.548 M ~ the points which are designated by theequ~ 0
symbol .~ A~. are replaced in six out of ten on the left
side of Eq. (V.7). For the points which are below Eq.
(V.7), Eq. (V.7) over-estimates the buckling strength.
(4) If M (' 0 is replaced by the M i given by the proposedo ) = equ
formu1a~ Eq. (V.11), the points which are designated by
the symbol <I, &,~ will be above Eq. (V.7). These points
also come too close to the points 0, A, 0 for each corres-
ponding pip and L/r. It is concluded thatEq. (V.7)y . x
gives the fairly good conservative estimation for f = 0 if
M . is calculated byEq. (V.11).equ~
VI. COMPARISON WIT H T EST RES U L T S
In this chapter theoretical results presented in this report
will be compared with test results.
The interaction curves which were developed in non-dimensional
forms in Chapters IV and V have been constructed for a steel for
which ~ = 33 ksi. The curves are not directly applicable for ay
steel for a different yield stress. The following adjustment must
be made on the L/r to account for the different yield stress on thex
beam-column prob1ems~10)
(VI. 1)
Equation (VI.1) is to be used when comparing test results for
a material having a yield stress ~ other than 33 ksi with they
theoretical predictions of the buckling strength.
The lateral-torsional buckling strength of wide-flange beam-
columns for equal end moments has been compared with the several
column test results and good agreement between theoretical prediction
and the test results has been obtainea~4)
In this chapter the comparison will be made for tests under one
end moment. The relationship of the buckling strength between ) = 1
and } = 0 will also be investigated from the test results.
-80-
-81
VI.l UNIVERSITY OF LIEGE TESTS
A large number of column tests were performed by Massonnet
and Campus~35) The tests were carried out on sections of DIE 10,
DIE 20 and PN 22 profiles. Of these, the DIE profiles are geometri-
cally similar to the wide-flange shape.*
Figure VI.l shows the comparison between the tests on mem-
bers subjected to one end moment with an axial thrust and the theore-
tical curves for the 8WF3l section. Threeeccentricity parameters
2ec/r' were used: 0.5, 1.0 and 3.0.
x
expressed as:
2The parameter ec/r can bex
M d M 1Mec 0 2 o y=
2 P I pipr x yx
A
Thus,
M( :c2 )
p0 (VI.2).=
M PY x Y
In Fig. VI.l the theoretical curves for the 8WF3l section
gives conservative predictions for the test results of the DIE 20,
and of DIE 10 shapes. Based on the lateral-torsional characteristics,
DT,(4) the sections DIE20 (DT = 1170) ,and DIE 10 (DT = 2880) are
*The applicable test data for the DIE profile tests are summarized inTable 4 of Ref. 10.
-82
stronger than the 8WF3l section (DT
= 925). These differences of the
buckling characteristics between the DIE sections and the 8WF3l section
may explain the differences of the theoretical curves and the test
points in Fig. VI.l satisfactorily. In Fig. VI.l the theoretical
curves(lO) predicted due to failure by excessive bending give also
good agreement with the test results for L/r less than 50. In thisx
range of L/r the theoretical predictions both due to excessive bendx
ing and due to lateral-torsional buckling would be expected to become
close for the DIE 20 section.
Another investigation was made by using the test results: The
influence of end moment ratios to the buckling strength was presented
in Fig. V.ll. The test results gave good correlation with the theore
tical ones if both were plotted against the parameter Mo f =1 / Mult r=1M M
o f=O ult f =0as shown in Fig. V.ll. In this figure the critical end moments for
specified L/r and pIp of the DIE 20 sections were obtained from thex y
interaction curves which were constructed by using the applicable data
listed in Table 4 of Ref. 10.
VI.2 RECENT LEHIGH TESTS
A number of beam-columns have been tested under various loading
conditions at Lehigh University. A summary of these tests :1:s," pre-
sented in Ref. 41. Of these, two tests (Test No. T-23 and T-3l) corres-
ponding .to the loading condition, ~= 0, are chosen to compare with the
theoretical results of this report.
-83
In Figs. VI.2 and VI'.3 end moment, M 1M , versus end rotation,o p
Q, relationships under specified pip and L/r are shown for tests ony x
4WF13 member. Both columns failed after the initiation of lateral-
torsional buckling in the inelastic range. The theoretical curves(30)
for 8WF3l which failed due to the excessive bending are also plotted
in these figures. The corresponding maximum moment is M 2 •o max Com-
parisons of lateral-torsional buckling strength are made between the
test results of the 4WF13 section (DT
= 2360) and the theoretical re
sults of the l4WF142 (DT
= 1580) and of the l4WF246 sections (DT= 3712).
The theoretical values, Mo ' are determined by the proposed formulacr
for(Eq. V.4), where the corresponding values of Mo f = 1 and Mult
) ~ 0 and for f = 1 are taken from Refs. 4 and 39, respectively. From
these figures, good correlation is seen between the test results and
the theoretical predictions for the l4WF142 section.
VII. SUMMARY AND CON C L U S ION S
This dissertation may be summarized as follows:
(1) The differential equations of lateral-torsional buckling are
developed for a singly symmetric cross section about the weak
axis. The differential equations for inelastic buckling are
essentially the same forms as for elastic buckling if the co
efficients are modified by the effects of yielding.
(2) Variation of the coefficients during partial yielding of the
cross section are determined. The influence of an assumed
residual stress distribution is included. The value of any
coefficients in the differential equations may be obtained
directly from routine works by a digital computer (LGP-30)
for any combination of axial thrust and bending moment.
(3) Since the coefficients change their value with the inelastic
bending moment distribution along the length of the member,
the solutions are obtained on the basis of a finite difference
approximation of the differential equations, the resulting
characteristic determinant being .solved numerically by a digi
tal computer (IBM 7074).
(4) The lateral-torsional buckling strengths are presented numeri
cally for the cases of equal end moments and of one end moment.
-84-
-85
(5) lnf1uence of the end moment ratios on the inelastic 1atera1
torsional buckling strength are investigated.
The following conclusions can be drawn from the results of this
work.
(1) A residual stress reduction in the elastic lateral-torsional
buckling strength is for all practical purposes negligible.
(2) A large reduction in the inelastic lateral-torsional buckling
strength results as a presence of residual stresses.
(3) For the case of equal end moments with an axial thrust a sim
plified solution which is obtained by assuming the value of the
above named coefficients are the same along the member gives
good approximation compared with an exact solution which in
cluded the variation of the coefficients due to the axial thrust
effect.
(4) Inelastic lateral-torsional buckling of the wide-flange beam
column problems are solved numerically by finite difference
method for the case of applied one end moment with an axial
thrust.
(5) General relationships of the inelastic lateral-torsional buck
ling strength for different end bending moment ratios are pre
sented. The inelastic buckling strength under unequal end bend
ing moments can be determined empirically by the proposed for-':"
mula (Eq. V.5).
-86
(6) The comparison with the tests shows good correlation between
the theoretical results and the test results.
The method presented for the 'solution of the inelastic lateral
torsional buckling under moment gradient may be used for other materials
and cross-sectional shapes.
VIII. NOMENCLATURE
Area of cross section
A lateral-torsional coefficient
St. Venant torsional stiffness
.A shear center distance coefficient
,lmoment coefficient
Eccentricity of axial thrust
Warping stiffness
Eccentricity ratio
Shape factor. F = zis
Smaller of the two end eccentricities
Larger of the two end eccentricities
Young's modulus of elasticity
Depth of section
Modified torsional stiffness due to the effect ofresidual stress
Bending stiffness about x-axis (strong axis stiffness)
A torsional
Bending stiffness about y-axis (weak axis stiffness)
Cross-sectional coefficient in finite difference equations
Flange width
Square matrix of cross-sectional coefficients
Determinant of cross-sectional coefficients
A bending stiffness coefficient
A warping stiffness coefficient
A
Aij
IA I[AJ
Bx
BY
Bl
B2
B3
B4
b
CT
Cw
C
DT
d
E
eclr2
x
ey
eyB
eyT
f
-87-
G
H
h
I p
Iw
I w,s
Iw,n
L
M
M .equ~
Mo
Mo cr
M01 max
M02 max
-88
Modulus of elasticity in shear
Equivalent torsional stiffness
Distance between pivotal points
Polar moment of inertia
Warping constant
Warping constant defined by the change of warping alongthe center line of each element
Warping constant defined by the change of warping alongthe normal to the center line of each element.
Moments of inertia about x and y axes, respectively
Effective moments of inertia of the tension and compression flanges about y axis, respectively
St. Venant torsional constant
Length of beam-column
Bending moment
Equivalent end bending moment for beam-column
Applied end bending moment
End bending moment at which the beam-column buckleslaterally
Maximum end bending moment due to lateral-torsionalbuckling
Maximum end bending moment at which the beam-columnfails by excessive bending in the plane of applied endmoment
Mo f =1' Mo r=0' Mo f =i Larger of the two end bending moments for
end moment ratio f= 1, f = 0, Y= i, respectively
MP
Mpc
Plastic moment
Plastic hinge moment modified to include the effect ofaxial thrust
Mu1tf=1'
Mw/o R.S.
M,Mx Y
MY
-89
Mu1t r=0' Mu1t f=i Maximum end bending moment failed by
excessive bending for end moment ratio ) = 1, f= 0, f= i,respectively
Critical end moment without the effect of residual stresses
Bending moment about x- and y-axis, respectively
Moment at which yielding first occurs in flexure (~rc = 0)
Larger of two end moments on a beam-column
Smaller of two end moments on a beam-column
Components of Mr
M~ , M7 ' M~ Moment about ~ 7 and ~ axis, respectively
n
0
P
PE
P0
PY
Pf ' P 7
Qy
r x ' ry
S
Component of Mr due to pure torsion and due to warpingtorsion, respectively
Number of subdivisions
Location of centroid
Axial thrust
Euler buckling load in the plane of enforced bending
Buckling load of axially loaded column
Axial load corresponding to yield stress level, P Aa-y y
Component of P about rand 7 axis, respectively
Reaction forces at both ends in y-axis
Radius of gyration about x- and y-axis, respectively
Location of shear center
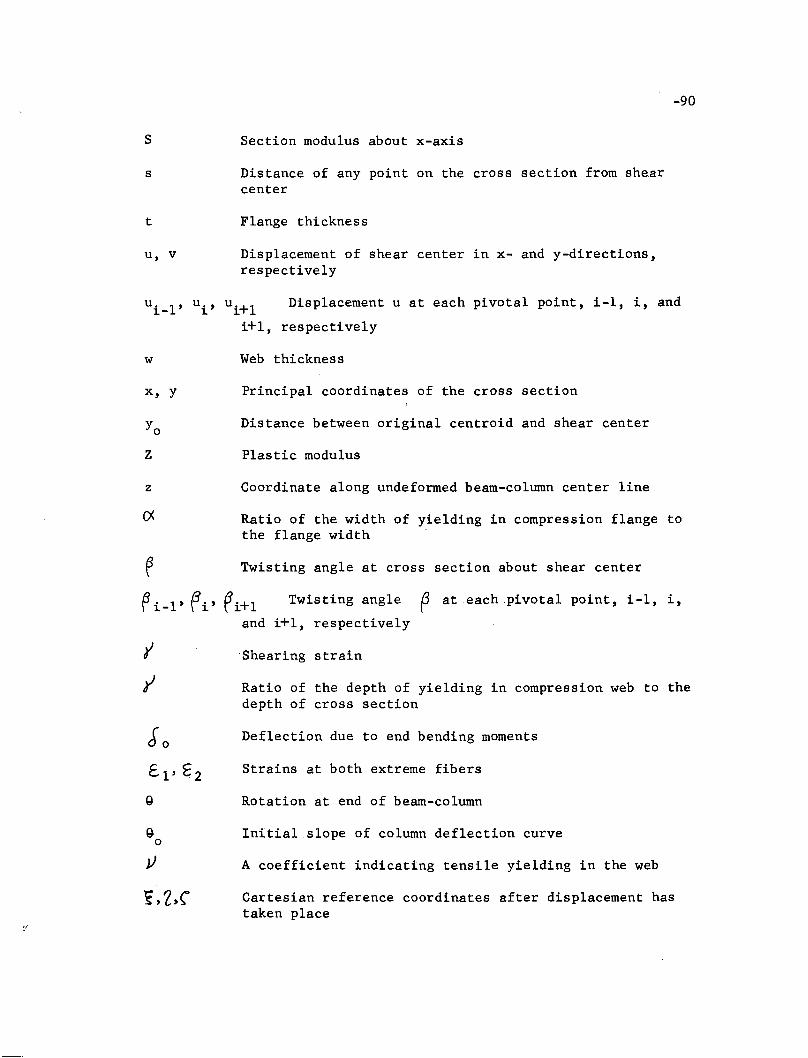
S
s
t
u, v
Section modulus about x-axis
Distance of any point on the cross section from shearcenter
Flange thickness
Displacement of shear center in x- and y-directions,respectively
-90
ui _1 ' ui ' ui+1 Displacement u at each pivotal point, i-1, i, and
i+1, respectively
w
x, y
z
z
0<
Web thickness
Principal coordinates of the cross section
Distance between original centroid and shear center
Plastic modulus
Coordinate along undeformed beam-column center line
Ratio of the width of yielding in compression flange tothe flange width
Twisting angle at cross section about shear center
~i-1' ~i' ~i+1 Twisting angle P at each pivotal point, i-1, i,
and i+1, respectively
Shearing strain
Ratio of the depth of yielding in compression web to thedepth of cross section
Deflection due to end bending moments
Bo
Strains at both extreme fibers
Rotation at end of beam-column
Initial slope of column deflection curve
A coefficient indicating tensile yielding in the web
Cartesian reference coordinates after displacement hastaken place
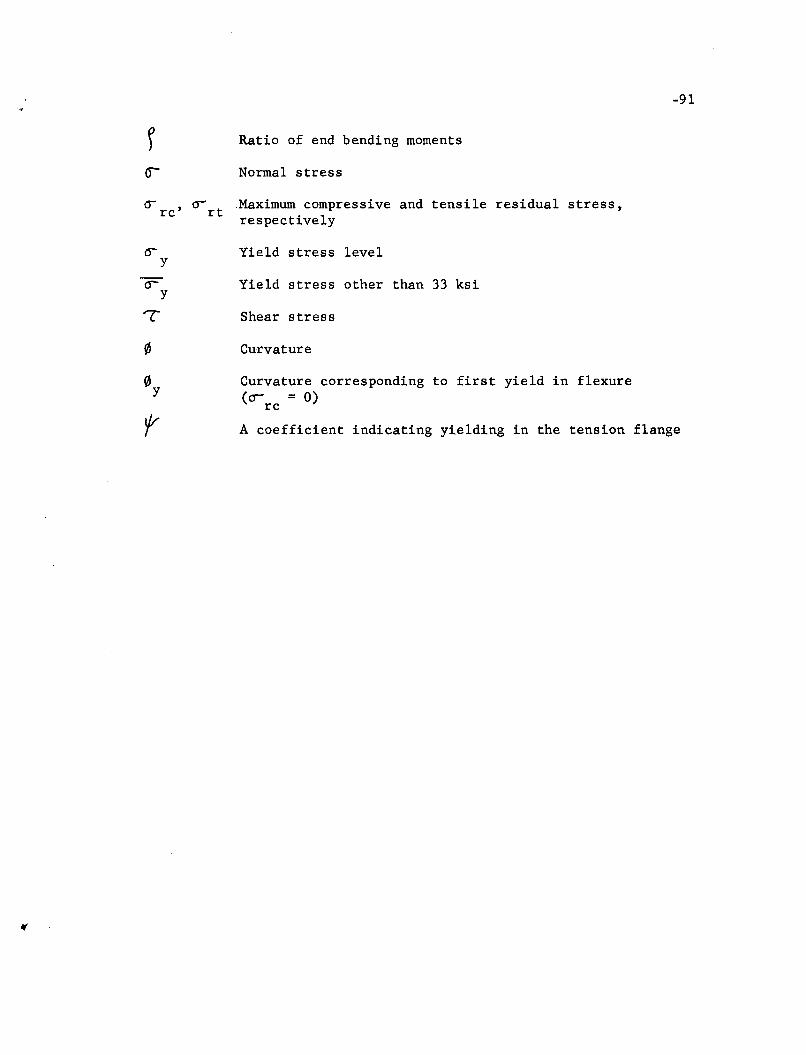
-91
Ratio of end bending moments
Normal stress
~ O-Maximum compressive and tensile residual stress,rc' rt respectively
t(
(Jy
()y
Yield stress level
Yield stress other than 33 ksi
Shear stress
Curvature
Curvature corresponding to first yield in flexure(<J = 0)rc
A coefficient indicating yielding in the tension flange
IX. REF ERE N C E S
1. Bleich, F.BUCKLING STRENGTH OF METAL STRUCTURES, McGraw-Hill,New York, 1952
2. Timoshenko, S.; Gere, J.M.THEORY OF ELASTIC STABILITY, McGraw-Hill, New York, 1961
3. Lee, G.C.A SURVEY OF LITERATURE ON THE LATERAL INSTABILITY OFBEAMS, Welding Research Council Bulletin 63, p. 50,August 1960
4. Galambos, T.V.INELASTIC LATERAL-TORSIONAL BUCKLING OF ECCENTRICALLYLOADED WF COLUMNS, Ph.D. Dissertation, Lehigh University,1959
5. White, M.W.THE LATERAL-TORSIONAL BUCKLING OF YIELDED STRUCTURALSTEEL MEMBERS, Ph.D. Dissertation, Lehigh University,1956
6. Lee, G.C.INELASTIC LATERAL INSTABILITY OF BEAMS AND THEIR BRACINGREQUIREMENTS, Ph.D. Dissertation, pp.22-29, LehighUniversity, 1960
(.
7.
8.
" 9.
10.
Kusuda, T.; Sarubbi, R.G.; ThUrlimann, B.THE SPACING OF LATERAL BRACING IN PLASTIC DESIGN , FritzEngineering Laboratory Report No. 205E.11, Lehigh University, 1960
WRC-ASCECOMMENTARY ON PLASTIC DESIGN IN STEEL, pp. 50-63, Manual41, 1961
Lee, G.C.; Galambos, T.V.POST-BUCKLING STRENGTH OF WIDE-FLANGE BEAMS, Froc. ofASCE, Vol. 88, No. EM1, February, 1962
Galambos, T.V.; Ket.ter, R.L.COLUMNS UNDER COMBINED BENDING AND THRUST, ASCE Trans.,Vol. 126, Part I, p.1, 1961
-92-
-93
11. Ketter, R.L.FURTHER STUDIES ON THE STRENGTH OF BEAM-COLUMNS, Proc.ASCE, Vol. 87, ST6, August, 1961
12. Haaijer, G.ON INELASTIC BUCKLING IN STEEL, Proc., ASCE, Vol. 84,No. EM2, April, 1958
13. WRC-ASCECOMMENTARY ON PLASTIC DESIGN IN STEEL, pp.42-50, Manual41, 1961
14. Galambos, T.V.; Lay, M.G.END-MOMENT END-ROTATION CHARACTERISTICS FOR BEAM-COLUMNS,Fritz Engineering Laboratory Report No. 205A.35, May 1962
15. Shanley, F.R.APPLIED COLUMN THEORY, ASCE Trans., Vol. 115, p. 698,1950
16. Column Research CouncilGUIDE TO DESIGN CRITERIA FOR METAL COMPRESSION MEMBERS,Chapter II, Column Research Council, 1960
17. Goodier, J.N.THE BUCKLING OF COMPRESSED BARS BY TORSION AND FLEXURE,Cornell University Experimental Stations, Bulletin No.27, 1941
18. Timoshenko, S.THEORY OF BENDING, TORSION AND BUCKLING OF THIN-WALLEDMEMBERS OF OPEN CROSS SECTION, Journal of the FranklinInstitute, 1945
19. Ketter, R.L.; Kaminsky, E.L.; Beedle, L.S.PLASTIC DEFORMATIONS OF WIDE-FLANGE BEAM-COLUMNS, ASCETrans. Vol. 120, p. 1058, 1955
20. Flint, A.R.THE STABILITY AND STRENGTH OF STOCKY BEAMS, Journal ofMechanics and Physics of Solids, 'I (90), 1953
21. Wittrick, W.H.LATERAL INSTABILITY OF RECTANGULAR BEAMS OF STRAINHARDENING MATERIAL UNDER UNIFORM BENDING, Journal ofAeronautical Science, 19 (12), 835, December 1952
(
22. Neal, B.G.THE LATERAL INSTABILITY OF YIELDED MILD STEEL BEAMS OFRECTANGULAR CROSS SECTION, Phil., Trans. of Royal Society,Vol. 242, Series A, January 1950
-94
23. Horne, M.R.CRITICAL LOADING CONDITIONS OF ENGINEERING STRUCTURES,Ph.D. Dissertation, Cambridge University, 1950
24. Reuss, A.BERUCKSICHTIGUNG DER ELASTISCHEN FORMANDERUNG IN DERPLASTIZITATSTHEORIE, Z. angew. Math. &Mech., Vol. 10,p.266, 1930
25. Hill, R.; Siebel, M.P.L.ON COMBINED BENDING AND TWISTING OF THIN TUBES IN THEPLASTIC RANGE, Phil. Mag. 42(7), P.772. 1951
26. Prager, W.; Hodge, p.G.THEORY OF PERFECTLY PLASTIC SOLIDS, John Wiley & Sons,New York, 1951
27. Haaijer, G.; Th~r1imann, B.COMBINED COMPRESSION AND TORSION OF STEEL TUBES IN THESTRAIN-HARDENING RANGE, Fritz Engineering LaboratoryReport 241.2, Lehigh University, 1956
28. Oja1vo, M.RESTRAINED COLUMNS, Ph.D. Dissertation, Lehigh University, 1960
29. Chwa11a, E.AUSSERMITTING GEDRUCKTE BAUSTAHLSTABE MIT ELASTISCHEINGESPANNTEN ENDEN UND VERSHIEDEN GROSSEN ANGRIFFSHEBEN,Die Bautechnik, 10, Jahrgang 49-57, 1937
30. Oja1vo, M.; Fukumoto, Y.NOMOGRAPHS FOR THE SOLUTION OF BEAM-COLUMN PROBLEMS,Welding Research Council Bulletin No. 78, June, 1962
31. Galambos, T. V.INELASTIC LATERAL BUCKLING OF BEAMS, Fritz EngineeringLaboratory Report No. 205A.28, Lehigh University, October,1960
32. Sa1vadori, M.G.LATERAL BUCKLING OF I -BEAMS, ASCE Trans., Vo 1•. 120,p. 1165, 1955
33. Sa1vadori, M.G.NUMERICAL COMPUTATION OF BUCKLING LOADS BY FINITE DIFFERENCES, ASCE Trans., Vol. 116, p. 560, 1951
-95
34. Huber, A.W.; Beedle, L.S.RESIDUAL STRESS AND THE COMPRESSIVE STRENGTH OF STEEL,Welding Research Supplement, Vol. 33, 1954
35. Campus, F.; Massonnet, C.RECHERCHEZ SUR LE FLAMBEMENT DE COLONNES EN ACIER A-37,A PROFIL EN DOUBLE TE~ SOLLICITEE OBLIQUEMENT, IRSIABulletin No. 17, 1956 .
36. Horne, M.R.THE STANCHION PROBLEM IN FRAME STRUCTURES DESIGNEDACCORDING TO ULTIMATE CARRYING CAPACITY, Froc. Inst.of Civil Engrs. Part III, Vol. 5, No.1, p.105, April1956
37. Nylander, H.·TORSIONAL AND LATERAL BUCKLING OF ECCENTRICALLY COMPRESSEDI AND T COLUMNS, Trans. Royal Inst. of Tech., No. 28, 1949
38. AISCSPECIFICATION FOR THE DESIGN AND ERECTION OF STRUCTURALSTEEL FOR BUILDING, 1961
39. Galambos, T.V.; Prasad, J.ULTIMATE STRENGTH TABLES FOR' BEAM-COLUMNS, Welding Research Council Bulletin No. 78, June 1962
40. Massonnet, C.STABILITY CONSIDERATIONS IN THE DESIGN OF STE.EL COLUMNS,Froc. ASCE, Vol. 85 No. ST7, September 1959
41. Van Kuren, C.; Galambos, T.V.BEAM-COLUMN EXPERIMENTS, Fritz Engineering LaboratoryReport No. 205A.30,. July 1961
X. TAB L E S AND FIG U RES
-96
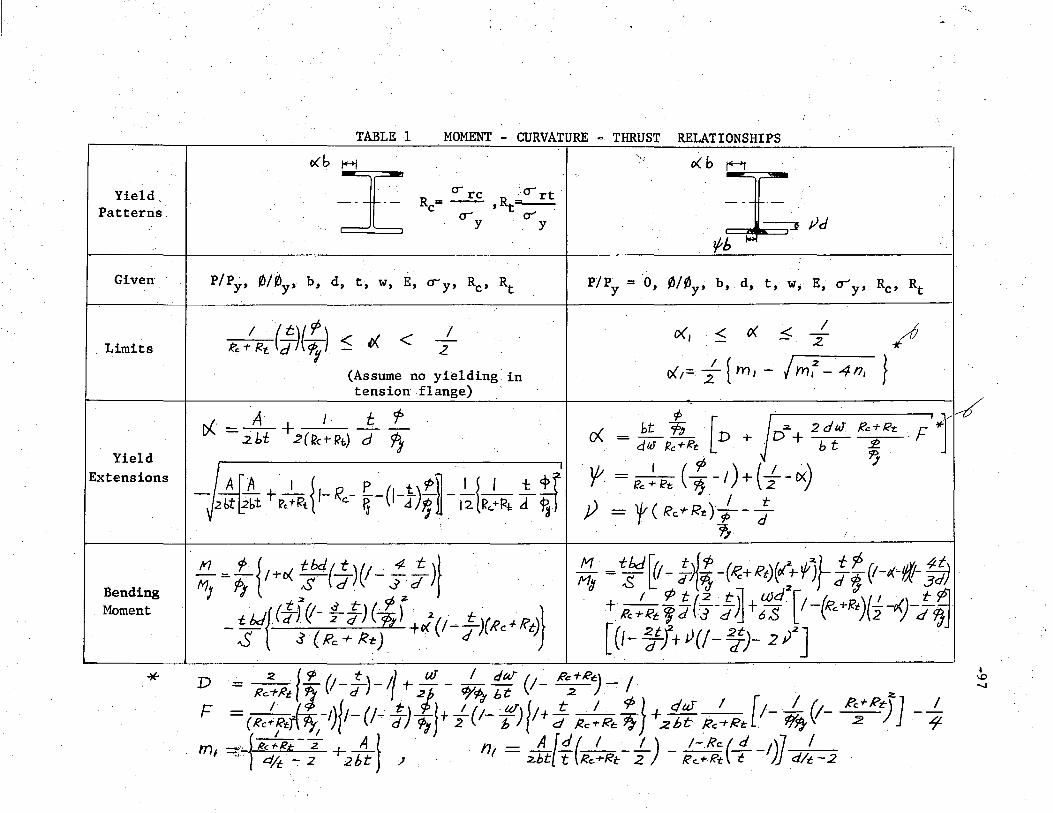
Yield ..Patterns
TABLE 1
oCb:1L.:JC
MOMENT - CURVATURE c THRUST RELATIONSHIPS
.......
Given
. Limits
. YieldExtensions
I ··('t)/rf\ I~cTRt d1tcf
11 < (/. < L.
(Assume no yielding intension flange)
0( < ()( <~ A, - - 2. '*
fit= ;. [tn, - I rn,2 -4n, }
BendingMoment
*

YieldPatterns
,.
TABLE 1 - CONTINUED
£. =rId
;'
----
Given
Limits
YieldExtensions
BendingMoment
:,
; < r < I"'::Rc i- Rt 1J /
2(1-1) < ~ :-:;;: I-)!
M UJd2G. ." r Z ( . At: ¢-. =- 1- y- -) 1+21--r..=...)-MfJ 6S· d 4 .'1'/1
.+:tt[{(!-Y)(t-;:;J-j (I-1J){d)J; -~ (J-J)(~+g~
+ ~ y, ~ /-j+- S f2. < /- Y/.(/ -1:1 RcrRt. < 12 < / _ I,or I Jz + fh +Rt -
I\0ex>
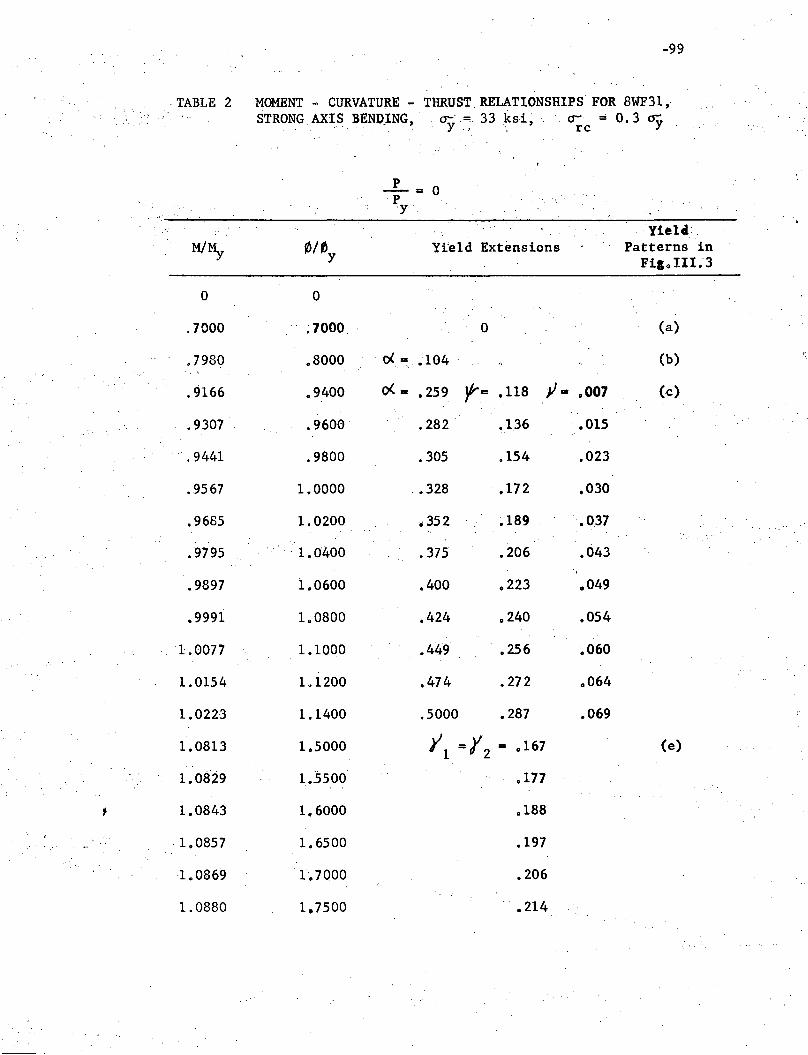
-99
,TABLE 2 MOMENT - CURVATURE - THRUST, RELATIONSHIPS FOR 8WF31 ,STRONG AXIS BENl>.ING, ,fr'= 33 ksi,' ',cr :;: 0.3 O::y
Y ,0' rc
P-= 0P
Y
Y1eldM/My fJ/tJy
Yi'e1d Extensions Patterns inFiCo III. 3
0 0
.7000 .7000, 0 (a)
.7980 .8000 ' 0( = .104 ' (b)
.9166 .9400 0(= .259 t= .118 y. .007 (c)
.9307 ~9600' .282 .136 .015
, .9441 .9800 .305 .154 .023
.9567 1.0000 .328 .172 .030
.9685 1.0200 .. 352 ~189 ' .037
.9795 ' 1.0400 .375 .206 .043
.9897 1.0600 .400 0223 0049
.9991 1.0800 .424 .240 .054
1.0077 1.1000 .449 .256 0060
1.0154 1.1200 .474 .272 0064
1.0223 1.1400 .5000 .287 .069
1.0813 1.5000 I =i = .167 (e)1 2
1.0829 1•.5500 .177
, 1.0843 1.6000 .188
1.0857 1.6500 .197
1.0869 1. 7000 .206,
1.0880 1.7500 .214
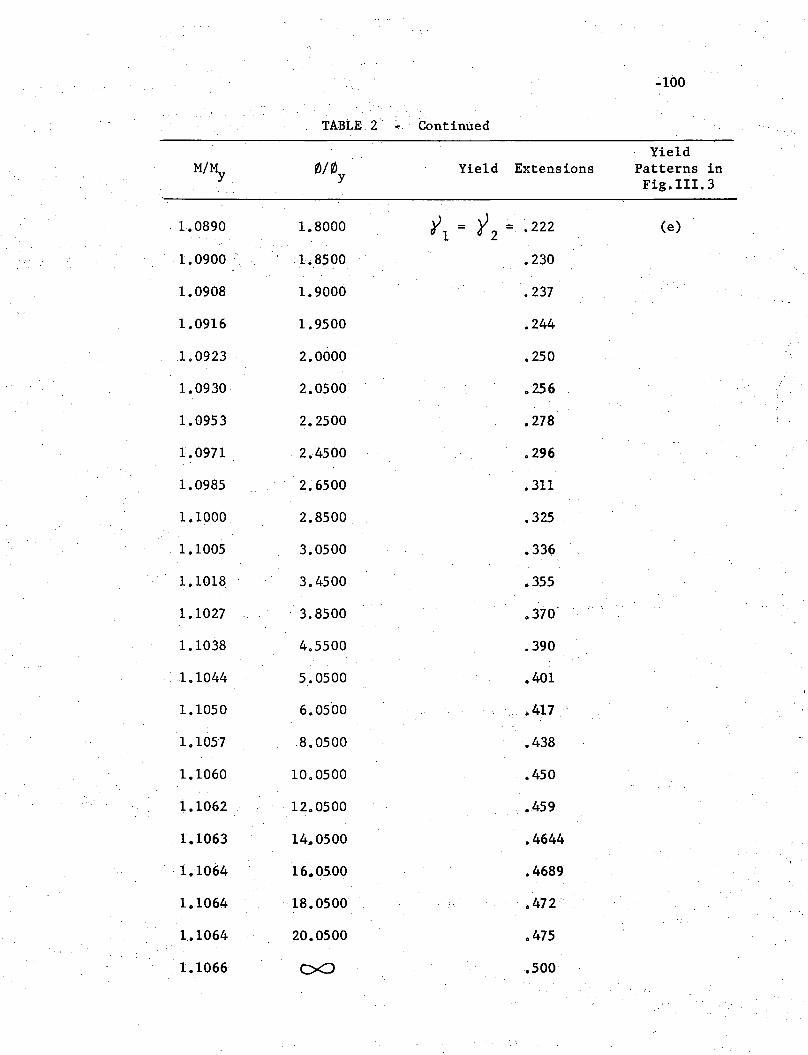
';'100
TABLE 2' .. Continued
YieldM/~ '/J/'/J Yield Extensions Patterns in
yFig.III.3
1.0890 1.8000 ~\ = y2 ~ .222 (e)
. ,1.0900 ' 1.8500 .230
1.0908 1.9000 .237
1.0916 1. 9500 .244
1.0923 2.0000 .250
1.0930 2.0500 .256
1.0953 2.2500 .278
1.0971 2.4500 .296
1.0985 2.6500 .311
1.1000 2.8500 .325
1.1005 3.0500 .336
1.1018 3.4500 .355
1.1027 3.8500 .370
1.1038 4.5500 .390
1.1044 5.0500 .401
1.1050 6.0500 .417 ,.
1.1057 8.0500 .438
1.1060 10.0500 .450
1.1062 12.0500 .459
1.1063 14.. 0500 .4644
, 1.1064 16.05.00 .4689
1.1064 ' 18.0500 .. 472'"
1.1064 20.0500 .475
1.1066 D<J .500
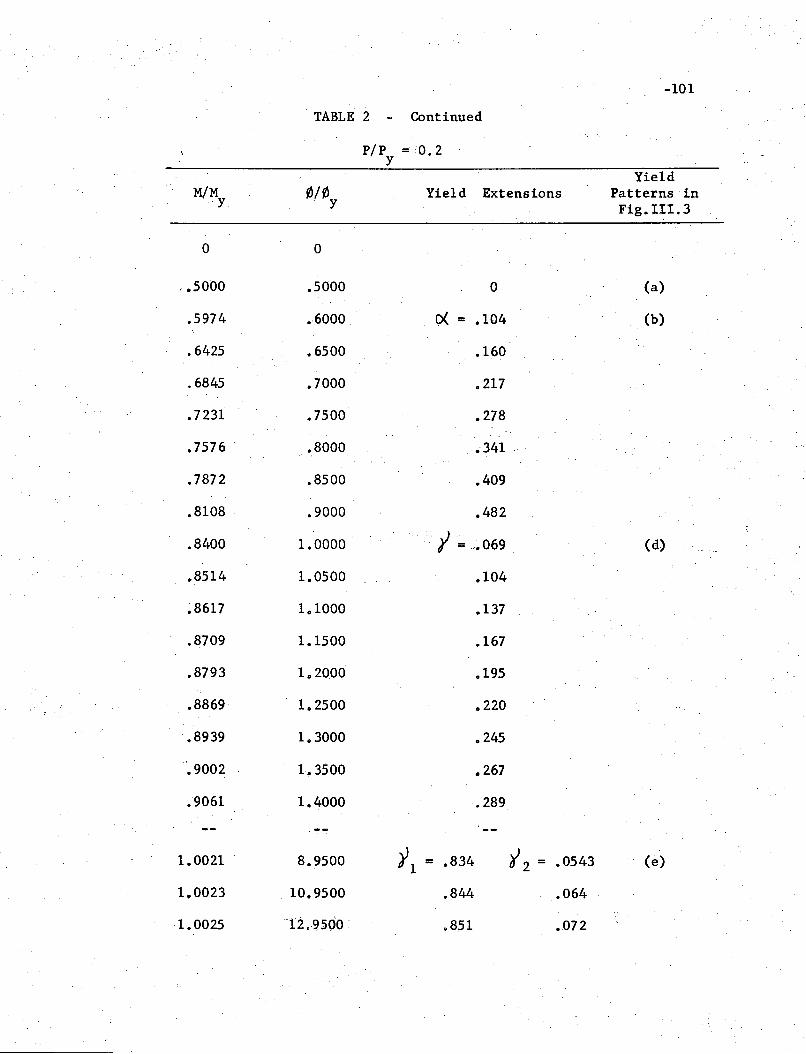
-101
TABLE 2 - Continued
pip =0.2Y
YieldM/M '/J/'/Jy
Yield Extensions. Patterns inyFig.III.3
0 0
, .5000 .5000 0 (a)
.5974 .6000 0(= .104 (b)
.6425 .6500 .160
.6845 .7000 .217
.7231 .7500 .278
.7576 . .8000 .341
.7872 .8500 .409
.8108 . . .9000 .482
.8400 1.0000 1= .• 069 (d)
.8514 1.0500 .104
.8617 1.1000 .137
.8709 1.1500 .167
.8793 1.2000 .195
.8869 1.2500 .220
.8939 1.3000 .245..• 9002 1~3500 .267
.9061 1.4000 .289
1.0021 8.9500 1\ = .834 r2 = .0543 (e)
1.0023 . 10.9500 .844 .064
1.0025 12,.·9500· .851 .072
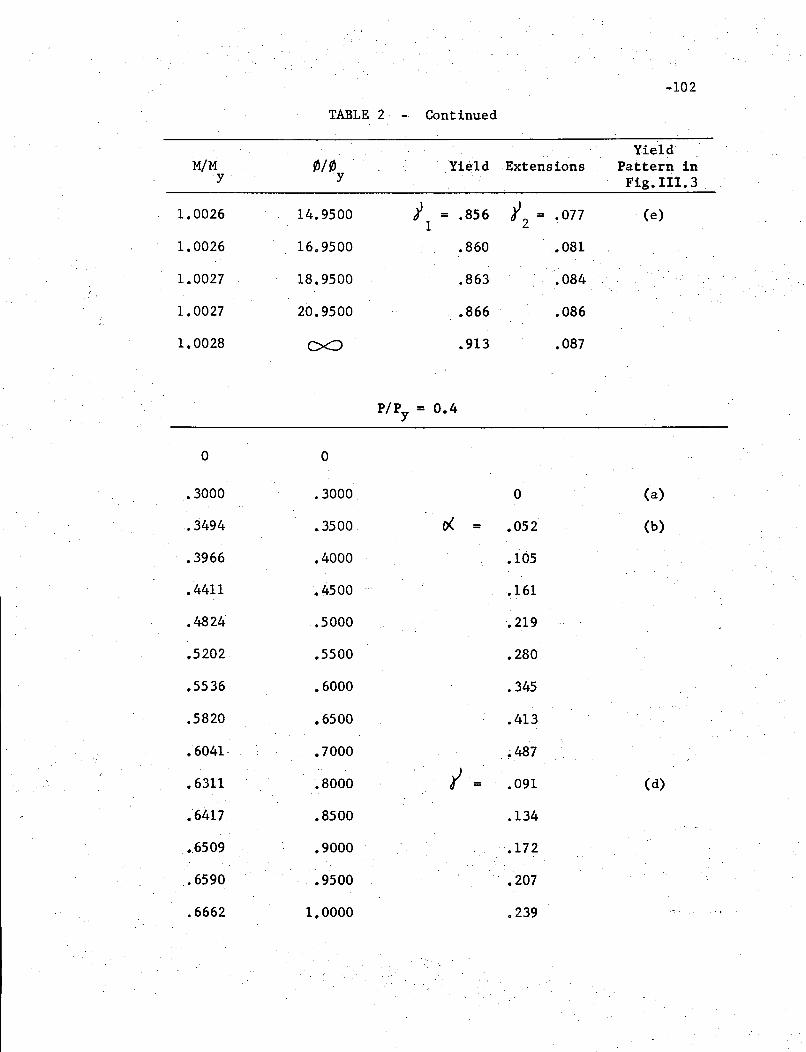
TABLE 2 - Continued
-102
M/My.
1.0026
1.0026
1.0027
1.0027
1.0028
Yield'/J/'/J Yield Extensions Pattern in
y Fig.III.3
14.9500 i = .856 r = .077 (e)1 2
16.9500 .860 .081
18.9500 .863 .084
20.9500 .866 .086
ex::> .913 .087
P/Py = 0.4
0 0
.3000 .3000 0 (a)
.3494 .3500 0( = .052 (b)
.3966 .4000 .105
.4411 .4500 .161
.4824 .5000 .219
.5202 .5500 .280
.5536 .6000 .345
.5820 .6500 .413
.6041 .7000 ~487
.6311 .8000 I = .091 (d)
.6417 .8500 .134
.6509 .9000 .172
.• 6590 ..• 9500 .207
.6662 1,0000 .239
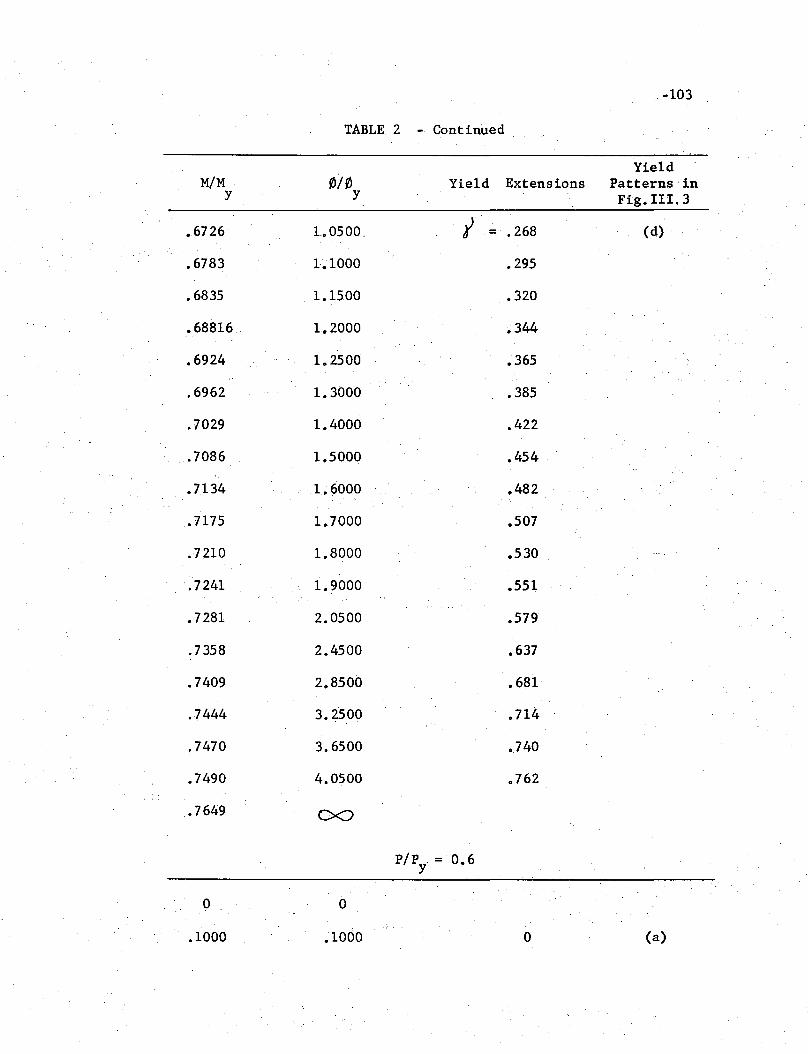
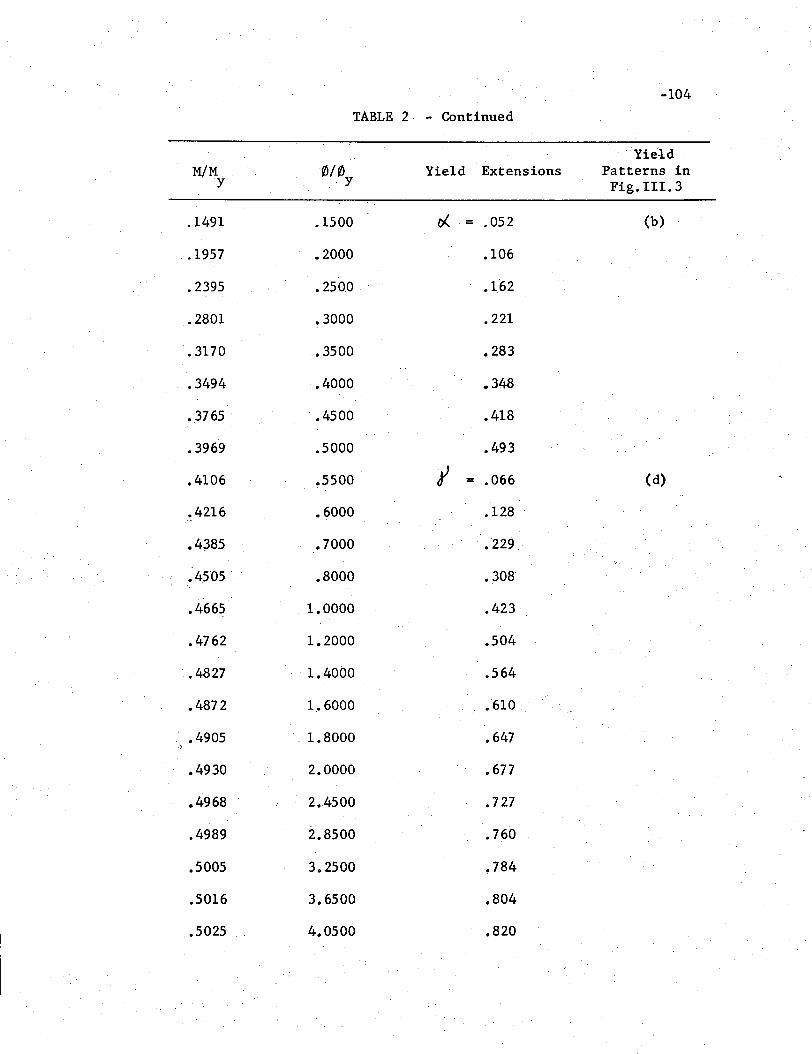
-104
TABLE 2· - Continued
·YieldM/M '/J/'/Jy
Yield Extensions Patterns iny Fig. III. 3
.1491 .1500 rA . - .052 (b)
.1957 .2000 .106
.2395 .2500 .162
.2801 .3000 .221
.3170 .3500 .283
.3494 .• 4000 .348
.3765 .4500 .418
.3969 .5000 .493
.4106 ~5500 r = .066 (d)
.4216 .6000 .128
.4385 .7000 .229
.4505 .8000 .308
.4665 1.0000 .423
.4762 1.2000 .504
.4827 1.4000 .564
.4872 1.6000 .610
.. .4905 . 1.8000 .647.,
.4930 2.0000 .677
.4968 2.4500 .727
.4989 2.8500 .760
.5005 3.2500 .784
.5016 3.6500 .804
.5025 4.0500 .820
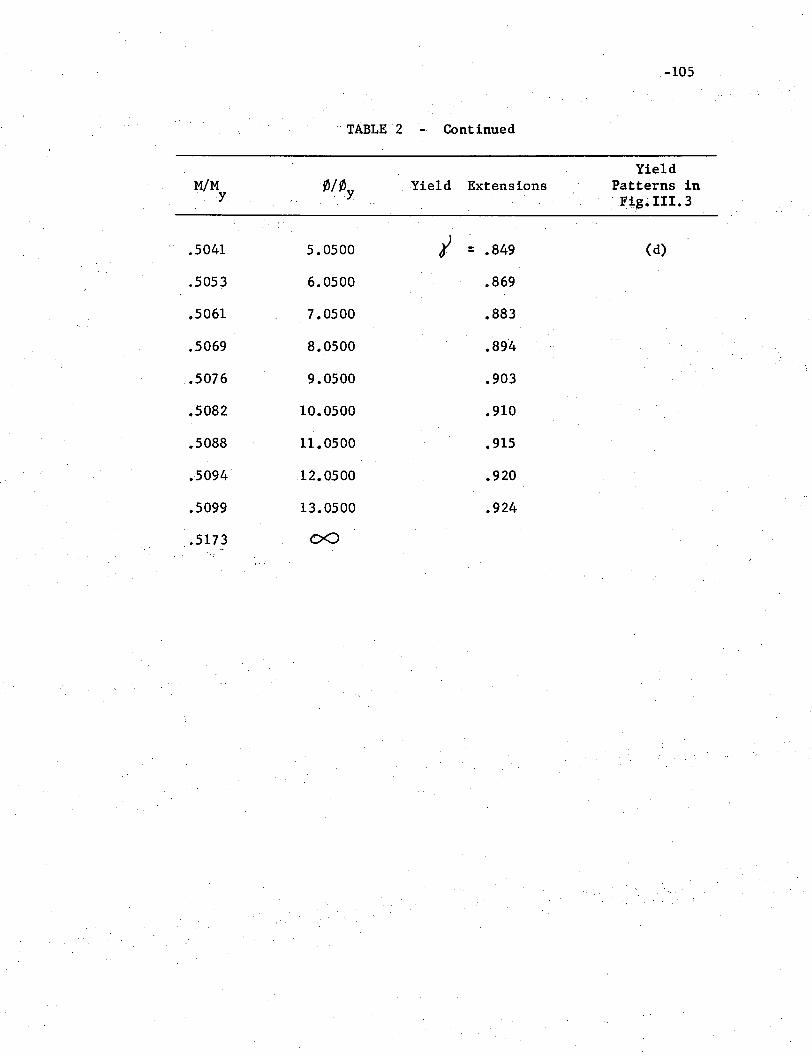
-105
.. TABLE 2 _. Continued
YieldM/M '/J/'/J Yield Extensions Patterns in
y y.F~~~ III. 3
.5041 5.0500 ; - .849 (d)
.5053 6.0500 .869
.5061 7.0500 .883
•.5069 8.0500 .894
.5076 9.0500 .903
.5082 10.0500 .910
.5088 11.0500 .915
.5094 12.0500 .920
.5099 13.0500 .924
.5173 00
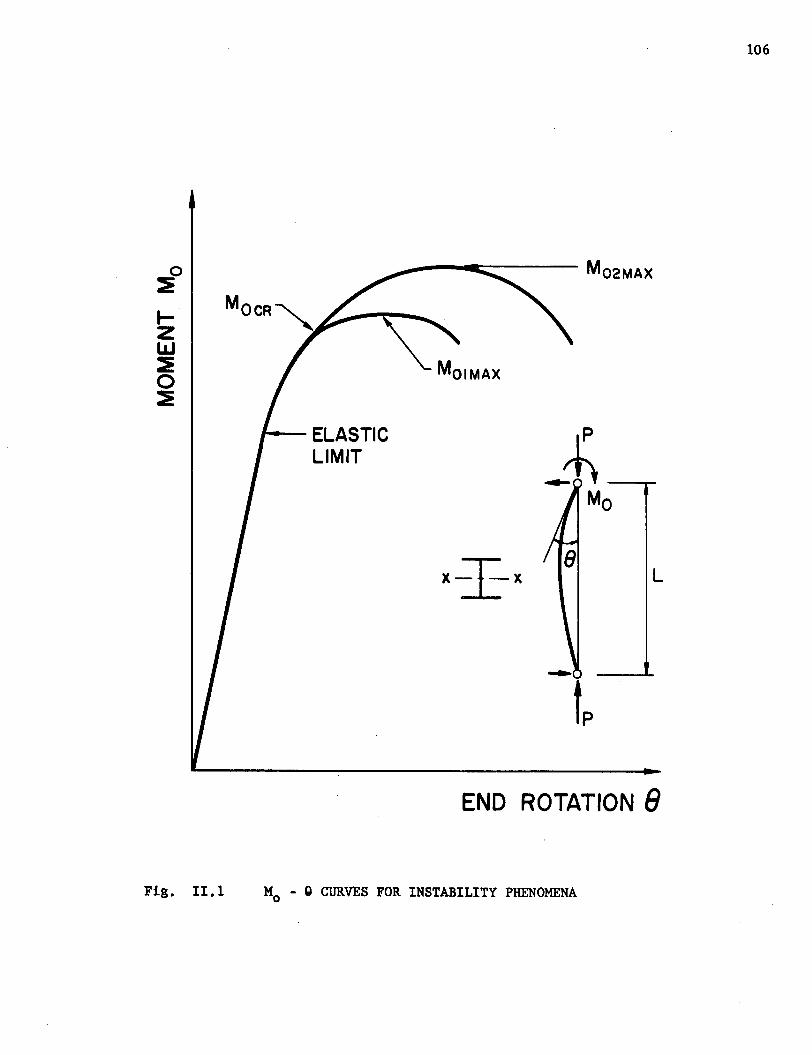
o M02MAx::E
rzI.LJ::Eo:E
ELASTIC ...iPLIMIT
----MO
X±-X L
END ROTATION 8
106
Fig. 11.1 Mo - g CURVES FOR INSTABILITY PHENOMENA
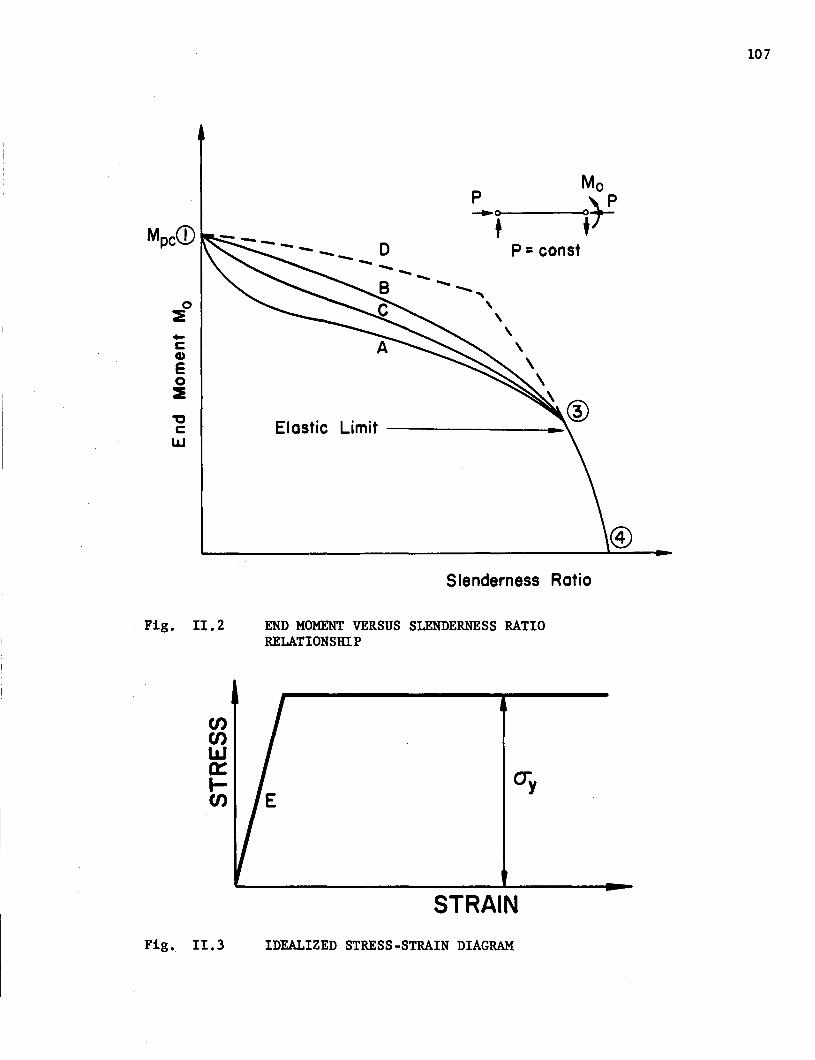
cQ)
eo~
Fig. II. 2
Mo
~o--+------<1i)!P =const-----,,,
\\
\\
\
Elastic Limit -------_.,
®Slenderness Ratio
END MOMENT VERSUS SLENDERNESS RATIORELATIONSHI P
107
C/)C/)wa::.C/)
STRAINFig. 11.3 IDEALIZED STRESS-STRAIN DIAGRAM
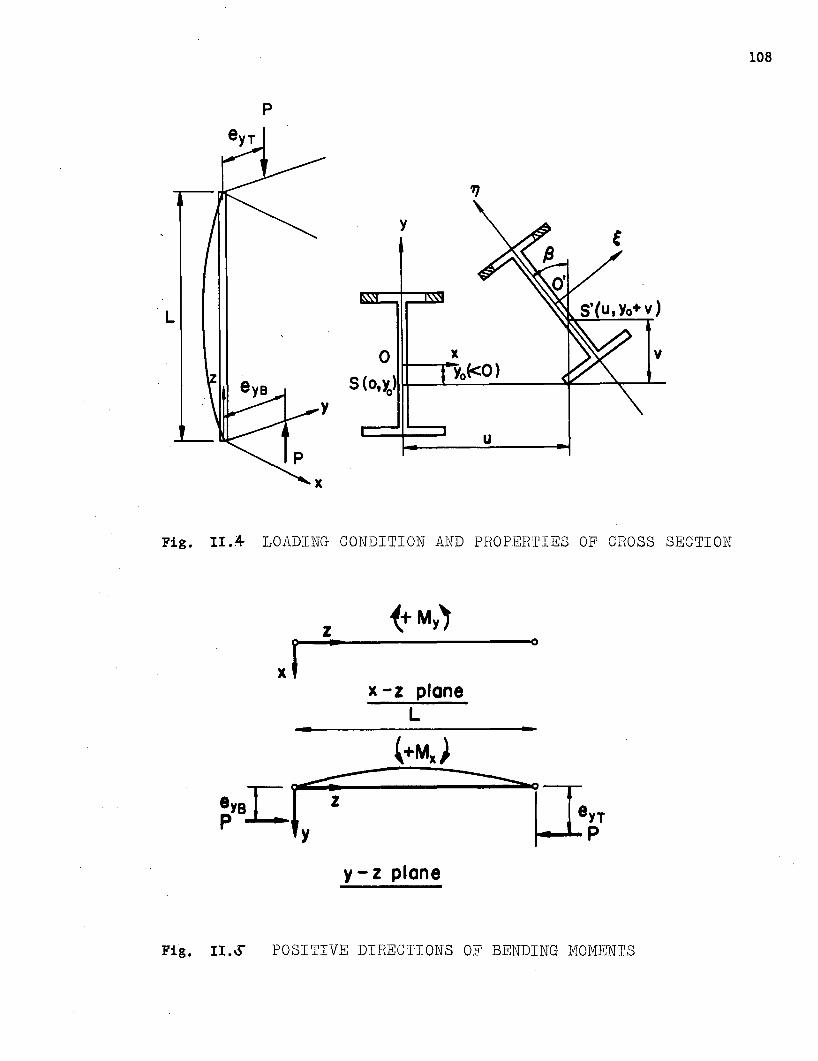
108
p
eyr
u
v
y
o 11+---r~X.yoE<O)
S (Ot~)II+--L.....::"'-----'-~r-..L.--
L
Fig. 11.4 LOADING CONDITION AND PROPERTIES OF CROSS SECTION
z (+My)
xl• 0
)( -z planeL- •
(+Mx)
y - z plane
Fig. II~G POSITIV~ DIRECTIONS OF BENDING MOMENTS
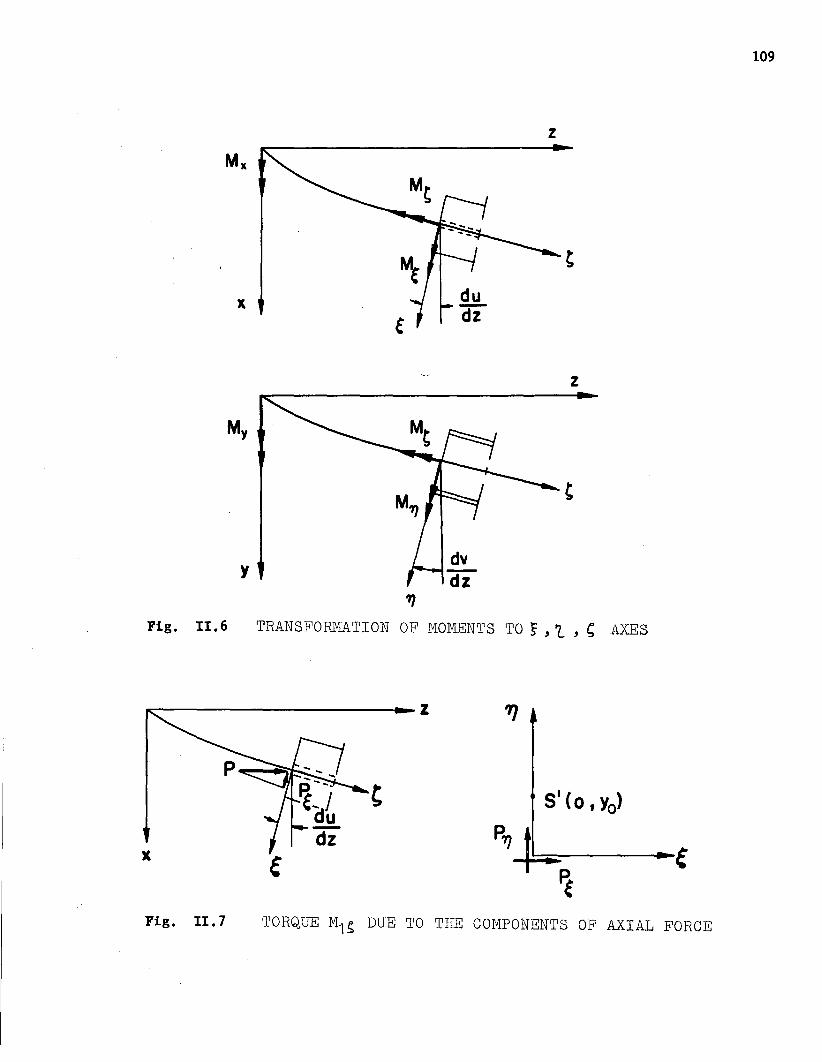
z
109
x
z
"7Fig. 11.6 TRANSFOill1ATION OF IvIOMENTS TO S , 1. , ~ AXES
~-----------z
Fig. II. 7 TORQUE M1~ DUE TO THE COMPONENTS OF AXIAL FORCE
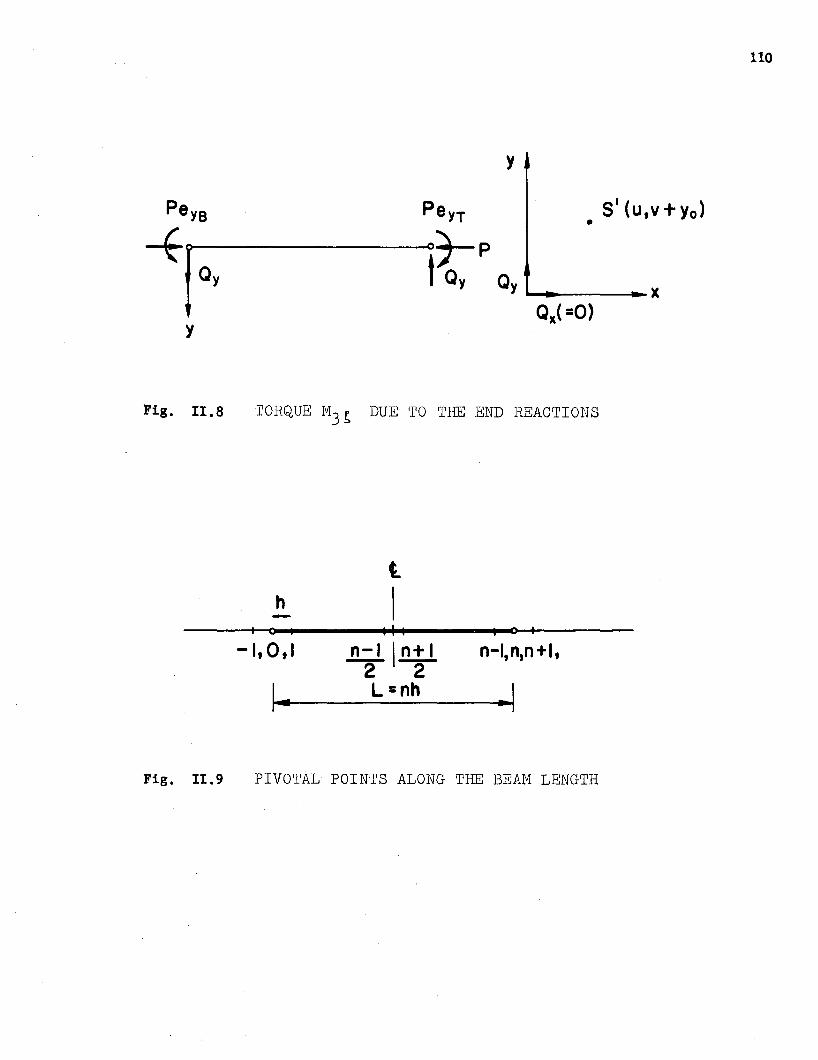
y
PeYB Pe YT 5' (u,v +Yo)•
-ff Qy°rp
t Qy Qy xQx( =0)
y
Fig. II. 8 'I'ORQUE 1'13 ~ DUE '1'0 TIlE END REACrl'IONS
lh I
I 0 I I I I I c I
-1,0,1 n-I In+1 n-l,n,n+l,2 2
I- L=nh ~I
Fig. 11.9 PIVOTAL POINTS ALONG THE BEAM LENGTH
110
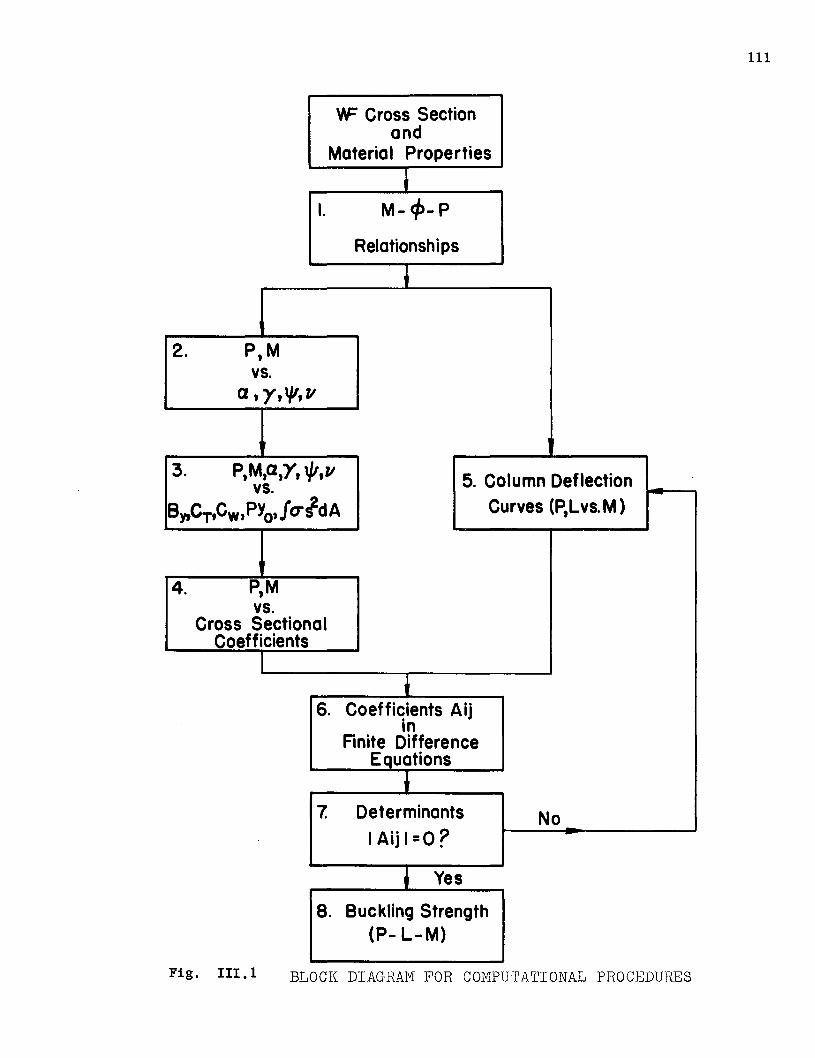
'IF Cross Sectionand
Material Properties
II. M- 4>- P
Relationships
2. P,Mvs.
a, 'Y, '/1,11
111
3. p,M,a,'Y, "',11vs.
By,CT,CW' PYo'1(TId A
5. Column DeflectionCurves (P,Lvs.M)
4. P,Mvs.
Cross SectionalCoefficients
~6. Coefficients Aij.
InFinite Difference
Equations,7. Determinants No
I Aij I=O?
~ Yes
8. Buckling Strength(P- L-M)
Fig. 111.1 BLOCK DIAGRAM FOR COMPUTATIONAL PROCEDURES
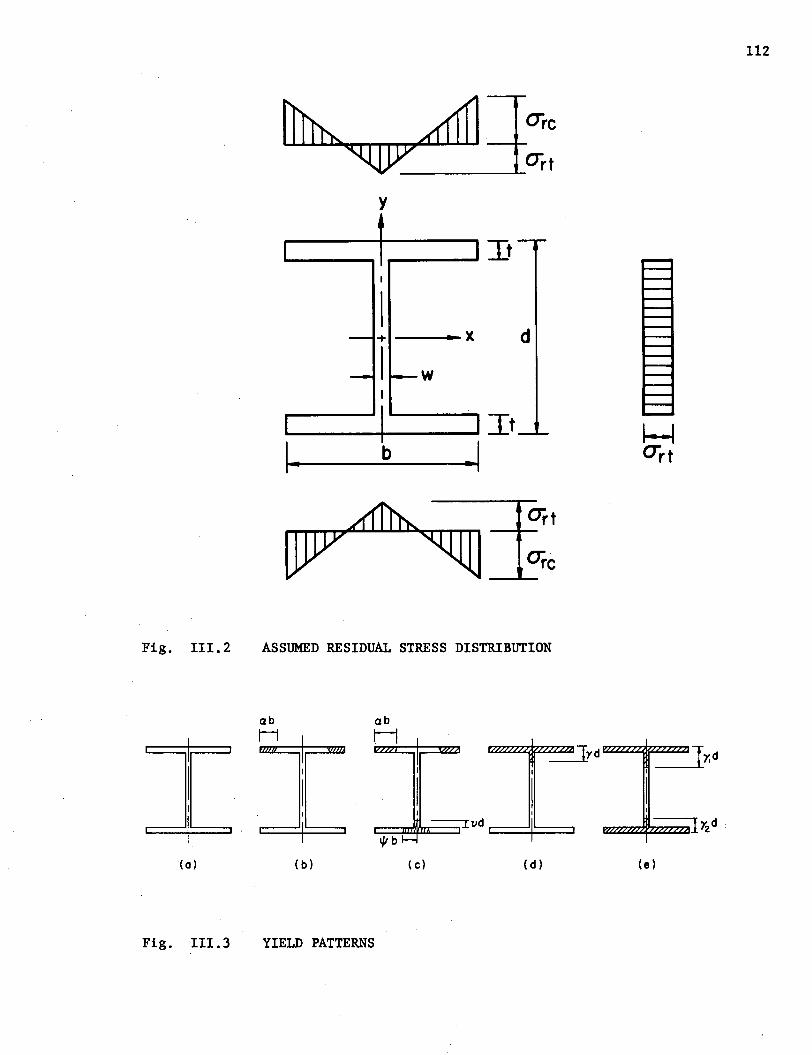
112
CTrc
CTrt-----~
y
d
It
It.1bI..
I II
I- + .. X
- I-wI
II II
artarc
Fig. III.2 ASSUMED RESIDUAL STRESS DISTRIBUTION
ab
Hab
H
I/Ib(0) (b) (c) (d) (e)
Fig.III.3 YIELD PATTERNS
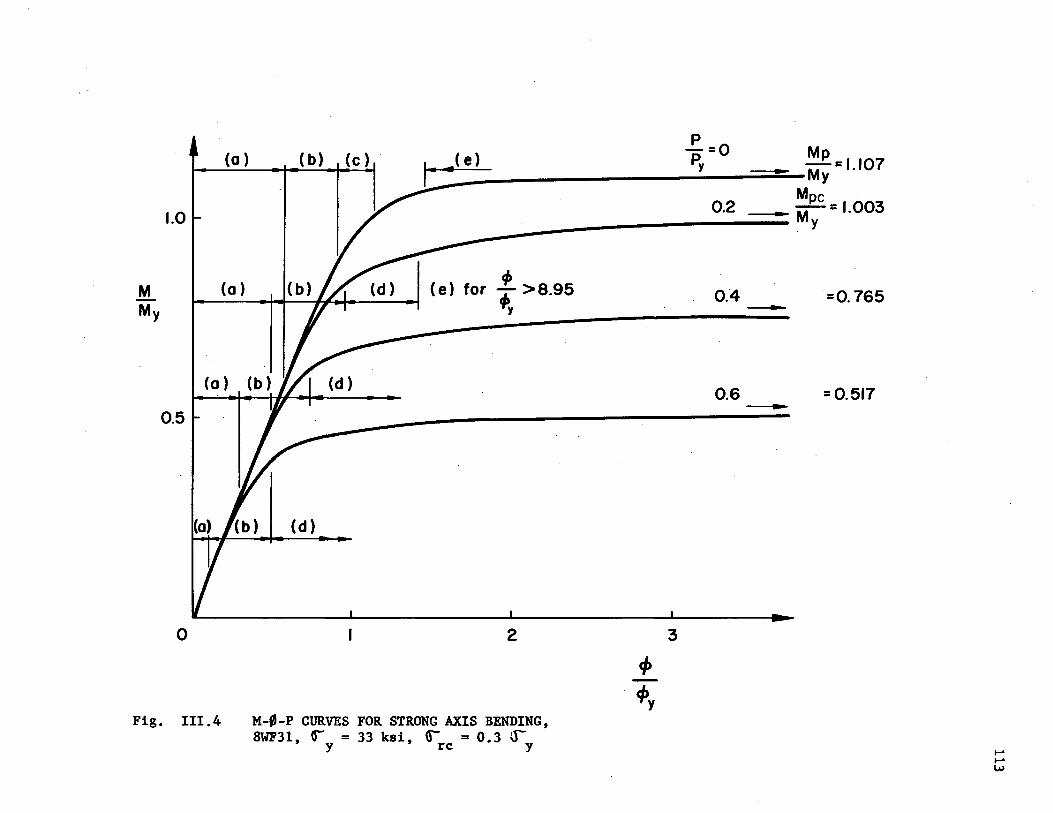
=0.7650.4
32
0.6 =0.517
p-=0 Mp--=-_----------...;Py--;;;;;;;;;;;;;;:;..;",.-My =1.107
Mpc .
_--,;....------0-.2--.. M= 1.003~ . y
(c) .(b)
(d)
(0 )
~t--_(_o_)--+...----I~I---___./ (e) for "'i: > 8.95
-------:.-y-------
o
1.0
0.5
MMy
Fig. 111.4 M-0-p CURVES FOR STRONG AXIS BENDING,8WF31, 0- = 33 ksi, tr = 0.3 cr-y rc y
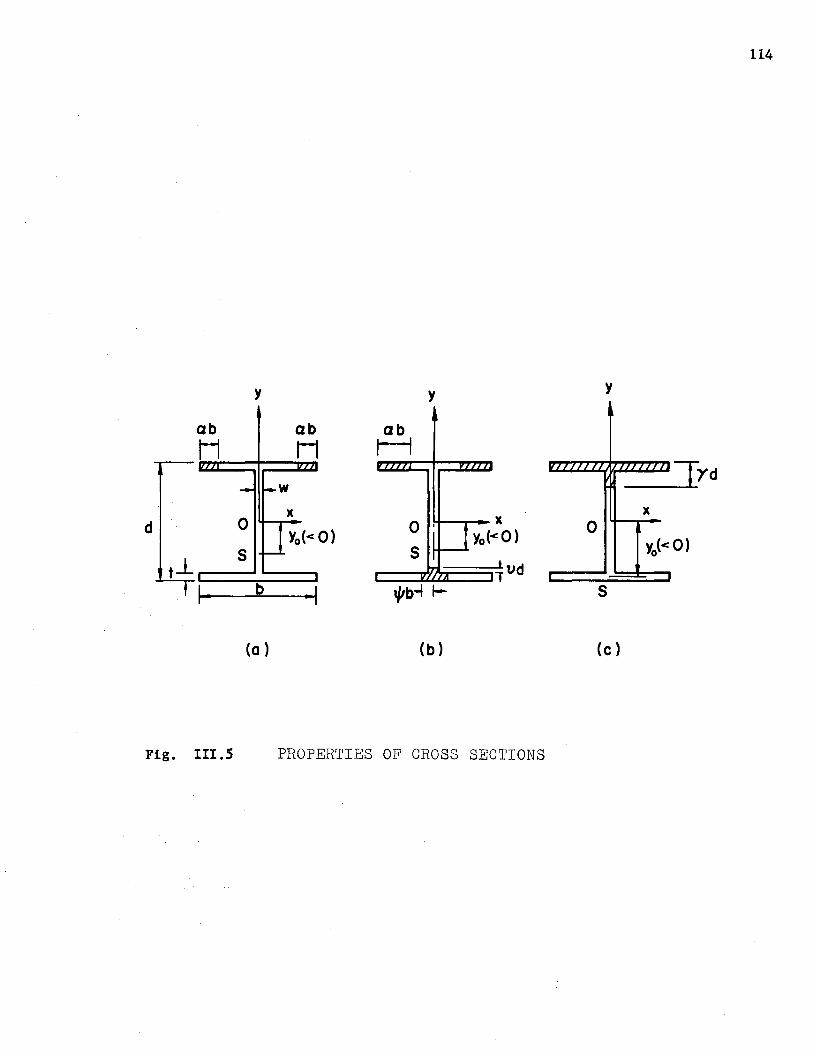
y y y
ab ab abH H r--i
", ., " zzzon =rYd
)( )(
d 0 I X 0Yo« 0) Yo«O) Yo« 0)s
t-.L t vd"T --'
I- b ·1 'l'b--l l- S
(0 ) (b) (c)
114
Fig. III.5 PROPERTIES OF CROSS SECTIONS
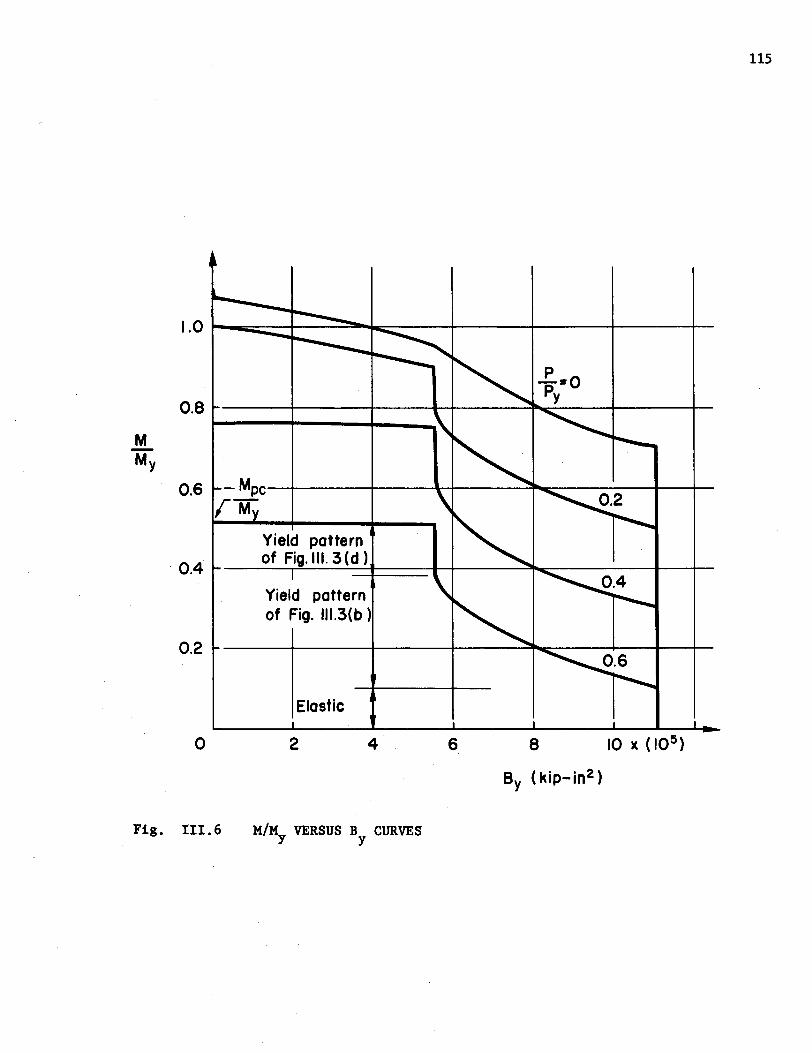
115
864
Elastic
2o
1.0 t-lllliiiiiii;;;;;;:::::t---=~"k;;::---r-----r------r----r
0.8
MMy
0.6 -Mpc
1 MYield pattern
0.4of Fig.III.3(d)
Yield patternof Fig. 1I1.3(b )
0.2
Fig. 111.6 M/MY VERSUS By CURVES
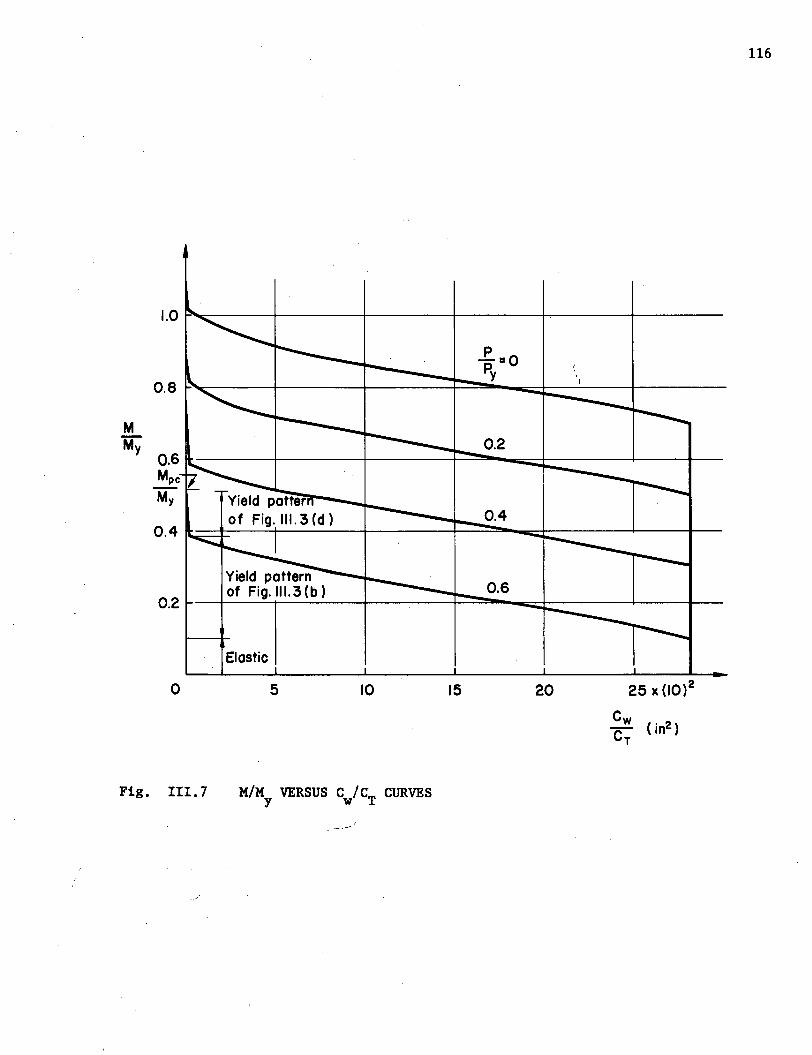
116
0.2
1.0
1: =0Py \
0.8
MMy
0.6Mpc
My0.4
0.4
Elastic
o 5 10 15 20
Fig. 111.7 M/M VERSUS C / CT
CURVESY w

117
1.0
P'P." =0.2y
1L 0.8
My.
0.6Mpc
My Yield pattern of
0.4 Fig. III. 3 (d)
Yield pattern of
0.2Fig. III. 3 (b)
Elastic
0 0.1 0.2 0.3 0.4 0.5 0.6
1ad
Fig. 111.8 M/M VERSUS Y I d CURVESY 0
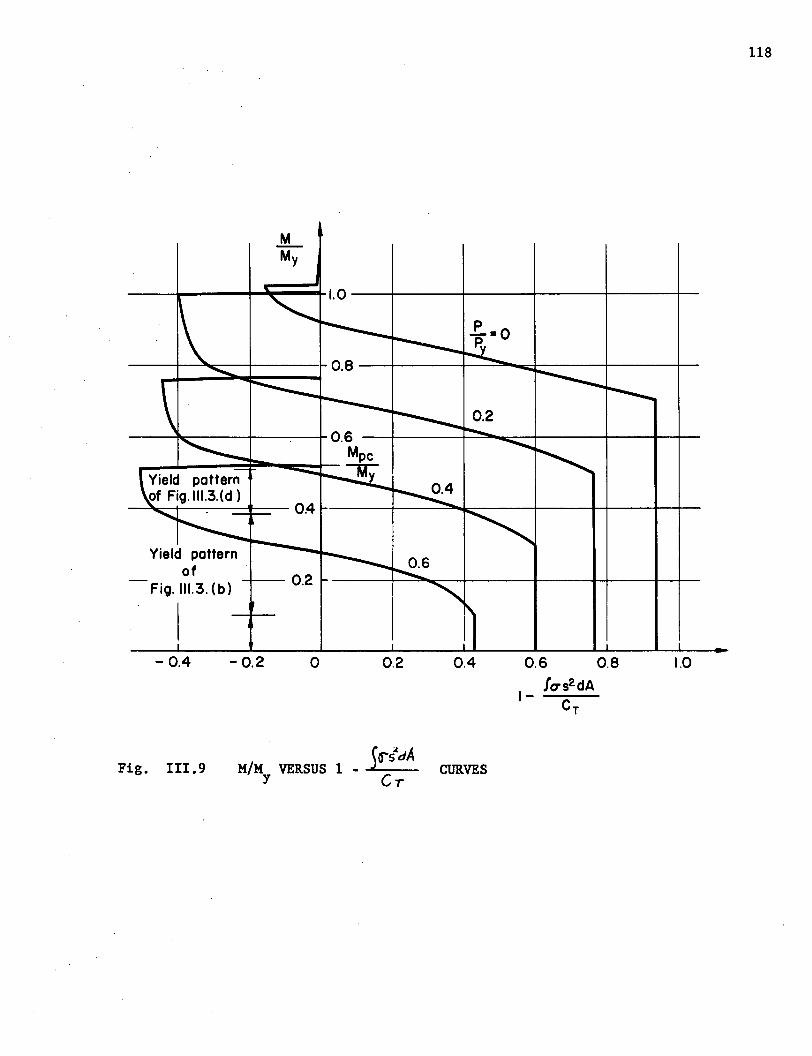
Yield patternof
Fig. 111.3. (b)
I- 0.4 -0.2 o 0.2 0.4 0.6 0.8
fus2 dA1----Cr
1.0
118
Fig. II!. 9 M/M VERSUS 1 _ S~tdAY CT
CURVES
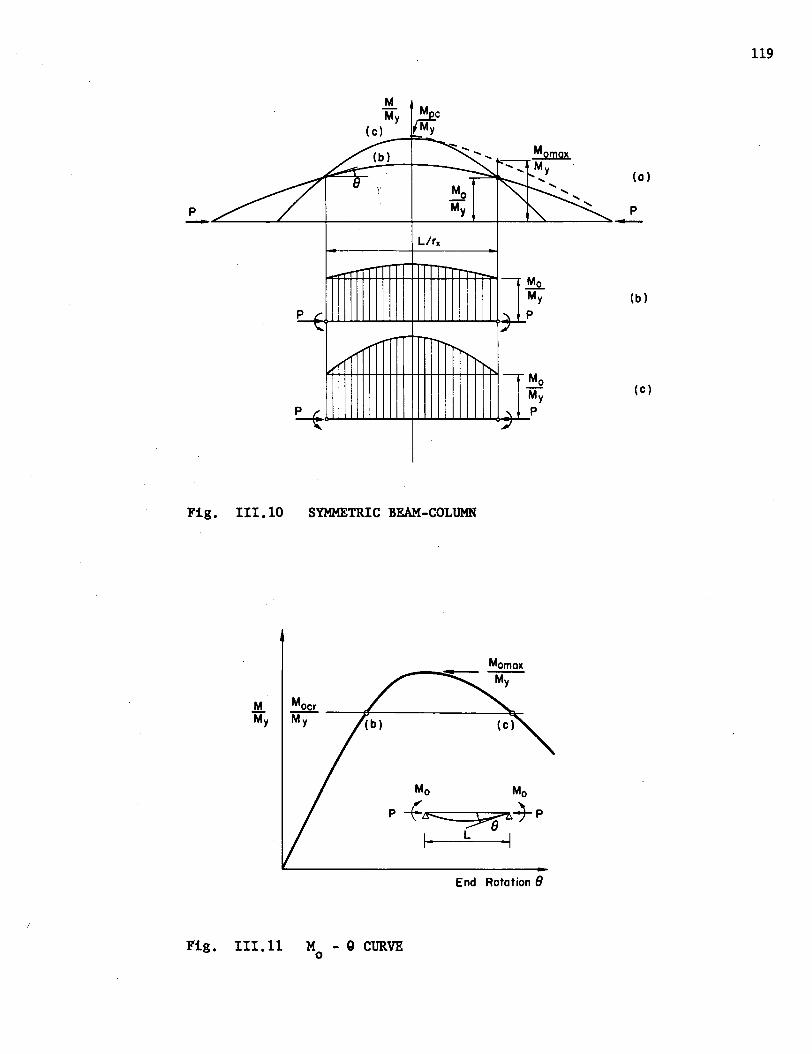
p
(0)
MMy ~c
(c) ,My__--f'....=-_
,5.) ~...... , ~~--,.:.;:...=----+--~ ~ M .-r- ', y
P
~ 8 y Mo I':~,_~/ My ~~
_..e:...-----L---+-----+-----'--r----'-~---""' __
L/rx
(b)
P t'"
(c)
Fig. 111.10 SYMMETRIC BEAM-COLUMN
M MocrMy ~--+--------~
End Rotation 8
119
Fig. 111.11 M - 9 CURVEo
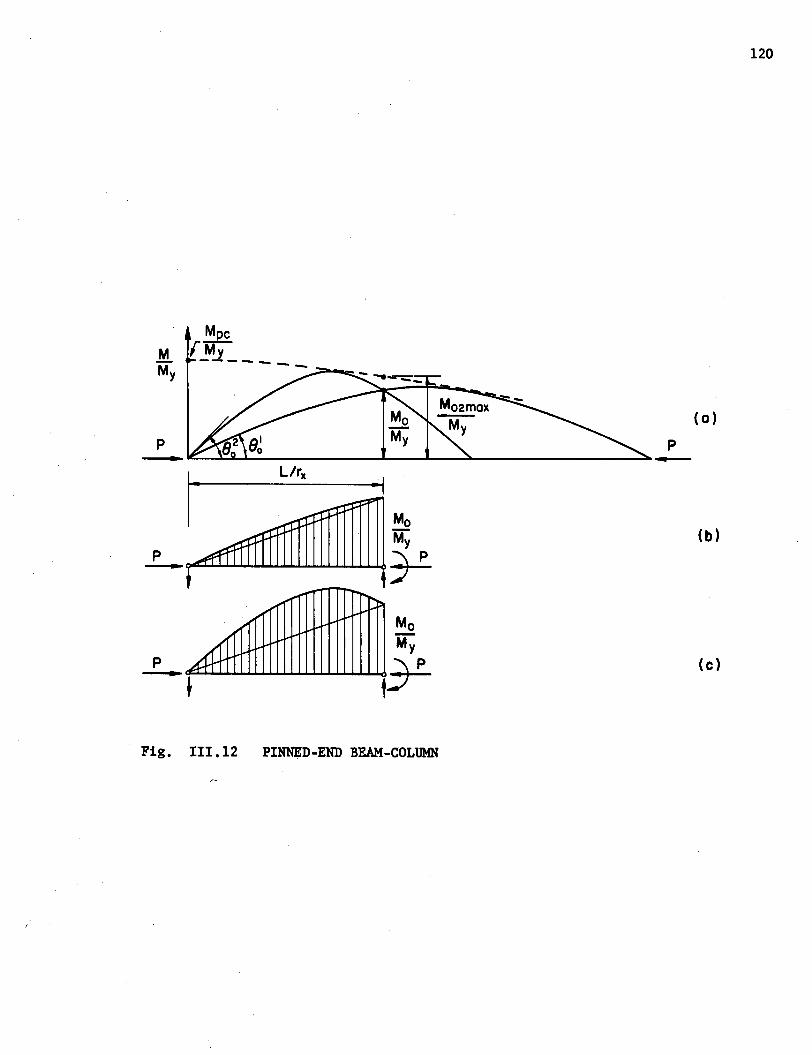
120
(c)
(0)
p
"'",
././
.A~ ~ ~
p
Mpc.M.. f_My _
My
_ ...._ li£=---3::.ll....l.....::-- --l_---li...-~ ~_
p
-~
Fig. 111.12 PINNED-END BEAM-COLUMN
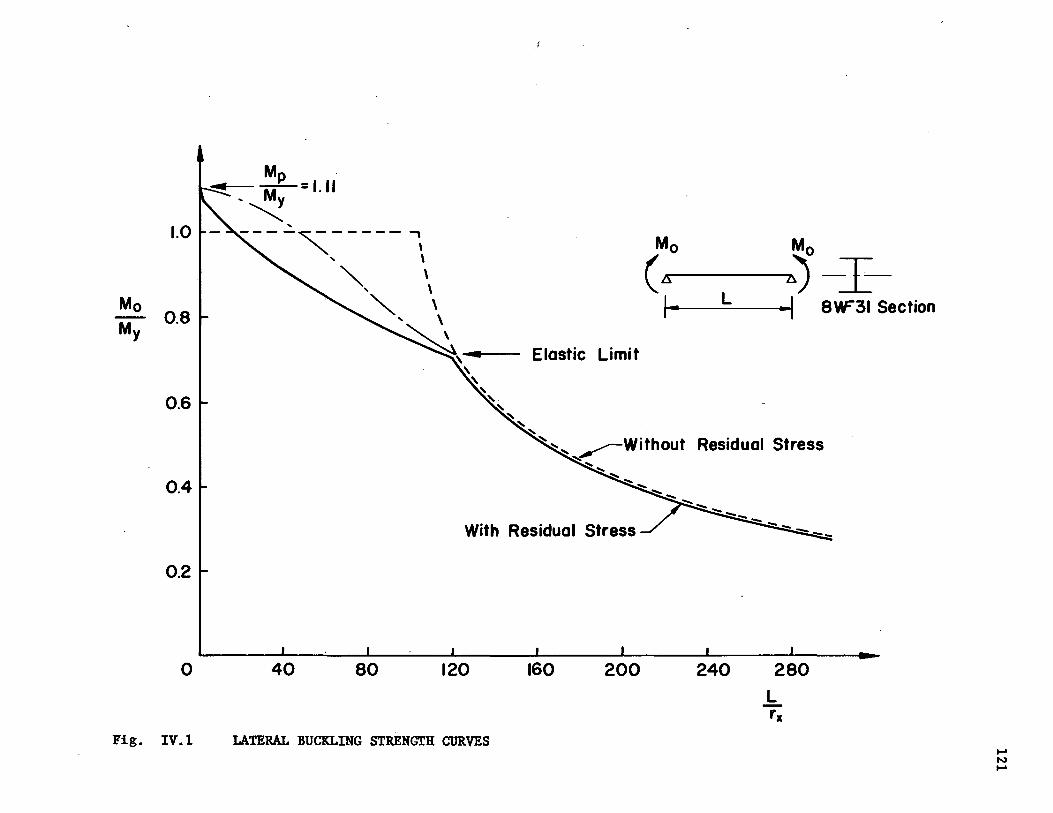
MoMy
0.8
0.6
0.4
0.2
Mp .-M=1.11, y~ ...
Elastic Limit
With Residual Stress
Mo MO
(~~----"h) -I~~ L _I 8\¥"31 Section
Residual Stress
o 40 80 120 160 200 240 280Lrx
Fig. IV.1 LATERAL BUCKLING STRENGTH CURVES ....N....
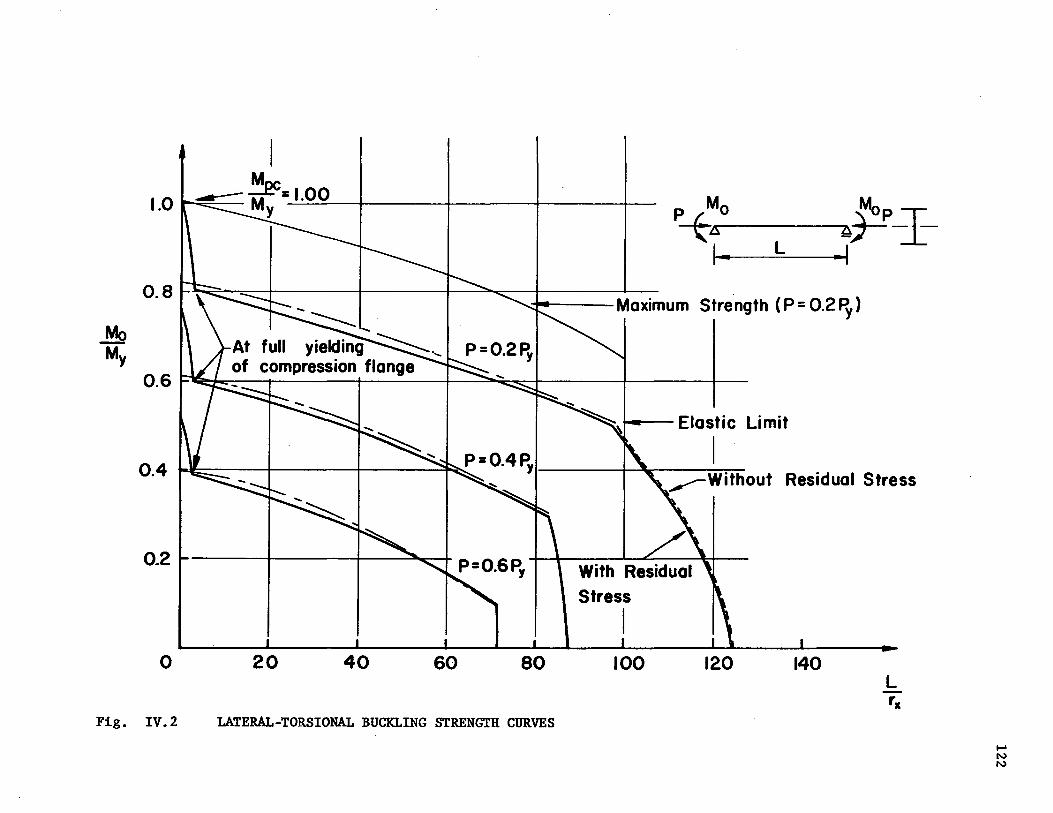
140120
..,-Without Residual Stress
+--- Elastic Limit
I
100
With ResidualStress
I80604020o
IM
~ .::E.CM =--=.I.:...:.O::...::O~-+- +-__--+ -+-_1.0 y
0.6 ~~~--r----+------:'_-+-----:~~-+-----+----+--
0.4 W!::~--+----+---~~
Fig. IV.2 LATERAL-TORSIONAL BUCKLING STRENGTH CURVES
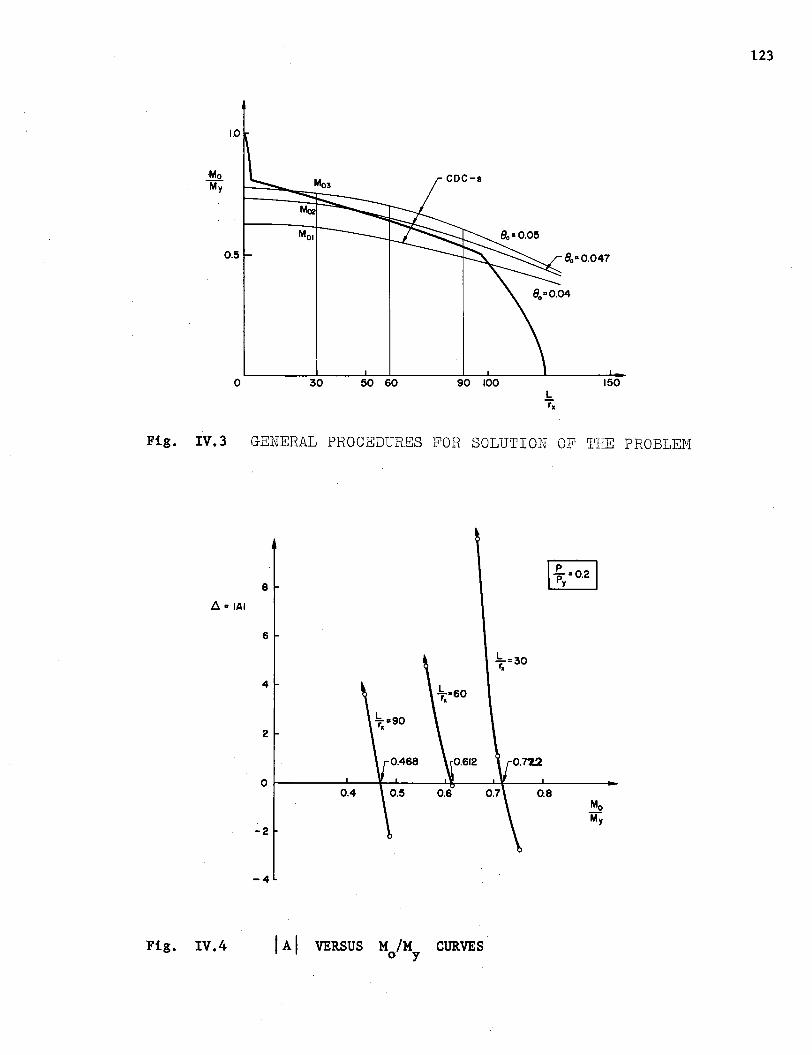
123
15030o
1.0
·MoM03
CDC-sMY
Mo2
MOl
0.5 80"0.047
Fig. IV.3 GENERAL PROCEDURES FOR SOLUTION OF THE PROBLEM
8
6"IAI
6
4
2
-2
0.4 0.8
-4
Fig. IV.4 VERSUS M 1M CURVESo Y
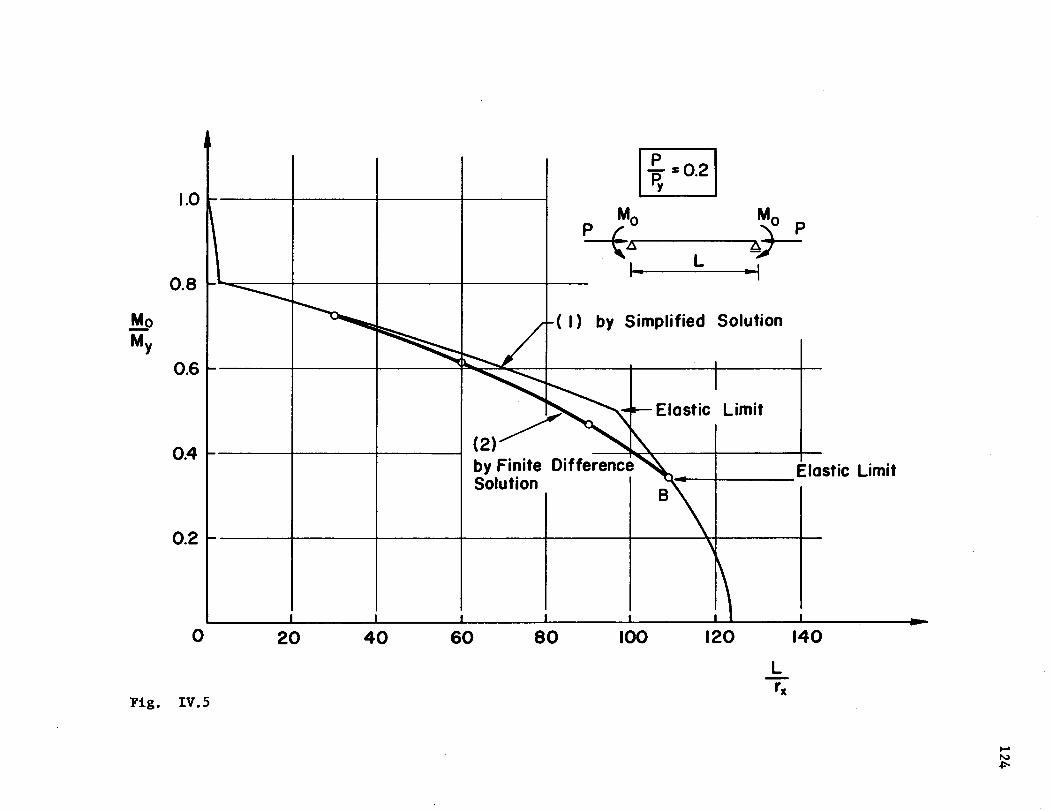
140120
Elastic Limit~--+----
Simplified Solution
100
..........- Elastic Limit
80604020
(2)~---+-----+-----;
by Finite DifferenceSolution
1.0
0.6 ...-----+----4----~:p.",,~"""=:___+---_f_---+__--~-
o
0.2
0.4
0.8 ...-......::::----+----+----+-----+--
Fig. IV.5
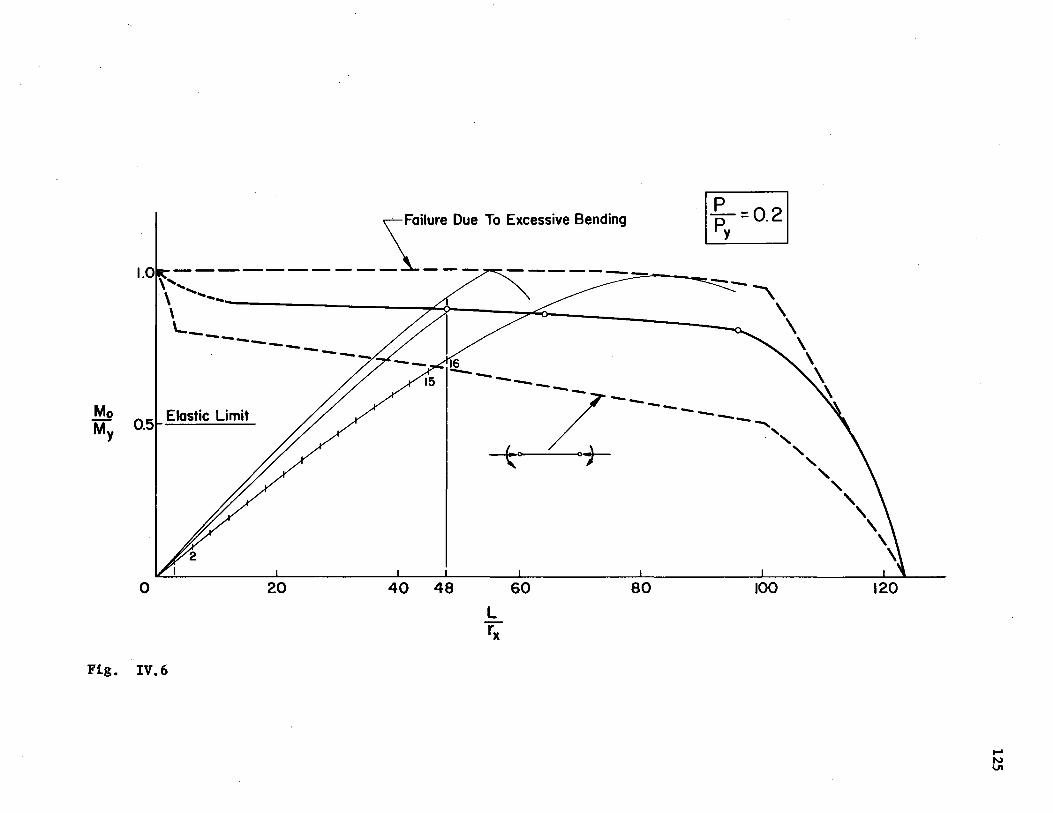
120100
~~
8060
16-----/---------- ........"~o 07- " ,,
""\\\
40 4820
1.0 ~i1Ur~: To Excessive Bending
\...... ::..="--~
'\ '.......... --~\L_ ............................. ....................
o
0.5 Elastic Limit
Fig. IV.6

~=IAI
1000
500
o-500
-1000
-2000
-3000
-4000
-5000
Fig. IV.1
0.6
IA I VERSUS M 1M CURVES (P = O. 2 P )o V y
1.0
126
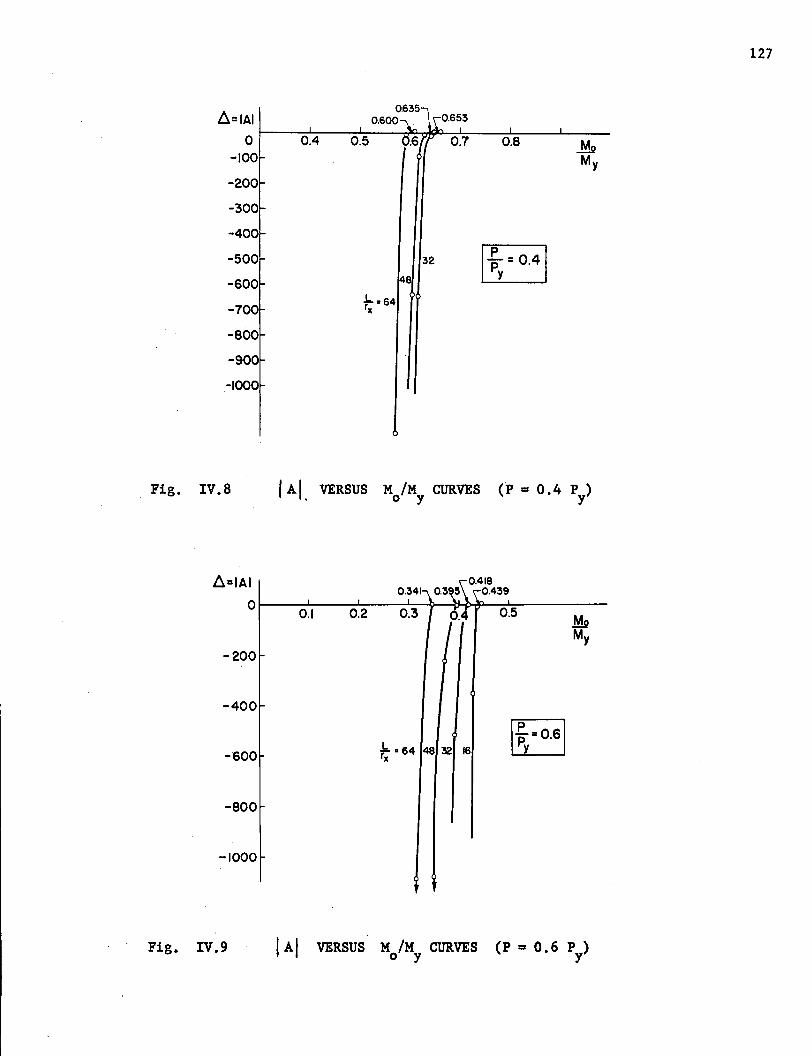
~=IAI0.635
0.600 0.653
0 0.4 0.5 0.7 0.8 l!19-(00 My
-200
-300
-400
-500 32 I~y = 0.41-600
.l..s64-700 rx
-800
-900
-1000
127
Fig. IV.8 IAI VERSUS M 1M CURVES (p = 0.4 P ). 0 Y Y
~=IAI0.341
00.1 0.2 0.3 0.5
M9My
-200
-400
-600 .b. .64 48 32 16I~y =O.SI
rx
-800
-1000
Fig. IV.9 VERSUS M 1M CURVES (P = 0.6 P )o Y Y
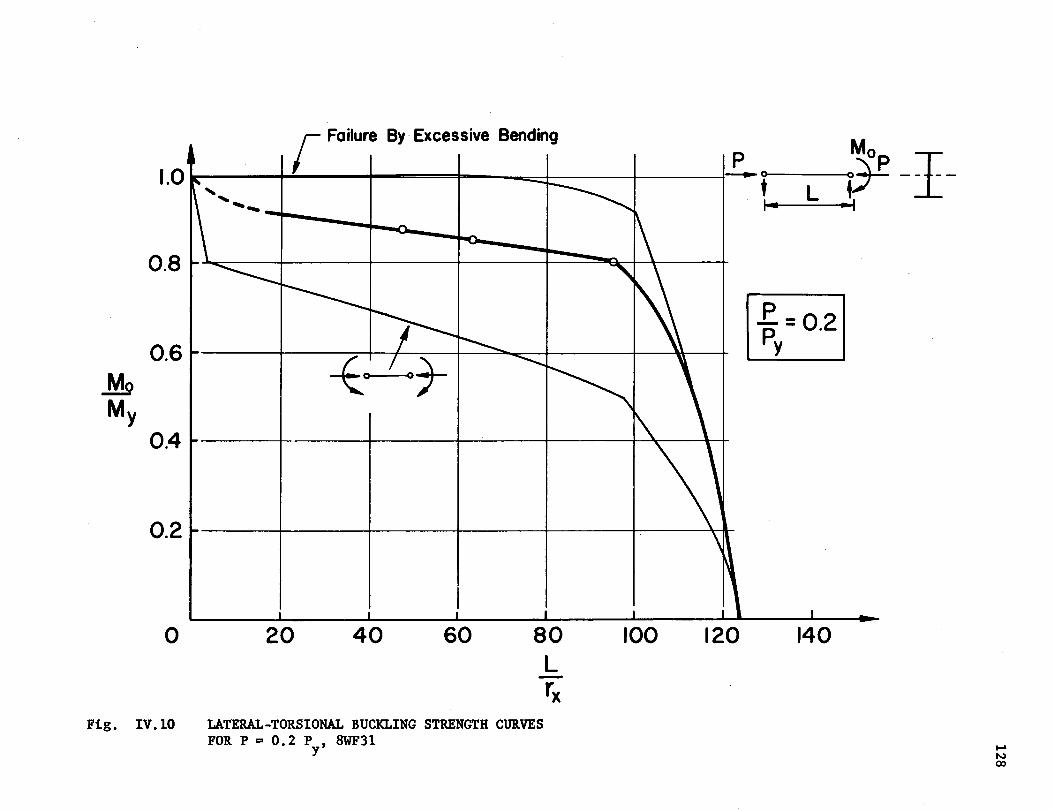
r Failure By-Excessive Bending Mo1.0 1r------+...:.--+--~==+_--===-I-----__+_-__lL 0-.-L----<ty -I-
104 --I
0.8
~=O.2y
0.4 t-----+-----+---t-----+-----+--T---t-+
0.2 ...-----I-------+-----I----I----+----~
o 20 40 60 80L-rx
100 120 140
Fig. IV. 10 LATERAL-TORSIONAL BUCKLING STRENGTH CURVESFOR P = 0.2 P , 8WF31
y ....NQ)
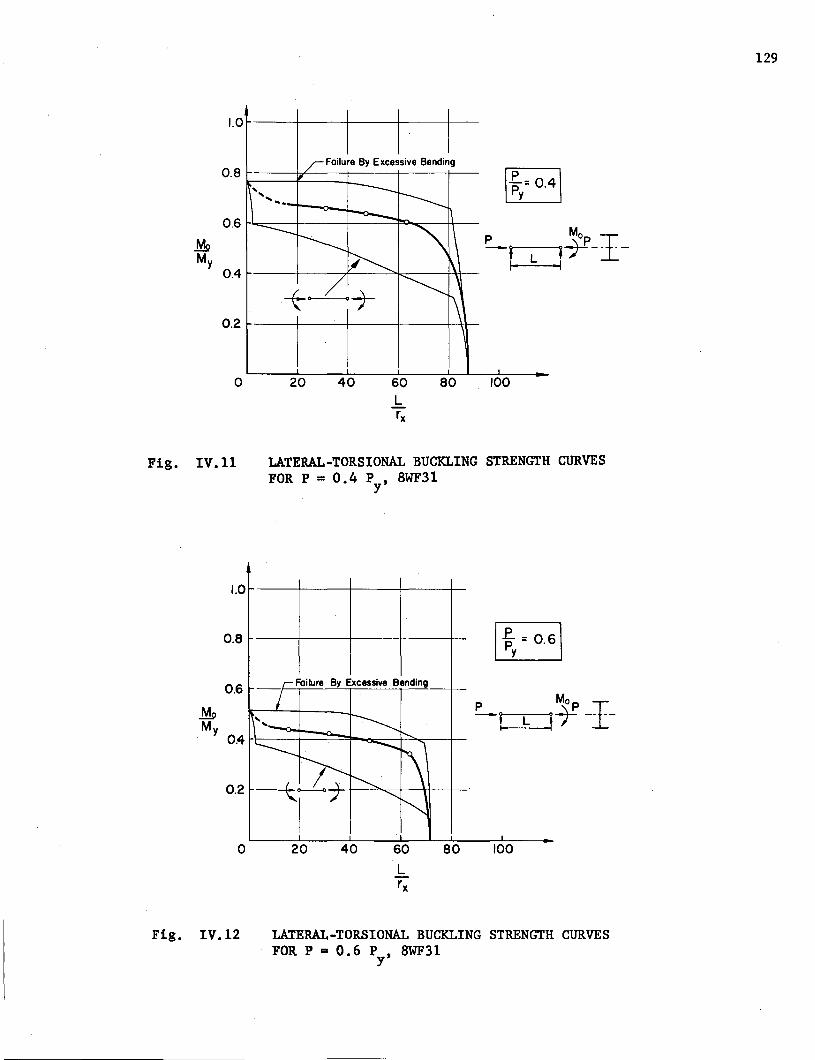
129
1.0 I----+----I--------jf----+-
' ... ......_-~0,6 I-'"""=:::::---+.----I----~~;::::_____++-
p Mo I---J ,~-- --
I L .1
Failure By Excessive Bending
0.8 k-===:?===t=--i-i-
.M1My
0.4 I----+---,f---~..,..__-__+\+__
0.2 I-----+--.:.....--I-----/----l-_\_\_
a 20 40 60Lrx
80 100
Fig. IV.ll LATERAL-TORSIONAL BUCKLING STRENGTH CURVESFOR P = 0.4 P , 8WF31
y
1008060
Lrx
4020
.f. = 0p .y
~ Foi lure By Excessive Bending
7 p
1\"-- -~ -L JL
-0- '-..
l.-.-.-.~--.....~--+;..-1.;- I'----.. .
-.......... "-JI
0.2
1.0
0.6
o
0.8
.MPM
y 0.4
Fig. IV.12 LATERAL-TORSIONAL BUCKLING STRENGTH CURVESFOR P = 0.6 P , 8WF31
y
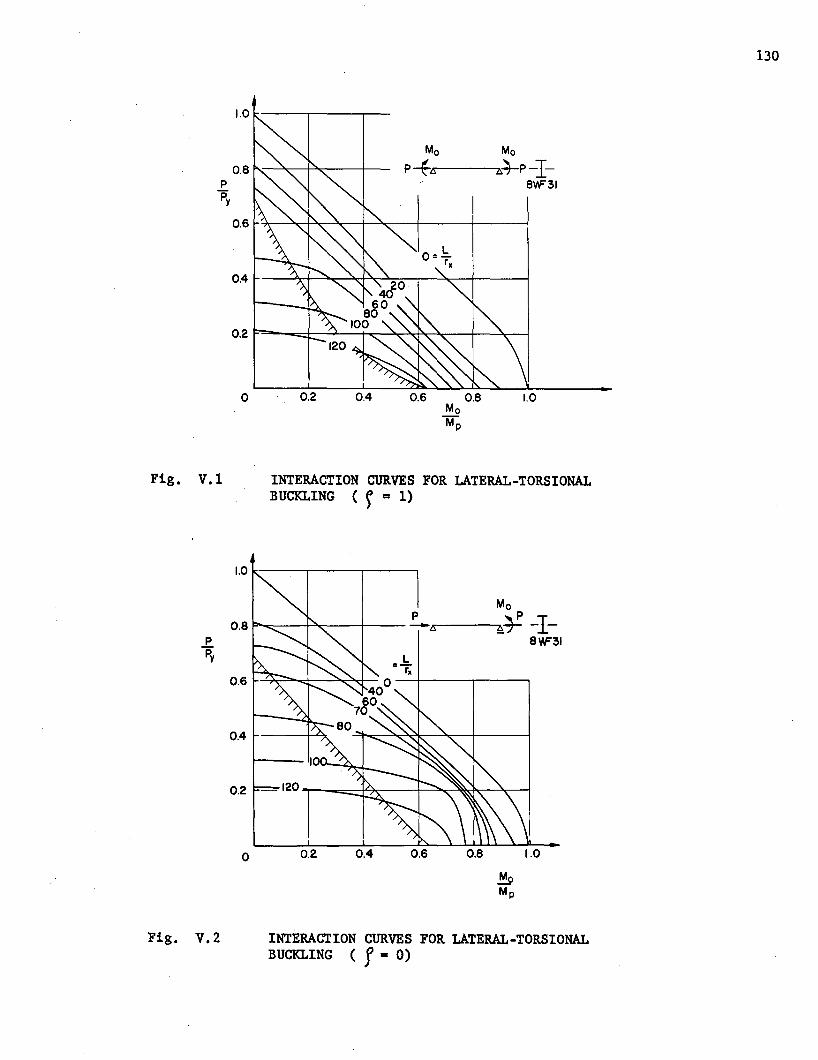
130
1.01.---.---.----
1.00.6 0.8Me
~
Me Me
P-f£'~---,~~P -18VF31
0.40.2o
0.6 f-~-~.p...,.~.______+-~-+_--_I_-__I
0.8 "'-~.------~--+-PPy
Fig. V.1 INTERACTION CURVES FOR LATERAL-TORSIONALBUCKLING () = 1)
1.00.80.60.40.2o
0.2 - 120 ......_=---+L::~--+-~~~.------~--i
0.4 ~ ----+_.£?.
1.0
MeP
~¥ -1-0.8 -is
P 8YF31Py
0.6
Fig. V.2 INTERACTION CURVES FOR LATERAL-TORSIONALBUCKLING (j = 0)
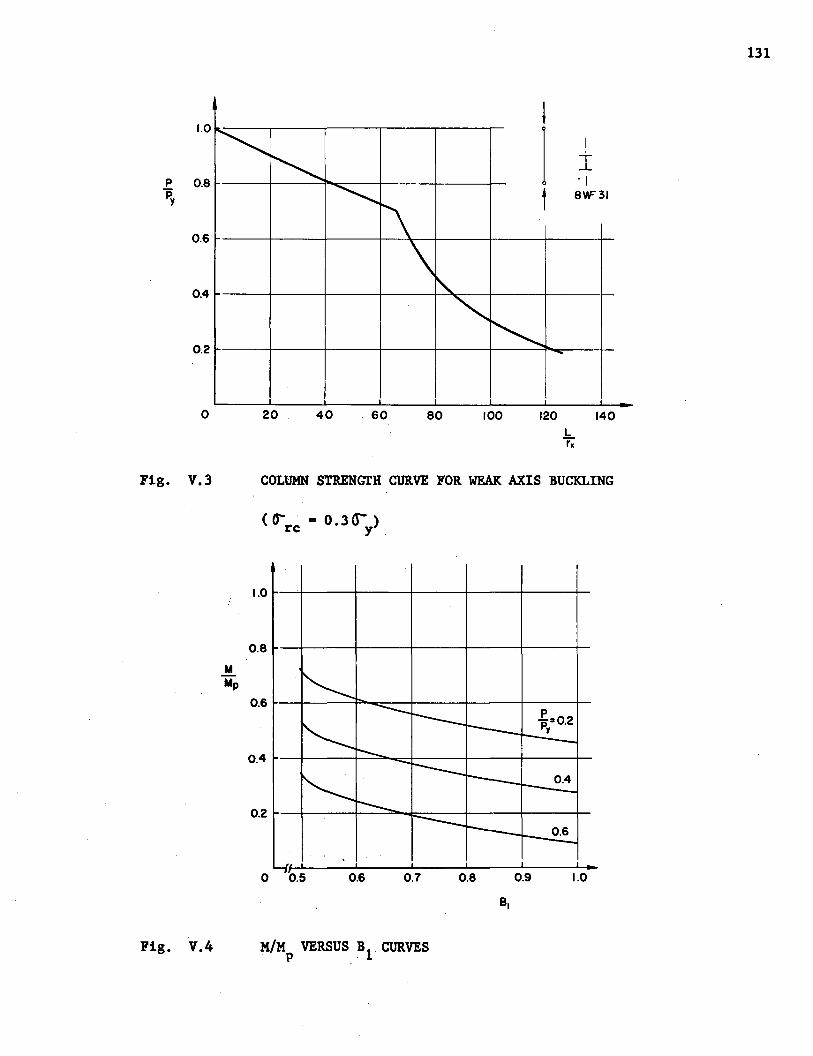
~
~ I I
~ ~. I
~ t 8W"31
'\\
'"'"~ -
1.0
P 0.8"Py
0.6
0.4
0.2
o 20 40 60 80 100 120 140Lr;:
131
Fig. V.3
MMp
COLUMN STRENGrH CURVE FOR WEAK AXIS BUCKLING
( (jrc III O. 3 0- )y .
1.0 ...--+----+----+----+----+----+-
0.8 I---+----+----+----+----+---_+_
0.6 t---+----?"""""==---+----+----+---_+_
0.4 t---+----+--=-....:::+----+----+---_+_
0.2 ...--+----+--""""'....c::,----+----+---_+_
" I 0.6 0.7 0.8 0.9' ..
1.0
Fig. V.4
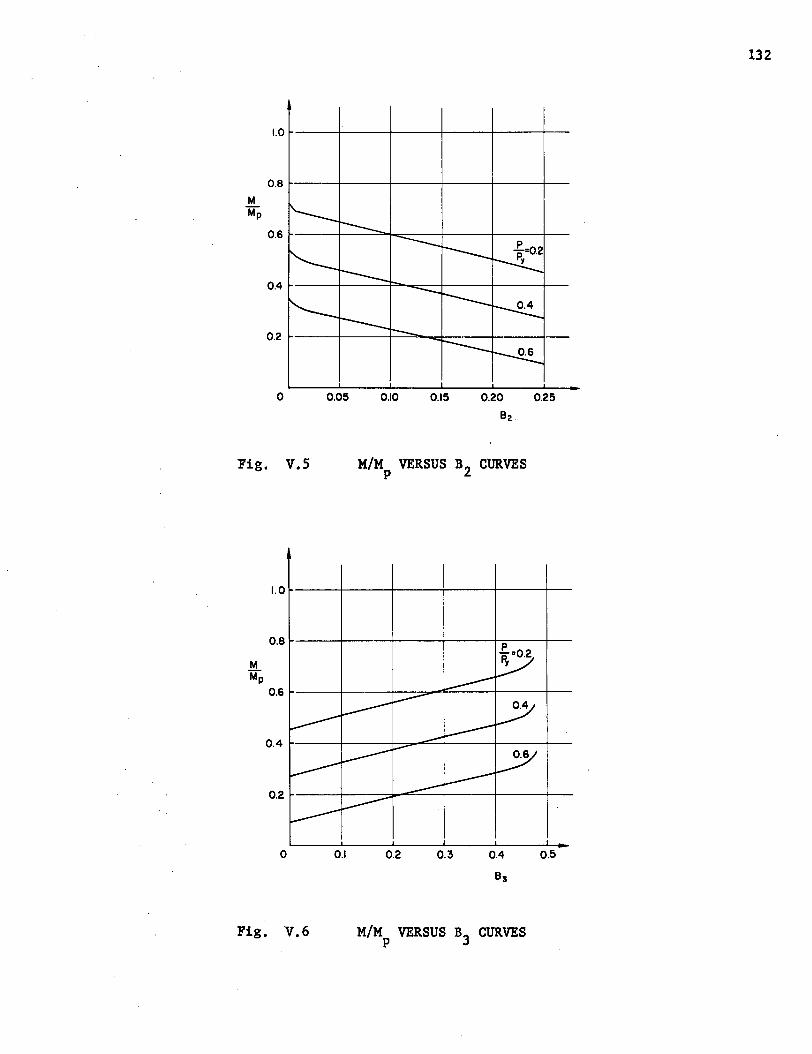
132
1.01--------1-------1-----+---+---+-
0.250.150.100.05o
0.8 1--------1-------1-----+---+---+-
0.4 t----t-------j::::-."""""::--l-----t-----t-
0.2 t----t-------j----.:::::-.......:::!:------t-----t-
MMp
0.6 1----I---~I_::::_------1,.__----+-----+-
Fig. V.5 M/Mp
VERSUS B2 CURVES
I. 0 t----t---t---j----j----t---
0.8 t----j----t------,t-------jl-;:------jt---
MMp
0.6 t----j----t---=-F----It-----II--
0.4 t----j----!-:::;;_=-t--------1t-----It---
0.2 1----j------=....-::::--I--------1I--------1I---
o 0.1 0.2 0.3 0.4 0.5
Fig. V.6 M/Mp
VERSUS B3 CURVES
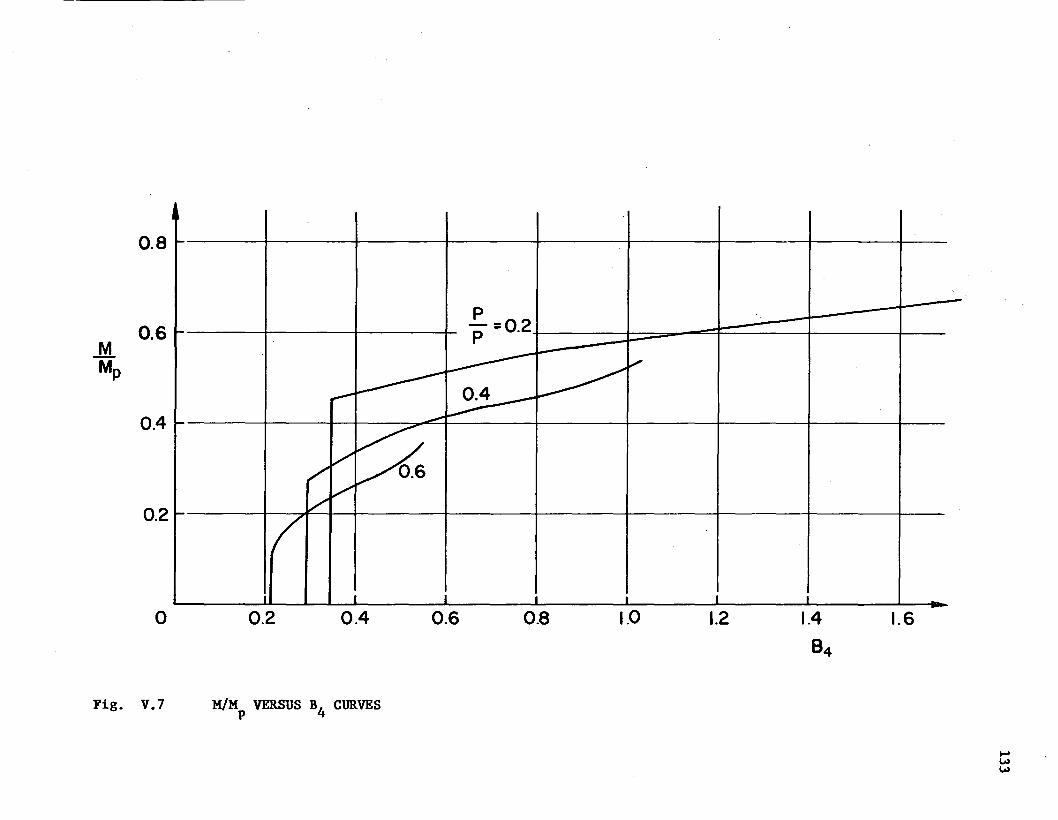
I
-Pp=0.2
--------~ .."
-------.--~
----~
/'V~
,/'V
II I I
0.8
0.6
0.4
0.2
o 0.2 0.4 0.6 0.8 1.0 1.2 1.6
Fig. V.7 M/Mp VERSUS B4 CURVES
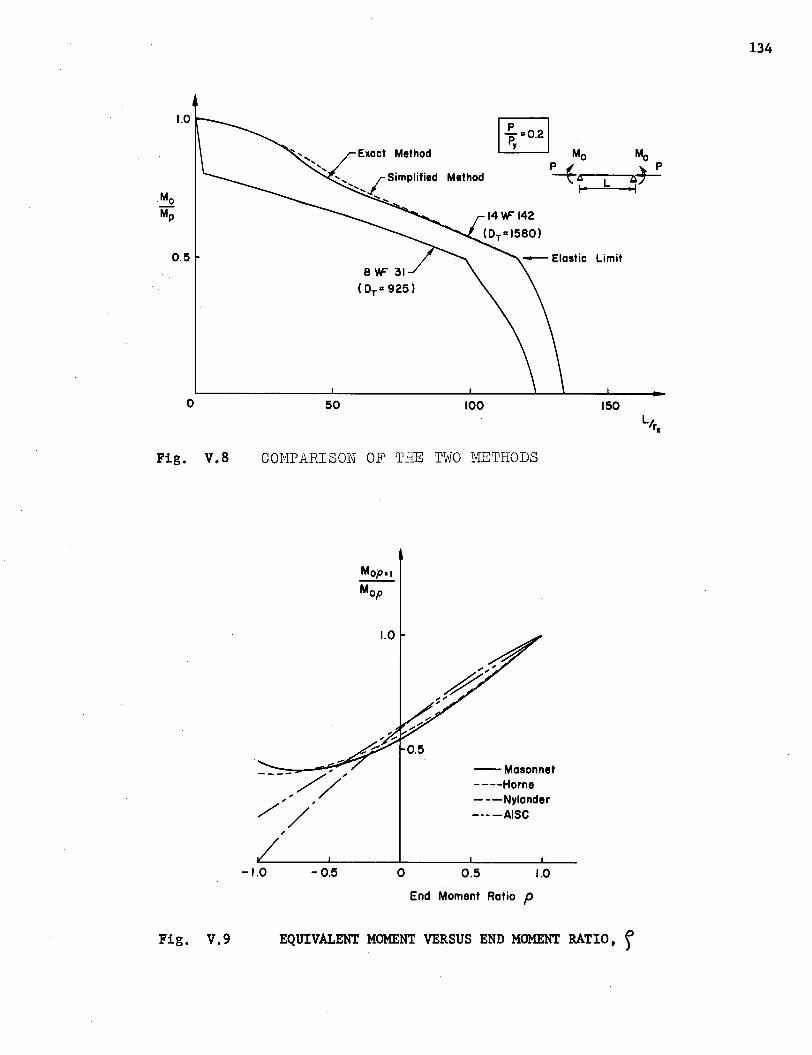
1.0
0.5
50 100
Limit
150
134
Fig. V.8 COMPARISON OF THE TWO METHODS
1.0
--Masonnet----Horne- --Nylander----AISC
-1.0 -0.5 o 0.5
End Moment Ratio p1.0
Fig. V.9 EQUIVALENT MOMENT VERSUS END MOMENT RATIO, f
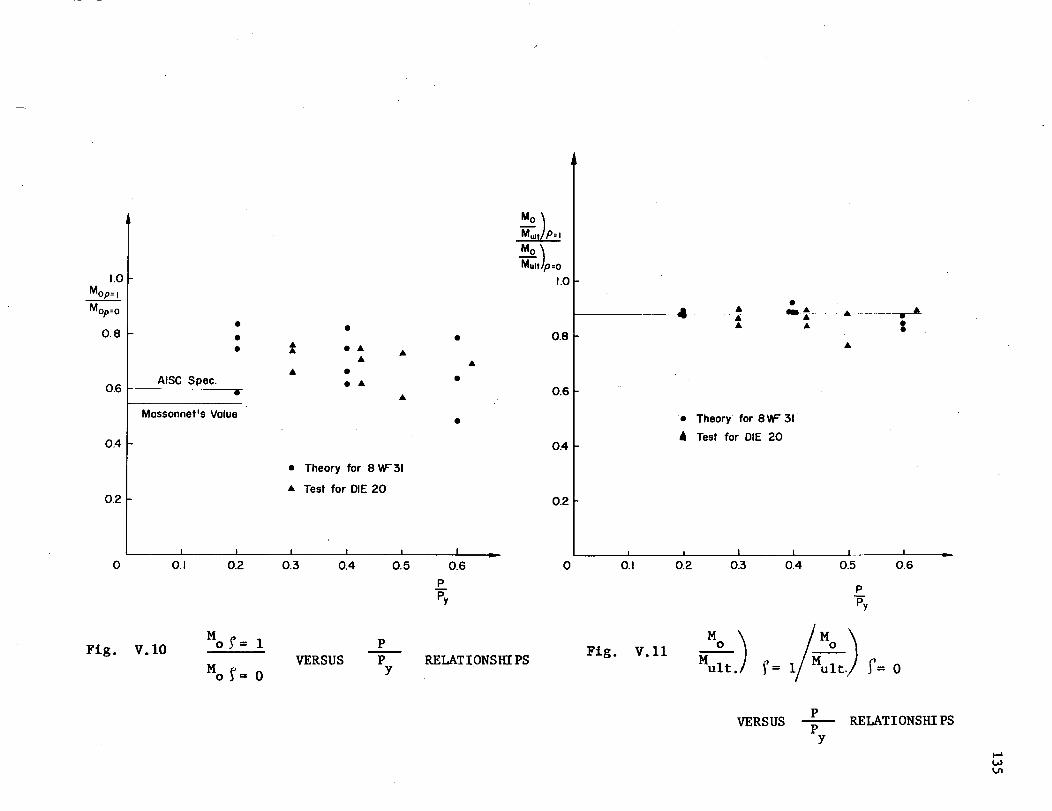
Massonnet's Value
AISC Spec.0.6 1--------.....
1.0MOp=1
Mop=o
0.8
0.4
0.2
•••
• •t ·'"'" '"'" •·'"•
•
• Theory for 8 IN" 31
'" Test for DIE 20
MO )M;;;, P=I
MO )
MUI' P=O
1.0
0.8
0.6
0.4
0.2
•
• Theory for 8 'IF 31
, Test for DIE 20
••
o
Fig. V.IO
0.1 0.2 0.3 0.4 0.5 0.6 0p
Py
Mo f= I P
MVERSUS P RELATIONSIIT PS
O}l:I 0 Y
0.1 0.2 0.3 0.4 0.5 0.6
PPy
Fig. V.ll M::J /M::J)1 = f= 0
VERSUS P RELATIONSHIPSPY
.....wVI
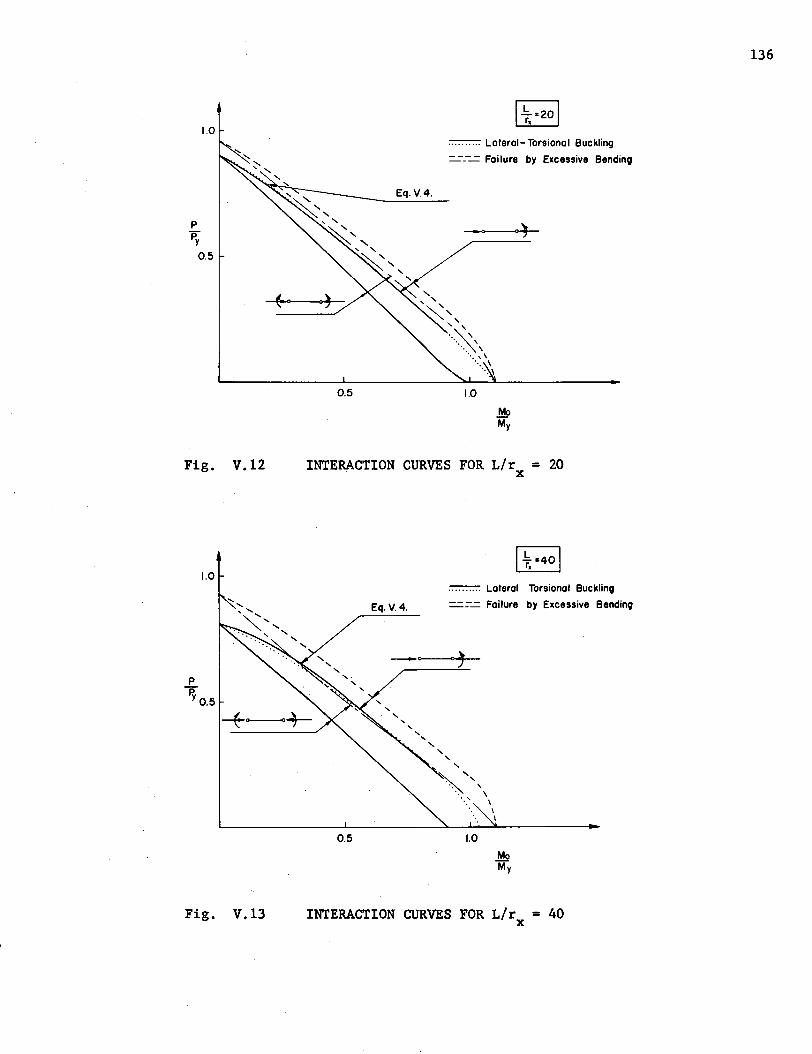
1.0
p
Py
0.5
-(-'0-0----eo'"'")-
0.5
IL =20 Ir.
~ Lateral-Torsional Buckling
=--=-= Failure by Excessive Bending
EQ.V.4.
o~
1.0
MoMy
136
Fig. V.i2
1.0
P""if
Y0.5
INTERACTION CURVES FOR L/r = 20. X
I.!:. =40 Ir.
= Laterol Torsional Buckling
==--= Failure by Excessive Bending
o~
0.5 1.0
Fig. V.13 INTERACTION CURVES FOR L/r = 40X
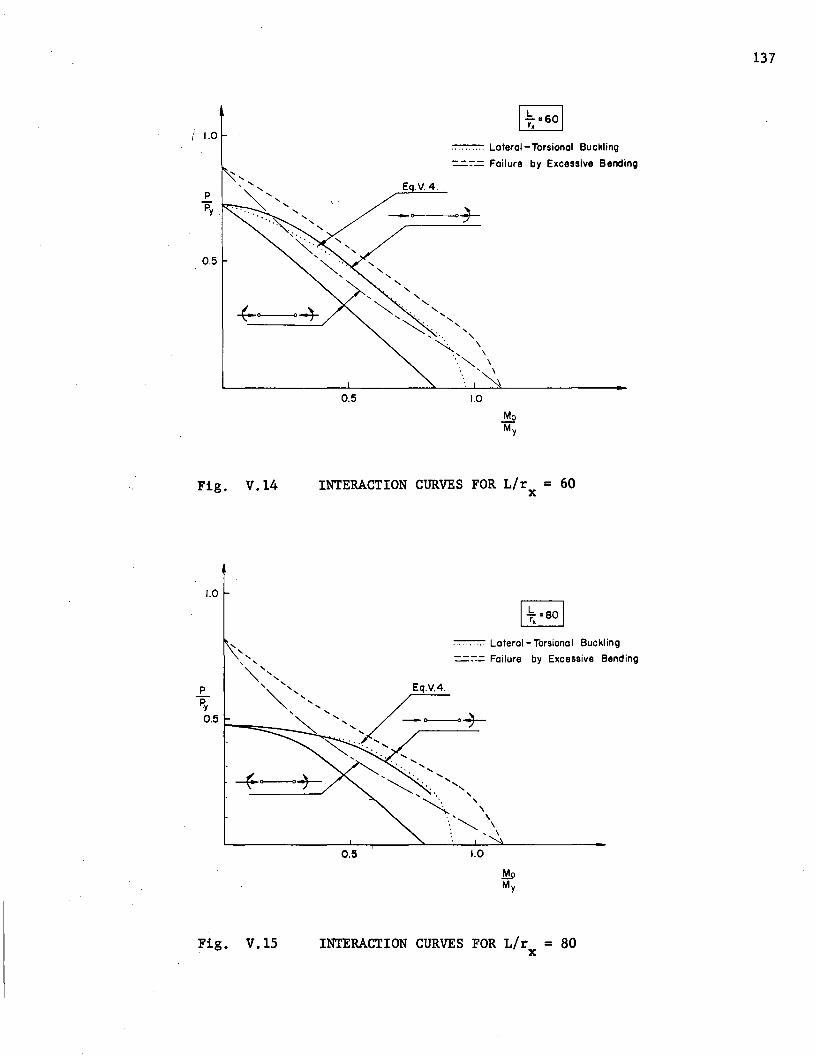
1.0
PPy
0.5
0.5
1 L =60 1r.
= Lateral-Torsional Buckling
=-=.:-..= Failure by Excessive Bending
E .v. 4.
o---_o~
1.0
137
Fig. V.14
1.0
PPy
0.5 t--=::::~_
INTERACTION CURVES FOR L/r = 60X
1.6.= 80 1r.
~ Lateral- Torsional Buckling
==-..= Failure by Excessive Bending
0.5 1.0
Fig. V.15 INTERACTION CURVES FOR L/r = 80X
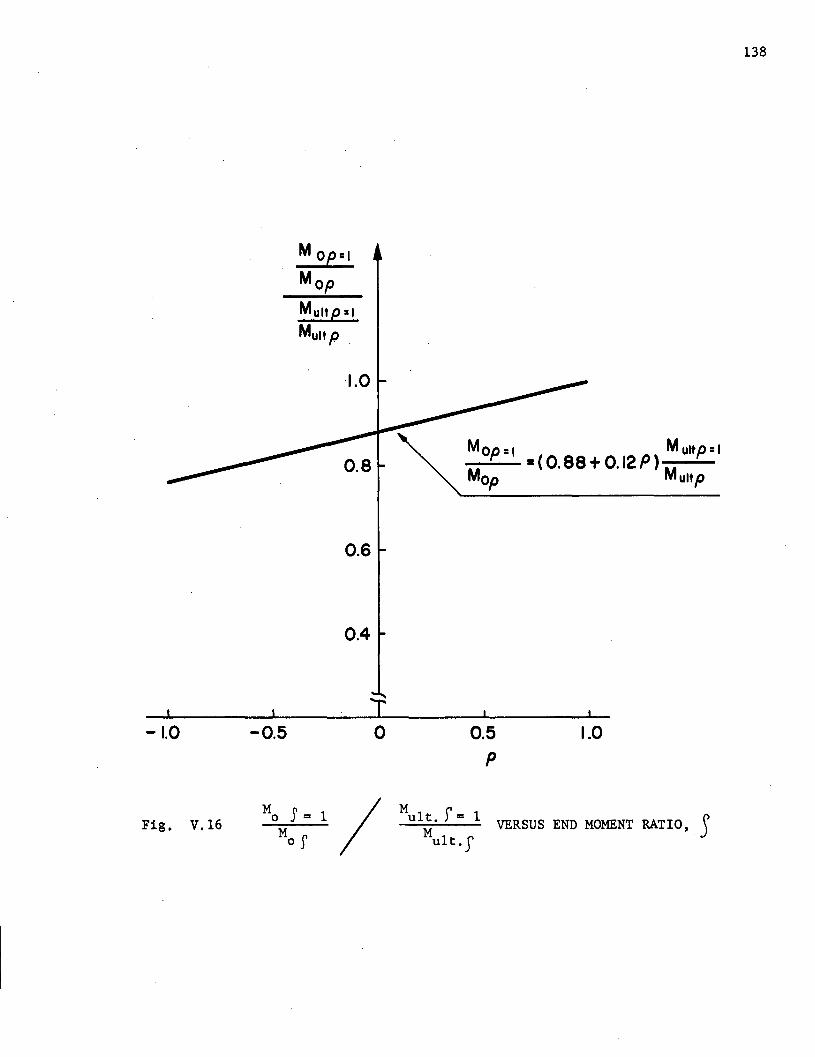
M Op=1
Mop
.MUltp =1
Multp
·1.0
0.6
0.4
Mop =1 Multp =1---- =(0.88+0.12P) MM~ u~
138
T-1.0 -0.5 0 0.5 1.0
P
Mo S = 1 / Mu1t . f = 1
Fig. V.16 VERSUS END MOMENT RATIO, SMo f M
u1t·S
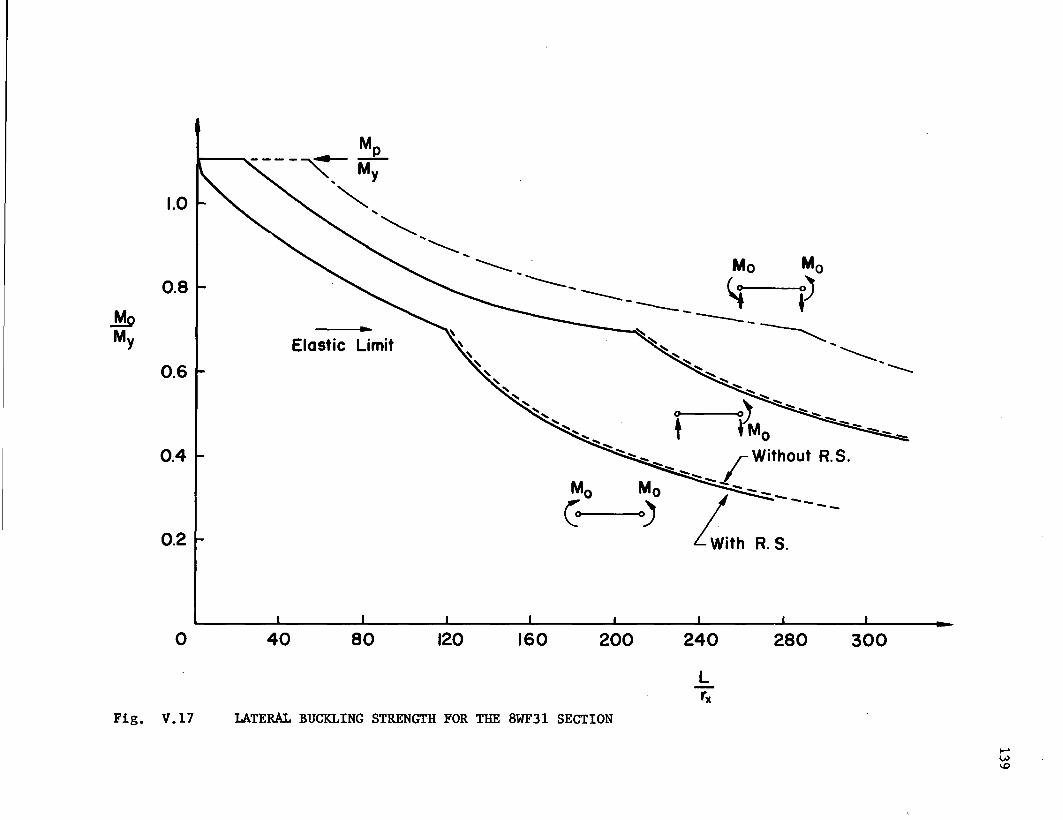
1.0
0.8
0.6
0.4
0.2
M----~~
,
"•
Elastic Limit
o 40 80 120 160 200 240
Lrx
280 300
Fig. V.17 LATERAL BUCKLING STRENGTH FOR THE 8WF31 SECTION
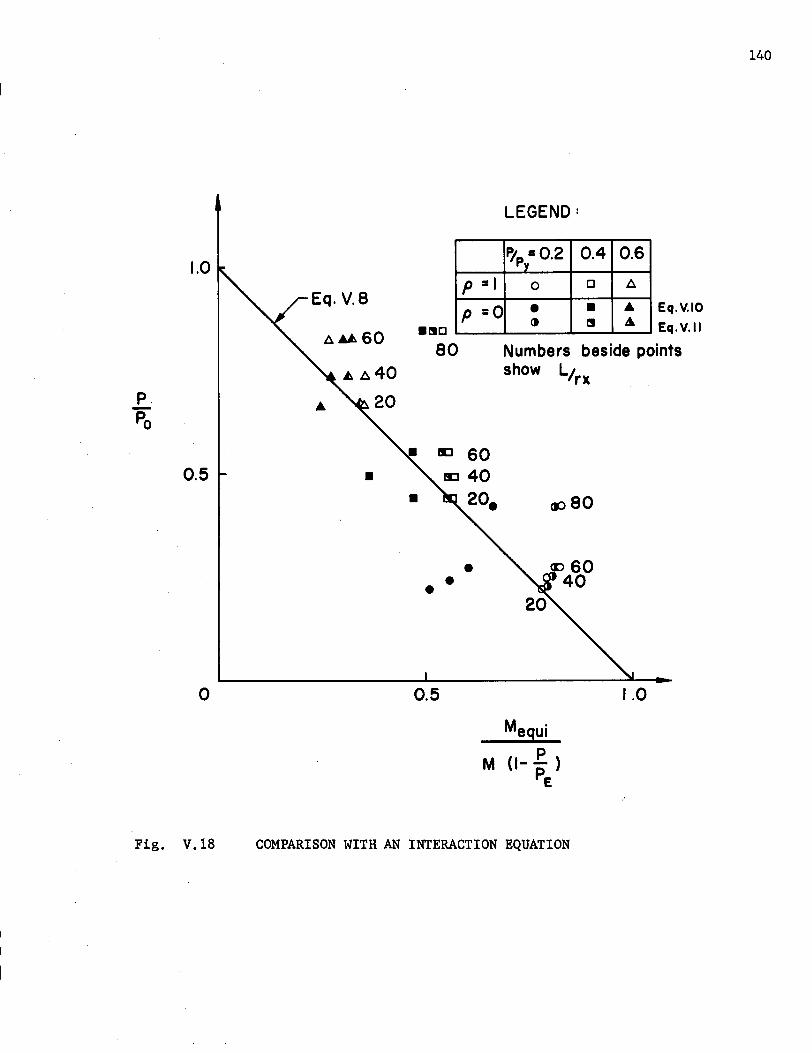
p/py
c O.2 0.4 0.6
P =1 0 0 A
P =0 • • ..<t l! .&
1.0
0.5
o
A6A60
•ID 60ID 40
• 20.
•••
0.5
LEGEND:
Eq.V.IO
Eq. V.II
Numbers beside pointsshow L/rx
~80
1.0
140
Fig. V.18 COMPARISON WITH AN INTERACTION EQUATION
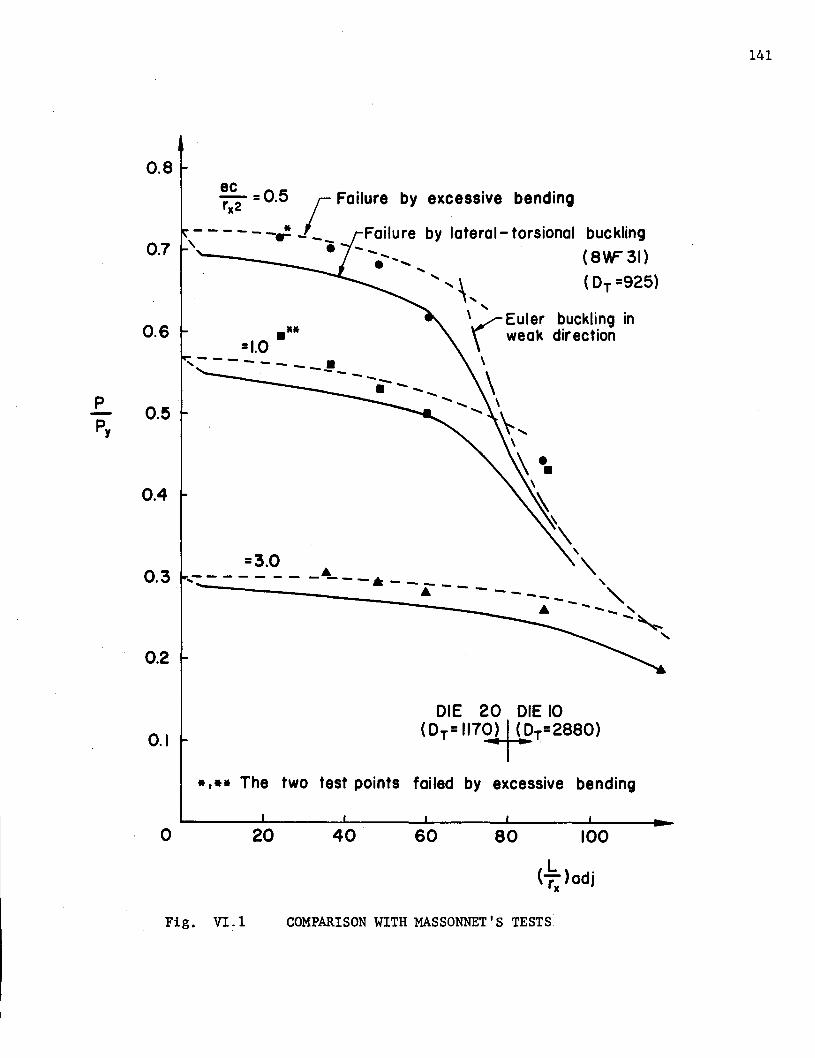
141
=30- - - - _. - - _A_ _ •
.... - ---.. ------ ...
----------.11.
=1.0
~~2 =0.5 r Failure by excessive bending
- - - - - -~ _ _ Failure by lateral- torsional buckling, -e - (8YF31)
........ .... \, (DT =925)
....\~ Euler buckling in\ weak direction
\
\\
~,\
~ e.\
~~
\\
","-................. "-,
'"
0.7
0.8
0.5
0.2
0.3
0.6
0.4
DIE 20 DIE 10(DT=1170J I'.!>T=2BBOI0.1
*,.* The two test points failed by excessive bending
o 20 40 60 80 100
(~x)adj
Fig. VI-I COMPARISON WITH MASSONNET'S TESTS
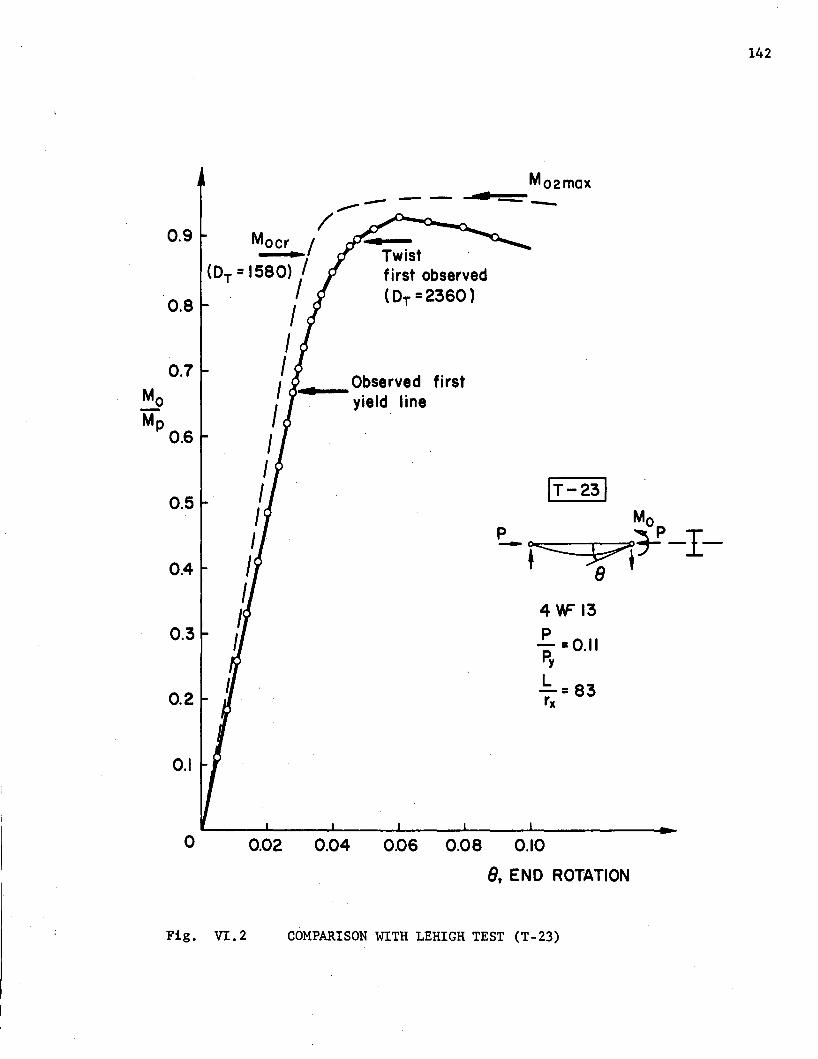
142
4VF 13P
"R=O.IIy
L-=83rlt
--c
Twistfirst observed(Dr =2360)
Observed firstyield line
,-- --/
Moer /•(Dr =1580) I
. /IIII •IIIIIIIIII0.3
0.5
0.4
0.2
0.8
0.9
0.1
o 0.02 0.04 0.06 0.08 0.10
8, END ROTATION
Fig. VI.2 COMPARISON WITH LEHIGH TEST (T-23)
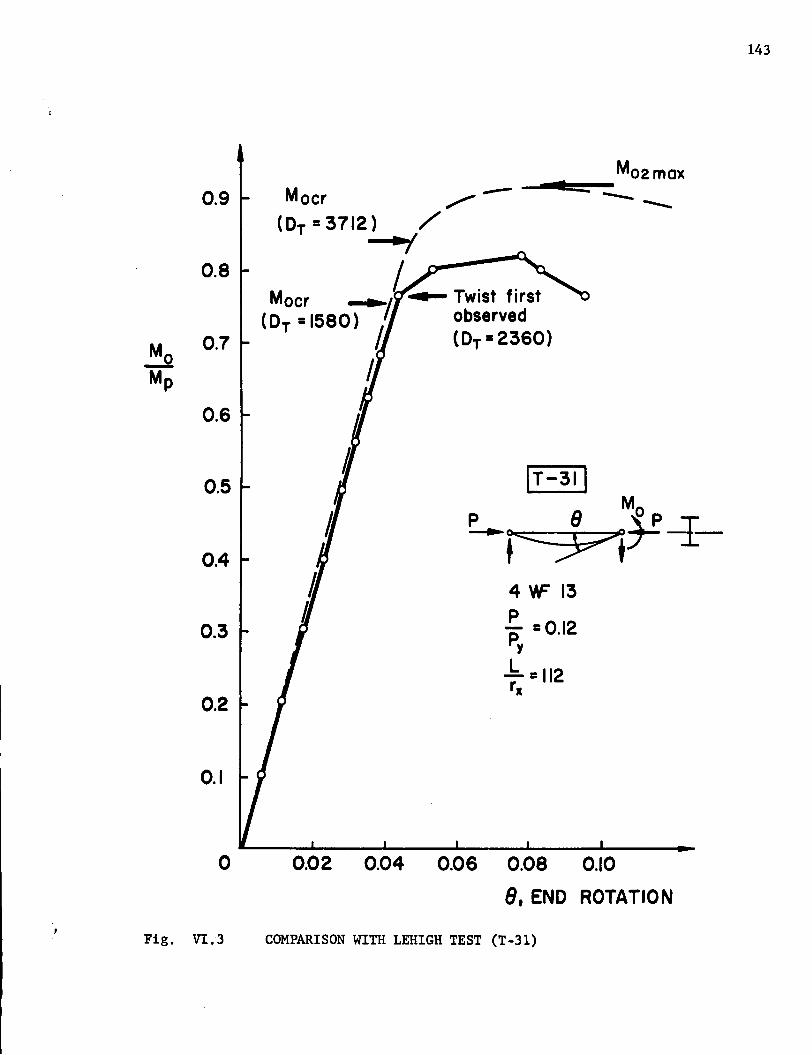
143
c - --. ---
4 'IF 13P~ =0.12
y
..b. =112rx
Ir-31 1M
P 8 if T~FY1/ --..r:-
Mocr ",,--
(Dr =3712) /.JI
Mocr -,1- Twist first(0 =1580) I~ observed
r h (Dr =2360)
~
0.5
0.7
0.6
0.9
0.4
0.2
0.8
0.1
0.3
o 0.02 0.04 0.06 0.08 0.10
8. END ROTATION
Fig. VI.3 COMPARISON WITH LEHIGH TEST (T-31)
n. VITA
The author was born in Kyoto, Japan on December 15, 1932,
the son of Masanori and Tomoko Fukumoto.
He graduated from Suzaku High School in Kyoto in March 1951~
He then attended Kyoto University from April, 1951 to March, 1957.
There he was awarded the degree of Bachelor of Science in Engineer
ing in March,1955, and the degree of Master of Science in Civil
Engineering in March,1957. He continued his study in the graduate
school of Kyoto University from April, 1957 to August, 1959, and of
the University of Illinois from September, 1959 to May, 1960.
He was appointed to a research assistantship at Fritz Engineer
ing Laboratory, Lehigh University in June, 1960. He has been associa
ted mainly with the research project on inelastic instability of beam
columns.
The author is married to the former Kazuko Inouye and they
are the-parents of Akiko and Kazuhiro Fukumoto.
-144-