laboratoire de mécanique des fluides et d‟acoustique, cnrs
TRANSCRIPT

1
Sustained inertial-capillary oscillations and jet formation in displacement flow in a tube
Yi Sui1 and Peter D. M. Spelt
1,2
1Department of Chemical Engineering, Imperial College London, United Kingdom
2Laboratoire de Mécanique des Fluides et d‟Acoustique, CNRS, Ecole Centrale de Lyon, Ecully, and
Université Claude Bernard Lyon 1, France
Abstract
We study inertial effects in the displacement of a fluid in a capillary by a more viscous fluid,
using a numerical method. A level-set approach is employed to track the meniscus and a
Navier slip boundary condition is imposed in order to alleviate a stress singularity at the
moving contact line. Various flow regimes are identified with a Reynolds and a capillary
number as the main parameters. At relatively low Reynolds number, the meniscus forms a
steady shape, and the interfacial curvature at the tube centre can change from being concave
to convex upon increasing the Reynolds number if the displacing fluid is wetting to the tube
surface. For wetting displacing fluids, beyond a critical Reynolds number, a quasi-steady
solution is no longer found: instead, the interface undergoes non-dampened periodic
oscillations and, at even larger values of the Reynolds number, quasi-periodically, and the
interface evolves from simple wavy shapes to complex shapes with multiple wavy units. This
oscillating state is observed for sufficiently small contact angle values defined from the
displacing fluid(< 80o). Beyond a second critical Reynolds number, the liquid forms a jet and
the meniscus advances with a nearly constant speed which decreases with Re. This is also
observed at large contact angle values. In a developing jet, however, the interface shape
remains partially quasi-steady, near the contact line region and the tube centre. The flow
behaviour is shown to be robust over a range of other governing parameters, including the

2
capillary number and the slip length. The potential implications of the work on network
models of two-phase flow through porous media are discussed.
I. INTRODUCTION
Flow wherein one fluid displaces another in a tube serves as a model for many phenomena in
nature and industry, such as in oil and gas transport through porous media. In a single
capillary, studies of steady and transient displacement flows have been conducted for cases
where the displaced fluid is much more viscous or even non-Newtonian (e.g., Refs 1-5).
Network models of immiscible displacement in porous media consist of such capillaries as
building blocks on the pore scale, often revealing fingering phenomena (e.g., Refs 6-13).
Often Stokes flow is assumed, by virtue of the small pore sizes. In capillaries, the meniscus
shape is then taken to be a circular cap consistent with an apparent contact angle, and the
corresponding pressure drop is used. Single-pore studies have shown that this is a reasonable
assumption as long as the capillary number is sufficiently low (see, for instance, Ref.14, as
briefly reviewed further below). Inertial effects in the rise of a liquid in a capillary towards an
equilibrium liquid column height have also been studied extensively, and it is well
established that these take the form of inertial-capillary oscillations in the height of the liquid
column about its equilibrium state that dampen out in time (e.g. Refs 15-16; a comprehensive
model of this behaviour is presented in Ref. 17). Here, we are concerned with inertial effects
in capillary flows through tubes under conditions wherein the flow rate of displacing fluid is
fixed instead, and not the result of capillary action, hence inertial oscillations in the total
volume occupied by the displacing fluid cannot occur. As yet, it is unclear what inertial
effects would occur here then. This “capillary flow that is not entirely due to capillarity” is
also of interest when considering high-speed two-phase flow through porous media (reviewed

3
in Ref 18, including cases wherein the Reynolds number based on pore size was larger than
103). There, the single-phase equivalent flow has received much attention so far, centred
mainly around extensions of a linear Darcy law between pressure gradient and flow rate, by
coupling the flow on the micro (or pore) scale to the macroscopic description (e.g., Refs 19-
25).
In the present study, we demonstrate that inertia first enters through modification of the
steady shape of the meniscus at modest values of the Reynolds number, Re. Beyond this,
sustained oscillations in the shape of the front of the displacing fluid may occur through a
supercritical Hopf bifurcation, which is characterized herein as well. The oscillations are not
in the height of the liquid column (studied extensively in, e.g., Refs 15-17), but in the
velocity of the contact line and the centreline velocity of the meniscus. A subsequent jet-type
flow regime, observed beyond a second critical value of Re, is also investigated and
characterized. Finally, the robustness of these regimes in terms of other dimensionless groups
is established. The requirement of inertial effects for the existence of these flow regimes is
discussed in the conclusion and discussion section.
We briefly discuss the prior work on the quasi-steady flow regime here first. A majority of
experimental studies26-28
has focussed on measuring an apparent dynamic contact angle and
establishing its relation with the static contact angle and speed of the contact line, to test
classical theories29-31
of moving contact lines. Finite-element simulations, with a Navier-slip
boundary condition (to alleviate the stress singularity at the contact line), have also been
carried out to study the steady macro meniscus shapes, for different values of the slip length
and capillary number in the creeping-flow regime32-33
. A theoretical model has been
developed by Dussan et al.34
to predict the interface shape near the moving contact line,
where the inner region and outer region overlap. This approach was extended beyond its

4
original region of validity to predict the macroscopic interface shape by Boender et al.35
and
by Ramé 14
for a liquid advancing or receding in a capillary tube filled with air.
Obviously, these earlier studies are all confined to low values of a Reynolds number, and
an objective of the present investigation is to study inertial effects in these systems as
outlined above, allowing for unsteady flow regimes; the flow is assumed to be axisymmetric.
A slip-length based level-set method, along the lines of that developed and well tested
initially by Spelt36, 37
, is adopted for this purpose. The problem statement and numerical
method are summarized in Sec.II. The validation against prior work in the quasi-steady flow
regime, and further analysis of this regime is discussed in Sec.IIIA. Results and analysis of a
new oscillatory regime, and a jetting regime are presented in Sec.IIIB and IIIC, respectively.
The flow regimes are shown to occur over a range of capillary numbers and other parameters
in Sec.IIID. The findings are there also summarized in the form of a map of flow states.
Finally, we establish the significance of the present findings for an application in network
models7,12,13
for flow through porous media by investigating the behaviour of a relative flow
resistance.
II. PROBLEM STATEMENT AND NUMERICAL METHOD
As illustrated in Fig. 1, we shall consider one fluid, which is pumped into a tube with cross-
sectional radius, a, displaces another fluid with which the tube is filled initially. The contact
angle θ is defined from the displacing fluid and its value is kept constant. Such an assumption
has been used in theories14,29-31
and numerical simulations32,33
of displacement flows, drop
spreading and sliding. For most cases in the present study, θ = 45° is used, which corresponds
to wetting displacing fluids, although the effect of changing the contact angle is studied in
detail in Sec.IIID. Both fluids are incompressible, viscous and immiscible. The viscosity and

5
density ratios of the fluids are denoted as λµ= µ2/µ1 and λρ= ρ2/ρ1, respectively. In the present
discussion we consider mainly the case λµ= λρ= 0.05, tests have shown that further
decreasing these ratios to 0.01 results in quantitatively very similar results. We assume that
the problem is axisymmetric, and the size of the computational domain is a×72a, which has
been found long enough to capture the various flow states.
FIG. 1. Problem definition sketch.
At the inlet (z=0), fully-developed Poiseuille flow is imposed with a cross-sectionally
averaged speed U. At the outlet, a zero normal velocity gradient outflow condition is used. At
the centreline of the tube, a symmetry boundary condition is used and at the wall (r = a), a
Navier slip boundary condition, Uw=-ε∂uz/∂r, is employed, where ε represents the slip length.
In the present study, the tube radius a and the average flow velocity U are chosen as the
macroscopic length and velocity scales, respectively. Hence the Reynolds number is defined
as Re = ρ1Ua/ µ1, and the capillary number as Ca = µ1U/σ, where σ represents the interfacial

6
tension between the two fluids. The initial velocity condition in the tube is set as fully-
developed Poiseuille flow. At low Reynolds number values, the initial interface profile is flat;
this evolves into a deformed, but steady-state shape (discussed further below) that we have
found to be independent of the initial interface shape used, for example a steady wavy shape
from a simulation with a lower Reynolds number. At high Reynolds numbers the interface
cannot achieve a steady state, and the initial shape is set as the shape of the highest Reynolds
number for which a steady state could be achieved (specified further in the Results section
below).
The level-set method used herein is essentially that of Spelt36, 37
, and Ding et al.38, 39
, which
is an extension of the method developed by Sussman et al.40
to account for moving contact
lines. Here we just give a brief summary (details can be found in the pertinent literature).
In level-set methods, the level-set function φ(x, t) is taken to be a signed distance function
from the interface, and the sign is used to distinguish between the two fluids; the zero level
set corresponds to the interface. The level-set function is advanced using the advection
equation,
. (1)
The advection equation only holds at φ = 0, and a „redistance‟ step41
is used to ensure that φ
at points away from the interface remains approximately the signed distance function. The
equations of motion are combined into one variable-density/viscosity formulation, with the
local density and viscosity are functions of φ(x, t). The abrupt change in these fluid properties
across the interface is smoothed out over a length that is proportional to the grid spacing. The
action of surface tension is represented as a singular force density term in the momentum
equation, also smoothed out over several mesh points.
In the present simulation, a finite volume method based on a marker-and-cell (MAC) mesh
is employed. The velocity components are defined at cell faces and scalar variables such as

7
pressure and volume fraction are defined at the cell centres. A fifth-order weighted essentially
non-oscillatory (WENO) scheme42
is employed in the discretization of the advection term in
level-set function using the local flow velocity as the up-winding direction. More details
regarding the implementation of boundary condition to account for moving contact lines with
a specified contact angle can be found in Spelt36, 37
and in Ding et al.38, 39
, where various
numerical tests have been carried out. For all cases considered in the present study, we have
found that the global error in mass conservation for each phase is below 0.1% throughout the
simulations.
Most interface capturing methods employ a MAC grid, such that the volume fraction is
advected by the cell-face-normal velocity. This induces a numerical slip when simulating
moving contact line problem43, 44
. However, it is found that when the slip length is resolved
by the mesh resolution, the results converge. This greatly restricts the slip length one can
simulate, though: in most of our simulations we use a slip length of 0.02a for this reason.
This is further discussed in Sec.IIID below. Finite-element methods32, 45, 46
with local mesh
refinement have been employed previously and much smaller slip lengths have been
simulated, but those were for steady flows or flows without contact lines. In the present study,
a grid size of 51×3601 has been employed to cover the computational domain, and we find
that this is sufficient to give a converged result. Tests on the temporal evolution of the contact
line location along the tube wall and the instantaneous interface shapes gave nearly identical
results for dr = 0.01a and 0.02a (not shown).
III. RESULTS AND DISCUSSION
In the present investigation, unless indicated otherwise, we change the Reynolds number
whilst keeping all other parameters constant. For the cases considered, in general we have
indentified three flow states: (a) a quasi-steady state where the meniscus reaches a steady
shape and the contact-line speed is constant; (b) an oscillating state wherein the interface

8
shows non-dampened oscillations; (c) a jetting state. Details of the various states are
presented and discussed separate subsections (A-C) below, followed by a further parametric
study.
A. Steady regime
For Ca = 0.05, θ = 45°, we find that the meniscus reaches a steady shape when the flow
Reynolds number is relatively small, after an initial transient stage. The steady meniscus
shapes for different Reynolds numbers are presented in Fig. 2(a), where we have made the
respective locations of the contact line to coincide for convenience of presentation. The
steady, concave menisci for Re = 0.5 and 5 are virtually identical. A matched asymptotic
approach for creeping flows has been used previously
14, 34, 35 to predict the meniscus
advancing or receding in a capillary tube. These theoretical results have been found
previously to agree very well with finite elements simulation by Lowndes32
. For comparison,
we have also plotted the steady interface shape predicted by this theoretical model14
in Fig.
2(a); it is seen that the present simulations also agree well with this previous result. With
increasing Reynolds number, the interface shape predicted by the simulations obviously
deviates from the analytical solution, which does not account for any inertia effects. An
interesting feature here is that the interface at the tube centre changes from concave to convex
(the curvature changes sign); the transition happens between Re = 50 and 100. This is clearer
in Fig.2(b), which shows the angle between interface and vertical tube wall as a function of
interfacial distance to the moving contact line. The distance to the moving contact line has
been normalized by the total length of the curved interface. For creeping flow, along the
interface and apart from the contact line, the angle increases monotonically while at larger
Reynolds numbers, the angle increases to a value large than 90° and then decreases to 90°,
indicating that the meniscus has a wavy shape.

9
(a) (b)
FIG. 2. (a) Steady interface shapes; (b) angle between interface and vertical tube wall as a
function of interfacial distance to the moving contact line.
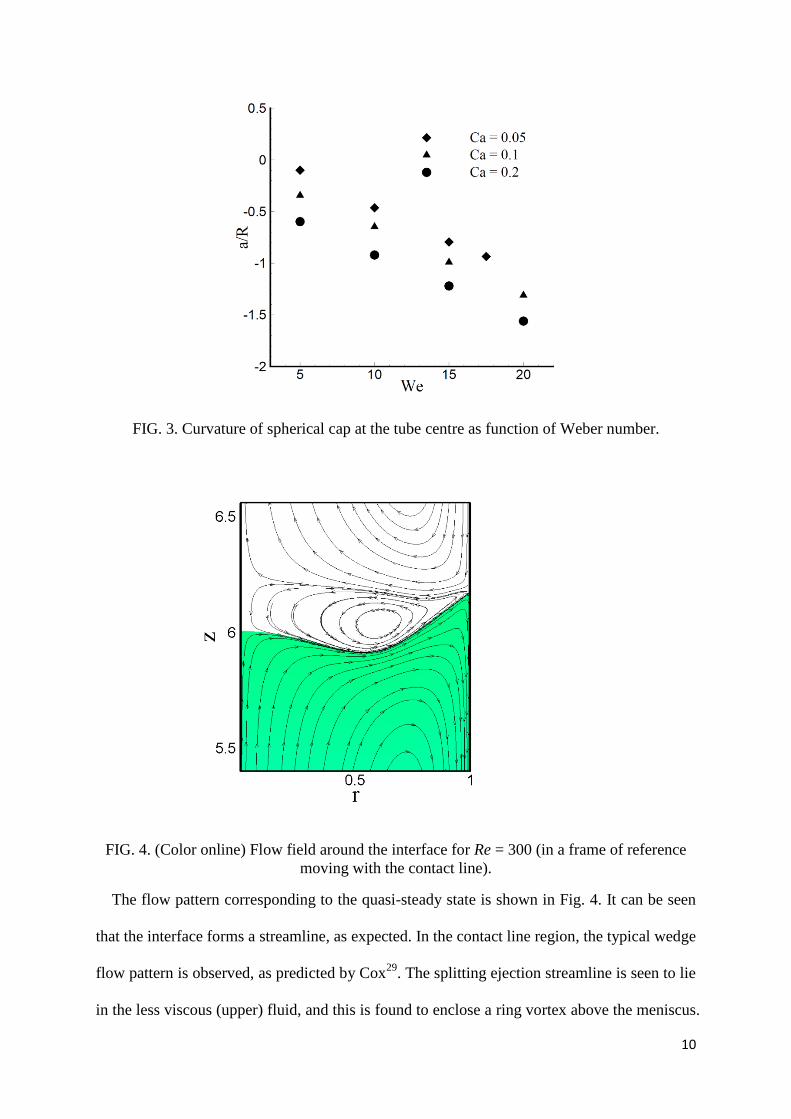
A simple force balance can be formulated at these values of Re (especially when far
removed from the contact line), by equating the orders of magnitude of inertia and capillary
forces, ρU2·R
2 and (σ/R)·R
2, where R is the radius of the spherical cap at the tube centre. This
gives a/R ~ We (where We=ReCa). In Fig. 3 we present the normalized curvature of the
spherical cap at the tube centre as a function of Reynolds number for cases with different
capillary numbers, and it can be seen that a/R changes nearly linearly with We.
10
FIG. 3. Curvature of spherical cap at the tube centre as function of Weber number.
FIG. 4. (Color online) Flow field around the interface for Re = 300 (in a frame of reference
moving with the contact line).
The flow pattern corresponding to the quasi-steady state is shown in Fig. 4. It can be seen
that the interface forms a streamline, as expected. In the contact line region, the typical wedge
flow pattern is observed, as predicted by Cox29
. The splitting ejection streamline is seen to lie
in the less viscous (upper) fluid, and this is found to enclose a ring vortex above the meniscus.

11
B. Oscillating regime
Here, initially we have started simulations with the steady-state meniscus shape and flow
field obtained for Re = 350. When the Reynolds number is now increased above a critical
value, around 365 for the present case, a quasi-steady solution is no longer found. Instead, a
periodic oscillation is observed. We have observed hysteresis in the transition: that is, if a
simulation is started from an instantaneous interface shape and flow field around at Re = 400,
we find that the flow becomes steady when the Reynolds number is less than 360. For the
results presented in this section, we use the latter as the initial condition.
The properties of the periodic state are presented in Fig. 5 for Re = 400. As can be seen in
Fig. 5(a), the contact line velocity along the tube wall evolves with time and its Fourier power
spectrum shows one fundamental frequency and its harmonics. The meniscus shape also
oscillates at this frequency. The meniscus shapes within one period are shown in Fig. 5(c).
The oscillation amplitude of the contact line velocity along the tube wall is presented as a
function of Reynolds number in Fig. 6. It can be seen that just after the transition from the
steady to the periodic state, the amplitude increases with Reynolds number nearly linearly.
Since any possible quasi-steady solution at these Re values would be unstable, this suggests a
supercritical Hopf bifurcation.

12
FIG. 5. (a) Time evolution of the contact line velocity along the tube wall; (b) Fourier power
spectra of the contact line velocity; (c) interface shapes within an oscillation period for Re =
400.

13
FIG. 6. Oscillation amplitude of the contact line velocity along the tube wall as a function of
Reynolds number for Ca = 0.05.
Further increase of the Reynolds number leads to a quasi-periodic state, as shown for
example in Fig. 7 for Re = 500. A Fourier transformation has been carried out for the
temporal evolution of the contact line velocity along the tube wall and the power spectra, the
result of which is shown in Fig. 7(b). Two fundamental frequencies are observed as well as
the linear combination mf1+nf2, where m and n are integers, f1 and f2 are the high and low
fundamental frequencies respectively. The instantaneous interface profiles are shown in
figure 7(c), at t = 0.326T1 and 0.489T1, it can be seen that along the interface the curvature
changes sign twice. In the periodic state with one fundamental frequency, the interfacial
curvature only changes sign once along the meniscus.

14
FIG. 7. (a) Time evolution of the contact line velocity along the tube wall; (b) Fourier power
spectra of the contact line velocity; (c) interface shapes within an oscillation period
corresponding to the high frequency T1 = 1/ω1 for Re = 500.

15
FIG. 8. Dimensionless oscillation period of the contact line velocity along the tube wall as a
function of Reynolds number. For quasi-periodic state at Re=500, T1 is used.
If the interface is modelled as a spring with the spring stiffness being the coefficient of
surface tension, the natural response time would be the inertial/capillary time scale
(as pointed out previously by Biance et al.47
for liquid drops, for example). Figure 8
shows the oscillation period of the contact line velocity along the tube wall, normalized by
the inertia/capillary time scale, as a function of Reynolds number. The results suggest that the
dynamical behaviour of the interface can indeed be scaled by the inertia/capillary time. The
capillary wave propagates between the contact line and tube centre. Bian et al.48
studied the
natural frequency of a liquid slug in capillary tube theoretically and experimentally. They
found that the natural frequency is related to the axial length of the liquid mass. For the
present tube flow, the liquid part is increasing its length continuously whereas the frequency
and oscillation amplitude remain constant, which suggests that the present oscillation is
different from that of Bian et al.48
.

16
C. Jetting regime
Beyond Re = 600, the oscillation features of the interface disappear and the interface forms a
jet instead. A good example of this jetting regime is for Re = 800, a snapshot of which is
shown in Fig. 9. As can be seen from Fig. 9(a), most liquid flows along the tube centre and a
slender liquid jet develops. Along the tube wall, a film of the less viscous fluid is formed and
its length is increasing with time.
We investigate the instantaneous interface shape at different times by collapsing the
contact line positions, and the results are presented in Fig. 9(b). It is interesting to see that
there is a quasi-steady region of the interface around the contact line, in spite of the overall
unsteady nature of this flow state. Similarly, the region around the tube centre is found to be
quasi-steady. Between these two regions, the jet is increasing its length continuously.
Next, we investigate whether the jet length approaches a constant value, which would
require that the velocity of the interface at the tube centre and the contact line must finally
become the same. Figure 10(a) presents the temporal evolution of the interface velocity at
these two locations. It can be seen that the contact line moves in a quasi-steady manner, in
which the velocity is increasing extremely slowly. At the tube centre, the interface velocity
decreases slowly and starts a slight oscillation at late times. This oscillation is due to a
capillary-type instability which develops at the jet front: Fig.10(b) presents the instantaneous
interface profile at t = 40, which is well before the velocities of the interface at the tube centre
and contact line approach each other. It can be seen that a capillary-type instability becomes

17
(a) (b)
FIG. 9. For Re = 800 (a) instantaneous interface profile at t = 25; (b) interface profiles for t =
20, 21, 22, 23, 24 and 25 around the contact line (we have collapsed the contact lines).
apparent in the necking region, and the bulge in the jet approaches the wall to form new
contact lines (which is beyond the scope of the present work). We have observed similar
phenomena for all cases that lead to a jetting regime.

18
(a) (b)
FIG. 10. (a) Temporal evolution of the interface velocity at the tube centre and the contact
line; (b) interface profile at t = 40 for Re = 800.
FIG. 11. (Color online) Streamline pattern around the contact line for Re = 800 (in a frame of
reference moving with the contact line).

19
We investigate the flow field around the moving contact line in the jetting regime, and
present the result, in Fig. 11. Very close to the contact line, a wedge flow pattern similar to
that in the steady regime is observed once more. We note however that the interfacial velocity
(in the moving frame of reference) changes sign along the interface at a stagnation point. The
stagnation point is in fact the boundary separating the quasi-steady region near the contact
line from the middle region whose length is increased continuously by viscous shear force.
In the jetting regime, one can again fit a circular cap to the quasi-steady interface at the
tube centre and present its curvature as function of Reynolds number; the result is shown in
Fig. 12, which also includes the results from the steady regime. We find that a/R changes
FIG. 12. Curvature of the spherical cap at the tube centre as function of Reynolds number.

20
FIG. 13. Curvature of spherical cap near the contact line as function of Reynolds number.
linearly with Re along the same line in both regimes. This further supports our force balance
arguments at the tube centre presented in Sec.IIIA. In the other quasi-steady region of the
interface around the moving contact line, we have also fitted a circle to the lowest part of the
interface and determined its curvature. Alternatively this can be achieved by computing ds/dθ
at θ = 90° near the contact line. The curvature is plotted in Fig. 13 as a function of Reynolds
number. It can be seen that the curvature increases with Re. Actually, the radius of curvature
of the quasi-steady region of the interface around the moving contact line is positively related
to the thickness of the film between the jet and the wall. Our results show that, with
increasing Reynolds number or capillary number, the film thickness decreases.
D. Parametric study: effects of θ, λµ , Ca and ε.
We have studied the effect of the value of the contact angle on the flow states in the tube. In
the steady regime, it is found that when the contact angle is larger than 90°, the interface can
still form a steady shape but is no longer wavy, that is, the curvature does not change sign

21
along the interface. For higher values of the Reynolds number where the oscillation of the
interface could appear, results for different contact angles are presented in Figure 14 for Re =
450, Ca = 0.05. With increasing the contact angle, the oscillation amplitude of the contact
line velocity decreases and a transition to jetting happens when the contact angle is beyond
80°. In conclusion, use of non-wetting displacing fluids promotes the formation of jets in
displacement flows and suppresses inertial-capillary oscillations.
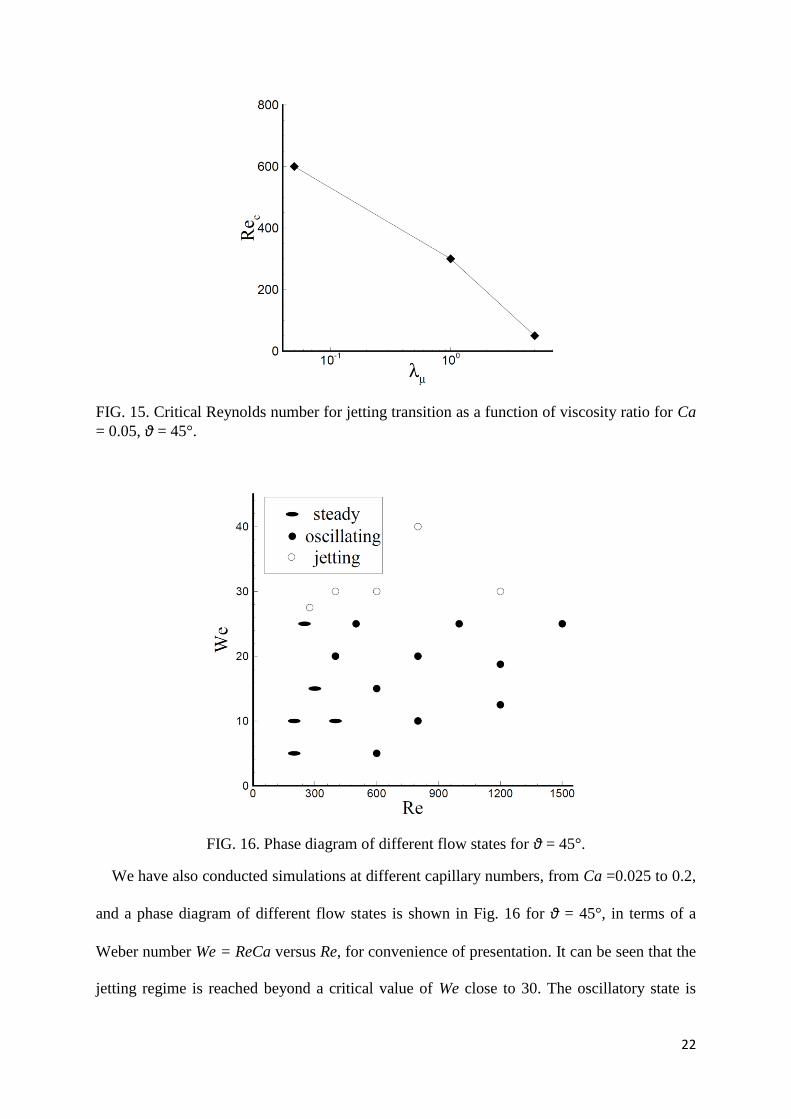
The effect of the value of the viscosity ratio on the transition to jetting has also been
investigated and the results are presented for θ = 45° and Ca = 0.05 in Fig.15. It can be seen
that if the displacing fluid is less viscous, a jet tends to develop at lower Reynolds numbers.
For example, at λµ= 5, the flow is already in a jetting regime when Re is beyond 50 and
oscillations of the interface are not observed.
FIG. 14. Time evolution of the contact line velocity along the tube wall for different contact
angles at Re = 450, Ca = 0.05.
22
FIG. 15. Critical Reynolds number for jetting transition as a function of viscosity ratio for Ca
= 0.05, θ = 45°.
FIG. 16. Phase diagram of different flow states for θ = 45°.
We have also conducted simulations at different capillary numbers, from Ca =0.025 to 0.2,
and a phase diagram of different flow states is shown in Fig. 16 for θ = 45°, in terms of a
Weber number We = ReCa versus Re, for convenience of presentation. It can be seen that the
jetting regime is reached beyond a critical value of We close to 30. The oscillatory state is

23
observed beyond a critical value of Re, and to occur over an increasing range of We as Re is
increased.
(a) (b)
FIG. 17. (a) Time evolution of the contact line velocity along the tube wall for different
slip lengths for We=22.5; (b) angle between interface and vertical tube wall as a function of
interfacial distance to the moving contact line.
A restriction of the present study is that the slip length ε = O(10-2
), which falls well short of
realistic conditions which would demand ε = O(10-4
), at most 49, 50
. This is mainly due to the
fact that in direct numerical simulations the slip length must be resolved by the numerical
grid. A realistic slip length would require a mesh resolution that would be well beyond
present computational resources. Even so, we have carried out several simulations at a
significantly smaller slip length value of ε = 0.004. The grid spacing was also reduced to dr =
0.004, where results were found to have converged with respect to the grid spacing.
The time signals of the contact line velocity along the tube wall for different slip lengths
are presented in Fig.17(a). It can be seen that lowering the value of the slip length leads to a
decrease in oscillation amplitude. However, at a relatively small slip length, decreasing the
value of Ca to 0.0375 (we have kept We fixed here, motivated by Fig.16) makes the
oscillation strong again, as shown in Fig.17(a). In Fig. 17(b), we show the angle that the

24
interface makes with the tube wall as a function of the distance to the moving contact line, for
the cases shown in Fig. 17(a), at an instance when the moving contact lines velocities are
approximately equal. An apparent contact angle can be defined by extrapolating the linear
region near the contact line to s=0. This apparent angle is found to increase upon reducing the
slip length. From the results in Fig. 14, it may be expected that an increase in apparent angle
would suppress the oscillation of the interface. When Ca is reduced to 0.0375 at ε = 0.004, it
is found in Fig. 17(b) that the apparent angle (thus defined) decreases to a value close to that
for Ca=0.05 and ε = 0.02, and strong oscillations with a similar amplitude appears again. This
is also supported by analytical theories of contact-line motion. For instance, the theory of
Cox29
relates an apparent angle to the static angle through the relation
(2)
where g is the integration function, lma is the macroscopic length scale (e.g. tube radius) and
lmi represents the microscopic length scale which is usually set as the slip length. Of course,
this theory is for creeping flows, but in a later study, Cox51
argued that for rapid spreading, a
viscous sublayer (between an inertial sublayer and the wall) can be identified, and that the
angle at the outer edge of that layer satisfies Eq.(2) above if the argument of the log term is
divided by a Reynolds number. The present simulations do not quite meet the criteria for
which this theory was derived (Re>>1 and Ca <<1 whilst (lmi/lma)Re<<1; this last condition is
not met herein, which leads to a negative log term in the analogue of Eq.(2)) and we therefore
use Eq.(2) and return to this issue below. Now, a reduction in slip length is seen to increase
the second term on the right-hand-side of Eq.(2) and therefore increases the apparent angle,
while decreasing Ca has the opposite effect. If we compare the value of
for the
two cases with strong oscillation in Fig.17, it is found that these values are 0.20 and 0.21 for
Ca = 0.05 and 0.0375, respectively, which are very close. An additional factor of Re would

25
not significantly change the argument, since Re only changes from 450 to 600 in the log term.
This would suggest that for realistic conditions, e.g. ε = 0.0001, a capillary number which can
keep the value of
close to 0.2 (giving Ca = 0.022) would be expected to lead to
an oscillating state of the interface for conditions in Fig. 17 (We=22.5 and θ = 45°). As this
would correspond to a change in Re from 600 to about 1000, which would suggest that the
argument in the log term in the equivalent of Eq.(2) for the viscous sublayer of Cox51
would
not drastically alter due to a change in the value of Re, thereby supporting the assumptions
made regarding the use of Eq.(2). It should be noted that the Navier-slip condition has been
used here along the entire pipe wall, not only in the proximity of the moving contact line, as
is the case of Cox29, 51
. We have carried out simulations wherein the Navier-slip condition is
only applied in a small region within one slip length from the contact line, and the result (not
shown) indicates that there is only a modest quantitative difference (which of course would
be smaller if a slightly larger slip region is used). Similar insensitivity has been observed in
the work of Bazhlekov and Chesters33
.
In the jetting regime, we find that a smaller slip length results in a lower velocity of the
moving contact line and so that more liquid will go to the tube centre to form a stronger jet.
This leads to a lower critical Reynolds number for transition to jetting.
E. Flow resistance
The present displacement flow in a tube may provide useful information for the modelling of
multiphase flows in porous media consisting of tubes networks. A relatively simple
multiphase model52
is based on Darcy‟s law, in which fully-developed tube flow is assumed
and the flow resistance is proportional to the wetted length. More developed models7, 12
take
into account the effect of the interface, and the capillary pressure is always assumed as a
constant.

26
In the present study, we have calculated the wall shear force from the simulation results
and normalized it by the force obtained from Darcy‟s law52
, resulting in a relative flow
resistance:
(3)
where and represent the wall shear stress from simulation and the analytical solution
and l is the wetted length l. From the results presented in Fig.18, it can be seen that the
simplified model based on Darcy‟s law underestimates the flow resistance at the early stage
of filling of the tube. This is because the wetted length is short and the shear force
contribution from region near the contact line is relatively stronger. A strong oscillation in
the flow resistance can be observed when the liquid interface is in the oscillating regime,
which may have significant consequences for porous media consisting of tubes networks
FIG. 18. Time evolution of relative flow resistance at different flow regimes for Ca = 0.05, θ
= 45°.

27
when the flow rate in individual capillaries is rather large. The oscillation of flow resistance
due to the inertia effects may have to be taken into account when developing advanced
network models for high speed flow through porous media18
.
IV. CONCLUSION AND DISCUSSION
We have investigated inertial effects in the flow of a fluid displacing another fluid in a tube,
using a slip-length-based level-set method. Three different regimes are found for cases where
the contact angle is small when increasing a Reynolds number, Re (whilst keeping other
parameters constant). At relatively low Re, the meniscus shape reaches a steady state, and the
interfacial curvature at the tube centre changes from concave into convex with increasing Re.
At a critical value of Re, the results indicate that a supercritical bifurcation occurs, beyond
which the flow becomes unsteady: the interface oscillates periodically and then quasi-
periodically upon a further increase of the value of Re, and the interface evolves from simple-
wavy to complex shapes with multiple wavy units. This state has not been observed
previously, to our knowledge. Beyond a second critical value of Re, the liquid forms a jet and
the meniscus advances with a constant speed which decreases with Re. In the jetting regime,
the interface shape remains steady at the tube centre and in the contact line region, whereas
the region between these two regions is merely increasing its length continuously.
Further work in this area would certainly require an experimental confirmation of
especially the oscillatory state reported here for the first time. Although the results presented
here are for rather large values of a slip length, the results in Sec.III.D suggest that a smaller
value of Ca would be required for the oscillatory regime to be observed at realistically small
slip length values. Also, it seems clear that a smaller slip length would lower the critical
values of Re for jetting to occur.

28
With regards to applications of the results presented herein, these seem at the moment most
obvious in the area of modelling of locally high-speed invasion of porous media by a liquid,
displacing another fluid. Even such flows at otherwise low-Re could potentially still reach in
some capillaries rather large Re values if strong fingering phenomena occur, and the critical
values of Re for the various unsteady flow states reported in this study could serve as upper
estimates, in the light of the slip length values used. Regarding the displacement efficiency,
flows in the steady and oscillating regimes are similar since the interface moves on average
with the mean inflow velocity, and the efficiency is higher than in the jetting regime where
the contact line lags behind the interface front at the tube center. To increase the displacement
efficiency, flow parameters (i.e., Re, θ, λµ) should be controlled to avoid the formation of
jetting. Whether oscillations in the relation between pressure drop over a capillary and flow
rate due to inertial effects might affect the formation of finger-type instabilities in networks
would have to be the subject of further work in this area. Naturally, the present results would
be representative of a class of porous media where the microstructure can reasonably be
modelled by the geometry considered here; other media would require
simulation/experiments on a two-phase front through a bed of spherical particles or
cylindrical fibres, extending earlier single-phase flow work (e.g., Refs 23-25).
Acknowledgement
Financial support from EPSRC (Grant EP/E046029/1) is acknowledged.
REFERENCES
1 D. A. de Sousa, E. J. Soares, R. S. de Queiroz and R. L. Thompson, “Numerical
investigation on gas displacement of a shear-thinning liquid and a visco-plastic material in
capillary tubes,” J. Non-Newtonian Fluid Mech. 144 149 (2007).

29
2 E. J. Soares and R. L. Thompson, “Flow regimes for the immiscible liquid–liquid
displacement in capillary tubes with complete wetting of the displaced liquid,” J. Fluid Mech.
641, 63 (2009).
3 Y. Dimakopoulos and J. Tsamopoulos, “Transient displacement of viscoplastic fluids by air
in straight or suddenly constricted tubes,” J. Non Newt. Fluid Mech. 112 43 (2003).
4 Y. Dimakopoulos and J. Tsamopoulos, “Transient displacement of a Newtonian fluid by air
in straight or suddenly constricted tubes,” Phys. Fluids 15, 1973 (2003).
5 Y. Dimakopoulos and J. Tsamopoulos, “On the gas-penetration in straight tubes completely
filled with a viscoelastic fluid,” J. Non Newt. Fluid Mech. 117, 117 (2004).
6 Q. Kang, D. Zhang and S. Chen, “Immiscible displacement in a channel: simulations of
fingering in two dimensions,” Adv. Water Resour. 27, 13 (2004).
7 J. Koplik and T. J. Lasseter, “Two-phase flow in random network models of porous media,”
Soc. Petrol. Eng. J. 25, 89 (1985).
8 M. M. Dias and A. C. Payatakes, “Network models for two-phase flow in porous media.
Part 1. Immiscible microdisplacement of non-wetting fluids,” J. Fluid Mech. 164, 305 (1986).
9 R. Lenormand, E. Touboul and C. Zarcone, “Numerical models and experiments on
immiscible displacements in porous media,” J. Fluid Mech. 189, 165 (1988).
10 M. Blunt and M. J. King, “Simulation and theory of two-phase flow in porous media,” Phys.
Rev. A 46, 7680 (1992).
11 P. E. Øren, S. Bakke and O. J. Arntzen, “Extending predictive capabilities to network
models,” SPE J. 3, 324 (1998).
12 M. Blunt, M. D. Jackson, M. Piri and P. H. Valvatne, “Detailed physics, predictive
capabilities and macroscopic consequences for pore-network models of multiphase flow,”
Adv. Water Resour. 25, 1069 ( 2002).

30
13 V. Joekar-Niasar, S. M. Hassanizadeh and H. K. Dahle, “Nonequilibrium effects in
capillarity and interfacial area in two-phase flow: Dynamic pore-network modelling,” J. Fluid.
Mech. 655, 38 (2010).
14 E. Ramé, “On an approximate model for the shape of a liquid-air interface receding in a
capillary tube,” J. Fluid Mech. 342, 87 (1997).
15 D. Quéré, “Inertial capillarity,” Europhys. Lett. 39, 533 (1997).
16 N. Fries and M. Dreyer, “The transition from inertial to viscous flow in capillary rise,” J.
Colloid. Interf. Sci. 327, 125 (2008).
17 M. Stange, M. E. Dreyer and H. J. Rath, “Capillary driven flow in circular cylindrical
tubes,” Phys. Fluids 15, 2587 (2003).
18 R. A. Wooding and H. J. Morel-Seytoux, “Multiphase fluid flow through porous media,”
Annu. Rev. Fluid Mech. 8, 233 (1976).
19 F. A. L. Dullien, “Single phase flow through porous media and pore structure,” Chem. Eng.
J. 10, 1 (1975).
20 I. F. Macdonald, M. S. El-Sayed, K. Mow and F. A. L. Dullien, “Flow through porous
media-the Ergun equation revisited,” Ind. Eng. Chem. Fundam. 18, 199 (1979).
21 A. Dybbs and R. V. Edwards, “A new look at porous media fluid mechanics-Darcy to
turbulent,” in Fundamentals of Transport Phenomena in Porous Media edited by J. Bear and
M.Y. Corapcioglu (Martinus Nijhoff Publishers, Dordrecht,1984).
22 E. Aker, K. J. Måløy, A. Hansen and G. G. Batrouni, “A two-dimensional network
simulator for two-phase flow in porous media,” Transport Porous Med. 32, 163 (1998).
23 R. J. Hill, D. L. Koch and A. J. C. Ladd, “The first effects of fluid inertia on flows in
ordered and random arrays of spheres,” J. Fluid Mech. 448, 213 (2001).
24 R. J. Hill, D. L. Koch and A. J. C. Ladd, “Moderate-Reynolds-number in ordered and
random arrays of spheres,” J. Fluid Mech. 448, 243 (2001).

31
25 P. D. M. Spelt, T. Selerland, C. J. Lawrence and P. D. Lee, “Flows of inelastic non-
Newtonian fluids through arrays of aligned cylinders. Part 2. Inertial effects for square arrays,”
J. Engng. Math., 51, 81 (2005).
26 R. L. Hoffman, “A study of the advancing interface,” J. Colloid. Interf. Sci. 50, 228 (1975).
27 R. T. Foister, “The kinetics of displacement wetting in liquid/liquid/solid systems,” J.
Colloid. Interf. Sci. 136, 266 (1990).
28 M. Fermigier and P. Jenffer, “An experimental investigation of the dynamic contact angle
in liquid-liquid systems,” J. Colloid. Interf. Sci. 146, 226 (1991).
29 R. G. Cox, “The dynamics of the spreading of liquids on a solid surface. Part 1. Viscous
flow,” J. Fluid Mech. 168, 169 (1986).
30 L. M. Hocking, “The spreading of a thin drop by gravity and capillarity,” Q. J. Mech. Appl.
Maths 36, 55 (1983).
31 L. M. Hocking, “Rival contact-angle models and the spreading of drops,” J. Fluid Mech.
239, 671 (1992).
32 J. Lowndes, “The numerical simulation of the steady movement of a fluid meniscus in a
capillary tube,” J. Fluid Mech. 101, 631 (1980).
33 I. B. Bazhlekov and A. K. Chesters, “Numerical investigation of the dynamic influence of
the contact line region on the macroscopic meniscus shape,” J. Fluid Mech. 329, 137 (1996).
34 E. B. Dussan V., E. Ramé and S. Garoff, “On identifying the appropriate boundary
conditions at a moving contact line: an experimental investigation,” J. Fluid Mech. 230, 97
(1991).
35 W. Boender, A. K. Chesters and A. J. J. van der Zanden, “An approximate analytical
solution of the hydrodynamic problem associated with an advancing liquid-gas contact line.
Intl. J. Multiphase Flow 17, 661 (1991).
36 P. D. M. Spelt, “A level-set approach for simulations of ows with multiple moving contact

32
lines with hysteresis,” J. Comput. Phys. 207, 389 (2005).
37 P.D.M. Spelt, “Shear flow past two-dimensional droplets pinned or moving on an adhering
channel wall at moderate Reynolds numbers: a numerical study,” J. Fluid Mech. 561, 439
(2006).
38 H. Ding P. D. M. Spelt and C. Shu, “Diffuse interface mode for incompressible two-phase
flows with large density ratios,” J. Comput. Phys. 226, 2078 (2007).
39 H. Ding and P. D. M. Spelt, “Inertial effects in droplet spreading: a comparison between
diffuse interface and level-set simulations,” J. Fluid Mech. 576, 287 (2007).
40 M. Sussman, A. S. Almgren, J. B. Bell, P. Colella, L. H. Howell and M. L. Welcome, “An
adaptive level set approach for incompressible two-phase flows,” J. Comput. Phys. 148, 81
(1999).
41 G. Russo and P. Smereka, “A remark on computing distance functions,” J. Comput. Phys.
163, 51 ( 2000).
42 X. D. Liu, S. Osher and T. Chan, “Weighted essentially non-oscillatory schemes,” J.
Comput. Phys. 115, 200 (1994).
43 M. Renardy, Y. Renardy, and J. Li, “Numerical simulation of moving contact line problems
using a volume-of-fluid method,” J. Comput. Phys. 171, 243 (2001).
44 S. Afkhami, S. Zaleski, S. and M. Bussmann, “A mesh-dependent model for applying
dynamic contact angles to VOF simulations,” J. Comput. Phys. 228, 5370 (2009).
45 K. Tsiveriotis and R. A. Brown, “Solution of free-boundary problems using finite-
element/Newton methods and locally refined grids: application to analysis of solidification
microstructure,” Int. J. Numer. Meth. Fluids 16, 827 (1993).
46 N. Chatzidai, A. Yanousakis, Y. Dimakopoulos and J. Tsamopoulos, “On the elliptic mesh
generation in domains containing multiple inclusions and undergoing large deformations,” J.
Comp. Phys. 228, 1980 (2009).

33
47 A.-L. Biance, C. Clanet and D. Queré, “First steps in the spreading of a liquid droplet,”
Phys. Rev. E 69, 016301 (2004).
48 X. Bian, M. Perlin, W. W. Schultz and M. Agarwal, “Axisymmetric slosh frequencies of a
liquid mass in a circular cylinder,” Phys. Fluids 15, 3659 (2003).
49 J. A. Marsh, S. Garoff and E. B. Dussan V., “Dynamic contact angles and hydrodynamics
near a moving contact line.” Phys. Rev. Lett. 70, 2778 (1993).
50 J. Eggers and H. A. Stone, “Characteristic lengths at moving contact lines for a perfectly
wetting fluid: the influence of speed on the dynamic contact angle,” J. Fluid Mech. 505, 309
(2004).
51 R. G. Cox, “Inertial and viscous effects on dynamic contact angles,” J. Fluid Mech. 357,
249 (1998).
52 I. Fatt, “The network model of porous media III. Dynamic properties of networks with tube
radius distribution,” Trans. AIME 181, 164 (1956).