lab 2.electric fields
TRANSCRIPT
Lab 2. Electric Fields
Goals
• To understand how contour lines of equal voltage, which are easily measured, relate to theelectric field produced by electrically charged objects.
• To learn how to identify regions of strong and weak electric fields from maps of electric fieldlines.
• To quantitatively estimate the magnitude and direction of an electric field using experimentalvoltage measurements.
Introduction
The concept of the electric field is useful in determining the force on a charged object due tothe presence of other charges. The purpose of this laboratory is to quantitatively map, in two di-mensions, a set of equipotential lines for two different charge distributions using a voltmeter. Anequipotential line connects the set of points for which the potential difference or voltage has a con-stant value. The two-dimensional charge distributions will be established by applying a potentialdifference between a pair of conducting electrodes. The electrodes are attached to a board coveredwith conducting paper. From these equipotential lines the electric field can be determined. Electricfield lines always cross equipotential lines at right angles as a consequence of the definition ofelectric potential. By convention, electric field lines start on positive charges and end on negativecharges.
You will use a voltmeter to locate different points on the black conducting paper for which thevoltage differences between the points in question and a reference point (say, at zero potential)are the same. These points are recorded on a white sheet of paper with the same grid pattern asthe conducting paper. Then connect these points of equal voltage to form an equipotential line.From a set of equipotential lines you can create a map of the vector electric field following therules stated in the previous paragraph. Since electric field lines start from and end on electricalcharges, higher densities of field lines near the electrodes indicate regions of higher charge con-centration. From a complete electric field map, the charge densities on the electrodes themselvescan be deduced.
5
6 CHAPTER 2. ELECTRIC FIELDS
Electric field of a long plate parallel to a long rod
Equipment set-up
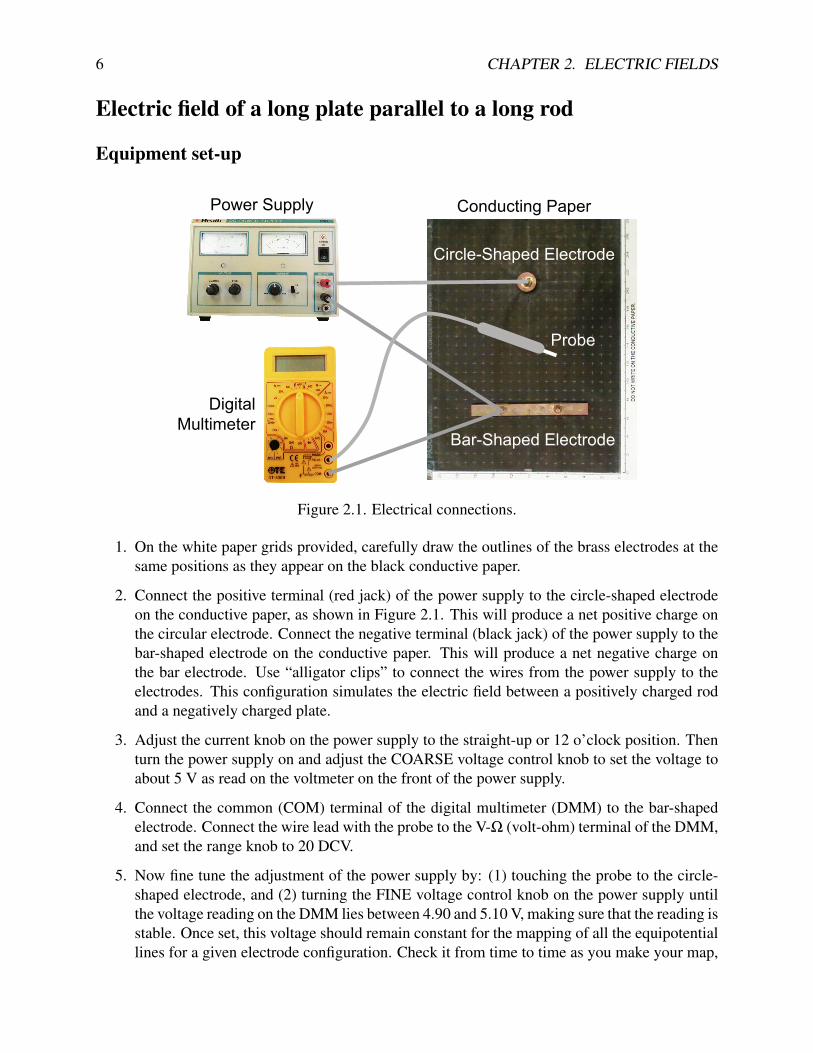
Power Supply
DigitalMultimeter
Probe
Bar-Shaped Electrode
Circle-Shaped Electrode
Conducting Paper
Figure 2.1. Electrical connections.
1. On the white paper grids provided, carefully draw the outlines of the brass electrodes at thesame positions as they appear on the black conductive paper.
2. Connect the positive terminal (red jack) of the power supply to the circle-shaped electrodeon the conductive paper, as shown in Figure 2.1. This will produce a net positive charge onthe circular electrode. Connect the negative terminal (black jack) of the power supply to thebar-shaped electrode on the conductive paper. This will produce a net negative charge onthe bar electrode. Use “alligator clips” to connect the wires from the power supply to theelectrodes. This configuration simulates the electric field between a positively charged rodand a negatively charged plate.
3. Adjust the current knob on the power supply to the straight-up or 12 o’clock position. Thenturn the power supply on and adjust the COARSE voltage control knob to set the voltage toabout 5 V as read on the voltmeter on the front of the power supply.
4. Connect the common (COM) terminal of the digital multimeter (DMM) to the bar-shapedelectrode. Connect the wire lead with the probe to the V-Ω (volt-ohm) terminal of the DMM,and set the range knob to 20 DCV.
5. Now fine tune the adjustment of the power supply by: (1) touching the probe to the circle-shaped electrode, and (2) turning the FINE voltage control knob on the power supply untilthe voltage reading on the DMM lies between 4.90 and 5.10 V, making sure that the reading isstable. Once set, this voltage should remain constant for the mapping of all the equipotentiallines for a given electrode configuration. Check it from time to time as you make your map,
7
and adjust the voltage as necessary to maintain this voltage reading. Be sure to record theactual measured voltage.
6. Verify that you have a good electrical connection between the bar-shaped electrode and thepower supply by touching the probe to the bar-shaped electrode. The voltage reading shouldbe zero. If this is not the case, ask your TA for assistance.
7. Touch the probe to the conductive paper at a few random points. The voltage readings on theDMM should lie between zero and the value you measured on the circle-shaped electrode.If this is not the case, ask your TA for assistance.
Caution: Do not mark the conductive paper with pencils or pens, or poke holes in it with thepointed probe.
Data collection
Choose some convenient voltages between 0 and 5 V, say 0.50, 1.00, 1.50, etc.
1. Using the probe find a point on the conducting paper that gives a voltage of 0.50 ± 0.01 V.Mark this point on the white grid paper using a symbol of your choice (such as a small x).Now move the probe 1–2 cm away from the point you just located and search for anotherpoint on the conducting paper that gives a reading of 0.50 ± 0.01 V. Mark this point on thewhite grid paper using the same symbol. Continue this process until you reach the edge ofthe conducting paper or you run into points already located. Now connect these points witha smooth line (Don’t just connect the dots with straight line segments!) and label this line“0.50 V”. This is the first equipotential line for this electrode configuration.
2. Repeat the process outlined in (a) above for points with a voltage of 1.00 ± 0.01 V, usinganother symbol to mark these points on (such as a small o). Alternating the plot symbolswill clearly distinguish the various lines of equal potential. Repeat this process for the othervoltage values.
3. If you have any large blank regions on your map, choose an intermediate value of potential(one that falls between the voltages of previously drawn equipotential lines) and fill in the“blanks.”
4. Each electrode is also an equipotential. Try it by touching the probe to the electrode atvarious points; you may have to rub the probe on the brass gently to make good electricalcontact because of the layer of tarnish that forms on brass. Record the voltage of eachelectrode on your white grid paper.
Data analysis
First sketch in the electric field lines associated with the equipotential lines measured previouslyby following the “rules” for field lines as outlined in the Introduction. Since each conductingelectrode is an equipotential surface, electric field lines that start or end on a conducting surfacemust be perpendicular to the surface where they touch it. A suggestion is to start at a point on thepositive electrode and draw a smooth continuous line which crosses all equipotential lines at right
8 CHAPTER 2. ELECTRIC FIELDS
angles. Extend each line until you either reach the edge of the paper or the negative electrode. Pickother points on the positive electrode and repeat this process.
From the definition of electric potential, the magnitude of the electric field, |E|, is related approxi-mately to the electric potential (or voltage), V, in the following way:
|E|= ∆V∆s
(2.1)
where ∆V is the difference in voltage between two equipotential lines and ∆s is the distance be-tween the two equipotential lines measured along an electric field line. This approximation be-comes exact in the limit as the distance between the two equipotential lines approaches zero. Inour case we must be content with approximate values for the electric field. The electric field isperpendicular to nearby equipotentials, and points from high potential to low. Be sure to indicatethe direction of each field line with arrows. Don’t leave any large regions of your map devoid offield lines.
Pick 8–10 points on your electric field map and calculate the approximate values of the electricfield using the above equation. Be sure to use adjacent equipotential lines in order to make theapproximation better. When you do this, you are finding the average electric field between thetwo equipotentials, which will closely approximate the actual value of the electric field midwaybetween the two equipotentials. Use a special plot symbol (a different color pen or pencil would begood) to indicate on your map the locations of the points at which you calculate the magnitudes ofthe electric field. Label the points P1, P2, etc. Show the calculations for each point in your report.Try to locate the places on your map where the electric field is largest and where it is smallest bythis process.
Another electrode configuration
Replace your conducting board with another board with a different configuration of electrodes.
Choose the polarity of each electrode and connect the power supply appropriately. Some electrodesmay be left neutral or unconnected. Your TA will have special instructions for some electrodeconfigurations.
Repeat the process above to create and analyze another map.
Summary
Based on your electric field maps and calculations of the magnitude of the electric field, make somegeneral observations about where the electric field tends to be largest and smallest. Is it possibleto predict from the electric field lines alone where the field will be large or small? Explain yourreasoning.

9
Before you leave the lab please:Straighten up your lab station.Report any problems or suggest improvements to your TA.