kzn planning and dev comm book 1
DESCRIPTION
ÂTRANSCRIPT

THE NATURE OF THE INTERNATIONAL, NATIONAL AND KWAZULU-NATAL RETAIL
AND SHOPPING CENTRE INDUSTRY
KwaZulu-Natal Planning & Development Commission

THE NATURE OF THE INTERNATIONAL, NATIONAL AND KWAZULU-NATAL RETAIL AND SHOPPING CENTRE INDUSTRY
First Published in 2010 by
KwaZulu-Natal Planning and Development CommissionPrivate Bag X9038Pietermaritzburg3200
ISBN: 978-0-621-39201-2
PRICE: R50.00
This document is available from:
KwaZulu-Natal Planning and Development Commission12th Floor Natalia Building 330 Langalibalele StreetPietermaritzburg3201
OR
Private Bag X9038Pietermaritzburg3200
Tel: 033 395 3067Fax: 033 345 3647Email: [email protected]: www.kznpdc.gov.za
The reproduction of the contents of this document, whether in whole or in part, for publication is prohibited unless permission is fi rst obtained in writing from the KwaZulu-Natal Planning and Development Commis-sion, Private Bag X 9038, Pietermaritzburg, 3200, KwaZulu-Natal, South Africa.
The contents of this publication, whilst being the views of the author, do not necessarily represent the views of the KwaZulu-Natal Planning and Development Commission.

1THE NATURE OF THE INTERNATIONAL, NATIONAL AND KWAZULU-NATAL RETAIL AND SHOPPING CENTRE INDUSTRY
CONTENT PAGEFOREWORD 3ACKNOWLEDGEMENTS 4EXECUTIVE SUMMARY 5
1. Introduction and main objectives 52. Methodology 53. Retail trends - International to KZN examples 64. Situation analysis 65. Changes in demographic and shopping behaviour 66. South Africa retail and shopping centre industry 67. Retail demand and supply: KZN 78. Participation of planning and development 79. Site selection and different levels of analysis 810. Strategic development guidelines and actions for existing and new shopping centre facilities 811. Major retail types, classifi cation of hierarchy of retail facilities 912. Proposed interaction between town planners, retail centre developers and local authority 1313. Use of the guideline document 1314. Site selection checklist for retail development 1315. Conclusion 14
1. BACKGROUND 152. DEFINITION OF RETAIL AND THEORETICAL CLASSIFICATION MODELS 16
2.1 Defi nition of Retailing 162.2 Theoretical base 18
2.2.1 Central Place Theory (Christaller 1933) 182.2.2 Gravitation Model (Reilly, 1930s) 192.2.3 Probability Model - Huff (1963) 192.2.4 A classifi cation of urban commercial structure (Berry, 1967) 20
2.3 International Classifi cation of Retail Facilities 212.3.1 Retail Classifi cation (Dawson, 1983) 212.3.2 International Council of Shopping Centre Classifi cation 242.3.3 Australian Property Council 262.3.4 Pan-European Shopping Centre Standard 27
2.4 South African Classifi cation of Retail Facilities 282.4.1 Oosthuizen (1981) 282.4.2 Kahn (1988) 30
3. INTERNATIONAL SHOPPING CENTRE EXAMPLES AND TRENDS 324. SOUTH AFRICAN LANDSCAPE INFLUENCING RETAIL DEVELOPMENT 34
4.1 Macro South African Economic Conditions 344.1.1 Gross Domestic Product 344.1.2 Interest rates 354.1.3 Infl ation 364.1.4 Rand/Dollar exchange rate 364.1.5 Building plans passed and completed 374.1.6 Various confi dence indexes 384.1.7 Retail trade sales 394.1.8 Global infl uence 404.1.9 Property Economic Indicators: (2006-2009) 40
4.2 Political Conditions 424.3 Social Conditions 42

2 THE NATURE OF THE INTERNATIONAL, NATIONAL AND KWAZULU-NATAL RETAIL AND SHOPPING CENTRE INDUSTRY
5. CHANGES IN DEMOGRAPHICS AND SHOPPING BEHAVIOUR 435.1 Population Growth 435.2 Effect of Urbanisation 435.3 Socio-Economic Change 44
5.3.1 Living Standard Measurement (LSM) 445.4 Emerging Black Market and Changing Consumer Base 465.5 Township Areas, CBDs and Rural Shopping Centres 47
5.5.1 Retail in CBDs 475.5.2 Retail in township areas 485.5.3 Retail in rural areas 48
5.6 Changing Lifestyles 495.7 The Need for a Shopping Experience 505.8 The Youth Market 505.9 Trends towards Extended Shopping Hours 505.10 Growth in Homeware Stores and other New Retail Tenant Types 505.11 E-Commerce 515.12 Renewal of Centres 515.13 Cannibalisation 51
6. SOUTH AFRICAN RETAIL AND SHOPPING CENTRE INDUSTRY 526.1 Retail Supply in South Africa 52
7. RETAIL DEMAND AND SUPPLY IN KWAZULU NATAL 547.1 Main Characteristics of KwaZulu Natal Market 547.2 Economic Base of KZN in comparison to the RSA Economy 54
7.2.1 Gross Domestic Product per region for 2007 547.3 Retail demand in KZN: Demand drivers 57
7.3.1 Population Numbers, Growth and Projections 577.3.2 Additional population related information regarding KZN 587.3.3 Socio-Economic and demographic profi le of KZN households 58
7.4 Monthly Expenditure on Consumer Goods 647.5 Estimated annual retail expenditure for KZN 65
8. SUPPLY OF RETAIL SPACE IN KZN 668.1 Current Supply of Retail Space in KZN 668.2 Retail Supply in Townships and Rural Areas 678.3 Growth in Retail Supply in KZN (2003-2009) 688.4 Retail Development Potential in KZN 68
8.4.1 Retail apace per capita 698.4.2 Various other models 69
9. PARTICIPATION OF PLANNING AND DEVELOPMENT STAKEHOLDERS 709.1 Questionnaire Phase 709.2 Workshop 71
10. CONCLUSION 7311. TERMINOLOGY AND DEFINITIONS 7412. BIBLIOGRAPHY / REFERENCES 75

3THE NATURE OF THE INTERNATIONAL, NATIONAL AND KWAZULU-NATAL RETAIL AND SHOPPING CENTRE INDUSTRY
FOREWORDIn December 2008 the KwaZulu-Natal Planning and Development Commission (KZNPDC), appointed Urban Studies, to compile planning guidelines for shopping centre development in KwaZulu Natal. The project con-sisted of two components namely the understanding of retail development on an international, local and KZN level and to compile planning guidelines for future retail development.
Retail and shopping centre development forms part of one of the most dynamic urban markets and land uses. Shopping centres worldwide are continuously changing by trying to attract more shoppers to increase the drawcard and to increase the spending of their customers. There has been a substantial increase in planned shopping centres over the last 15 to 20 years, compared to the static situation as far as unplanned retail facili-ties are concerned.
A number of institutions like the International Council of Shopping Centres (ICSC) have published some guidelines for the classifi cation of shopping centres. Most of these publications are restricted to planned shopping centres only. In the case of this guideline report, the full spectrum of retail facilities ranging from metropolitan super regional centres to small rural village town squares, were included. There is a major need amongst town planners, developers, retailers and bankers to get a better understanding of the practical impli-cation of the classifi cation of shopping centres. This will streamline and regulate the development and control process of shopping centre development.
Shopping centres and retail markets in South Africa are all changing because of the growth in disposable income, the increase of the upper end of the market, the growth of the emerging market and the opening of a number of new retail facilities in township and rural areas. All role players (town planners, developers and retailers) need to understand these changes in order to have a better understanding as far as current and future shopping centre development is concerned.
All the different retail types ranging from planned metropolitan to unplanned rural facilities were discussed in detail in the guideline report. Each retail type was classifi ed according to its role and functions, market size and appropriate fl oor area. The locational criteria, a broad indication of the tenant mix and future trends and changes were incorporated for each retail type. Appropriate KwaZulu Natal examples were used in all cases.
The last part of the guideline document includes details regarding the interaction between town planners, shopping centre developers, and local authorities. These interaction guidelines were included to streamline the whole process of shopping centre development.
The dynamic nature of retail shopping centre development will always result in the provision of new retail types, the introduction of new types of retailers and the changing needs of shoppers. This will require an update of the guideline document on a regular basis to continuously obtain new information regarding the latest trends.
BISHOP MM MAKHAYECHAIRMAN

4 THE NATURE OF THE INTERNATIONAL, NATIONAL AND KWAZULU-NATAL RETAIL AND SHOPPING CENTRE INDUSTRY
ACKNOWLEDGEMENTSRetail is one of the most dynamic urban land uses to be found in any human settlement. This is also the one land use that changes almost on a daily basis. New retail types are developed to attract more customers and to better service their needs. To understand the retail market and to prepare a set of town planning guidelines a number of people contributed to this project, which I sincerely want to thank.
The success of this document is based on the major contribution made by the Commissioners of the Steering Committee: Christine Platt, Dr D.S. Rajah and Prof Michael Kahn.
A special word of thanks to Prof Kahn for his input, his past experience in formulating comprehensive clas-sifi cations for shopping centres and his general knowledge of the KZN market, added additional value to this guideline report.
A word of thanks to the Research Programme Coordinators from the Planning and Development Commis-sion, Mr Hloniphani Ngcobo and Mrs Priscilla Shanmugam for managing the project.
Other representatives attending the meetings were Sibusiso Dlamini a representative from the Natal branch of the South African Planning Institute, Mr Mark Poval representative from the Provincial Planning Department, Me Dorcas Zondi from the Ingonyama Trust Board and the retailer representatives Amanda Stops of the South African Council of Shopping Centres and Mr Greg Azzopardi from the Mr Price Group.
A special word of thanks to all the different stakeholders who completed the questionnaire and attended the workshop. Your contributions were valuable to fully understand the specifi c needs from the different Town Planning Departments.
Lastly I would like to thank the staff from Urban Studies who all made a very large contribution in compiling this guideline document. Your commitment and dedication is well appreciated.
This Guideline Document will defi nitely assist all future users to contribute to a more successful development of shopping centres for all the people of KwaZulu-Natal and to improve the lives of many people.

5THE NATURE OF THE INTERNATIONAL, NATIONAL AND KWAZULU-NATAL RETAIL AND SHOPPING CENTRE INDUSTRY
EXECUTIVE SUMMARY1. Introduction and main objectives
The Provincial Planning and Development Commission (PPDC) identifi ed the need for planning guidelines for shopping centre development. The original research dated back to 1951, 1978 and 1981. There has been growth in the demand and supply of shopping centre development in all types of settlements. New demands and new types of shopping facilities require a good understanding of the latest development trends in retail-ing.
Urban Studies was commissioned to undertake this study with the following main objections:
• To describe, in general terms, the nature of the South African shopping centre environment;
• To update and explain the hierarchy of shopping centre typology, using current, local and international examples;
• To formulate a new set of guidelines that can be applicable for different types of shopping centre develop-ments in different types of settlements. This will then vary from metropolitan areas and small towns, includ-ing rural settlements;
• To link the guideline document to specifi c retail development strategies;
• To identify the implications of the guideline document in terms of the socio economic impact centre devel-opment will have on job creation, the tax base and the total multiplier effect it will have on a community.
• To highlight areas where the guideline document could be misused; and
• To recommend the way forward as far as retail shopping centre development is concerned.
2. Methodology
This study was mainly based on three research components namely:
• A desk survey where existing sources of information where used (see reference list);
• To understand the status quo as far as retail development in concerned;
• A questionnaire was sent to some of the planning and development stakeholders in KZN. It was expected that these stakeholders would comment and add to a list provided to them focusing on trade area analy-sis, types of retail facilities, guideline actions and strategies;
• To guide the development process in terms of pre-consultation between town planning offi cials and devel-opers;
• This was followed by a workshop attended by 22 people to provide their detailed input insofar as the con-tent of the guideline document is concerned.
All this information culminated in a good understanding of the retail environment and to direct guidelines for future retail developments and redevelopment of existing developments.

6 THE NATURE OF THE INTERNATIONAL, NATIONAL AND KWAZULU-NATAL RETAIL AND SHOPPING CENTRE INDUSTRY
3. Retail trends - International to KZN examples
A large number of different shopping centre classifi cation models are in existence. Most of these models only include planned shopping centres.
The current document is the South African Shopping Centre Classifi cation Standards, prepared for the South African Council of Shopping Centres. The project focuses on planned shopping centre development and a new guideline document for KZN covering the whole spectrum from metropolitan through to rural areas.
4. Situation analysis
Retail development in the fi rst place, is infl uenced by macro economic conditions including aspects such as the gross domestic product (GDP) and interest rates. These two components of the economy has a major impact on property development, building plans passed and completed as well as retail trade sales. Macro economic conditions in South African have changed from very positive in 2006 to negative in 2008 with posi-tive changes in interest rates and infl ation during 2009.
5. Changes in demographic and shopping behaviour
The most important changes in the demographics of South Africa, which will infl uence retail “spend” and development, are:
• Population growth has slowed down to an annual increase of 1.5%, except that the number of foreigners living in South Africa is currently unknown;
• Increasing urbanisation will also increase the demand for retail facilities;
• Socio-economic changes, where especially the middle market as well as the upper end show major in-creases, with more disposable income to spend on retail products;
• The total “spend” by the different population groups clearly shows the increase in “spend” by the African market;
• CBD and Town Centre retail still focuses very strongly on the middle and lower LSM markets;
• The development of township shopping centres has shown tremendous growth since 2002;
• The growth in shopping centre development in rural areas is also substantial;
• Changes in lifestyle, the need for a shopping experience, the importance of the youth market, the open-ing of new retail format e-commerce and the renewal of shopping centres, all play a very important role to understand this dynamic and changing market.
6. South Africa retail and shopping centre industry
During the last 4 years South Africa and the world have experienced amongst the highest growth rates in re-cent decades. Shopping centre space has increased to 18 million m² representing ± 50% of all retail space in the country. This market has grown consistently with 8% during the last 15 years. The highest additional retail space has been added to the South African market in the four consecutive years since 2005.

7THE NATURE OF THE INTERNATIONAL, NATIONAL AND KWAZULU-NATAL RETAIL AND SHOPPING CENTRE INDUSTRY
7. Retail demand and supply: KZN
Retail demand and supply in KZN:
• The KZN GDP was growing over 5% per annum between 2003 and 2008;• KZN represents 16.2% of the total national GDP;• The contribution to KZN economy is mainly based on manufacturing, fi nance and real estates and whole-
sale and retail;• The latter clearly indicates how important retail development is for the province.
Population numbers, growth and projection
The total KZN population has increased from 9.4million in 2001 to 10.1million in 2008. KZN is in a strong sec-ond position with 20.8% of the total number of people in South Africa (second after Gauteng). It is expected that this population will grow to between 10.6 million and 11million people by 2015.
Socio economic and demographic profi le of KZN households
There are major resemblances between the KZN households and those of the South African Market. The major differences are a larger proportion of the younger cohorts in KZN, a strong rural character and fewer households in the upper LSM categories (LSM 7-10).
Estimated annual of retail expenditure for KZN
There are ±2.25mil households in KZN with a total spend on retail products of R79billion per annum. This represents 15% of the total retail spend which is in line with the GDP contribution of this province.
Retail supply in shopping centre facilities in the KZN is currently at 2.2mil m² and has increased annually by 9% since 2002. This clearly indicates the attractiveness of shopping centre development in the province. The total warranted retail fl oor space based on monthly expenditure for KZN is 5.2million m². This includes shop-ping centre space, unplanned retail space in metropolitan areas, small and medium sized towns, rural areas, as well as gaps that may exist in the market.
8. Participation of planning and development
This information was sent out to stake holders involved in a number of municipal and provincial planning departments. Specifi c comments were made to improve the guideline document.
A workshop was held during June 2009, and was attended by 22 people. Specifi c comments were made to fi ne tune the guidelines. All this was incorporated in the fi nal document.

8 THE NATURE OF THE INTERNATIONAL, NATIONAL AND KWAZULU-NATAL RETAIL AND SHOPPING CENTRE INDUSTRY
9. Site selection and different levels of analysis
The best approach to analyse different markets for retail development is from the macro to the micro loca-tions.
Area/Level Area Analysis/Key aspects to consider Main Objective
Macro
• Regions• Metropolitan areas, Cities, Towns and Rural areas• Population demographics• Competition• Growth
• Identify Gaps
Meso
• Primary trade areaEconomic growth rate of catchment areaTarget market of the centreExisting centres/competition
• Secondary trade area• Tertiary trade area• Demographic and socio-economic profi le of the area
• Identify Potential
Micro
Shopping Centre• Location• Pedestrian/traffi c fl ow• Accessibility• Visibility• Shape• Size• Topography• Utilities• Surrounding area
Specifi c Shop• Traffi c fl ow• Accessibility• Pedestrian volumes• Shop front• Parking• Competition
• Identify best location
10. Strategic development guidelines and actions for existing and new shopping centre facilities
The following broad action plans and guidelines for shopping centre development and re-development ex-ist.
Existing CBD/town centre retail
facilities
Existing suburban/township retail
facilities
Infi ll areasCBD/suburban/
township
Potential and new growth areas Greenfi elds
• Maintain• Upgrade• Redevelop/renew• Demolish• New-will become
more popular as existing facilities get older
• Maintain• Upgrade• Redevelop/renew• Expand• Demolish• Nodal/mixed use
• Develop new facilities
• Potential should be available
• Develop new facilities
• Potential must be noticeable/suffi cient
• ‘Follow the Roofs’
• ‘Follow the Roofs’
Time of implementation• Immediately• When necessary• Continuously• Suffi cient potential
Time of implementation• When necessary• Continuously
Time of implementation• Warranted potential• When necessary
Time of implementation• Enough potential• Future potential
Growth
Time of implementation• Expected new
growth• Enough
potential to warrant retail

9THE NATURE OF THE INTERNATIONAL, NATIONAL AND KWAZULU-NATAL RETAIL AND SHOPPING CENTRE INDUSTRY
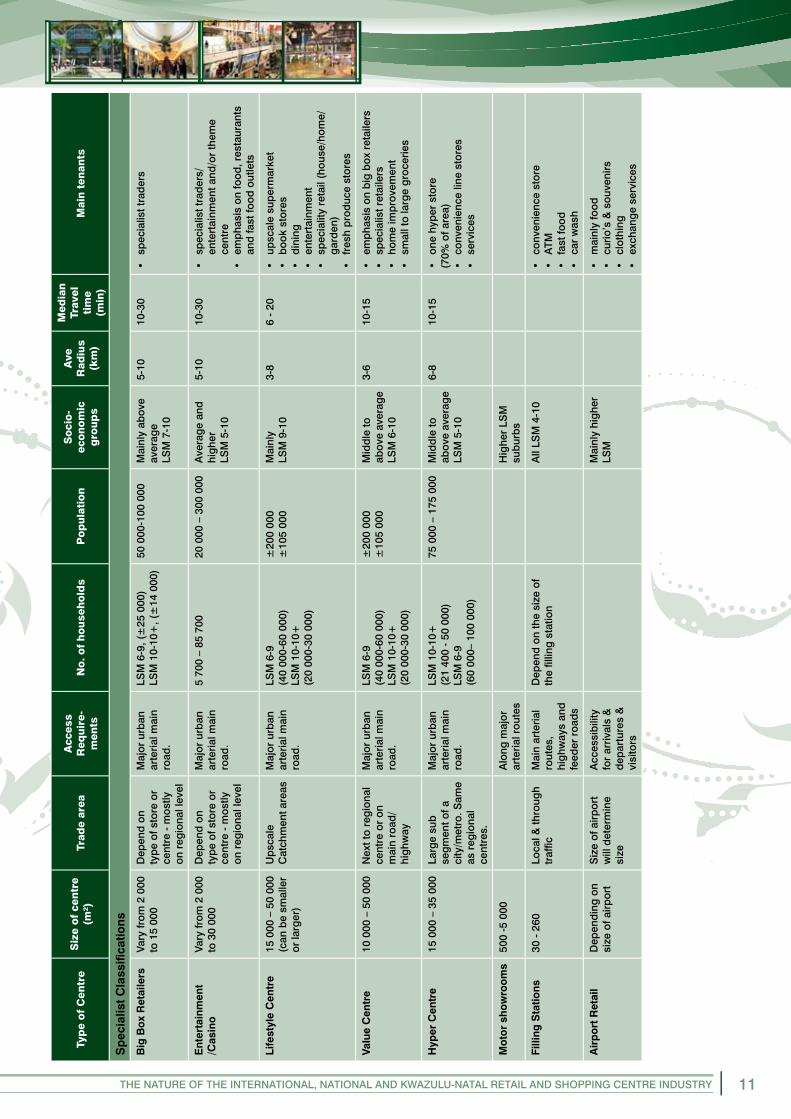
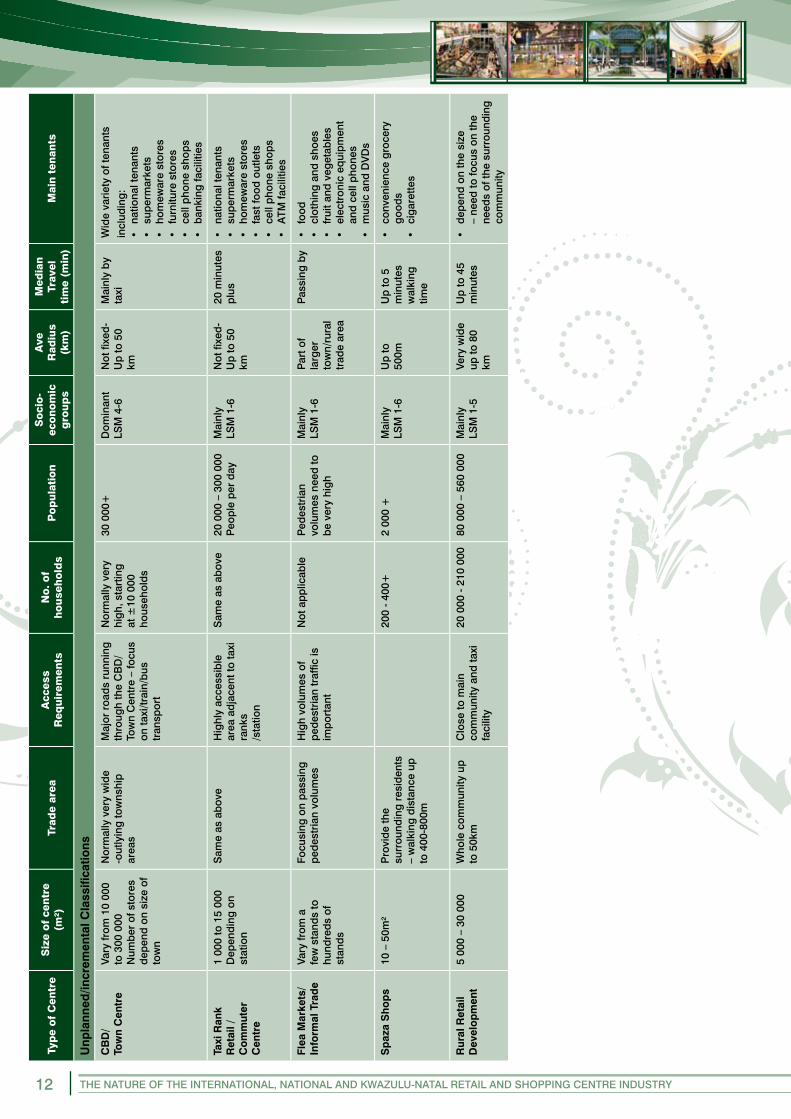
11. Major retail types, classifi cation of hierarchy of retail facilities
The whole spectrum of retail facilities consists of planned and unplanned retail types, each fulfi lling a specifi c role and function.
Planned Unplanned/Incremental Rural
Core Classifi cation• Small free standing-
convenience • Neighbourhood• Community• Small regional/large
community• Regional • Super Regional
Specialist• Big Box Retailers• Entertainment/casinos• Lifestyle• Value• Hyper• Motor showrooms and related facilities• Filling station stores• Airport
• CBD/town centre• Taxi rank retail/
commuter centre• Flea markets• Spaza shops• Fresh produce
markets• Informal trade
• Rural retail taxi orientated
• Town centres• Informal trade• Spaza shops• Planned
shopping centre

10 THE NATURE OF THE INTERNATIONAL, NATIONAL AND KWAZULU-NATAL RETAIL AND SHOPPING CENTRE INDUSTRY
SHO
PP
ING
CEN
TRE
CLA
SSIF
ICA
TIO
N
Typ
e o
f C
entr
eS
ize
of
cen
tre
(m²)
(GL
A)
Trad
e ar
eaA
cces
s R
equ
ire-
men
tsN
o. o
f h
ou
seh
old
sP
op
ula
tio
nS
oci
o-
eco
no
mic
g
rou
ps
Ave
Rad
ius
(km
)
Med
ian
Trav
el t
ime
(min
)M
ain
ten
ants
Co
re C
lass
ifi ca
tions
Sm
all f
ree
stan
din
g a
nd
conv
enie
nce
cent
re
500
– 5
000
5-25
sto
res
Ser
ves
par
t of a
su
bur
bs
Sub
urb
an s
tree
tLS
M 1
-5, (
<10
000
)LS
M 6
-9, (
<4
500)
LSM
10-
10+
, (<
2 00
0)
<40
000
<15
000
<7
000
All
LSM
g
roup
s1
– 1.
5<
3•
café
/Sup
eret
te•
few
con
veni
ence
sto
res
Nei
gh
bo
urh
oo
d
cent
re±
5 00
0-±
12 0
0025
-50
stor
esC
entr
ally
loca
ted
for
a g
roup
of s
ubur
bs
Maj
or c
olle
ctor
ro
ads
LSM
1-5
, (20
300
-47
000)
LSM
6-9
, (9
000-
20 1
00)
LSM
10-
10+
, (3
700-
8 60
0)
±13
5 00
0±
51 0
00±
18 5
00
All
LSM
4-1
02
4-9
• su
per
mar
ket
• co
nven
ienc
e•
som
e sm
all s
pec
ialis
ed s
tore
s
Co
mm
unity
ce
ntre
±12
000
-±25
000
50-1
00 s
tore
sS
trat
egic
ally
loca
ted
to
ser
ve a
sub
urb
an
com
mun
ity.
Maj
or a
rter
ial
road
LSM
1-5
, (44
000
-103
000
)LS
M 6
-9, (
20 0
00-4
6 00
0)
LSM
10-
10+
, (8
000-
19 0
00)
±29
5 00
0±
115
500
±41
000
All
LSM
4-1
03
6-14
• la
rge
sup
erm
arke
t•
conv
enie
nce
• sm
all n
atio
nal c
loth
ing
• re
stau
rant
s &
take
away
s•
serv
ices
Sm
all r
egio
nal/
Larg
e co
mm
unity
ce
ntre
±25
000
-±50
000
75-1
50 s
tore
sS
pec
ifi c
sub
-reg
ion
of c
ity (
can
be
larg
e se
lf co
ntai
ned
co
mm
unity
(i.e
. C
hats
wor
th)
Maj
or s
ubur
ban
ar
teria
l roa
d
linki
ng to
a
pro
vinc
ial
hig
hway
LSM
1-5
, (90
000
-209
000
)LS
M 6
-9, (
40 0
00-9
0 00
0)
LSM
10-
10+
(17
000
-38
000)
±60
0 00
0±
280
000
±83
000
All
LSM
4-1
05
10-1
6•
larg
e su
per
mar
ket
• 1
or 2
larg
e cl
othi
ng a
ncho
rs•
Str
ong
nat
iona
l ten
ant
com
par
ison
goo
ds
com
pon
ent
• b
outiq
ues
• re
stau
rant
s•
ente
rtai
nmen
t •
serv
ices
Reg
iona
l cen
tre
±50
000
-±10
0 00
015
0-25
0 st
ores
Larg
e re
gio
n of
city
/or
who
le c
ity/r
ural
to
wns
Maj
or a
rter
ial
road
usu
ally
a
Pro
vinc
ial m
ain
road
link
ing
to a
N
atio
nal r
oad
.
LSM
1-5
, (18
0 00
0-42
0 00
0)LS
M 6
-9, (
80 0
00-1
85 0
00)
LSM
10-
10+
(33
000-
76 0
00)
±1
200
000
±46
4 00
0±
165
000
All
LSM
4-1
08
14-2
0•
larg
e su
per
mar
ket (
even
2)/
or
hyp
er•
3 or
mor
e la
rge
clot
hing
• sm
all c
loth
ing
sto
res
and
b
outiq
ues
• en
tert
ainm
ent r
esta
uran
ts•
serv
ices
• co
nven
ienc
e
Sup
er r
egio
nal
cent
re>
100
000
Mor
e th
an 2
50
stor
es
Larg
e re
gio
n in
city
an
d s
urro
und
ing
ar
eas/
Tour
ists
Maj
or a
rter
ial
road
usu
ally
a
Pro
vinc
ial m
ain
road
, lin
king
to
a N
atio
nal r
oad
.
LSM
6-9
, (10
6 00
0-25
0 00
0)
LSM
10-
10+
(44
000-
101
000)
±62
3 00
0±
217
500
Ab
ove
aver
age
LSM
5-1
0
10+
24-3
0•
as a
t reg
iona
l but
mor
e em
pha
sis
on e
nter
tain
men
t and
va
riety
11THE NATURE OF THE INTERNATIONAL, NATIONAL AND KWAZULU-NATAL RETAIL AND SHOPPING CENTRE INDUSTRY
Typ
e o
f C
entr
eS
ize
of
cen
tre
(m²)
Trad
e ar
eaA
cces
sR
equ
ire-
men
tsN
o. o
f h
ou
seh
old
sP
op
ula
tio
nS
oci
o-
eco
no
mic
g
rou
ps
Ave
Rad
ius
(km
)
Med
ian
Trav
el
tim
e (m
in)
Mai
n t
enan
ts
Sp
ecia
list
Cla
ssifi
catio
ns
Big
Bo
x R
etai
lers
Vary
from
2 0
00
to 1
5 00
0D
epen
d o
n ty
pe
of s
tore
or
cent
re -
mos
tly
on r
egio
nal l
evel
Maj
or u
rban
ar
teria
l mai
n ro
ad.
LSM
6-9
, (±
25 0
00)
LSM
10-
10+
, (±
14 0
00)
50 0
00-1
00 0
00M
ainl
y ab
ove
aver
age
LSM
7-1
0
5-10
10-3
0•
spec
ialis
t tra
der
s
Ent
erta
inm
ent
/Cas
ino
Vary
from
2 0
00
to 3
0 00
0D
epen
d o
n ty
pe
of s
tore
or
cent
re -
mos
tly
on r
egio
nal l
evel
Maj
or u
rban
ar
teria
l mai
n ro
ad.
5 70
0 –
85 7
0020
000
– 3
00 0
00A
vera
ge
and
hi
ghe
rLS
M 5
-10
5-10
10-3
0•
spec
ialis
t tra
der
s/
ente
rtai
nmen
t and
/or
them
e ce
ntre
• em
pha
sis
on fo
od, r
esta
uran
ts
and
fast
food
out
lets
Life
styl
e C
entr
e15
000
– 5
0 00
0 (c
an b
e sm
alle
r or
larg
er)
Up
scal
eC
atch
men
t are
asM
ajor
urb
an
arte
rial m
ain
road
.
LSM
6-9
(40
000-
60 0
00)
LSM
10-
10+
(20
000-
30 0
00)
±20
0 00
0±
105
000
Mai
nly
LSM
9-1
03-
86
- 20
• up
scal
e su
per
mar
ket
• b
ook
stor
es•
din
ing
• en
tert
ainm
ent
• sp
ecia
lity
reta
il (h
ouse
/hom
e/g
ard
en)
• fr
esh
pro
duc
e st
ores
Valu
e C
entr
e10
000
– 5
0 00
0N
ext t
o re
gio
nal
cent
re o
r on
m
ain
road
/hi
ghw
ay
Maj
or u
rban
ar
teria
l mai
n ro
ad.
LSM
6-9
(40
000-
60 0
00)
LSM
10-
10+
(20
000-
30 0
00)
±20
0 00
0±
105
000
Mid
dle
to
abov
e av
erag
eLS
M 6
-10
3-6
10-1
5•
emp
hasi
s on
big
box
ret
aile
rs•
spec
ialis
t ret
aile
rs•
hom
e im
pro
vem
ent
• sm
all t
o la
rge
gro
cerie
s
Hyp
er C
entr
e15
000
– 3
5 00
0La
rge
sub
se
gm
ent o
f a
city
/met
ro. S
ame
as r
egio
nal
cent
res.
Maj
or u
rban
ar
teria
l mai
n ro
ad.
LSM
10-
10+
(21
400
- 50
000)
LSM
6-9
(60
000–
100
000
)
75 0
00 –
175
000
Mid
dle
to
abov
e av
erag
eLS
M 5
-10
6-8
10-1
5•
one
hyp
er s
tore
(7
0% o
f are
a)•
conv
enie
nce
line
stor
es•
serv
ices
Mo
tor
sho
wro
om
s50
0 -5
000
Alo
ng m
ajor
ar
teria
l rou
tes
Hig
her
LSM
su
bur
bs
Filli
ng S
tatio
ns30
- 26
0 Lo
cal &
thro
ugh
traf
fi cM
ain
arte
rial
rout
es,
hig
hway
s an
dfe
eder
roa
ds
Dep
end
on
the
size
of
the
fi llin
g s
tatio
nA
ll LS
M 4
-10
• co
nven
ienc
e st
ore
• A
TM•
fast
food
• ca
r w
ash
Air
po
rt R
etai
lD
epen
din
g o
n si
ze o
f airp
ort
Siz
e of
airp
ort
will
det
erm
ine
size
Acc
essi
bili
ty
for
arriv
als
&
dep
artu
res
&
visi
tors
Mai
nly
hig
her
LSM
• m
ainl
y fo
od•
curio
’s &
sou
veni
rs•
clot
hing
• ex
chan
ge
serv
ices
12 THE NATURE OF THE INTERNATIONAL, NATIONAL AND KWAZULU-NATAL RETAIL AND SHOPPING CENTRE INDUSTRY
Typ
e o
f C
entr
eS
ize
of
cen
tre
(m²)
Trad
e ar
eaA
cces
sR
equ
irem
ents
No
. of
ho
use
ho
lds
Po
pu
lati
on
So
cio
-ec
on
om
ic
gro
up
s
Ave
Rad
ius
(km
)
Med
ian
Trav
el
tim
e (m
in)
Mai
n t
enan
ts
Unp
lann
ed/in
crem
enta
l Cla
ssifi
catio
ns
CB
D/
Tow
n C
entr
eVa
ry fr
om 1
0 00
0 to
300
000
N
umb
er o
f sto
res
dep
end
on
size
of
tow
n
Nor
mal
ly v
ery
wid
e-o
utly
ing
tow
nshi
p
area
s
Maj
or r
oad
s ru
nnin
g
thro
ugh
the
CB
D/
Tow
n C
entr
e –
focu
s on
taxi
/tra
in/b
us
tran
spor
t
Nor
mal
ly v
ery
hig
h, s
tart
ing
at
±10
000
ho
useh
old
s
30 0
00+
Dom
inan
tLS
M 4
-6N
ot fi
xed
-U
p to
50
km
Mai
nly
by
taxi
Wid
e va
riety
of t
enan
ts
incl
udin
g:
• na
tiona
l ten
ants
• su
per
mar
kets
• ho
mew
are
stor
es•
furn
iture
sto
res
• ce
ll p
hone
sho
ps
• b
anki
ng fa
cilit
ies
Taxi
Ran
k R
etai
l /C
om
mut
er
Cen
tre
1 00
0 to
15
000
Dep
end
ing
on
stat
ion
Sam
e as
ab
ove
Hig
hly
acce
ssib
le
area
ad
jace
nt to
taxi
ra
nks
/sta
tion
Sam
e as
ab
ove
20 0
00 –
300
000
Peo
ple
per
day
Mai
nly
LSM
1-6
Not
fi xe
d-
Up
to 5
0 km
20 m
inut
es
plu
s•
natio
nal t
enan
ts•
sup
erm
arke
ts•
hom
ewar
e st
ores
• fa
st fo
od o
utle
ts•
cell
pho
ne s
hop
s•
ATM
faci
litie
s
Flea
Mar
kets
/In
form
al T
rad
eVa
ry fr
om a
fe
w s
tand
s to
hu
ndre
ds
of
stan
ds
Focu
sing
on
pas
sing
p
edes
tria
n vo
lum
esH
igh
volu
mes
of
ped
estr
ian
traf
fi c is
im
por
tant
Not
ap
plic
able
Ped
estr
ian
volu
mes
nee
d to
b
e ve
ry h
igh
Mai
nly
LSM
1-6
Par
t of
larg
er
tow
n/ru
ral
trad
e ar
ea
Pas
sing
by
• fo
od•
clot
hing
and
sho
es•
frui
t and
veg
etab
les
• el
ectr
onic
eq
uip
men
t an
d c
ell p
hone
s•
mus
ic a
nd D
VD
s
Sp
aza
Sh
op
s10
– 5
0m²
Pro
vid
e th
e su
rrou
ndin
g r
esid
ents
–
wal
king
dis
tanc
e up
to
400
-800
m
200
- 400
+2
000
+M
ainl
yLS
M 1
-6U
p to
50
0mU
p to
5
min
utes
w
alki
ng
time
• co
nven
ienc
e g
roce
ry
goo
ds
• ci
gar
ette
s
Rur
al R
etai
l D
evel
op
men
t5
000
– 30
000
Who
le c
omm
unity
up
to
50k
mC
lose
to m
ain
com
mun
ity a
nd ta
xi
faci
lity
20 0
00 -
210
000
80 0
00 –
560
000
Mai
nly
LSM
1-5
Very
wid
e up
to 8
0 km
Up
to 4
5 m
inut
es•
dep
end
on
the
size
–
need
to fo
cus
on th
e ne
eds
of th
e su
rrou
ndin
g
com
mun
ity

13THE NATURE OF THE INTERNATIONAL, NATIONAL AND KWAZULU-NATAL RETAIL AND SHOPPING CENTRE INDUSTRY
12. Proposed interaction between town planners, retail centre developers and local authority
The pre-application consultation should cover various aspects or issues such as:
• demographic and market study;• proven need and desirability;• traffi c impact assessment;• parking requirements;• provision for taxi rank and public transport facilities;• relevant land use zoning and development controls;• preliminary site development plan indicating aspects like ingress to and egress from the site, loading
zones, air-conditioning, signage, lighting, impact on adjacent properties and• the socio-economic impact of the development on the local community in terms of job creation, taxes and
the economic impact of such a development.
13. Use of the guideline document
The following 10 aspects are of critical importance:
• To understand the dynamic nature of a particular market;• The key aspect of retail facility viability remains a very good visible and accessible site;• Suffi cient people/households to warrant a specifi c size centre;• To make sure that most of the planned residential development for a new centre is occupied and that
households can spend money on retail products;• To be aware of cannibalisation of own stores;• To overestimate the potential, • To offer the right products to the target market;• To be aware of the size and strengths of competing facilities;• Not to over-build any centre ;and• To correctly time the project.
14. Site selection checklist for retail development
SITE SELECTION CHECKLIST FOR RETAIL DEVELOPMENT
Population Accessibility Competition
• Population size• Age profi le• Household size• Income levels• Disposable income per capita• Occupation classifi cations• Seasonal fl uctuations• Housing numbers• Housing age/type• Current shopping patterns• LSM Groups
• Pedestrian fl ow• Pedestrian entry routes• Public transport• Types of transport• Ease of use• Car ownership levels• Road network• Conditions and roads• Driving speeds• Congestion• Restrictions• Plans to upgrade• Parking facilities/requirements• Capacity- road• Convenience• Visibility
• Existing retail activity• Direct competitors• Indirect competitors• Anchor stores• Trade areas• Age of outlets• Competitive potential• Outlet expansion• Refurbishment• Vacant sites• Interception• Repositioning• Competitor policy• Cannibalisation
* Source: McGoldrich, 1990 (adjusted)
14 THE NATURE OF THE INTERNATIONAL, NATIONAL AND KWAZULU-NATAL RETAIL AND SHOPPING CENTRE INDUSTRY
15. Conclusion
Retailing is very dynamic, with changes on a regular basis. The above mentioned must be seen as broad guidelines which will answer most questions insofar as retail development is concerned.
Market and economic forces, as well as a good location, will in most cases, result in sustainable retail devel-opment and satisfying the needs of the customers.

15THE NATURE OF THE INTERNATIONAL, NATIONAL AND KWAZULU-NATAL RETAIL AND SHOPPING CENTRE INDUSTRY
THE NATURE OF THE INTERNATIONAL, NATIONAL AND KWAZULU NATAL RETAIL AND SHOPPING CENTRE
INDUSTRY1. BACKGROUND
The old marketplace has been replaced by shopping centres. The purpose of shopping centres is to satisfy the needs of customers through the provision of the required retail products. There are also other needs which become part of this ‘new marketplace’, such as entertainment, providing specifi c services, and allow-ing people to socialise.
There are different needs that should be satisfi ed and therefore different sizes and types of shopping cen-tres develop. Each type of store has its own threshold value, indicating the minimum number of people and disposable income required, to be viable. Some stores require fewer households, while others require a very large population to operate. This results in a defi nite hierarchy of shopping centres, which operates and func-tions according to the different environments.
Retail development in South Africa is strongly infl uenced by what is happening worldwide. Current worldwide economic conditions are also impacting on the retail sector in South Africa. It is therefore of utmost impor-tance to understand global economic trends, and the impact on retail development.
Retail development is also infl uenced by changes in demographics, income and shopping behaviour. The specifi c impact of all these aspects will also be highlighted to get a better understanding of the KZN situa-tion.
This report consists of two very clear sections:
1. A broad overview of the theoretical aspects associated with retail and shopping centre development locally and internationally, and
2. To focus on retail demand and supply in KZN.
Section 1 of the report focused on the following:
• The international and local understanding and classifi cation of retail and shopping centre facilities. This theoretical approach formed a broad based understanding of shopping centre development.
• To address international trends insofar as shopping centre development is concerned.
• To evaluate the broader environment in which retail in South Africa operates.
The latter will focus on the following:
- macro-economic conditions,
- the political situation,
- social changes and development.
- the retail market in South Africa with specifi c reference to the national supply and demand of shopping centre facilities, and
- The way in which changes in shopping behaviour infl uence the demand for shopping facilities.

16 THE NATURE OF THE INTERNATIONAL, NATIONAL AND KWAZULU-NATAL RETAIL AND SHOPPING CENTRE INDUSTRY
All this culminates in a good understanding of the macro environment, before focusing on KZN in particular.
The main objectives of the second section where the focus is on KZN, are:
• to get a clear understanding of the economic base of the province;• to indicate the current demand of all retail space as infl uenced by household numbers, socio-economic
profi les and disposable income;• to give an indication of the current supply of retail space in KZN with specifi c reference to shopping centre
space, and• to focus on the identifi cation of guideline parameters that would form the basis for the fi nal guideline
document. In this regard, input was received from a number of stake holders, as well as during a workshop held in Durban.
2. DEFINITION OF RETAIL AND THEORETICAL CLASSIFICATION MODELS
This section focuses on the following:
• a defi nition of retailing;
• a detailed understanding of the theoretical base for the existence of a hierarchy of shopping centres;
• to indicate historical and current international and local shopping centre classifi cation methods, and
• to give a brief description of shopping centre development trends in the rest of the world, with specifi c reference to Africa and other developing countries.
2.1 Defi nition of Retailing
The defi nition of retailing, as it will be used throughout this report, embraces the following:“All activities connected with the selling of goods and services to the end consumer”. Retail transactions, however, do not take place on business premises only. A clear differentiation will be drawn. The most impor-tant components of retail will include the following: (Diagram 2.1)
• type of ownership• the type of merchandise sold• type of business• the location• physical structures.

17THE NATURE OF THE INTERNATIONAL, NATIONAL AND KWAZULU-NATAL RETAIL AND SHOPPING CENTRE INDUSTRY
DIAGRAM 2.1DIFFERENT COMPONENTS OF RETAIL
Independent/Franchise
chain
Owned by manufacturer
Type of ownershipOwned by government
Owned by farmer
Owned by public company
Owned by consumer
Type of merchandise Variety
Motor dealers
Furniture & appliances
Clothing & accessories
Type of businessPharmacy & patent medicines
Eating and drinking places
Differentclassifi cations
Food stores
Service stations
General dealers
Service outlets
Entertainment
Distinguish: rural through to metropolitanCentral business district
LocationShopping centres
Individual centres/free standing(hierarchy of centres)
Strip/value
Mail orders
Non-store tradeElectronic in-house purchase
Telesales
Internet shopping
Source: Mason, et al., 1988:22 (adjusted for 2009).

18 THE NATURE OF THE INTERNATIONAL, NATIONAL AND KWAZULU-NATAL RETAIL AND SHOPPING CENTRE INDUSTRY
A large portion of the retail facilities in KZN is represented as part of a rural environment and therefore it is important from a geographical point of view to clearly distinguish between metropolitan and rural retail fa-cilities. The following characteristics are typical of rural areas:
• population numbers are in many instances small and spread over a very wide geographical area;• population densities are much lower, impacting on the size of the catchment area;• mainly part of the lower LSM*1 groups compared to the middle and upper income groups in the metropoli-
tan areas;• transport facilities comprise taxi versus private transport;• lower car ownership;• higher levels of unemployment;• no major other supporting employment facilities. In some cases trading activities would be a stimulus for
higher employment fi gures and higher household income.
2.2 Theoretical base
It is necessary to briefl y examine some of the theoretical models that were developed to explain the distribu-tion of retail facilities, and more specifi c shopping centres and their trade areas. A summary is given of the most important theoretical models that highlight and explain the existence of a hierarchy of shopping facili-ties.
2.2.1 Central Place Theory (Christaller 1933)
It is regarded that the central place theory is the basis for most of the classifi cations that have been developed in the western world, subsequent to the original study in 1933. There are many points of critique regarding this model, but there are a few important aspects that do apply in the evaluation of any shopping centre hierarchy.
The Central Place Theory is based on two very important fundamental concepts namely:
• Threshold population - this is the minimum population which is required to bring about the offering of certain goods for sale, or to sustain any service. In economic terms it means the minimum demand to make such an offering viable. A detailed discussion of this concept will be covered later in this document.
• Range of goods and service - this is the maximum distance which people will travel to purchase goods and derive a service offered at a central place.
All this resulted in a hierarchy of central places, each with its own appropriate size shopping facility.
The basic principle of a hierarchy of shopping opportunities is also applicable to an understanding of the hierarchy of retail centres within the city. The intra-urban hierarchy of shopping centres would range from the isolated street corner grocery store to the neighbourhood, community and super regional shopping centre.
1 * See Section 4.3.1 for a detailed explanation of the different LSM categories.

19THE NATURE OF THE INTERNATIONAL, NATIONAL AND KWAZULU-NATAL RETAIL AND SHOPPING CENTRE INDUSTRY
2.2.2 Gravitation Model (Reilly, 1930s)
The gravity model was based to a large extent on Newton’s Law of Gravitation where a force exists be-tween two bodies, and that force depends on the size (mass) of each of the bodies.
Reilly started to apply this model to measure the retail trade areas of cities in the 1930s. The main as-pects of his theory were as follows:
• population of and distance between two cities (centres) are the only variables used;
• cities of equal size would have a trade area boundary midway between them;
• if the centres are of unequal size the boundary would be nearer to the smaller city.
This model is very rigid, taking only two variables namely size and distance into account. It does how-ever provide an important base for any hierarchy to illustrate the forces that are active between certain shopping centres. The situation is however much more complex in reality.
2.2.3 Probability Model - Huff (1963)
The Huff model incorporates the conceptual framework of Reilly and other gravity models but focuses on the spatial behaviour of consumers. This model is based on two fundamentals:
• the size of a shopping centre• travel time to the centre.
The fundamental argument is as follows:
• the larger the centre, the more variety is offered and the greater the consumers’ expectation would be of a successful shopping trip;
• travel time is related to the utility of the shopping centre. The further the customer lives from the centre, the less likely the trip to the centre would be.
The unique feature of the Huff model is the generation of probability surface. Customers living close to the centre will have a high probability of supporting the centre. As distance increases from the centre, the probability decreases. This model can be used to delineate trade areas by determining equal prob-ability contours to two or more centres. A 50% or 60% contour is used to delineate a trade area.
An important notion of this model is the fact that the customer behaviour in urban areas is fl exible and complex, not rigid, and that shopping behaviour is governed by choice.
A shopper could thus support a variety of centres for goods and services offered at a particular centre if not available from another centre.
20 THE NATURE OF THE INTERNATIONAL, NATIONAL AND KWAZULU-NATAL RETAIL AND SHOPPING CENTRE INDUSTRY
2.2.4 A classifi cation of urban commercial structure (Berry, 1967)
This classifi cation forms the basis for our understanding of the different types and hierarchy of shop-ping centres.
Berry developed a broad classifi cation of retail facilities. He identifi ed three main components, namely: (see Diagram 2.1)
• centres• ribbons • specialised areas.
Shopping centres demonstrate a hierarchical arrangement with a 2low-order isolated convenience store (small grocery store) and a neighbourhood centre, both offering low order and a few 3higher-order facilities (variety of clothing and household stores). At the regional level the most specialised stores, as well as department stores are represented.
Ribbon developments incorporate those retail and service functions mainly orientated to vehicular traf-fi c, including fi lling stations, fast-food restaurants, motorcar dealers, tyre dealers, nurseries and other similar operations. These functions serve demand created by motorcar customers. Arterial streets with the highest vehicular traffi c volume are the most densely developed. The intersections of two or more major arterials have higher development intensity. Some commercial ribbon streets stretch for kilome-tres.
Large metropolitan areas also contain specialised function areas. These are characterised by motorcar showrooms and professional offi ce clusters (doctors, dentists and lawyers). Specialised function areas require good accessibility, because they draw customers from the entire metropolitan area.
This classifi cation remains the most suitable today to describe the retail landscape, and is especially appropriate to explain the hierarchy of shopping centres.
2 Low order facility refers to a product/store visited frequently for daily use/consumption3 A higher order facility refers to a product/store that needs a large number of people to warrant the existence of such a facility.

21THE NATURE OF THE INTERNATIONAL, NATIONAL AND KWAZULU-NATAL RETAIL AND SHOPPING CENTRE INDUSTRY
DIAGRAM 2.2
CENTRES RIBBONS SPECIALISED AREAS
Planned or Unplanned
Traditional Shopping Street Automobile Rows
Convenient
Urban Arterial Printing DistrictsNeighbourhood
Community New Suburban Ribbon Entertainment Districts
RegionalHighway Oriented
Planned or Unplanned Plaza
Exotic MarketsMetropolitan CBD
Furniture Districts
Medical CentresPlanned
Unplanned
Source: Berry, 1988
Note: Berry has not indicated any specifi c sizes for the different types of centres.
2.3 International Classifi cation of Retail Facilities
The main reason for including a variety of international classifi cation models is as follows:
• to indicate their approaches, trends and similarities; and• to learn from these classifi cations and to eventually indicate the difference as far as South Africa is con-
cerned.
2.3.1 Retail Classifi cation (Dawson, 1983)
Dawson developed his hierarchy (Table 2.1) which was an expansion of the traditional classifi cation of the neighbourhood, community and regional centre in 1983.

22 THE NATURE OF THE INTERNATIONAL, NATIONAL AND KWAZULU-NATAL RETAIL AND SHOPPING CENTRE INDUSTRY
TABLE 2.1SHOPPING CENTRE CLASSIFICATION
(DAWSON 1983)
The Structure of the Shopping Hierarchy
1. General Purpose of Free Standing Shopping Centres(or the 4 Suburban levels of the basic hierarchy) with subtypes of:• Local Convenience• Neighbourhood• Community• Regional • Super-Regional which may be added to the top of these sub-types
2. General Purpose of Renewal Centres (with three subtypes that occur within any of those in category 1, as well as the CBD):• Infi ll centre• Extension centre• Core replacement centreAlongside the general purpose shopping centres are the remaining categories, 3 - 6.
3. Multi-use Shopping Centres1
Here social, offi ce and other facilities are integrated with the shopping provision of the basic hierarchy.
4. Speciality, Theme or Festive Shopping Centres (with sub-types of the following):• High order comparison purpose-built speciality centres, such as fashion or tourist centres in high income
areas.• Speciality or theme centres developed in recycled buildings in central and specifi c locations, such as
centres in former markets or railway halls.• Festive shopping centres with specifi c leisure components developed in specialised locations such as
redeveloped waterfronts.
5. Entertainment Shopping Centres A shopping mall combined with substantial entertainment and amusement facilities, and includes food courts and cinemas.
6. Focused Shopping Centres (with two sub-types):• Superstore centres, in which a single large tenant dominates retail provision, such as in Hypermarket
centres or discount centres.• Specialised sales mall, in which all the outlets are orientated to the same product, such as auto malls, DIY
malls, etc.• Bargain centre, which refl ect the present trend of factory outlets to cluster.
7. Non-Residential Serving CentresThey provide retail fl oorspace that does not serve immediate resident populations. They comprise two subtypes:• Strip centres, which are on major transport routes and are interceptive to a large population, and• Ancillary Shopping Centres which provide shopping within structures (or landuse zones) developed
primarily for another function such as hotels, offi ces, industrial areas, or transport complexes.
It can thus be seen that there are innovative new shopping centres, which occur in addition to the traditional hierarchy.
Multi-use Shopping Centres4
4 This concept is lately (post - 2000) referred to as New Urbanism

23THE NATURE OF THE INTERNATIONAL, NATIONAL AND KWAZULU-NATAL RETAIL AND SHOPPING CENTRE INDUSTRY
Tab
le 2
.2 in
dic
ates
the
det
ail o
f the
cla
ssifi
catio
n of
Daw
son
with
som
e th
resh
old
val
ues
to r
adiu
s, p
opul
atio
n an
d s
ize
of c
entr
e.
TAB
LE 2
.2D
ETA
ILS
OF
THE
RET
AIL
CLA
SSIF
ICA
TIO
N (
DAW
SON
, 1
98
3)
BA
SIC
HIE
RA
RC
HY
RE
NE
WA
L C
EN
TR
ES
NO
N-R
ES
IDE
NT
IAL
SE
RV
ING
NE
W T
YP
ES
Loca
l C
onve
nien
ceC
lust
er
Nei
ghb
ourh
ood
Cen
tre
Com
mun
ityC
entr
eR
egio
nal
Cen
tre
Infi l
lC
entr
eE
xten
sion
Cen
tre
Cor
e R
epla
cem
ent
Mul
ti-us
eA
ncill
ary
Str
ipS
pec
ialit
y/Th
eme
Focu
sed
Hyp
er-
mar
ket
Cen
tre
Ent
erta
inm
ent
1M
ajor
func
tion
Con
veni
ence
g
ood
sC
onve
nien
ce
goo
ds
and
p
erso
nal s
ervi
ces
Sam
e, p
lus
com
par
ison
cl
othi
ng,
app
lianc
es,
etc.
Sam
e, p
lus
spec
ialit
y.Fu
rnitu
re,
qua
lity
clot
hes,
etc
.
Non
eC
omp
aris
on
shop
pin
gC
omp
aris
on
shop
pin
gC
omp
aris
on
shop
pin
g,
serv
ices
, ad
min
istr
ativ
e
Con
veni
ence
an
d s
ervi
ceB
asic
co
nven
ienc
e an
d
serv
ices
, or
sale
s ou
tlets
Hig
h or
der
im
pul
se
goo
ds
Dis
coun
ted
g
ood
s (li
mite
d
rang
e)
Con
veni
ence
g
ood
s an
d
rout
inel
y b
oug
ht
dur
able
s
Hig
h or
der
im
pul
se g
ood
s,
leis
ure
and
en
tert
ainm
ent
2Le
adin
g
tena
ntC
afé/
Gro
cer
Sup
erm
arke
t2-
3 sm
all
varie
ty a
nd/o
r d
epar
tmen
tal
stor
es
Thre
e or
m
ore
larg
e d
epar
tmen
t st
ores
Non
eVa
ried
Dep
artm
ent
stor
esD
epar
tmen
t st
ores
Non
eN
one
Ofte
n no
neM
ass
mer
chan
dis
erH
yper
mar
ket
Ran
ge
of
attr
actio
ns
2.a
Con
trol
of
tena
nt m
ixS
light
Som
eC
onsi
der
able
Con
sid
erab
leS
light
Som
eC
onsi
der
able
Con
sid
erab
leN
one
Non
eC
onsi
der
able
Con
sid
erab
leC
onsi
der
able
Con
sid
erab
le
3Lo
catio
nC
olle
ctor
ro
ads
with
in
resi
den
tial
area
Inte
rsec
tion
of
colle
ctor
and
ar
teria
l roa
ds
Inte
rsec
tion
of m
ajor
ar
teria
ls
Inte
rsec
tion
of fr
eew
ays
and
/or
maj
or
arte
rial
With
in e
xist
ing
d
evel
opm
ents
Clo
se to
co
re o
f sh
opp
ing
Cen
tre
of
shop
pin
gN
ew
com
mun
ityH
otel
, offi
ce
and
ind
ustr
yN
one
Hig
h in
com
e se
ctor
Junc
tion
on
maj
or r
oad
ne
twor
k
Inte
rsec
tion
of fr
eew
ays
and
/or
maj
or
arte
rial
Maj
or fo
cus
4R
adiu
s of
se
rvic
e ar
ea
With
in 5
m
ins.
Driv
ing
tim
e or
re
ason
able
w
alki
ng
dis
tanc
e
5-10
min
s.
driv
ing
tim
e5-
15 m
ins.
d
rivin
g ti
me
20 m
ins.
d
rivin
g ti
me
N/A
N/A
N/A
N/A
N/A
Inte
rcep
tory
lo
catio
nsN
/A20
-30
min
s.
driv
ing
tim
e20
min
s.
driv
ing
tim
e20
min
s. d
rivin
g
time
5M
inim
um
sup
por
t p
opul
atio
n
1 00
0 - 2
000
p
eop
le20
000
- 60
000
p
eop
le60
000
- 1
50 0
00
peo
ple
100
000
or
mor
e p
eop
leN
/AN
/AN
/A50
000
- 2
00 0
00
peo
ple
N/A
N/A
Reg
iona
lN
/A10
0 00
0 or
m
ore
peo
ple
Reg
iona
l
6S
ite a
rea
(Sho
pp
ing
ce
ntre
)
0,5
- 1,0
ha
1,5
- 3,0
ha
4,0
- 12,
0 ha
16,0
– 4
0,0
haN
/AN
/AN
/A5,
0 –
40,0
ha
0,5
- 3,0
ha
N/A
1,0
- 3,0
ha
N/A
10,0
– 2
0,0
haN
/A
7R
ang
e of
le
asab
le
area
(g
ross
)
300
– 1
200m
²7
000
- 12
000m
²15
000
- 30
000
m²
50 0
00 -
100
000m
²10
0 - 5
000
m²
5 00
0 -
20 0
00m
²10
000
- 75
000
m²
20 0
00 -
50 0
00m
²2
000
- 10
000
m²
200
- 3
000m
²5
000
- 10
000
m²
300
- 30
000
m²
18 0
00 -
30 0
00m
²N
/A
7aP
rese
nt
thre
shol
d
size
s
N/A
8 00
0 - 1
0 00
0m²
15 0
00 -
20 0
00m
²75
000
- 10
0 00
0m²
2 50
0m²
15 0
00m
²40
000
m²
20 0
00m
²(r
etai
l)3
000m
²Va
ried
6 00
0m²
10 0
00m
²15
000
- 18
000
m²
N/A
8N
umb
er o
f st
ores
5 –
1515
– 4
030
- 60
40 -
100
15 -
20Va
ried
Varie
dVa
ried
5 –
20Va
ried
Varie
d
(mos
tly s
mal
l un
its)
Dom
inan
t te
nant
(s)
Hyp
erm
arke
t p
lus
10-2
0 sh
ops
Varie
d o
utle
ts

24 THE NATURE OF THE INTERNATIONAL, NATIONAL AND KWAZULU-NATAL RETAIL AND SHOPPING CENTRE INDUSTRY
2.3.2 International Council of Shopping Centre Classifi cation
The classifi cation of retail space has always been complex. This is because there are so many different identities/categories to be linked to retail space. In the United States of America there have been prob-lems in classifying retail space into either standard categories or into some form of specialised type of centres. Table 2.3 is a list of the various categories:
TABLE 2.3CONFUSING TERMINOLOGY REGARDING
SHOPPING CENTRE DESCRIPTION AND TYPE OF CENTRES
General Descriptions/Standard Specialised Centres
Centres, commons, crossings, hybrids, lifestyle centres, malls, markets, marts, mega malls, mixed-use, outlets, parkways, places, plazas, promenades, shops, strips, squares, etc.
Convenience, entertainment, ethnicity, festival, lifestyle, luxury, tourist, urban and value.
In the United States of America, shopping centre development can be categorised into four distinct phases where different styles and approaches were followed:
• Phase 1
Shopping centres were classifi ed into several basic categories, this includes community centres, neighbourhood centres and strip centres. Early shopping centres also tended to be fairly uniform, de-signed to satisfy more of the mass merchandise demands, while offering the convenience of one-stop-shopping.
• Phase 2
The age of regional malls was born. The shift from urban to suburban shopping centres became the developing trend. Shopping centres were then mostly enclosed with a common corridor connecting tenants.
• Phase 3
Period of product differentiation, the two core categories were further subdivided. Super regional malls became more common, and even bigger mega malls started to develop. Developers started to recog-nise their niches and began to develop retail in the form of entertainment, festival, lifestyle, mixed-use, open-air, premium and tourist centres.
• Phase 4
The current wave is to build the so-called “lifestyle” centres, where it is all about the openness, the street-like atmosphere, and the creation of a unique shopping experience.
The main emphasis in each of the four phases discussed above was to offer something unique and to remain attractive in order to continuously draw support from the marketplace.
Table 2.4 below clearly indicates the latest classifi cation by the ICSC. Apart from the traditional malls, the classifi cation also distinguishes between open-air centres, including lifestyle centres, power cen-tres, theme/festival centres and outlet centres.

25THE NATURE OF THE INTERNATIONAL, NATIONAL AND KWAZULU-NATAL RETAIL AND SHOPPING CENTRE INDUSTRY
TABLE 2.4SUMMARY OF ICSC SHOPPING CENTRE CLASSIFICATIONS
Type Subtype Concept Size(m²)
Malls
Regional Centre General merchandise, fashion 40 000 - 80 000
Super Regional Centre Same as regional; more variety and assortment Over 80 000
Open-air centres
Neighbourhood Centre Convenience 3 000 - 15 000
Community Centre General merchandise; convenience 10 000 - 35 000
Lifestyle Centre Upscale; national, speciality; entertainment, outdoor 15 000 - 50 000
Power Centre Category-dominant anchors, few small tenants 25 000 - 60 000
Theme/Festival Centre Leisure; tourist-oriented; retail and service 8 000 - 25 000
Outlet Centre Manufacturer’s outlet stores 5 000 - 40 000
De Lisle, J. R, 2005, US Shopping Centre Classifi cation, volume 12, no 2. ICSC, Research Review, 2005.
The outstanding aspects regarding this classifi cation are the following:
• not much additional information about the threshold values, driving times and other requirements is provided; and
• the open-air centres consist of a broad variety/mix of different retail types;
The current ICSC classifi cation is used by institutional investors, real estate investment trusts, research institutions, valuers, lenders and city planners. Potential users include city marketers, development agencies and retail developers.
26 THE NATURE OF THE INTERNATIONAL, NATIONAL AND KWAZULU-NATAL RETAIL AND SHOPPING CENTRE INDUSTRY
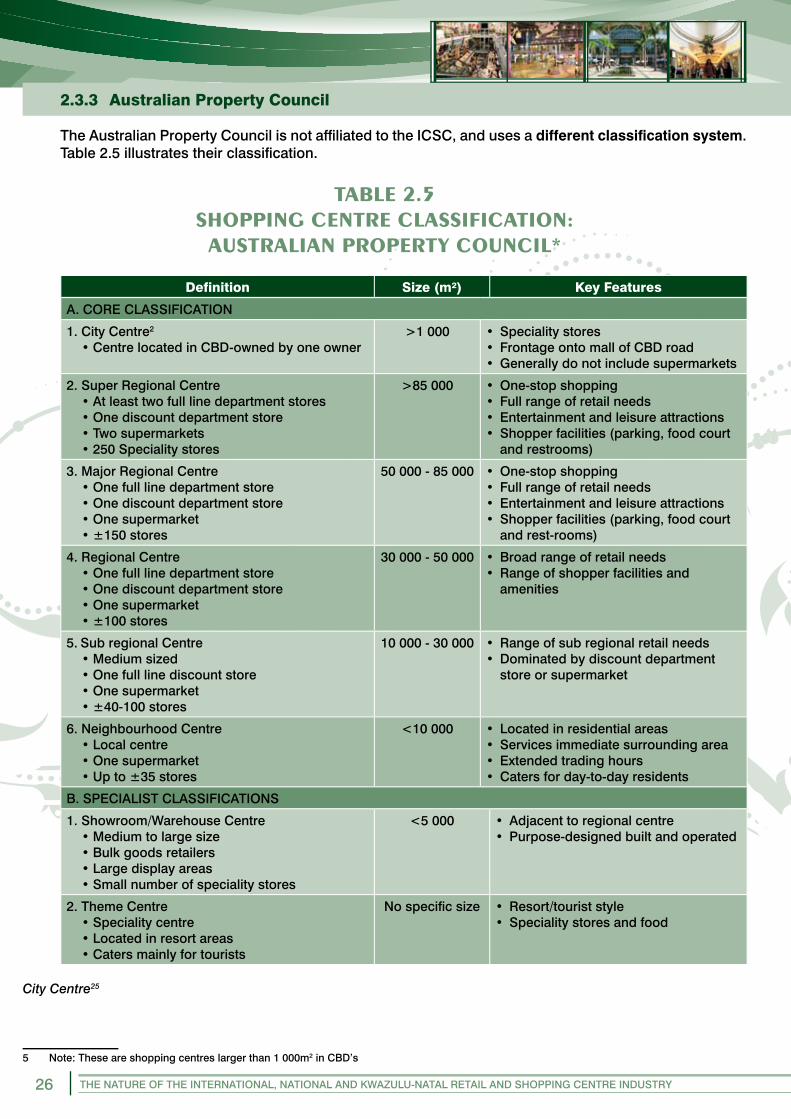
2.3.3 Australian Property Council
The Australian Property Council is not affi liated to the ICSC, and uses a different classifi cation system. Table 2.5 illustrates their classifi cation.
TABLE 2.5SHOPPING CENTRE CLASSIFICATION:AUSTRALIAN PROPERTY COUNCIL*
Defi nition Size (m²) Key Features
A. CORE CLASSIFICATION
1. City Centre2
• Centre located in CBD-owned by one owner>1 000 • Speciality stores
• Frontage onto mall of CBD road• Generally do not include supermarkets
2. Super Regional Centre• At least two full line department stores• One discount department store• Two supermarkets• 250 Speciality stores
>85 000 • One-stop shopping• Full range of retail needs• Entertainment and leisure attractions• Shopper facilities (parking, food court
and restrooms)
3. Major Regional Centre• One full line department store• One discount department store• One supermarket• ±150 stores
50 000 - 85 000 • One-stop shopping• Full range of retail needs• Entertainment and leisure attractions• Shopper facilities (parking, food court
and rest-rooms)
4. Regional Centre• One full line department store• One discount department store• One supermarket• ±100 stores
30 000 - 50 000 • Broad range of retail needs• Range of shopper facilities and
amenities
5. Sub regional Centre• Medium sized• One full line discount store• One supermarket• ±40-100 stores
10 000 - 30 000 • Range of sub regional retail needs• Dominated by discount department
store or supermarket
6. Neighbourhood Centre• Local centre• One supermarket• Up to ±35 stores
<10 000 • Located in residential areas• Services immediate surrounding area• Extended trading hours• Caters for day-to-day residents
B. SPECIALIST CLASSIFICATIONS
1. Showroom/Warehouse Centre• Medium to large size• Bulk goods retailers• Large display areas• Small number of speciality stores
<5 000 • Adjacent to regional centre• Purpose-designed built and operated
2. Theme Centre• Speciality centre• Located in resort areas• Caters mainly for tourists
No specifi c size • Resort/tourist style• Speciality stores and food
City Centre25
5 Note: These are shopping centres larger than 1 000m2 in CBD’s
27THE NATURE OF THE INTERNATIONAL, NATIONAL AND KWAZULU-NATAL RETAIL AND SHOPPING CENTRE INDUSTRY
Defi nition Size (m²) Key Features
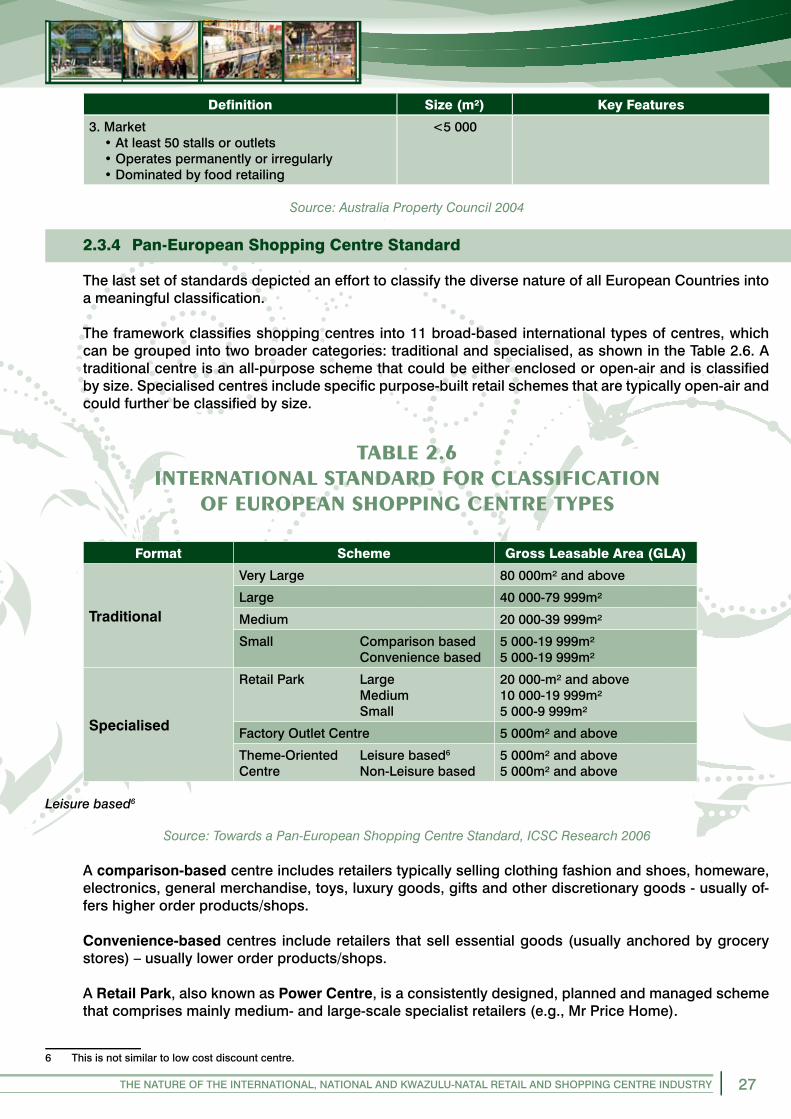
3. Market• At least 50 stalls or outlets• Operates permanently or irregularly• Dominated by food retailing
<5 000
Source: Australia Property Council 2004
2.3.4 Pan-European Shopping Centre Standard
The last set of standards depicted an effort to classify the diverse nature of all European Countries into a meaningful classifi cation.
The framework classifi es shopping centres into 11 broad-based international types of centres, which can be grouped into two broader categories: traditional and specialised, as shown in the Table 2.6. A traditional centre is an all-purpose scheme that could be either enclosed or open-air and is classifi ed by size. Specialised centres include specifi c purpose-built retail schemes that are typically open-air and could further be classifi ed by size.
TABLE 2.6INTERNATIONAL STANDARD FOR CLASSIFICATION
OF EUROPEAN SHOPPING CENTRE TYPES
Format Scheme Gross Leasable Area (GLA)
Traditional
Very Large 80 000m² and above
Large 40 000-79 999m²
Medium 20 000-39 999m²
Small Comparison based Convenience based
5 000-19 999m²5 000-19 999m²
Specialised
Retail Park Large Medium Small
20 000-m² and above10 000-19 999m²5 000-9 999m²
Factory Outlet Centre 5 000m² and above
Theme-Oriented Leisure based6
Centre Non-Leisure based5 000m² and above5 000m² and above
Leisure based6
Source: Towards a Pan-European Shopping Centre Standard, ICSC Research 2006
A comparison-based centre includes retailers typically selling clothing fashion and shoes, homeware, electronics, general merchandise, toys, luxury goods, gifts and other discretionary goods - usually of-fers higher order products/shops.
Convenience-based centres include retailers that sell essential goods (usually anchored by grocery stores) – usually lower order products/shops.
A Retail Park, also known as Power Centre, is a consistently designed, planned and managed scheme that comprises mainly medium- and large-scale specialist retailers (e.g., Mr Price Home).
6 This is not similar to low cost discount centre.

28 THE NATURE OF THE INTERNATIONAL, NATIONAL AND KWAZULU-NATAL RETAIL AND SHOPPING CENTRE INDUSTRY
A Factory Outlet is where manufacturers and retailers sell merchandise at discounted prices (that may be surplus stock, prior-season stock or slow selling merchandise).
A Theme-oriented centre is either leisure based or non-leisure based. It consists of a narrow, but deep selection of merchandise within a specifi c retail category.
It is foreseen that this classifi cation will evolve over time and with the industry. This is of critical impor-tance because no classifi cation is ever fully complete.
2.4 South African Classifi cation of Retail Facilities
2.4.1 Oosthuizen (1981)
A number of classifi cation models were used/ designed over the years to address the situation in South Africa. There has been a consistent need to update these classifi cations as the industry continuously changes.
Prof. Dries Oosthuizen previously from the Institute for Urban Studies at the previously called Rand Afrikaans University (now University of Johannesburg) developed criteria for the classifi cation of a hier-archy of shopping centres. Table 2.7 indicates this classifi cation.

29THE NATURE OF THE INTERNATIONAL, NATIONAL AND KWAZULU-NATAL RETAIL AND SHOPPING CENTRE INDUSTRY
TAB
LE 2
.7
BR
OA
D C
RIT
ERIA
FO
R T
HE
CLA
SSIF
ICA
TIO
N O
F A
HIE
RA
RC
HY
OF
SHO
PP
ING
C
ON
CEN
TRA
TIO
NS
(OO
STH
UIZ
EN)
HIE
RA
RC
HIC
AL
LE
VE
LM
AJO
R C
RIT
ER
IAL
ES
SE
R C
RIT
ER
IA
Maj
orD
etai
led
Are
a (m
²)M
ain
tena
nt(m
inim
um r
equi
rem
ents
)C
omp
ositi
on(E
xcl.
sup
por
t ser
vice
s)Tr
ade
Are
aN
o. o
fS
hop
s
1C
entr
al b
usin
ess
dis
tric
tA
CB
D -
Prim
ate
Dep
end
s on
met
ro-
pol
itan
reg
ion
but
ex
pec
ted
to b
e 20
0 00
0m²
3 or
mor
e fu
ll-lin
e d
epar
tmen
t sto
res
or
com
pos
ition
of m
ajor
mag
nets
eq
ual
ther
eto
Dep
end
s on
met
ro-
pol
itan
reg
ion-
dur
able
p
red
o-m
inan
ce
Tota
l met
rop
olita
n ar
ea a
nd
surr
ound
ing
are
a1
000
BC
BD
- M
ajor
Reg
iona
l>
150
000m
²S
ame
as 2
AD
urab
le s
hop
s 67
%+
of
GLA
Por
tion
of m
etro
pol
itan
area
m
ore
than
ow
n m
unic
ipal
ar
ea50
0
CC
BD
- M
inor
Reg
iona
l75
000
- 15
0 00
0m²
Sam
e as
2B
Dur
able
sho
ps
60%
+
of G
LAS
erve
s a
tow
n =
50
000
250
City
Cen
tre
DC
BD
- C
omm
unity
25 0
00 -
75 0
00m
²S
ame
as 3
Dur
able
sto
res
40%
+
of G
LAS
erve
s a
smal
ler
tow
n10
0
2R
egio
nal
Cen
tre
AM
ajor
Reg
iona
l Cen
tre
>75
000
m²
• Tw
o or
mor
e fu
ll-lin
e d
epar
tmen
t st
ores
, or
• on
e fu
ll-lin
e d
epar
tmen
t sto
re, +
ju
nior
dep
t. st
ore
+ v
arie
ty s
tore
or
• Tw
o ch
ain
sup
erm
arke
ts +
1 fu
ll-lin
e d
epar
tmen
t sto
re
Dur
able
sho
ps
67%
+
of G
LAS
ubst
antia
l por
tion
of
met
rop
olita
n ar
ea20
-25
min
. driv
ing
tim
e
150
BM
inor
Reg
iona
l Cen
tre
25 0
00 -
75 0
00m
²•
One
full-
line
dep
artm
ent s
tore
, or
• Ju
nior
dep
t. st
ores
or
a ju
nior
dep
t. st
ore
and
a v
arie
ty s
tore
• C
hain
sup
erm
arke
ts
Dur
able
sho
ps
60%
+
of G
LAP
ortio
n of
met
rop
olita
n ar
ea15
-20
min
. driv
ing
tim
e75
3.C
omm
unity
Cen
tre
10 0
00 -
25 0
00m
²•
1 ch
ain
sup
erm
arke
t and
1 ju
nior
d
ept.
stor
e or
var
iety
sto
re, o
r•
2 ch
ain
sup
erm
arke
ts
Con
veni
ence
and
se
rvic
e sh
ops
40%
+ o
f GLA
4.N
eig
hbou
rhoo
d C
entr
e5
000
- 10
000m
²•
1 ch
ain
sup
erm
arke
t, or
• m
ore
than
one
loca
l sup
erm
arke
tC
onve
nien
ce a
ndS
ervi
ce s
hop
s60
%+
of G
LA
5.Lo
cal c
onve
nien
ceA
.B
.La
rge
loca
lS
mal
l loc
al1
000
- 5 0
00m
²50
0 - 1
000
m²
• Lo
cal s
uper
mar
ket,
or•
mor
e th
an o
ne c
afé-
gro
cer
Con
veni
ence
and
se
rvic
e sh
ops
70%
+ o
f G
LA
<10
min
driv
ing
tim
e20
-30
5-20
6.Is
olat
ed s
hop
s50
0m²
Con
veni
ence
and
se
rvic
e sh
ops
80%
+ o
f G
LA
7.H
yper
mar
kets
8 00
0 - 3
0 00
0m²
• 1
Dom
inan
t ten
ant
Mai
nly
gro
cerie
s
Gen
eral
rem
arks
Siz
e th
resh
old
is
dyn
amic
and
ch
ang
es o
ver
time
2 ch
ain
sup
erm
arke
ts =
2 d
epar
tmen
t st
ores
1 ch
ain
sup
erm
arke
t +1
loca
l sup
erm
arke
t =1
juni
or d
ept.
stor
e or
var
iety
sto
re
Exc
eptio
ns a
lway
s oc
cur,
but
in g
ener
al
com
pos
ition
is a
sou
nd
crite
rion
Turn
over
cha
nges
con
stan
tly
bec
ause
of i
nfl a
tion
and
g
row
th in
pur
chas
e p
ower
, et
c.
Rep
rese
nts
a g
reat
er
deg
ree
of
spec
ialis
atio
n
30 THE NATURE OF THE INTERNATIONAL, NATIONAL AND KWAZULU-NATAL RETAIL AND SHOPPING CENTRE INDUSTRY
2.4.2 Kahn (1988)
Michael Kahn, Emeritus Professor of the University of Natal developed a classifi cation of retail centres specifi cally for the South African situation. This classifi cation was based on the model of Dawson as discussed above. Kahn indicated that most international models were inadequate to address the whole retail structure, and especially within South African circumstances. The additional aspects included in this model, were the following:
• the difference in disposal income amongst different socio-economic groups. The level of spend-ing is determined by the level of income and the socio-economic profi le of the shoppers living in the primary catchment area of the particular centre;
• the type of transport facilities used by the shoppers. The emphasis is on car ownership which is increasing in most of the middle and upper income categories. Taxi transport is also very important and has a direct infl uence on the development of retail facilities; and
• different threshold values for different product categories which have a direct impact on the whole hierarchy of shopping centres.
The Kahn Classifi cation (see Diagram 2.3) clearly distinguishes between high, middle, low and very low income households. This plays a very important role in the positioning of a specifi c shopping centre for the right market.
This classifi cation is most appropriate for South African conditions. It will be updated and adjusted in the Guideline Document of this report and will form the basis for retail classifi cation in South Africa.

31THE NATURE OF THE INTERNATIONAL, NATIONAL AND KWAZULU-NATAL RETAIL AND SHOPPING CENTRE INDUSTRY
DIA
GR
AM
2.3
TRU
NC
ATE
D H
IER
AR
CH
Y
Hie
rarc
hic
al L
ink
By-
Pas
s Li
nk
Cen
tral
Bus
ines
s D
istr
ict
Dis
coun
tS
pec
ialit
y
Reg
iona
l Cen
tres
Co
mm
unity
Cen
tres
Nei
gh
bo
urh
oo
d C
entr
es
Co
nven
ienc
e C
entr
es
Sp
ecia
lity
Focu
ssed
Cen
tre
Focu
ssed
Cen
tre
Art
eria
l Str
ip(C
onv
enie
nce,
Sal
es)
Anc
illia
ry C
entr
e(I
ndus
try,
Offi
ces
)
Anc
illia
ry C
entr
e(H
ote
ls, O
ffi c
es)
Ser
vice
Sta
tion
Co
rner
Clu
ster
HIG
HIN
CO
ME
MID
DLE
INC
OM
ELO
WIN
CO
ME
VE
RY
LO
WIN
CO
ME
NO
N-R
ES
IDE
NTI
AL
SE
RV
ING
Inte
rcep
tory
Str
ip
Sour
ce: K
ahn
(198
8)

32 THE NATURE OF THE INTERNATIONAL, NATIONAL AND KWAZULU-NATAL RETAIL AND SHOPPING CENTRE INDUSTRY
All the above-mentioned classifi cations show specifi c attempts to group the different retail types into mean-ingful and broad categories. The guidelines developed for KZN will rely on some of these broader trends, but will specifi cally focus on the local circumstances and examples.
3. INTERNATIONAL SHOPPING CENTRE EXAMPLES AND TRENDS
Graph 3.1 gives a clear indication of the focus of retail development worldwide. There is a clear distinction between traditional retail (mainly focusing on market areas within cities or central places), street retailing and retail along specifi c major roads and strips. This is typical of what was referred to earlier in Section 2.2.4 (Berry, 1967) as the unplanned retail development.
Traditional retail versus organised and planned retailing differs worldwide. According to Graph 3.1, there is a clear indication of the emphasis on organised retail in westernised countries like the US, UK and Europe, compared to traditional retailing in areas like India, China, Indonesia and Africa.
It is also important to note that the South African situation is at this stage almost 50/50 between traditional and organised/planned retailing. This clearly indicates that the South African retail market is very strongly developed, although a large proportion of traditional retail still exists. This trend is changing with a strong increase in planned/organised retail facilities.
GRAPH 3.1
As far as the different retail developments are concerned, the major trends are highlighted below:
• The United States of America has been the leader as far as shopping centre development is concerned;
• the main focus for many years has been on enclosed malls of which >60 000 centres were completed until 2008;
• recently (last 3-5 years), the emphasis has been on so-called lifestyle centres. These lifestyle centres are located in the more affl uent parts of the cities. The focus is on specifi c types of tenants, and the main difference from the enclosed malls is the ambiance, openness, street atmosphere, layout and design.

33THE NATURE OF THE INTERNATIONAL, NATIONAL AND KWAZULU-NATAL RETAIL AND SHOPPING CENTRE INDUSTRY
• Europe - there is a focus on the construction of traditional malls, especially in the eastern European coun-tries. The focus is mainly on the main capital cities, and will most probably expand to the smaller cities in future. This is almost a catch-up situation where shopping centre development as such has been far behind the rest of the developed world.
• United Kingdom - The focus on large regional malls has reached a saturation level. There is a renewed interest in the redevelopment of town centres. The UK town centres offer a unique atmosphere and are very similar to what the USA is trying to achieve through its new lifestyle centre focus.
• China, India and Asia - currently, substantial growth in this sector of the market is being experienced, mainly because of the under supply in the past. (See Graph 3.1). The focus is on two aspects, traditional malls and shopping centres on multiple levels (up to 9 storeys high).
• Dubai - is one of its own kind. The retail facilities try to cater for a worldwide market, mainly driven by Emirates Airline as the carrier bringing shoppers in daily, from at least 100 cities worldwide.
• Africa - according to Graph 3.1, the retail facilities in the rest of Africa is still very traditional with at least ±90% of the retail in this particular category. In most of the African capital cities like Nairobi, Lusaka, Lu-anda, Lagos and Accra, shopping centres developed are still according to the old model of enclosed malls like in the United States of America/South Africa.
A very large part of the shopping centre development in the rest of Africa is driven by South African retailers expanding into the rest of Africa. This drive was initiated by Shoprite Holdings, and over the past 12 years they have opened 193 corporate stores in 16 countries outside of South Africa. This includes countries like Angola, Botswana, Ghana, India, Lesotho, Madagascar, Malawi, Mauritius, Mozambique, Namibia, Nigeria, Swaziland, Tanzania, Uganda, Zambia and Zimbabwe. 10% of planned shopping facilities in the rest of Africa are closely associated with these types of tenants and other retailers from South Africa. The rest are traditional facilities focusing on local markets/strips and ribbon facilities.
There are currently major plans in the rest of Africa to focus on the construction of the new retail shopping centres. These centres will mainly be built in the more affl uent suburbs fi rst, and will then follow fi lling up the rest of the urban environment with a hierarchy of shopping centres. It is however expected that the traditional CBD areas will remain strong in terms of retail support for many years to come. Most important requirements are:
• developers to develop in partnership with local people;• the establishing of a strong supply chain; and• obtaining the necessary tenants to establish strong viable centres in these areas.
It is also expected that the middle income groups in these areas will increase in size, making shopping centre development more viable in future.
As far as South Africa is concerned, the focus will be on planned/organised mall development, as well as the redevelopment of town centres as is currently happening in the UK. A few lifestyle centres have been developed in South Africa. The success of these centres still needs to be confi rmed, because some are successful and others not.

34 THE NATURE OF THE INTERNATIONAL, NATIONAL AND KWAZULU-NATAL RETAIL AND SHOPPING CENTRE INDUSTRY
4. SOUTH AFRICAN LANDSCAPE INFLUENCING RETAIL DEVELOPMENT
Situational analysis is based on the impact of economic, social and political conditions on the development of property, and specifi cally on retail.
4.1 Macro South African Economic Conditions
The global economic crisis has already impacted the retail environment in South Africa, and it is clear when looking at the following economic indicators. Shopping centre development is a long term investment. Any development over a 20 year period will go through very specifi c economic cycles. It is however very impor-tant to understand the impact of the current situation on shopping centre development. In the evaluation of a shopping centre application, these factors will play a lesser or more important role, especially insofar as the timing of a particular product is concerned.
The following economic indicators are a barometer of the South African economy, and are very important for any kind of development, especially retail development. As mentioned above, retail development is a long term investment and therefore will experience numerous economic cycles. These economic indicators clearly show the trend that the South African economy has followed the past three years (refer to Diagram 4.1). These indicators change on a monthly basis, but the broader trend is more important to guide retail perform-ance and shopping centre development.
4.1.1 Gross Domestic Product
The Gross Domestic Product (GDP) is one of the key indicators of economic growth. The South African economy is in a recession at the moment, with negative growth of 4.8% recorded during Q1 of 2009. These fi gures have already improved to only 3% negative growth for Q2 of 2009. This is the third con-secutive quarter with negative growth. The impact is more on the local economy, which is slowing down with increasing unemployment as a result of layoffs by mining companies, manufacturers and closure of retail stores. The current economic mood (September 2009) is already more positive compared to a year earlier.
GRAPH 4.1
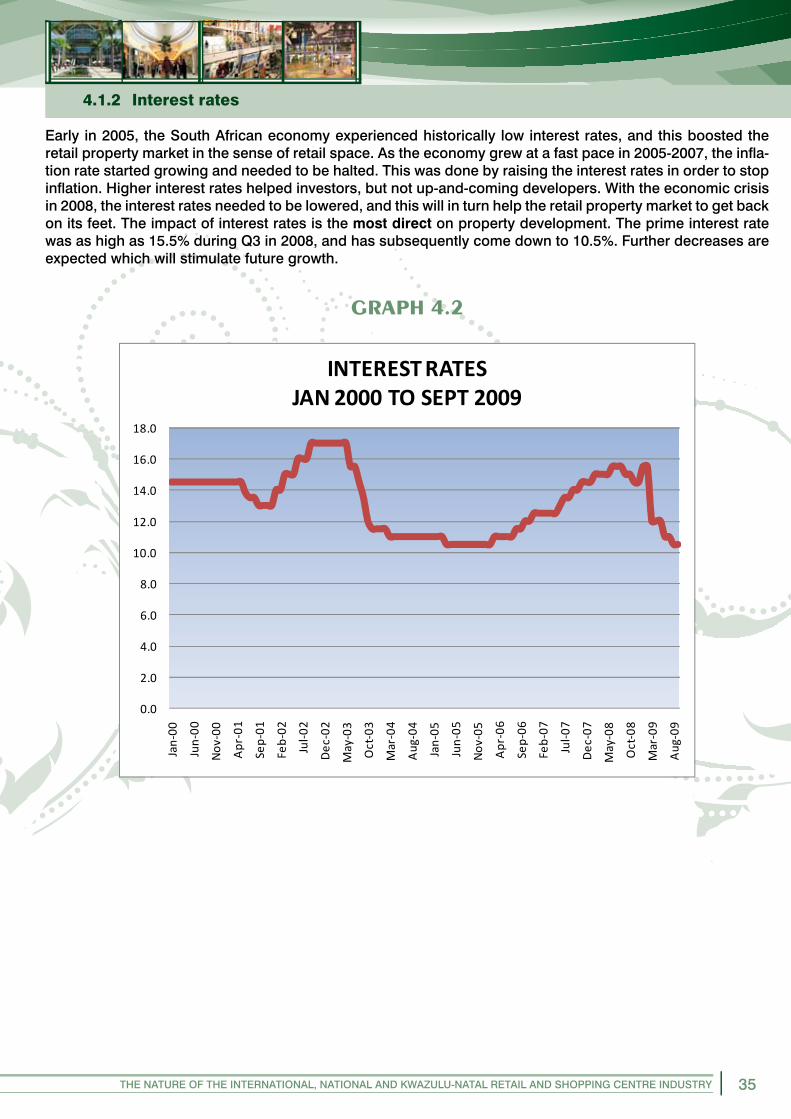
35THE NATURE OF THE INTERNATIONAL, NATIONAL AND KWAZULU-NATAL RETAIL AND SHOPPING CENTRE INDUSTRY
4.1.2 Interest rates
Early in 2005, the South African economy experienced historically low interest rates, and this boosted the retail property market in the sense of retail space. As the economy grew at a fast pace in 2005-2007, the infl a-tion rate started growing and needed to be halted. This was done by raising the interest rates in order to stop infl ation. Higher interest rates helped investors, but not up-and-coming developers. With the economic crisis in 2008, the interest rates needed to be lowered, and this will in turn help the retail property market to get back on its feet. The impact of interest rates is the most direct on property development. The prime interest rate was as high as 15.5% during Q3 in 2008, and has subsequently come down to 10.5%. Further decreases are expected which will stimulate future growth.
GRAPH 4.2

36 THE NATURE OF THE INTERNATIONAL, NATIONAL AND KWAZULU-NATAL RETAIL AND SHOPPING CENTRE INDUSTRY
4.1.3 Infl ation
Infl ation hampered the South African retail market to a large extend in 2008. The rate was at ±13% in 3Q of 2008, therefore retail sales dropped into a recession. Together with the lowering of the fuel price and the economic recovery plan at the end of 2008, the infl ation rate started its downturn towards the 3%-6% infl ation target. The projected infl ation rate for SA will be ± 6% by the end of 2009.
GRAPH 4.3
4.1.4 Rand/Dollar exchange rate
The rand/dollar exchange rate was ±R10.00 to the dollar in 1Q of 2009. The rand lost ±30% of its value in 2008. This has a double effect on retail in South Africa, exporters receive more for their goods and importers need to pay more for their goods. The weakened rand will also result in fuel infl ation, because of the imported goods being more expensive. The dollar has weakened against most other currencies and is currently (September 2009) around R7.50 to the dollar.

37THE NATURE OF THE INTERNATIONAL, NATIONAL AND KWAZULU-NATAL RETAIL AND SHOPPING CENTRE INDUSTRY
4.1.5 Building plans passed and completed
GRAPH 4.4
There is a defi nite downturn on building plans passed, which shows a more negative attitude from developers. Buildings completed also shows that the process has been stabilised with an expected decline over the next year.
The above Graph shows that the overall building industry is slightly down. Yet, with infrastructure expan-sion (up to R880bn over 3 years) and the World Cup Soccer preparations, there is hope for the future growth of this industry.

38 THE NATURE OF THE INTERNATIONAL, NATIONAL AND KWAZULU-NATAL RETAIL AND SHOPPING CENTRE INDUSTRY
4.1.6 Various confi dence indexes
There are various indices released per month/per quarter indicating the current status of the economy. The most important is the SACCI confi dence index indicating the monthly ‘mood’ in the country. This index reached an all time low during 2009. It is slowly recovering, an indication that a turning point has been reached.
GRAPH 4.5
The indices below are short-term benchmarks of the economy and retail prospect performances, and currently refl ect a negative trend. Most of these are at an all time low.
• South African Chamber of Commerce & Industry (SACCI)• RMB/BER Business Confi dence Index• Building Confi dence Index

39THE NATURE OF THE INTERNATIONAL, NATIONAL AND KWAZULU-NATAL RETAIL AND SHOPPING CENTRE INDUSTRY
4.1.7 Retail trade sales
Stats SA provides actual retail sales fi gures on a monthly basis. The limitation in applying this data is that it refl ects the retail sales on a national scale and not on the micro level, i.e. city basis. There is also a time lag of up to 3 months before this data is made available for utilisation. The retail sales reached a low of -6.9% year-on-year in June 2009. This fi gure recovered slightly to -3.9% in July 2009 (latest information available). The decline in retail sales is currently very visible in increased shopping centre vacancies and declining 7trading densities. See Graphs 4.6 and 4.7.
GRAPH 4.6
GRAPH 4.7
7 Trading densities refer to the monthly/annual turnover (in Rand) of a particular store or centre achieved per square meter GLA. This is a standard measurement used by the industry to draw comparisons between same type centres countrywide. This is also the most important performance ratio used to compare certain stores.
40 THE NATURE OF THE INTERNATIONAL, NATIONAL AND KWAZULU-NATAL RETAIL AND SHOPPING CENTRE INDUSTRY
4.1.8 Global infl uence
Global issues impact on the local economy and, by implication, on local sales. With the global econom-ic crisis still continuing, South Africa’s export market is under extreme pressure. It is also important to note that South Africa experienced less direct impact, especially on the banking system, compared to other developed countries.
4.1.9 Property Economic Indicators: (2006-2009)
Diagram 4.1 gives an indication of the changes in economic indicators since 2006. The colour of the arrows indicates (green = positive, orange = sideways and red = negative movement) that 2006 was a very positive year for property development.
During 2008, most indicators turned negative. The latest information for 2009 indicates that interest rates and infl ation are coming down, which will have a positive infl uence on retail sales probably within the next 8 to 12 months.
It is expected that the recovery in the South African market will only happen in the second half of 2010. The decrease in interest rates is the most important driver of recovery. Uncertainty regarding world eco-nomic conditions prevails for the time being. Most retail development will fl uctuate with these economic indicators.

41THE NATURE OF THE INTERNATIONAL, NATIONAL AND KWAZULU-NATAL RETAIL AND SHOPPING CENTRE INDUSTRY
DIAGRAM 4.1ECONOMIC INDICATORS INFLUENCING PROPERTY DEVELOPMENT
(2009-09-23)
Attributes Trend 2006
Trend2007
Trend2008
Latest2009(Q2) Comments
GDP growth The overall growth in 2008 was 3.1%. -6.4% in 2009(Q1) and -3% in 2009(Q2) -annualised Q/Q fi gures.This is the 3rd quarter with negative growth. Forecast for 2009, -2% (for the year).
Infl ation CPI The CPI was 6.9% in June 09 and 6.7% in July 09. Infl ation expectation for end of 2009 is 5.6%. The PPI for July 09 defl ated by 3.8%.
Rand/Dollar Currently around ±R7.50 to the dollar.A strong rand could hurt exports, but would make imports cheaper and benefi t domestic infl ation.
Building plans passed The fi gures shown below, are the % change betweenJan-June 08 and Jan-June 09:Residential (-45.3%), Non-residential (-10.2%), Addition and Alteration (-10.5%). In total, plans passed are down by 28%.
Building plans completed The fi gures shown below are the % change between Jan-June 08 and Jan-June 09: Residential (-20.8%), Non-residential (13.9%), Addition & Alteration (16.9%). In total, plans completed are down by 5.2%.
Domestic Cement Sales Down 11.5% y/y in August 09 (monthly average sales per day)
Car sales Figures for y/y August 09/08: New car: -26.2%Light Commercial: -21.9%Medium and heavy trucks: -46.2%.Car Exports: - 66.7%
House prices July 09, defl ation of 9.7% y/y change (Real Values) and defl ation of 10.1% for Jan-July 2009.
Formal employees Unemployment in 2009(Q2) was 23.6% up from 23.5% in the previous quarter. Formal employees are down 2.1%, for the 3 months from December to March 09, from 8.5m to 8.3m employees.
Retail sales(Real Value)
Latest: July 09 y/y - 3.9%June 09 y/y 6.9% & May 09 y/y -4.4%. Consumer confi dence is still very low, and consumers are looking to save what they can.
SACCI Business Confi dence Index
Currently (August 09) 83 points, this shows a 0.2 points decrease from July 2009.
RMB/BER BusinessConfi dence Index
June 09 = 26 (this confi dence index varies between 0 and 100, therefore 50 is neutral) 26, is the lowest RMB-BCI since Sept 1999.
Interest Rates Repo 7% and Prime 10.5%The effect of 5% interest rate cut since December 08 has not completely turned into positive confi dence, expectations and consumption.
Manufacturing -17.2% y/y May 09 and -17.1% y/y June 09, this shows the tough circumstances of the manufacturing sector currently.Purchasing Manager Index: Decreased from 37.9% to 37.3% from June to July.
FNB Building Confi dence Index
The index is at 29 points 2009(Q2), 1 point increase since 1Q09. This is still very low when compared to 40 points in 4Q08.
Oil prices Currently, ±76$/barrel. Higher prices could hamper infl ation prospects, especially if the rand weakens. Oil price forecast is ±85$/barrel for later in 2009. In the light of economic recovery later in 2009, demand prospects will force the oil price to above 70$/barrel.

42 THE NATURE OF THE INTERNATIONAL, NATIONAL AND KWAZULU-NATAL RETAIL AND SHOPPING CENTRE INDUSTRY
KEY TO ECONOMIC INDICATORS
Green: Positive for property and retail development
Orange: Sideways movement
Red: Negative for property and retail development
The most important aspects that need to be considered when looking at retail development are the in-terest rates, infl ation and the most important is the long term GDP growth. These indicators will play a major part in when, how big and where to develop either new retail facilities or renewal centres.
4.2 Political Conditions
The political conditions in South Africa will always play an important role, and will be evaluated by world players on a regular basis. The stability in government is a pre-requisite for economic growth.
4.3 Social Conditions
The most important social change in South Africa impacting on retail development is the growth of the mid-dle-income market. This has a direct impact on the availability of disposable income and the demand for retail facilities. This will be discussed in detail later in the report (See Section 5.3).
The economic, political and social environment will always have a direct or indirect impact on retail develop-ment. Town planners will also have to be aware of these aspects and how they will impact on future retail performance and retail development.

43THE NATURE OF THE INTERNATIONAL, NATIONAL AND KWAZULU-NATAL RETAIL AND SHOPPING CENTRE INDUSTRY
5. CHANGES IN DEMOGRAPHICS AND SHOPPING BEHAVIOUR
The changes in demographics and shopping behaviour will have a major impact on the demand, as well as the supply of retail facilities. It is therefore of utmost importance to get a broad overview of specifi c trends that might impact on shopping centres and retail in future. It is important at any point in time to get a clear un-derstanding of specifi c trends that may infl uence shopping centre development. These changes will continue to take place as demographics change and new ideas are formulated to continuously increase retail sales.
Shopping patterns and behaviour are continuously changing. This requires adaptation on the part of the metropolitan and rural municipalities to keep abreast of these changes and to respond in an appropriate man-ner when evaluating new retail development initiatives. The rural market forms a big part of the retail market in KZN, and the people from these areas are becoming bigger spenders. The rural market buying power is a growth opportunity for the KZN retail market and needs to well understood.
5.1 Population Growth
Population growth is a key driver of retail growth. The estimated annual population growth rate for South Afri-ca during 2001-2008 was 1.6%. South Africa’s population growth in future will largely depend on the increase in HIV/AIDS cases, and the general consensus is that growth is expected to slow down as a result of that.
The current population estimate is 49.5 million, growing at an estimated 0.82%, which is much lower than the growth rate of 1.45%, 7 years ago. The World Bank predicts that in 2015 -2020 the total South African popula-tion will be 44.3 million, indicating a negative growth as a result of AIDS. Depending on the target market and style of a particular shopping centre, the effect of AIDS could possibly have a more signifi cant impact on one type of centre, rather than on the retail industry as a whole.
5.2 Effect of Urbanisation
The provinces of Gauteng and the Western Cape are the only two provinces with a nett increase in migra-tion fi gures compared to the decrease (or outfl ow) experienced by the seven other provinces. South Africa is almost 60% urbanised, and a large infl ow to the urban areas is experienced. This migration is mainly by individuals forming part of the LSM Segments 1 to 5 and is putting pressure on the supply of housing facili-ties, job creation and infrastructure.
The contribution towards and the demand for retail facilities by the rapidly growing urban population (mainly LSM 1-5) will be limited to basic commodities like food, clothing and furniture. This will, in turn, stimulate the demand for more township centres, CBD retail and small spaza shops. All this will create opportunities for retail development, but the target markets need to be clearly identifi ed and specifi ed.
The estimated number of foreigners in South Africa ranges between 2.5-5 million people. Most of these resi-dents live in Gauteng and other large metropolitan areas. The uncertainty regarding specifi c numbers and the location of these foreigners makes it diffi cult to calculate their real impact on retail facilities.

44 THE NATURE OF THE INTERNATIONAL, NATIONAL AND KWAZULU-NATAL RETAIL AND SHOPPING CENTRE INDUSTRY
5.3 Socio-Economic Change
5.3.1 Living Standard Measurement (LSM)8
LSM is a segmentation framework for living standards in South Africa developed by SAARF9.
Living Standard Measurement is a South African classifi cation/segmentation model used countrywide by marketers, property developers and retailers and market research companies. LSM is a scale used for indicating the socio-economic status of an individual or a household. The LSM categories are de-rived from ±30 000 household interviews conducted annually. LSM is a classifi cation method based on 29 different variables (See Table 5.1).
TABLE 5.1VARIABLES USED AS PART OF THE LSM CLASSIFICATION MODEL
1. Hot running water 2. Fridge/freezer (combination)
3. Microwave oven 4. Flush toilet in/outside house
5. No domestic worker in household 6. VCR/DVD player
7. Vacuum cleaner/fl oor polisher 8. Number of cell phones in household
9. Traditional hut 10. Washing machine
11. Personal computer 12. Electric stove
13. TV set 14. Tumble dryer
15. Home telephone 16. 0 or 1 radio set in household
17. Hi-fi /music centre 18. Rural rest (excl. W. Cape/Gauteng rural)
19. Built-in kitchen sink 20. Home security service
21. Deep freezer 22. Water
23. M-Net/ DSTV subscription 24. Dishwasher
25. Electricity 26. Sewing machine
27. Located in Gauteng 28. Western Cape
29. Motor vehicle
After the variables had been used to measure the household, the households were then placed in groups. The groups range from LSM 1 to LSM 10, from deep rural to an affl uent standard of living. The easiest way to distinguish between the groups is by way of household incomes. (See Table 5.2)
8 LSM = Living Standard Measurement9 SAARF = South African Advertising Research Foundation

45THE NATURE OF THE INTERNATIONAL, NATIONAL AND KWAZULU-NATAL RETAIL AND SHOPPING CENTRE INDUSTRY
TABLE 5.2MONTHLY AVERAGE HOUSEHOLD INCOME PER LSM CATEGORY
LSM Group Income
Group 1 R1 080
Group 2 R1 401
Group 3 R1 795
Group 4 R2 536
Group 5 R3 122
Group 6 R5 386
Group 7 R8 677
Group 8 R12 337
Group 9 R16 296
Group 10 R23 054
Source: SAAERF AMPS 2008A
The LSM10 classifi cation was created in the late 1980’s. Throughout the years, a drastic shift has taken place. This was in the form of more/many people moving up from the lower end groups (LSM 1 and 2) to the middle groups (LSM 4-6). The shift was mostly caused by urbanisation, ending of apartheid, BEE, constant economic growth and the rise of wealthier townships. (See Table 5.3 and Graph 5.1)
TABLE 5.3CHANGE IN LSM PROFILES (2006-2008)
Proportion of each group of total number of households
LSM group 2006 2008 Growth 06-08
LSM 1 7.6 3.4 -55.3 These fi gures indicate the decreases in the lower end of the market
LSM 2 12.2 8.7 -28.7
LSM 3 13 9.4 -27.7
LSM 4 14.9 14.6 -2.0
LSM 5 13.5 15.5 14.8 These fi gures clearly indicate the increases in the middle sector of the market
LSM 6 14.5 17.9 23.5
LSM 7 7.1 9.4 32.4
LSM 8 5.2 6.9 32.7
LSM 9 6.4 8.1 26.6 Also strong increases in upper end of the market
LSM 10 5.5 6.1 10.9
10 LSM = Living Standard Measurement – a South African classifi cation used countrywide by marketers, property developers and analysts. The income per LSM category refl ects the monthly household income. The LSM categories are derived from the census information, updated annu-ally.
(LSM 1 = deep rural, LSM 10 = affl uent) LSM 1 – 4 = <R800 – R3 000 LSM 5 – 7 = R3 001 – R12 500 LSM 8 – 9 = R12 501 – R25 000 LSM 10 = R25 001 – R40 000 LSM 10+ = R40 000 plus

46 THE NATURE OF THE INTERNATIONAL, NATIONAL AND KWAZULU-NATAL RETAIL AND SHOPPING CENTRE INDUSTRY
GRAPH 5.1
It is clear from the graphs above that more people in South Africa are fi nding themselves in the middle LSM group (LSM 4-6), as well as in the upper LSM categories compared to the situation in 2001. This shows the growing potential for the retail industry in the future. Retail sales are down, but the economic cycle follows its path and will eventually be more positive.
This clearly indicates the growth in the middle and upper sectors of the market. This already has a strong positive impact on retail expenditure and shopping centre development.
5.4 Emerging Black Market and Changing Consumer Base
According to recent research, the upper end of the market, LSM segment 10, has shown rapid growth (23,4% p.a. between 2006-2008), whilst the lower end of the market, LSM segments 1 to 4 (<R3 000 per month) had a negative growth of 22,3% per annum for 2006-2008. Between 2006 and 2008 the middle market consumers (LSM 5-8) earning between R3 000 and R12 500 per month, have grown at 25,8% per annum. The total LSM 5 to 10 segments have increased to 63.9% of the total market in 2008.
The following graph shows the percentage share of each population group and its contribution to total house-hold expenditure over a 15 year period.

47THE NATURE OF THE INTERNATIONAL, NATIONAL AND KWAZULU-NATAL RETAIL AND SHOPPING CENTRE INDUSTRY
GRAPH 5.2
Source: Bureau of Market Research, Unisa, 2008.
The household expenditure for whites has dropped from 53% of the total expenditure in 1993 to 43% in 2008, while expenditure by Africans has grown from 35% of the total in 1993 to 44% in 2008. This will also have a major impact on retail sales and future retail development.
5.2 Township Areas, CBDs and Rural Shopping Centres
Growth in shopping centre development in the traditionally black urban areas is expected to accelerate in fu-ture. It is expected that the growth in shopping centres in townships and rural areas will further be stimulated once the right tenant mix and centre size have been determined. There is also a strong commitment from the national grocery retailers, as well as national clothing retailers to be better represented in these areas.
5.5.1 Retail in CBDs
Retail in the CBDs as indicated earlier continues to perform well, as the CBDs remain the main des-tination for a large number of workers and dedicated shoppers. The success of retail in the CBDs is mainly the result of the support of large numbers of shoppers from the widest possible catchment area serviced by trains and taxis. The LSM profi le of most CBD areas has been established to cater for LSM segments 4 to 7.
Most CBDs of the smaller cities and towns are very vibrant and busy. It is expected that these areas will remain very busy in spite of centres that opened close to where large proportions of the residents live.
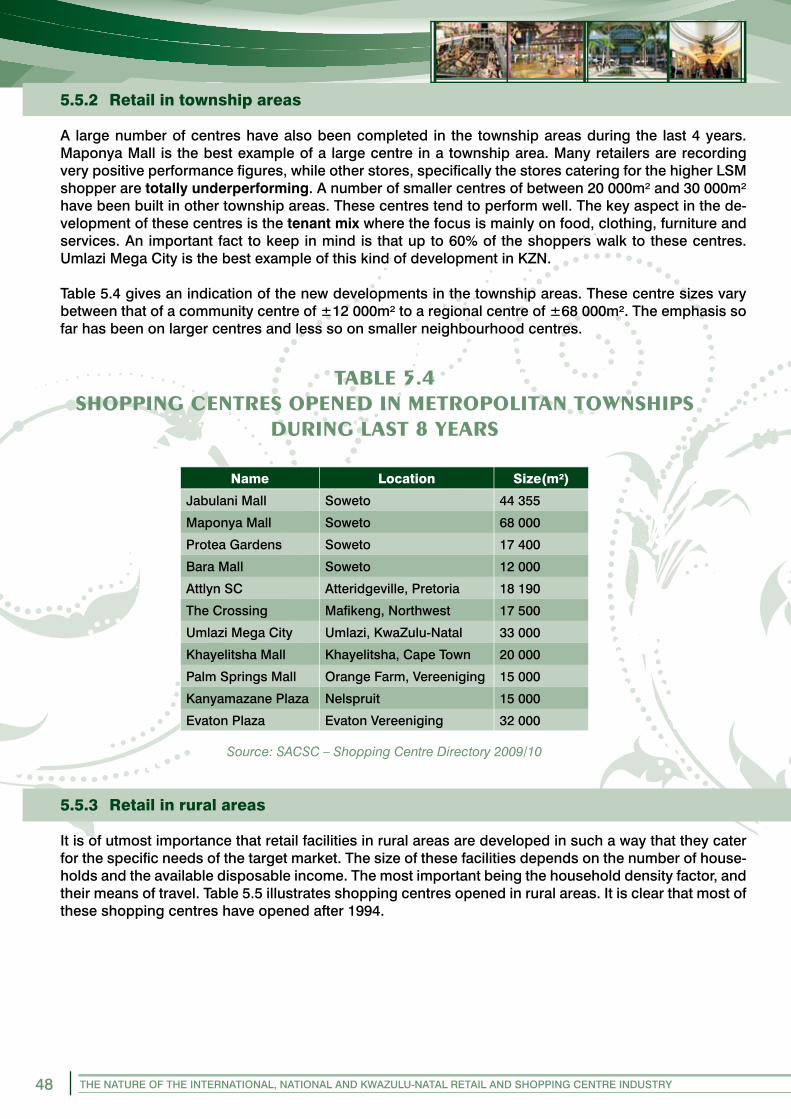
48 THE NATURE OF THE INTERNATIONAL, NATIONAL AND KWAZULU-NATAL RETAIL AND SHOPPING CENTRE INDUSTRY
5.5.2 Retail in township areas
A large number of centres have also been completed in the township areas during the last 4 years. Maponya Mall is the best example of a large centre in a township area. Many retailers are recording very positive performance fi gures, while other stores, specifi cally the stores catering for the higher LSM shopper are totally underperforming. A number of smaller centres of between 20 000m² and 30 000m² have been built in other township areas. These centres tend to perform well. The key aspect in the de-velopment of these centres is the tenant mix where the focus is mainly on food, clothing, furniture and services. An important fact to keep in mind is that up to 60% of the shoppers walk to these centres. Umlazi Mega City is the best example of this kind of development in KZN.
Table 5.4 gives an indication of the new developments in the township areas. These centre sizes vary between that of a community centre of ±12 000m² to a regional centre of ±68 000m². The emphasis so far has been on larger centres and less so on smaller neighbourhood centres.
TABLE 5.4SHOPPING CENTRES OPENED IN METROPOLITAN TOWNSHIPS
DURING LAST 8 YEARS
Name Location Size(m²)
Jabulani Mall Soweto 44 355
Maponya Mall Soweto 68 000
Protea Gardens Soweto 17 400
Bara Mall Soweto 12 000
Attlyn SC Atteridgeville, Pretoria 18 190
The Crossing Mafi keng, Northwest 17 500
Umlazi Mega City Umlazi, KwaZulu-Natal 33 000
Khayelitsha Mall Khayelitsha, Cape Town 20 000
Palm Springs Mall Orange Farm, Vereeniging 15 000
Kanyamazane Plaza Nelspruit 15 000
Evaton Plaza Evaton Vereeniging 32 000
Source: SACSC – Shopping Centre Directory 2009/10
5.5.3 Retail in rural areas
It is of utmost importance that retail facilities in rural areas are developed in such a way that they cater for the specifi c needs of the target market. The size of these facilities depends on the number of house-holds and the available disposable income. The most important being the household density factor, and their means of travel. Table 5.5 illustrates shopping centres opened in rural areas. It is clear that most of these shopping centres have opened after 1994.

49THE NATURE OF THE INTERNATIONAL, NATIONAL AND KWAZULU-NATAL RETAIL AND SHOPPING CENTRE INDUSTRY
TABLE 5.5SHOPPING CENRTES OPENED IN RURAL AREAS SINCE 1991
(RANKED ACCORDING TO SIZE)
Shopping Centre GLA City Suburb Province Development date
Mdantsane Centre 35849 East London Mdantsane Eastern Cape 2008
Setsing Shopping Centre 26154 Phuthaditjhaba Phuthaditjhaba Free State 2000
Big Tree Mall 25500 Moloto Moloto Mpumalanga 2006
Twin City - Bushbuck Ridge 22306 Bushbuck Ridge Bushbuck Ridge Limpopo 2000
Kopanong Centre - Hammanskraal 19443 Hammanskraal Hammanskraal Gauteng 1995
Mvusuludzo Shopping Centre 19292 Thohoyandou Thohoyandou Limpopo 1998
Nkomazi Plaza 19046 Kamaqhekeza Kamaghekeza Mpumalanga 2008
Palm Springs Mall 18864 Orange Farm Orange Farm Vaal Triangle 2005
Temba City Shopping Centre 18313 Temba Temba North West 1991
Tembisa Plaza 18248 Tembisa Tembisa Gauteng 2004
Thabong Centre - Sebokeng 18071 Sebokeng Sebokeng Gauteng 2007
Metropolitan Centre - Emalahleni 18000 Emalahleni Emalahleni Mpumalanga
Orange Farm 18000 Orange Farm Orange Farm Vaal Triangle 2006
Phumulani Mall 17500 Tembisa Tembisa Gauteng 2008
Renbro Shopping Centre 16500 Hammanskraal Pretoria Gauteng 0
Masingita Plaza 16258 Giyani Giyani Limpopo
Circus Triangle 16153 Mthatha Mthatha Eastern Cape 1994
Maake Plaza 15856 Lenyenye Lenyenye Limpopo 2008
Re-a-Hola Shopping Centre 14745 Botshabelo Botshabelo Free State 1999
Acornhoek Plaza 14680 Acornhoek Acornhoek Mpumalanga 1993
Bushbuck Ridge Shopping Centre 14640 Bushbuck Ridge Bushbuck Ridge Mpumalanga 1994
Kamaqhekeza Plaza 14480 Kamaqhekeza Kamaqhekeza Mpumalanga 1999
Source: SACSC – Shopping Centre Directory 2009/10
Changes in shopping behaviour will defi nitely have an impact on shopping centre performance and shop-ping centre development. The direct impact on shopping centre development will be the result of increas-ing household numbers and increasing disposable income.
5.6 Changing Lifestyles
Lifestyle changes have a very important impact on retail sales and shopping behaviour. New retail formats have been developed to cater for the changing needs of consumers. Lifestyle centres11 are also being de-veloped, offering the shopper a different tenant mix and shopping experience. Lifestyle centres in the USA mainly offer an attractive complex with a relaxed atmosphere and a variety of facilities/activities as part of the whole development. This can include offi ces, residential units, hotels, theatres, conference facilities and retail.
The impact of lifestyle changes on shopping centre development will be on the type of tenants and the layout and design of a new centre.
11 Specifi c defi nitions of various types of retail facilities will be discussed in detail.
50 THE NATURE OF THE INTERNATIONAL, NATIONAL AND KWAZULU-NATAL RETAIL AND SHOPPING CENTRE INDUSTRY
5.7 The Need for a Shopping Experience
Consumers today are in search of a shopping experience. Shopping is not only about consumption, but also about an experience. It would traditionally be the larger centres that can potentially fulfi l the shopping experience expectations of consumers. To meet such expectations and be sustainable in the longer term, shopping centres have to offer good quality public space, offer ease of movement and places where people can meet, relax or be entertained such as coffee shops, restaurants and theatres. These facilities must make use of both indoor and outdoor spaces. The increasing demand for a shopping experience is one of the major reasons for the growth in the number of lifestyle centres. Interactive shopping is a new keyword associated with lifestyle centres. Interactive shops include golf shops where shoppers can experiment with golf clubs, coffee shops combined with bookshops, and shops where shoppers build their own toys, etc.
The impact of this trend on shopping centre development is continuously changing to renew the retail of-fering. This could also result in an expansion of existing centres and the planning of new centres.
5.8 The Youth Market
The youth of today have considerable spending power and exert a major infl uence on spending patterns by their parents. The importance of brands and branding should not be underestimated in retailing, particularly within this segment of the market. This segment of the market is also called the ‘one universal market’, be-cause trends are set and are followed worldwide.
5.9 Trends towards Extended Shopping Hours
There is a defi nite trend towards the implementation of longer shopping hours. Longer shopping hours have been the norm in convenience stores for some time, but there are indications of this trend being implemented in the larger and regional shopping centres as well. It is however not always easy to implement, and will de-pend on the local conditions of each centre.
5.10 Growth in Homeware Stores and other New Retail Tenant Types
The homeware sector of the retail market has shown strong growth over the last eight to ten years. This resulted in the opening of more homeware stores, including Mr Price Home, @ Home, Ackermans Home, Home Etc., and the expansion of Boardmans, Wetherleys, Weylands, Woolworths, Homeware Department, and others.
The drivers behind the growth in the homeware product sector are the following:
• the growing affl uence of the South African population, more specifi cally the upper end of the black mar-ket;
• increasing home ownership;• mass housing and electrifi cation;• the international trend towards a shorter lifespan of homeware products resulting in more rapid replace-
ments.
Due to the success of the existing homeware stores, most of the retailers in this sector also moved into dif-ferent retail formats, ranging from strip/value centres, small and large centres, as well as free-standing big box retail outlets.
Many of these stores are struggling at the moment because of economic conditions, but also because of can-nibalisation12 where existing stores ‘steal’ market share from each other.
12 The term retail cannibalisation is used when the same store opens outlets too close to one another. A second type of cannibalisa-tion is when shopping centres open in the same area offering the same tenant mix with very little differentiation between the two centres.

51THE NATURE OF THE INTERNATIONAL, NATIONAL AND KWAZULU-NATAL RETAIL AND SHOPPING CENTRE INDUSTRY
Other new types of retail facilities include different restaurants and coffee shops. There is also a new ap-proach from cell phone companies to install very large attractive service centres in shopping centres. There will always be new types of tenants entering the market. The demand for shopping centre space will therefore change and increase over time.
There are also retailers that are becoming less attractive and will eventually close down. All this has an im-pact on the saturation levels in particular centres.
5.11 E-Commerce
In general, retailers are far less concerned at present about the impact of e-commerce than during 1999. Currently, worldwide e-tailing is responsible for ±0.5% of total retail sales. More and more centres use the Internet to promote the centre, rather than to drive sales. Most shopping centres use websites as one of their marketing tools.
The impact of e-commerce on bricks and mortar in South Africa will be a longer term situation with no specifi c impact.
5.12 Renewal of Centres
Many of the fi rst generation shopping centres in South Africa (built in the sixties and seventies) are becoming very outdated, rundown and are in desperate need of total revamps and re-tenanting.
This trend is also very applicable in KZN with centres like Musgrave, Overport, The Wheel, Chatsworth Centre, Sanlam Centre Empangeni that are already old and in need of an upgrade.
Many malls have also increased in size during the last 2 years, indicating that once a mall is well established, it acts as catalyst for further retail growth, as well as for other commercial facilities. A number of the malls in the smaller cities have expanded to cater for new tenant categories and to offer a better service to their cus-tomers. Very good examples of these are: Waterfall Mall in Rustenburg, Riverside Mall in Nelspruit, Boardwalk in Richards Bay and Midlands Mall in Pietermaritzburg, to mention a few.
5.13 Cannibalisation
Cannibalisation typically occurs when there is an oversupply of retail facilities in a certain area. The market share of each facility will then automatically be reduced and the outdated facilities will further deteriorate. Cannibalisation is one of the serious threats that retailers face in South Africa these days, with the opening of a number of new shopping centres that are in direct competition with other centres as far as the duplication of the same stores are concerned.
A number of new regional centres are being planned within 3-4 kilometres from existing regional centres. This could become a real threat and retailers and developers must clearly understand the impact of canni-balisation. Cannibalisation is also one of the most important research topics in the United States at the mo-ment.
These changes have direct and indirect impact on shopping centre development. The key is however population growth, the tempo of urbanisation and increase in disposable income. The rest of the indica-tors impact more on the tenanting and size of centres.

52 THE NATURE OF THE INTERNATIONAL, NATIONAL AND KWAZULU-NATAL RETAIL AND SHOPPING CENTRE INDUSTRY
6. SOUTH AFRICAN RETAIL AND SHOPPING CENTRE INDUSTRY
6.1 Retail Supply in South Africa
The section is included to give an overview of the total shopping centre industry in South Africa. The KZN situation will be compared to this to indicate where KZN fi ts into the bigger picture.
During the last four years, South Africa and the world have experienced amongst the highest growth rates in recent decades. China had continuously been growing at a rate above 10%. The growth in other eastern countries also showed the same tempo of growth. The rest of the western world maintained its high growth. Many African states were achieving growth of more than 5% per annum. South Africa experienced positive growth in 42 quarters, with some above 5%. All this started changing with the crash of world economic mar-kets in September 2008.
The retail sector has experienced very high growth in the supply of new shopping centres since 2000. The current retail space under construction will further increase retail space by another 1 million m² by 2010 (See graph 6.1). The total shopping centre fl oor area space is currently at ±16,8 million m², which will increase to 17,8 million m² by 2010/11. In 1993 there were only 137 shopping centres larger than 10 000m² compared to more than 500 in 2008.
GRAPH 6.1
Graph 6.2 gives an indication of the annual increase in shopping centre space since 1990. The macro eco-nomic impact at a particular point in time is clearly visible on the graph for the period 1999-2002. The same is expected for 2009/11. There is however always a ‘time lag’ between economic conditions and retail supply. Current high growth rates for 2009/10 are mainly because of high GDP growth during 2006/7.

53THE NATURE OF THE INTERNATIONAL, NATIONAL AND KWAZULU-NATAL RETAIL AND SHOPPING CENTRE INDUSTRY
GRAPH 6.2
The annual retail sales at current prices exceeded R500bn in 2008. The size of the market is substantial. High increases in 2008 are mainly the result of high infl ation during that year. This high growth in the retail market since 2004 is also a refl ection of high growth in shopping centre development during the same period. There is however, a lag time between developments currently coming onto the market, and the economic downturn since September 2008.
GRAPH 6.3
All this clearly indicated that accelerated growth in the supply of retail shopping centre space, occurred during the last 5 to 8 years.
The above mentioned has an infl uence on shopping centre supply and demand in KZN. A detailed analy-sis of the retail in this province will follow in the next section, which will form the basis of the fi nal guide-line plan.
54 THE NATURE OF THE INTERNATIONAL, NATIONAL AND KWAZULU-NATAL RETAIL AND SHOPPING CENTRE INDUSTRY
7. RETAIL DEMAND AND SUPPLY IN KWAZULU NATAL
7.1 Main Characteristics of KwaZulu Natal Market
KZN currently represents the second highest population numbers in the whole of South Africa. The popula-tion (mid 2008) is estimated at 10.1 million people. This refl ects an annual growth rate of <1%. Growth rates have decreased for all provinces, mainly because of better education and higher occurrence of HIV/Aids.
The KZN province is also strongly divided between large proportions of rural dwellers compared to urban residents. The national ratio is 60% urbanised while this fi gure is estimated at 53% for Kwazulu-Natal.
The provincial estimates show that since 2006, Gauteng has had the largest share of the population namely 21.5%, followed by KZN with 20.8%.
KZN also plays a very important role with their contribution to the national economy. Currently, the province contributes 16.25% to the total GDP of South Africa. This represents >R324 billion.
As far as formal shopping centre retail space is concerned, the province represents almost 13% of the total shopping centre space in South Africa.
All this clearly indicates that KZN fulfi ls a very important role within the South African economy.
7.2 Economic Base of KZN in comparison to the RSA Economy
In this section, the most important economic indicators for the country will be compared to those currently present in KZN. This information clearly indicates where the province fi ts into the larger South African market, and how the province compares to other provinces in terms of economic indicators.
7.2.1 Gross Domestic Product per region for 2007
Preliminary estimates indicated that Gauteng and Western Cape both with 5.7% annual growth had the high-est real annual economic growth rate per region as measured by the gross domestic product per region at market prices for 2007 compared to 2006. Kwazulu-Natal was third with (5.2%), and Eastern Cape fourth with (4.6%).

55THE NATURE OF THE INTERNATIONAL, NATIONAL AND KWAZULU-NATAL RETAIL AND SHOPPING CENTRE INDUSTRY
GRAPH 7.1
Source: Stats SA, 2007
In 2007, Gauteng contributed 33.5% to the economy of South Africa, followed by Kwazulu-Natal with 16.2% and the Western Cape with 14.5%. This clearly indicates the strength of Kwazulu-Natal within the national text.
GRAPH 7.2
Source: Stats SA, 2007
KZN recorded economic growth of 5.2% during 2007. This followed a growth rate of 5.3% in 2006. The latest fi gures for 2008 have still not been released, it is however expected that the GDP growth in Kwazulu-Natal would have decreased to ±2.4% during 2008, and is currently under pressure for a further decrease.

56 THE NATURE OF THE INTERNATIONAL, NATIONAL AND KWAZULU-NATAL RETAIL AND SHOPPING CENTRE INDUSTRY
In 2007 the contribution of the different KZN industries to the economy was:• manufacturing industries (21%);• fi nance and real estate and business services (17%) and• wholesale and retail trade (12%).
GRAPH 7.3
The retail and wholesale market have been growing at a rate of between 5.6% and 7.2% during the period 1999 to 2007, with the exception of 2002 when the rate was lower at 2.4%. The growth in retail and wholesale sales has been much higher in all cases than the total GDP for Kwazulu-Natal per annum since 1996. (See graph above)
GRAPH 7.4

57THE NATURE OF THE INTERNATIONAL, NATIONAL AND KWAZULU-NATAL RETAIL AND SHOPPING CENTRE INDUSTRY
7.3 Retail demand in KZN: Demand drivers
Retail demand is a function of the number of households, socio-economic and demographic variables, and the disposable income for each household. All these variables will be analysed in terms of the Greater KZN Province to quantify each of the demand drivers.
7.3.1 Population Numbers, Growth and Projections
According to the latest offi cial release from Statistics SA (July 2008), the midyear estimate of the total South African population was 48.7 million people.
TABLE 7.1MID-YEAR ESTIMATES FOR SOUTH AFRICA
POPULATION GROUP - 2008
Population groupTotal
Number % of total population
African 38 565 100 79.2
Coloured 4 379 200 9.0
Indian/Asian 1 243 500 2.6
White 4 499 200 9.2
Total 48 687 000 100.0
Source..Stats SA Census 2001 projected for 2009/2012
According to this latest population estimates, KZN has a total population of 10.11 million people.
GRAPH 7.5
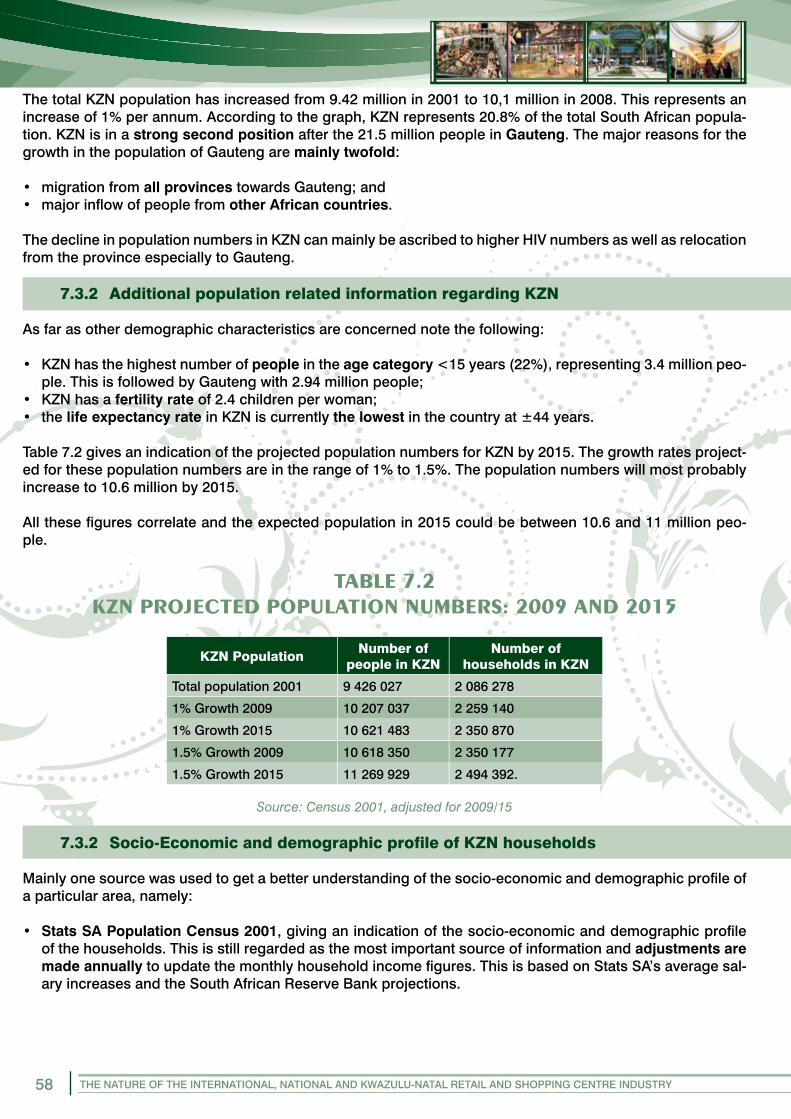
58 THE NATURE OF THE INTERNATIONAL, NATIONAL AND KWAZULU-NATAL RETAIL AND SHOPPING CENTRE INDUSTRY
The total KZN population has increased from 9.42 million in 2001 to 10,1 million in 2008. This represents an increase of 1% per annum. According to the graph, KZN represents 20.8% of the total South African popula-tion. KZN is in a strong second position after the 21.5 million people in Gauteng. The major reasons for the growth in the population of Gauteng are mainly twofold:
• migration from all provinces towards Gauteng; and• major infl ow of people from other African countries.
The decline in population numbers in KZN can mainly be ascribed to higher HIV numbers as well as relocation from the province especially to Gauteng.
7.3.2 Additional population related information regarding KZN
As far as other demographic characteristics are concerned note the following:
• KZN has the highest number of people in the age category <15 years (22%), representing 3.4 million peo-ple. This is followed by Gauteng with 2.94 million people;
• KZN has a fertility rate of 2.4 children per woman;• the life expectancy rate in KZN is currently the lowest in the country at ±44 years.
Table 7.2 gives an indication of the projected population numbers for KZN by 2015. The growth rates project-ed for these population numbers are in the range of 1% to 1.5%. The population numbers will most probably increase to 10.6 million by 2015.
All these fi gures correlate and the expected population in 2015 could be between 10.6 and 11 million peo-ple.
TABLE 7.2KZN PROJECTED POPULATION NUMBERS: 2009 AND 2015
KZN Population Number of people in KZN
Number of households in KZN
Total population 2001 9 426 027 2 086 278
1% Growth 2009 10 207 037 2 259 140
1% Growth 2015 10 621 483 2 350 870
1.5% Growth 2009 10 618 350 2 350 177
1.5% Growth 2015 11 269 929 2 494 392.
Source: Census 2001, adjusted for 2009/15
7.3.2 Socio-Economic and demographic profi le of KZN households
Mainly one source was used to get a better understanding of the socio-economic and demographic profi le of a particular area, namely:
• Stats SA Population Census 2001, giving an indication of the socio-economic and demographic profi le of the households. This is still regarded as the most important source of information and adjustments are made annually to update the monthly household income fi gures. This is based on Stats SA’s average sal-ary increases and the South African Reserve Bank projections.
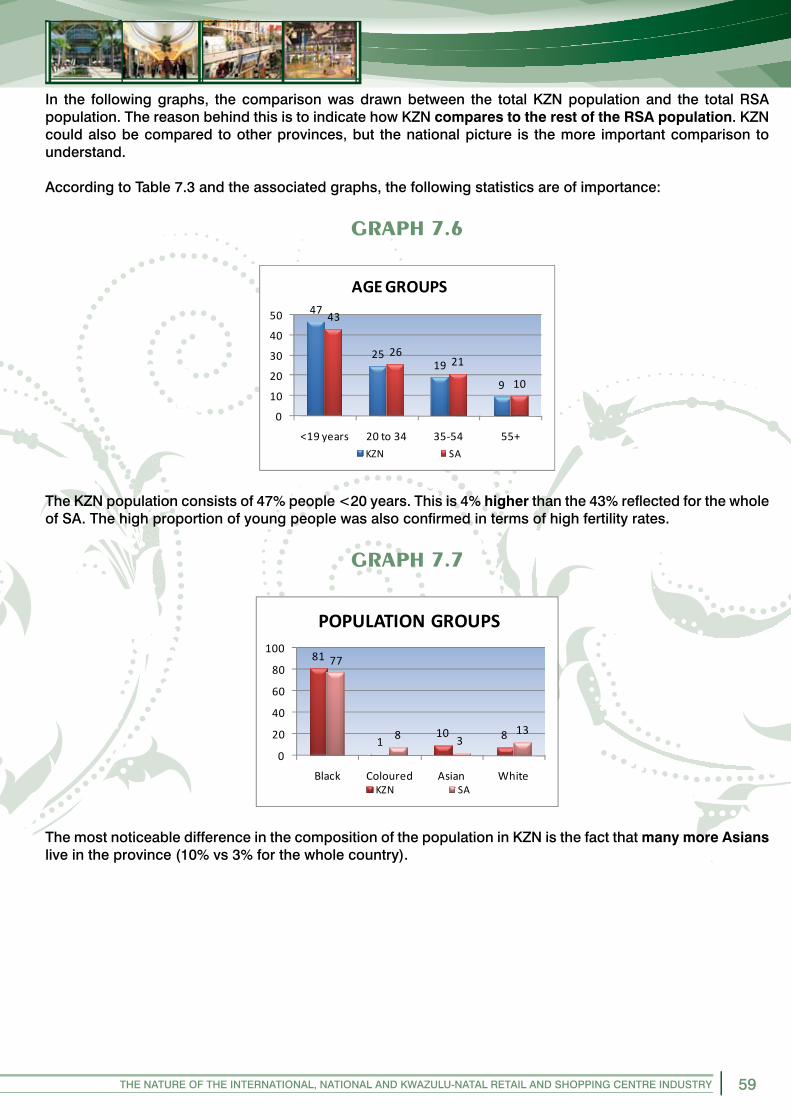
59THE NATURE OF THE INTERNATIONAL, NATIONAL AND KWAZULU-NATAL RETAIL AND SHOPPING CENTRE INDUSTRY
In the following graphs, the comparison was drawn between the total KZN population and the total RSA population. The reason behind this is to indicate how KZN compares to the rest of the RSA population. KZN could also be compared to other provinces, but the national picture is the more important comparison to understand.
According to Table 7.3 and the associated graphs, the following statistics are of importance:
GRAPH 7.6
The KZN population consists of 47% people <20 years. This is 4% higher than the 43% refl ected for the whole of SA. The high proportion of young people was also confi rmed in terms of high fertility rates.
GRAPH 7.7
The most noticeable difference in the composition of the population in KZN is the fact that many more Asians live in the province (10% vs 3% for the whole country).

60 THE NATURE OF THE INTERNATIONAL, NATIONAL AND KWAZULU-NATAL RETAIL AND SHOPPING CENTRE INDUSTRY
GRAPH 7.8
Zulu is by far the most dominant language group in KZN, with 84% of the population in this language group.
GRAPH 7.9
Fewer economically active people are employed compared to the rest of RSA.
GRAPH 7.10
White collar occupations are higher than in the rest of SA, indicating a strong local economy.
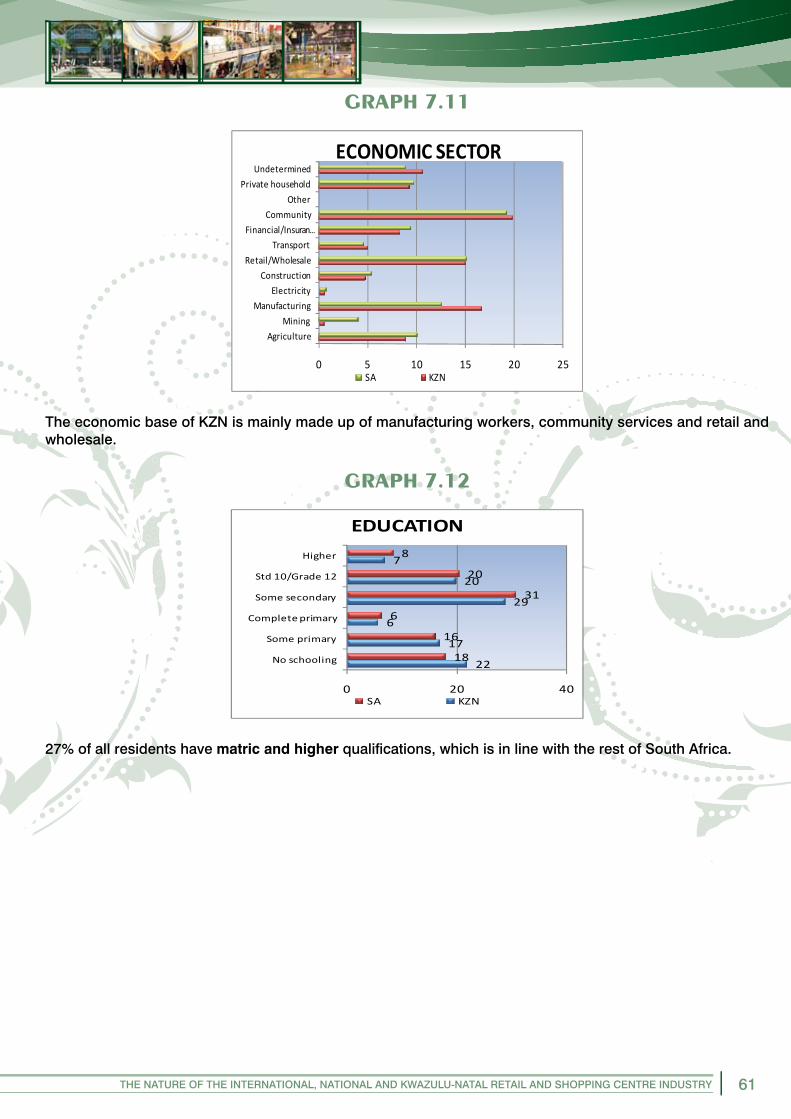
61THE NATURE OF THE INTERNATIONAL, NATIONAL AND KWAZULU-NATAL RETAIL AND SHOPPING CENTRE INDUSTRY
GRAPH 7.11
The economic base of KZN is mainly made up of manufacturing workers, community services and retail and wholesale.
GRAPH 7.12
27% of all residents have matric and higher qualifi cations, which is in line with the rest of South Africa.
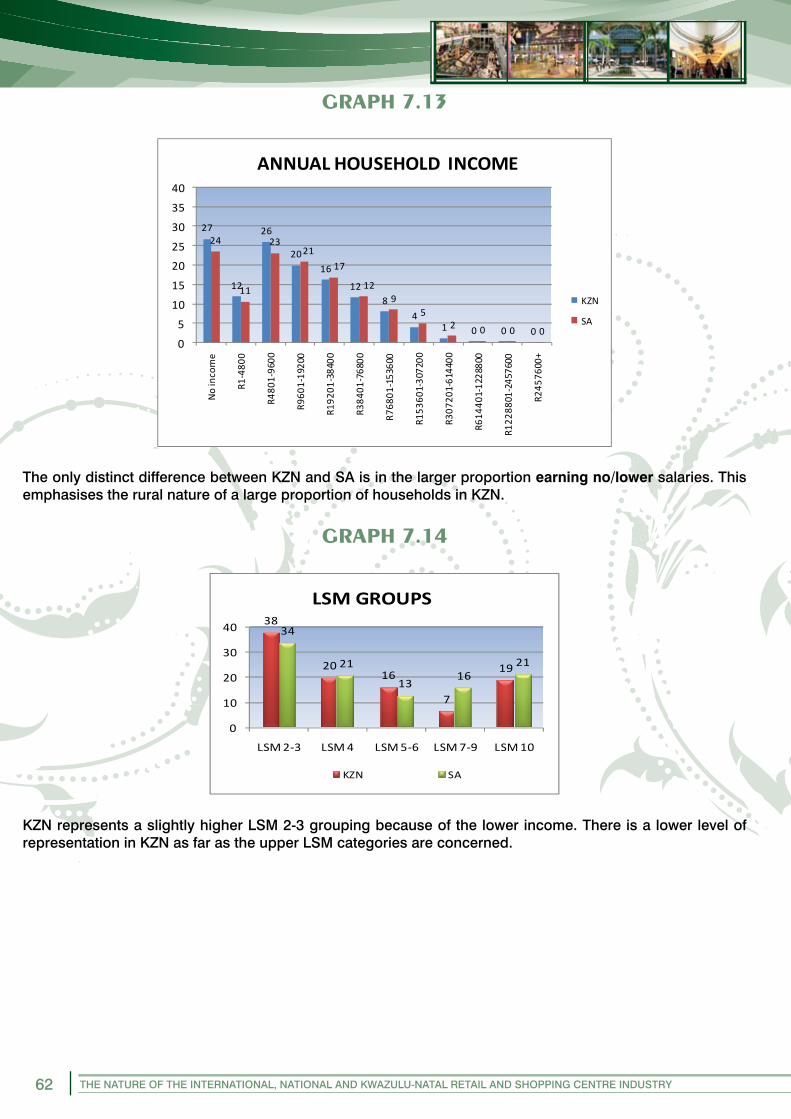
62 THE NATURE OF THE INTERNATIONAL, NATIONAL AND KWAZULU-NATAL RETAIL AND SHOPPING CENTRE INDUSTRY
GRAPH 7.13
The only distinct difference between KZN and SA is in the larger proportion earning no/lower salaries. This emphasises the rural nature of a large proportion of households in KZN.
GRAPH 7.14
KZN represents a slightly higher LSM 2-3 grouping because of the lower income. There is a lower level of representation in KZN as far as the upper LSM categories are concerned.

63THE NATURE OF THE INTERNATIONAL, NATIONAL AND KWAZULU-NATAL RETAIL AND SHOPPING CENTRE INDUSTRY
TABLE 7.3SOCIO-ECONOMIC AND DEMOGRAPHIC PROFILE
KZN VERSUS SA 2001 – ADJUSTED FOR 2009
KZN SA KZN SAAge Groups % % Individual Monthly Income % %<19 years 47 43 No income 3 220 - 34 25 26 R1-400 15 1435 - 54 19 21 R410-800 19 1755+ 9 10 R801-1600 22 23Population Groups R1601-3200 19 19Black 81 77 R3201-6400 14 14Coloured 1 8 R6401-12800 7 8Asian 10 3 R12801-25600 2 3White 8 13 R26501-51200 1 1Language Groups R51201-102400 0 0Afrikaans 1 13 R102401-204800 0 0English 14 8 R204801+ 0 0African 84 78 Annual Household Income Other 0 0 No income 27 24Employment R1-4800 12 11Employed 28 37 R4801-9600 26 23Unemployed 26 24 R9601-19200 20 21Not economically active 46 39 R19201-38400 16 17Occupation R38401-76800 12 12Legislators, offi cials and managers 5 3 R76801-153600 8 9Professionals 6 6 R153601-307200 4 5Technicians 11 11 R307201-614400 1 2Clerks 11 8 R614401-1228800 0 0Service 10 10 R1228801-2457600 0 0Skilled agriculture 3 5 R2457600+ 0 0Crafts/trade 11 11 Median hh income 2001 15 362 16 898Plant and Machinery 10 8 Median hh income 2009 28 433 26 815Elementary occupations 25 33 Median hh income pm 2009 2 369 2 235Undetermined 8 5 LSM Groups Occupation LSM 1-3 38 34White Collar 33 27 LSM 4 20 21Blue Collar 23 23 LSM 5-6 16 13Low Skilled 44 50 LSM 7-9 7 16Sector LSM 10 19 21Agriculture 9 10 No of people in sub place 9 426 027 44 819 783Mining 1 4 No of hh in sub place 2 086 278 11 205 692Manufacturing 17 13 Dwelling Unit Electricity 1 1 House 44 56Construction 5 5 Flat in block 9 5Retail/Wholesale 15 15 Townhouse 3 3Transport 5 5 House in back yard 3 4Financial/Insurance 8 9 Traditional/informal dwelling 30 19Community 20 19 Informal unit not in back yard 8 12Other 0 0 Room/fl at on shared property 1 1Private household 9 10 Caravan/tent/other 0 0Undetermined 11 9 Education No schooling 22 18 Some primary 17 16 Complete primary 6 6 Some secondary 29 31 Std 10/Grade 12 20 20 Higher 7 8
Source: Stats SA Census 2001, adjusted for 2009/15

64 THE NATURE OF THE INTERNATIONAL, NATIONAL AND KWAZULU-NATAL RETAIL AND SHOPPING CENTRE INDUSTRY
There are major resemblances between the KZN households and those of the rest of South Africa. The major differences however, are:
• a larger proportion of younger people;• a strong rural character and• fewer households in the upper LSM categories (LSM 7 -10)• many more Indian households.
7.4 Monthly Expenditure on Consumer Goods
Table 7.4 gives an indication of the average monthly household income according to different LSM groups. From this table it is clear that a large proportion of KZN households are still representative of LSM 1-4, with an average monthly household income of R2 369 per month. The top-end of the market (LSM 10) has a monthly household income of >R23 000 per month.
TABLE 7.4KZN AVERAGE HOUSEHOLD INCOME
LSM Group Ave Household Income
1-3 1 401
4 2 536
5-6 4 254
7-9 12 337
10 23 054
Source: SAARF, 2009
Table 7.5 gives an indication of the retail spent per month per LSM group. The statistics is mainly obtained from Urban Studies’ own databank, but correlates very well with the latest information from the Bureau of Market Research, Unisa.
Tables 7.4 and 7.5 clearly indicate that the expenditure on retail products represent between 33% and 50% of the total disposable household income. The lower the monthly household income the higher the proportion of retail spent, especially on food products.
TABLE 7.5SA TOTAL RETAIL SPEND PER LSM GROUP
PER MONTH: RSA
LSM 10+ LSM 10 LSM 7-9 LSM 5-6 LSM 4 LSM 1-3
Total Retail Spend 10 878 7 170 6 700 2 200 1200 870
% of Total Household Income ±25 31 54 51 47 62
Source: BMR, 2008 adjusted

65THE NATURE OF THE INTERNATIONAL, NATIONAL AND KWAZULU-NATAL RETAIL AND SHOPPING CENTRE INDUSTRY
7.5 Estimated annual retail expenditure for KZN
According to Table 7.6, the number of households (based on the latest population projections) is broken down into the different LSM groups.
TABLE 7.6 NUMBER OF HOUSEHOLDS IN EACH LSM GROUP:
KZN
LSM Group%
Households in KZN
Number of households in
LSM Group
1-3 38 853 311
4 20 449 111
5-6 16 359 289
7-9 7 157 189
10 14 314 378
10+ 5 112 278
Total 100 2 245 556
The estimated annual demand “spend” on retail products is R79 billion per annum (see Table 7.7). The total retail spent in SA is R510 billion. KZN therefore represents ±15% of the total retail spend, which is in line with the GDP contribution made by the province to the rest of SA.
This demand will grow according to the growth in expenditure levels, disposable income, and the number of households within KZN. The current retail performance fi gures are negative, but will recover with an upswing in the local and national economy.
TABLE 7.7TOTAL ANNUAL SPEND ON RETAIL PRODUCTS PER LSM GROUP
LSM Groups % Population Households Ave retail spend Annual Spend % of total
1-3 38 853 311 870 8 908 565 796 11
4 20 449 111 1 200 6 467 198 400 8
5-6 16 359 289 2 200 9 485 224 320 12
7-9 7 157 189 6 700 12 637 983 540 16
10 14 314 378 7 170 27 049 057 308 34
10+ 5 112 278 10 878 14 656 288 374 19
Total 100 2 245 556 79 204 317 738 100
Source: Urban Studies 2005-2009
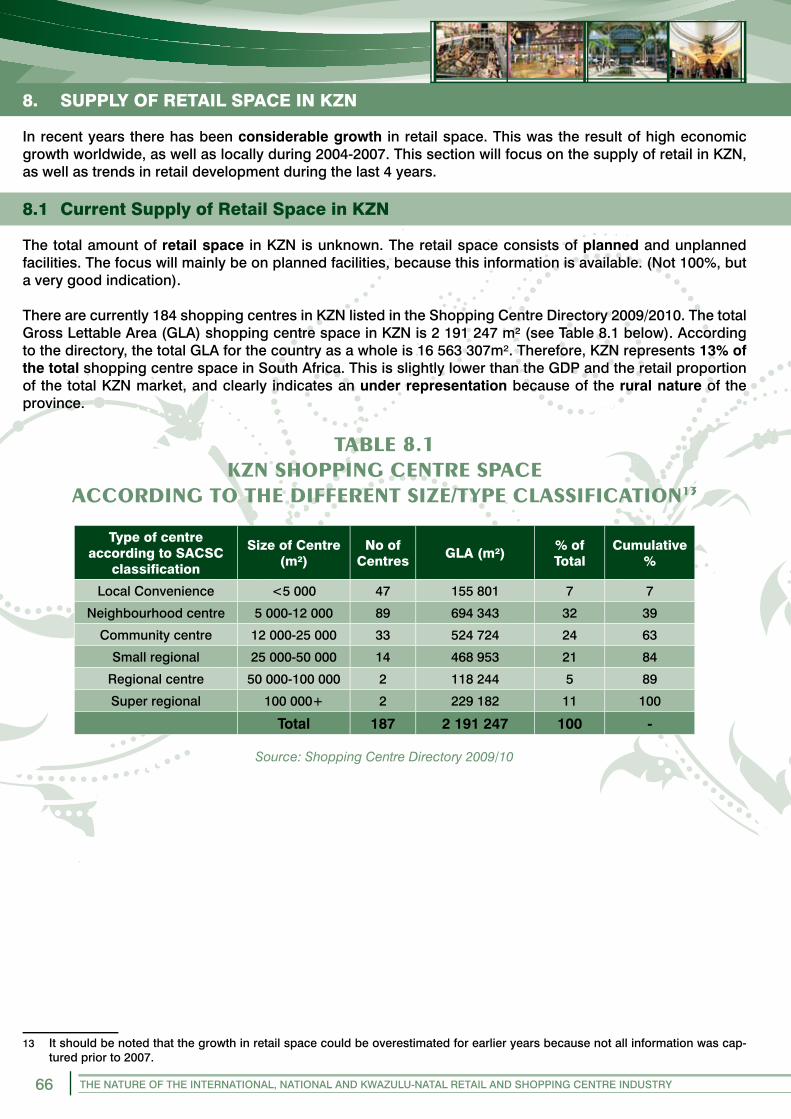
66 THE NATURE OF THE INTERNATIONAL, NATIONAL AND KWAZULU-NATAL RETAIL AND SHOPPING CENTRE INDUSTRY
8. SUPPLY OF RETAIL SPACE IN KZN
In recent years there has been considerable growth in retail space. This was the result of high economic growth worldwide, as well as locally during 2004-2007. This section will focus on the supply of retail in KZN, as well as trends in retail development during the last 4 years.
8.1 Current Supply of Retail Space in KZN
The total amount of retail space in KZN is unknown. The retail space consists of planned and unplanned facilities. The focus will mainly be on planned facilities, because this information is available. (Not 100%, but a very good indication).
There are currently 184 shopping centres in KZN listed in the Shopping Centre Directory 2009/2010. The total Gross Lettable Area (GLA) shopping centre space in KZN is 2 191 247 m² (see Table 8.1 below). According to the directory, the total GLA for the country as a whole is 16 563 307m². Therefore, KZN represents 13% of the total shopping centre space in South Africa. This is slightly lower than the GDP and the retail proportion of the total KZN market, and clearly indicates an under representation because of the rural nature of the province.
TABLE 8.1KZN SHOPPING CENTRE SPACE
ACCORDING TO THE DIFFERENT SIZE/TYPE CLASSIFICATION13
Type of centre according to SACSC
classifi cation
Size of Centre (m²)
No of Centres GLA (m²) % of
TotalCumulative
%
Local Convenience <5 000 47 155 801 7 7
Neighbourhood centre 5 000-12 000 89 694 343 32 39
Community centre 12 000-25 000 33 524 724 24 63
Small regional 25 000-50 000 14 468 953 21 84
Regional centre 50 000-100 000 2 118 244 5 89
Super regional 100 000+ 2 229 182 11 100
Total 187 2 191 247 100 -
Source: Shopping Centre Directory 2009/10
13 It should be noted that the growth in retail space could be overestimated for earlier years because not all information was cap-tured prior to 2007.
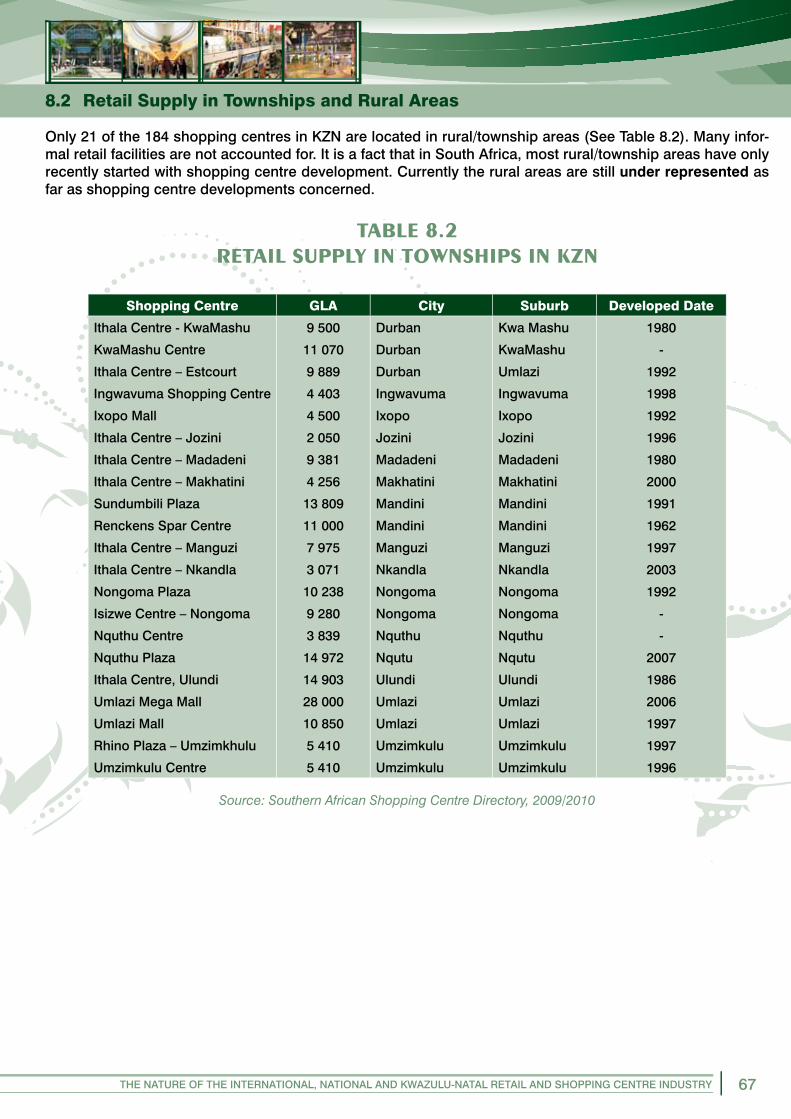
67THE NATURE OF THE INTERNATIONAL, NATIONAL AND KWAZULU-NATAL RETAIL AND SHOPPING CENTRE INDUSTRY
8.2 Retail Supply in Townships and Rural Areas
Only 21 of the 184 shopping centres in KZN are located in rural/township areas (See Table 8.2). Many infor-mal retail facilities are not accounted for. It is a fact that in South Africa, most rural/township areas have only recently started with shopping centre development. Currently the rural areas are still under represented as far as shopping centre developments concerned.
TABLE 8.2RETAIL SUPPLY IN TOWNSHIPS IN KZN
Shopping Centre GLA City Suburb Developed Date
Ithala Centre - KwaMashu 9 500 Durban Kwa Mashu 1980
KwaMashu Centre 11 070 Durban KwaMashu -
Ithala Centre – Estcourt 9 889 Durban Umlazi 1992
Ingwavuma Shopping Centre 4 403 Ingwavuma Ingwavuma 1998
Ixopo Mall 4 500 Ixopo Ixopo 1992
Ithala Centre – Jozini 2 050 Jozini Jozini 1996
Ithala Centre – Madadeni 9 381 Madadeni Madadeni 1980
Ithala Centre – Makhatini 4 256 Makhatini Makhatini 2000
Sundumbili Plaza 13 809 Mandini Mandini 1991
Renckens Spar Centre 11 000 Mandini Mandini 1962
Ithala Centre – Manguzi 7 975 Manguzi Manguzi 1997
Ithala Centre – Nkandla 3 071 Nkandla Nkandla 2003
Nongoma Plaza 10 238 Nongoma Nongoma 1992
Isizwe Centre – Nongoma 9 280 Nongoma Nongoma -
Nquthu Centre 3 839 Nquthu Nquthu -
Nquthu Plaza 14 972 Nqutu Nqutu 2007
Ithala Centre, Ulundi 14 903 Ulundi Ulundi 1986
Umlazi Mega Mall 28 000 Umlazi Umlazi 2006
Umlazi Mall 10 850 Umlazi Umlazi 1997
Rhino Plaza – Umzimkhulu 5 410 Umzimkulu Umzimkulu 1997
Umzimkulu Centre 5 410 Umzimkulu Umzimkulu 1996
Source: Southern African Shopping Centre Directory, 2009/2010

68 THE NATURE OF THE INTERNATIONAL, NATIONAL AND KWAZULU-NATAL RETAIL AND SHOPPING CENTRE INDUSTRY
8.3 Growth in Retail Supply in KZN (2003-2009)
The increase in retail shopping centre space refl ects a very high growth during the period 2003-2009. A large number of centres were completed all over the province. The latest increase in KZN from 2007 to 2009 was 9.2% to 2.2m² GLA, which is a very good indication of the annual growth in the province. The annual increase of 9.2% is slightly above the national average of ±8%. (See Table 8.3 and Graph 8.1)
TABLE 8.3GROWTH IN RETAIL SPACE IN KZN
2003-2009
Year GLA (m²) % Growth per annum
2002/3 953 907 -
2005 1 453 405 23.4
2007 1 839 206 12.5
2009 2 191 247 9.2
Source: Southern African Shopping Centre Directory
GRAPH 8.1
Source: Southern African Shopping Centre Directory, 2009/10
8.4 Retail Development Potential in KZN
There are various methods to calculate the development potential for retail, and especially shopping centre development. The technique basically consists of demand and supply models, and advanced statistical tech-niques.
The one technique that is easy to use is the per capita retail space warranted per annum. The calculation is based on the monthly spend per person on retail products, and to convert this spend to warranted fl oor area. The availability of existing retail space in a particular area should be known to indicate the gap between de-mand and supply.

69THE NATURE OF THE INTERNATIONAL, NATIONAL AND KWAZULU-NATAL RETAIL AND SHOPPING CENTRE INDUSTRY
8.4.1 Retail apace per capita
The warranted retail space per area per annum is a good indication of what could be used. It is however dif-fi cult if there is a lot of cross shopping between the different areas, and if the retail supply is not fully known. Based on Table 8.4, the warranted space for the whole province is estimated at 5.28million m². This repre-sents shopping centre space, unplanned retail facilities and gaps that may exist.
TABLE 8.4ESTIMATED ANNUAL SPEND ON RETAIL PRODUCT CATEGORIES
LSM Groups
No of Households
People in LSM Group Annual Spend (R)
Annual per Capita Spend (R)
Warranted Retail Floor area (m²)
1-3 853 311 3 839 899 8 908 565 796 2 320 593 904
4 449 111 2 021 000 6 467 198 400 3 200 431 147
5-6 359 289 1 616 800 9 485 224 320 5 867 632 348
7-9 157 189 550 161 12 637 983 540 22 971 842 532
10 314 378 1 006 009 27 049 057 308 26 888 1 803 271
10+ 112 278 359 289 14 656 288 374 40 080 977 086
Total 2 245 555 9 393 157 79 204 317 738 5 280 288
The retail space that can be warranted per capita per annum is indicated in Table 8.5. This varies from only 0.15m² per capita for the lowest LSM categories to 2.72m² per capita for the highest LSM category.
TABLE 8.5WARRANTED M² PER PERSON ACCORDING TO LSM GROUPS
LSM Groups m² per person p.a.
1-3 0.15
4 0.21
5-6 0.39
7-9 1.53
10 1.79
10+ 2.72
8.4.2 Various other models
There is a variety of retail potential modelling techniques available to help developers and retailers in calculat-ing the potential and size of a centre or a particular store.
These techniques have been supplemented in recent years by major advances in data availability and process-ing, and in computerised functionality. In all sectors of retailing and shopping centre development, location analysis software is being employed - together with shopper data and information on competitors, geo-demo-graphics and consumer spending - to facilitate the evaluation of new retail locations.
The focus in the KZN evaluation will be on the broad indication of the calculation of additional retail space, based on the warranted retail fl oor space per capita as indicated above. This probably not the best model, but can be easily used to obtain early indication of development potential
70 THE NATURE OF THE INTERNATIONAL, NATIONAL AND KWAZULU-NATAL RETAIL AND SHOPPING CENTRE INDUSTRY
9. PARTICIPATION OF PLANNING AND DEVELOPMENT STAKEHOLDERS
The main objective of this section was to send questionnaires to the various planning and development stakeholders in KZN as well as to hold a workshop to establish the following:
• To receive comments on the process and the preliminary guidelines content;• To emphasise certain aspects already included in the document;• To emphasise aspects that were not covered in the document;• To obtain specifi c recommendations and requirements from the different stake holders.
9.1 Questionnaire Phase
A letter/questionnaire was sent to all the different planning and development stakeholders, indicating the fol-lowing:
• the process focusing on 2 phases namely historical and theoretical background of retail development;• the latest trends in retail development internationally and locally and • the focus on KZN as the specifi c study area.
The approach followed in formulating the guideline document was explained to the respondents, focussing on the following:
• the macro environment which included the whole of KZN• the meso level where the urban /rural trade area are demarcated, and• on the micro level to identify specifi c sites for development.
Respondents were asked to comment on the following aspects:
1. Understanding the demarcation of a trade area and the site evaluation of a specifi c stand at a specifi c location;
2. To defi ne specifi c retail types as part of the retail hierarchy;3. To identify specifi c town planning issues and aspects as far as retail development is concerned;4. To provide specifi c planning and development guidelines to direct future applications.
The following list of people was asked to comment on the subsequent planning guidelines letter.
Ø Ivan Scholtz (Newcastle)Ø Lindani Khoza (Richards Bay)Ø Jan Van der Vegte (Dorpspruit)Ø Johan Van der Walt (Port Shepstone)Ø David Gengan (Umsundusi)Ø Atkins Khoali (Umsundusi)Ø Lihle Phewa (Ethekwini)Ø Neville Warrington
Feedback was received from most of these participants.

71THE NATURE OF THE INTERNATIONAL, NATIONAL AND KWAZULU-NATAL RETAIL AND SHOPPING CENTRE INDUSTRY
Response from different Stake holders involved in the Process
Table 9.1 gives an indication of the different comments and recommendations made by the stake holders.
TABLE 9.1COMMENTS AND RECOMMENDATIONS BY STAKE HOLDERS
ADD/INCLUDE THE FOLLOWING COMMENTS BY URBAN STUDIES
Give the economic growth rate of a particular catchment area
This information is not available on the micro level. The latest economic indicators are only available on provincial level.
Target market of a particular catchment area must be indicated.
Very important. Forms part of the trade area demographic information.
Understanding of competition/existing centres. Very important. Forms part of the trade area demographic information.
Need and desirability. Forms part of the whole market survey and the site selection.
Anticipated foot traffi c through the centre. This is a function of the size and tenant mix of a particular centre. Use the following guidelines:Low volumes: 8-10 people/m²/month.Average volumes: 12-16 people/m²/month.High volumes: 18-20 people/m²/month.Very high volumes: >24 people/m²/month.
Architectural themes. This must be considered by the developer and the architect. The architectural style can add extra drawing power to a centre
Changes to transport routes. Part of traffi c engineers: Take note of all road changes and upgrades and the impact on shopping centre development.
Financial responsibility for new physical infrastructure requirements.
Town planning to consider and implement.
Historical buildings. Adhere to the requirements.
9.2 Workshop
A workshop was held on 30 June 2009 and was attended by 22 delegates (see attached list.)
The same process was followed and the content and detail of the proposed guideline document. The follow-ing comments were made and incorporated in the guideline document.

72 THE NATURE OF THE INTERNATIONAL, NATIONAL AND KWAZULU-NATAL RETAIL AND SHOPPING CENTRE INDUSTRY
TABLE 9.2WORKSHOP NOTES
Issue Comment Action to be takenRetail development potential - Warranted fl oor space per person
Explain in detail how the model works and the application thereof
Give a descriptive explanation of how to use this model as a guide. It is important for the market profi le to be known and also used correctly
Site evaluation There needs to be two approaches• Site as a destination• Site as a unit form where certain
services would be offered.
The following needs to be considered:• Town planning rights• Bulk services• Sewerage systems• Taxi rank facilities• Safety and security• Design and architectural guidelines• Parking bays for deferent types of retail
facilitiesCorrectly structure this list and focus need to be on both proposed- and existing facilities
Trade area demarcation
Two approaches• New developments• Existing trade areaOverlapping trade areas
Explain this in broad terms, and not to specifi cAdd future growth prospectsThe market infl uence is important
Description per retail type
• Parking requirements• Market information for each type need
to be highlighted.• Ideal main tenant for each type of
centre, and the approximate space the main tenant will take up.
• What is the optimal tenant mix for optimal profi t?
Comprehensive analysis and description for each retail type. Focus on different tiers depending on the population size and LSM profi le.
Outline of retail types
• Add examples to each retail type• Clear understanding of lifestyle
centres• Mixed-use vs. multiple use• Add fresh produce markets
Give an understandable defi nition of each type of retail
Retail Strategies • Add retail as catalyst for further development
• Add marketing and investment strategies
• Retail does not form part of BEE• Informal settlements/townships what
is its future and is there a need to hold back development?
Start guidelines with strategies, to get a clear understanding/base of what needs to be done.
Recommended Application Process
• Focus on two main approaches namely: maintenance and development
• Refer to: methodology to put a plan together
There needs to be a differentiation between planners and developers.
Comments by planners
• Various comments were raised, and all comments will be considered in the guidelines (in one way or another)
Explain how the issues will be addressed in terms of planners and developers perspectives.
Way forward • What exactly is the aim for planners and developers with these guidelines?
• Is there a need for a second study?
Provide the council with two documents• An in depth guideline report• Guide book – that will act as a summary
of all the important and relevant information from the fi rst document

73THE NATURE OF THE INTERNATIONAL, NATIONAL AND KWAZULU-NATAL RETAIL AND SHOPPING CENTRE INDUSTRY
TABLE 9.3LIST OF WORKSHOP ATTENDEES
No. Name Municipality Tel E-mail
1 AN Khoali Msunduzi Local Municipality 033 392 2135 [email protected]
2 SL Magotovlela Ulundi Municipality 035 874 5157
3 NLH Buthelezi Ulundi Municipality 035 874 5203 [email protected]
4 E Danaedseu Mkhansodlini Municipality 031 785 9300 [email protected]
5 D Mbongwa Greater Kokstad Municipality 039 7976610 [email protected]
6 MS Moonsamy Hibicus Coast Municipality 039 315 9240 [email protected]
7 JI Mhlongo Maphumulo Municipality 032 481 2047
8 M Kaha KZN PDC
9 V Naidoo Msunduzi Municipality 033 392 2096 [email protected]
10 A Ngobo KZN PDC 033 3952645
11 P Shanmugom KZN PDC 033 395 3067 [email protected]
12 DS Rajah KZN PDC 031 301 8851
13 H Smit Uthangulu Municipality 035 799 2603 [email protected]
14 C Coetzee KZN Treasury 033 897 4538 [email protected]
15 L Phewa Ethekweni Municipality 031 311 7887 [email protected]
16 D Vilakazi Umgeni Municipality 033 239 9266 [email protected]
17 V Mhlongo Mahumulo Municipality 032 481 2047 [email protected]
18 N Msomi Ladysmith Municipality 036 637 2091 [email protected]
20 M Khathide Ladysmith Municipality 036 637 2091 [email protected]
21 H Diadia Mtshezi Munccipality 036 342 7800 [email protected]
22 SM Sikhakhano Endumeni Municipality 082 0472752 [email protected]
10. CONCLUSION
All the above mentioned aspects have an infl uence on shopping centre development to a greater of lesser extent. South Africa is very well provided with shopping centres for the affl uent market. Many of the centres on this level compare to the best in countries like the USA, UK and Europe.
The challenge is to provide quality retail and shopping centre facilities to the middle and lower LSM markets. The growth in the middle LSM markets will ensure that more centres are provided to satisfy their specifi c shopping needs.
The most important challenge is to provide a very large portion of the rural market (40% of the total South African market) with quality shopping centre facilities as well. This process has already started, but will have to expand to cater for the different rural communities.
The impact of centre development in all these areas is very positive in terms of job creation, the expansion of the tax base and the general impact shopping centre development has on local communities.
The second report is the guideline report focussing on the development of existing as well as new retail fa-cilities. A large number of different types have been included in this guideline document to make provision for all possible development options. This document also spells out specifi c strategies/actions that can be incorporated to streamline retail development from the smallest rural village to the largest metropolitan super regional centre. The guideline report will restructure this process to ensure that the majority of the KZN popu-lation is serviced by shopping centre facilities by 2020.

74 THE NATURE OF THE INTERNATIONAL, NATIONAL AND KWAZULU-NATAL RETAIL AND SHOPPING CENTRE INDUSTRY
11. TERMINOLOGY AND DEFINITIONS
Shopping CentreA single architectural unit of planned retail outlets and associated services and facilities, designed and man-aged as a fully integrated retail system.
SegmentationAn approach to target market selection in which a distinction is made between various groups of consum-ers.
Speciality goodsGoods which are bought infrequently, and are exclusive and demands great effort and involvement to ac-quire
Speciality centreA centre which has the special purpose of providing speciality goods to specifi c consumer segment, and often does not have a specifi c anchor
SuperstoreThese stores sell a similar but smaller range of goods as a hyper, but offer more than 2500m² of space.
SupermarketSelf-service shops with a distinct food bias in its merchandise range, operating on between 400m² and 2 500m² of space
ShopA shop unit is a retail unit of less than 400m² of space.
StoreA shop unit larger than 400m² of space
Service TradesGroup of service providers operating from retail units, usually in underutilised or non-selling space
Theme CentreAny centre designed according to a specifi c theme
TenantRetailer, merchant who occupies/paid for space
Tenant MixThe pre determined blend of centre occupants based on a range of distinguishing criteria, and which adds value to centre.

75THE NATURE OF THE INTERNATIONAL, NATIONAL AND KWAZULU-NATAL RETAIL AND SHOPPING CENTRE INDUSTRY
12. BIBLIOGRAPHY / REFERENCES
Allan, J., Massey, D. & Pryke, M. Unsettling Cities. Movement/Settlements. Routledge, London, 1999.
Berry, B.J.L. Geography of market centres and retail distribution. Prentice Hall. London, 1967.
Bureau of Market Research. Total household cash expenditure patterns, 2005/2008.
Carter, H. The Study of Urban Geography. Arnold. London, 1995.
Clark, D. Urban World/Global Cities. Routledge. London, 1996.
Davies, R.L. & Rogers, D.S. 1985. Store Locations and Store Assessment Research. John Wiley & Sons, Inc. New York, 1985.
Dawson, J.A. Retail Geography. John Wiley and Sons. New York, 1980.
Development Bank of South Africa, 1998.
DeLisle J. R. US Shopping Centre Classifi cations: Challenges and Opportunities.Research Review. Volume.12, no. 2, 2005.
Ghosh, A. & Mclafferty, S.L. Location Strategies for Retail and Service Firms. Lexington Books. Toronto, 1987.
Ghyoot, V.G. Feasibility Analysis for Proposed Shopping Centres with special emphasis on trade area demar-cation. D.Com. University of South Africa. Pretoria, 1992.
Hall, T. Urban Geography. Routledge. London, 1998.
Herbert, D.T. & Thomas, C.J. Cities in Space City as Place. Third Edition. David Fulton Publishers. London, 1998.
Herbert, D.T. & Thomas C.J. Cities in Space, City as Place. David Fulton Publishers, London, 1997.
Hines, M.A. Shopping Centre Development and Investment. John Wiley & Sons. New York, 1987.
International Council of Shopping Centres. Shopping Centre Defi nitions: Basic Confi gurations and Types for the United States. New York, 2004.
International Council of Shopping Centres (ISCS). Towards a Pan-European Shopping Centre Standard. Ex-cerpt from ISCS Research. A framework for International Comparisons. New York, 2005 and ICSC Research, 2005.
Jones, K.G. & Simmons, J.W. The Retail Environment. Routledge. New York, 1990.
Kahn, M. Change and Evolution of Shopping Centres. Paper delivered at the 1988 Conference of the Insti-tute of Town and Regional Planners. Sun City, Oct 1988.
Mason, J.B. Mayer, M.L. & Ezell, H.F. Retailing. Third edition. . Fulton, London, 1998.
McGoldrich, P.J. Retail marketing. McGraw Hill. London, 1990.
Roca, R.A. et al. Market Research for Shopping Centres, International Council of Shopping Centres. New York, 1988.

76 THE NATURE OF THE INTERNATIONAL, NATIONAL AND KWAZULU-NATAL RETAIL AND SHOPPING CENTRE INDUSTRY
Rogers, D.S. Retail Location Analysis in Practice: Retail site analysis is much more than “location location location”. Research Review. Volume 14, no 2, 2007.
Shopping centre development handbook. Second edition. Urban Land Institute. Washington, 1985.
South African Advertising Research Foundation (SAARF). Living Standards Measure Classifi cation (LSM) 2008/9.
South African Council of Shopping Centre Directory. Johannesburg, 1993-2009/10.
Urban Studies own database, 2006-2009.
Stats SA Population Census, 2001.
White, J.R. & Gray, K.D. Shopping centres and other retail properties: Investment, development, fi nancing and management. Wiley. New York, 1996.
Wringley, N. ed. Store Choice, Store Location and Market Analysis. Routledge. London, 1988.

77THE NATURE OF THE INTERNATIONAL, NATIONAL AND KWAZULU-NATAL RETAIL AND SHOPPING CENTRE INDUSTRY
NOTES

78 THE NATURE OF THE INTERNATIONAL, NATIONAL AND KWAZULU-NATAL RETAIL AND SHOPPING CENTRE INDUSTRY
NOTES
79THE NATURE OF THE INTERNATIONAL, NATIONAL AND KWAZULU-NATAL RETAIL AND SHOPPING CENTRE INDUSTRY
NOTES

80 THE NATURE OF THE INTERNATIONAL, NATIONAL AND KWAZULU-NATAL RETAIL AND SHOPPING CENTRE INDUSTRY
NOTES

THE NATURE OF THE INTERNATIONAL, NATIONAL AND KWAZULU-NATAL RETAIL AND SHOPPING CENTRE INDUSTRY
