kuliah-3-tekres-ah -jenis res & tek res
TRANSCRIPT

Kuliah 3Kuliah-3Teknik Reservoir
(3 SKS)
D I A d H li MMDosen : Ir. Andry Halim, MMUniversitas Trisakti - Jakarta
2012
Objective/Sasaran
jenis-2 reservoir tekanan reservoir
Jenis-jenis ReservoirJenis jenis Reservoir
Berdasarkan diagram fasa:
1 R i i k1. Reservoir minyak2. Reservoir gas3. Reservoir gas condensate (retrograde)g ( g )

Jenis-2 RservoirJenis 2 Rservoir

Types of Reservoir Fluids
• Black oil• Volatile oilVolatile oil• Retrograde gas
W• Wet gas• Dry gas

Basis forR i Cl ifi tiReservoir Classification
Basis Reservoir typesRock composition Sand, sandstone, carbonate, shaly sand, Rock composition , , , y ,
fractured shale
Grain cementation Consolidated, friable, unconsolidated
Porosity system Single porosity, dual porosity
Hydrocarbon system Heavy oil, light oil, condensate, wet gas, dry gasdry gas
Natural drive mechanism Solution gas, gas cap, water aquifer, gravity drainage
Saturation conditions Saturated, undersaturated
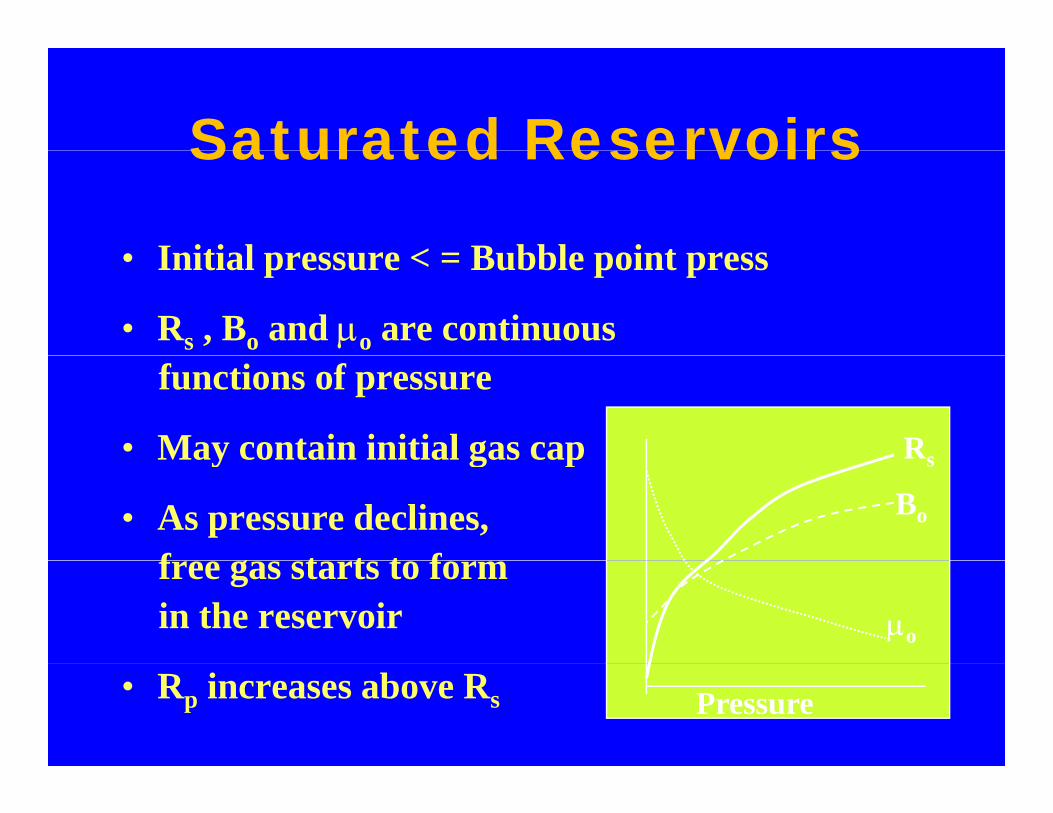
Saturated ReservoirsSaturated Reservoirs
Initial pressure < Bubble point press• Initial pressure < = Bubble point press
• Rs , Bo and µo are continuousfunctions of pressure
• May contain initial gas cap RsMay contain initial gas cap
• As pressure declines, f t t t f
Rs
Bo
free gas starts to form in the reservoir µo
• Rp increases above Rs Pressure

Undersaturated ReservoirsUndersaturated Reservoirs
• Initial pressure > Bubble point• Initial pressure > Bubble point
• Rs , Bo and µo vs Pressure arenot continuous functions
• Do not contain initial Rs
gas cap
• No free gas formsBo
• No free gas forms in the reservoir µo
Pb
• Rp equals Rs Pressure

Pressure-Temperature Diagramsp gfor Pure Substances
CriticalP i t
P
PointSoild Liquid
Vapor Pressure LinePGas
p
Triple Point
T

Pressure-Temperature Diagramsfor Mixtures of Components
Critical Point
Liquid
Cricondenbar
P
Bubble Point Line
100%75%
50%P
Quality Lines
25%
0
GasDew Point Line
Cricondentherm
T

Reservoir FluidsReservoir Fluids Phase Diagram Nomenclature
CRITICAL POINT
CRICONDENBARBUBBLEPOINT CURVE
DEW POINT CURVE
UR
E
75%QUALITY
LINES
PRES
SU
50%
25%
CRICONDENTHERM
P
25%
TEMPERATURE (From ARS)

Black Oil
(From: The properties of Petroleum Fluids by William D. McCain, Jr)
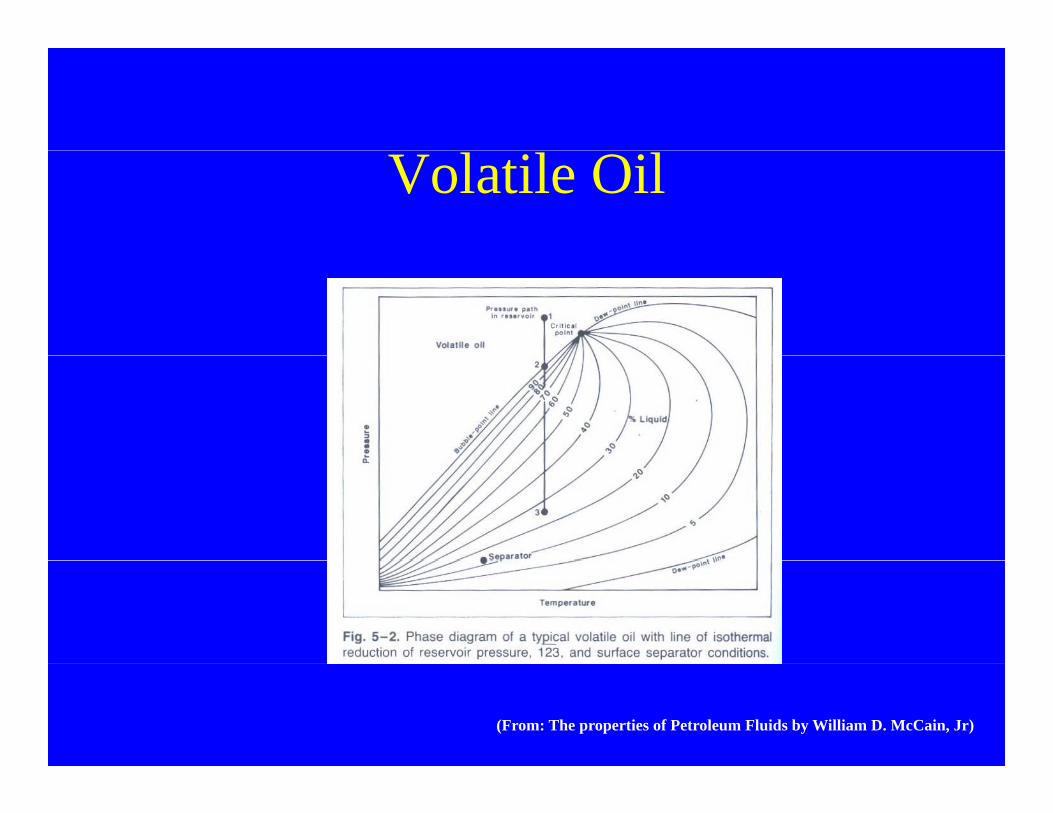
Volatile Oil
(From: The properties of Petroleum Fluids by William D. McCain, Jr)

Retrograde Gas
(From: The properties of Petroleum Fluids by William D. McCain, Jr)

Wet Gas
(From: The properties of Petroleum Fluids by William D. McCain, Jr)

Dry Gas
(From: The properties of Petroleum Fluids by William D. McCain, Jr)

Reservoir Pressure

Reservoir PressureAs previously mentioned, hydrocarbon accumulations occur in partially sealed structures where the upward migration of oil and gas from the source beds is blocked by an impermeable barrier As hydrocarbon accumulates formationblocked by an impermeable barrier. As hydrocarbon accumulates, formation water is expelled from the porous reservoir rock. Unless subsequent tectonic movements completely seal the reservoir, the underlying waters are contiguous and pressures in the aquifer will approximate to some local or regional hydrostatic gradient. In a water column, the pressure at any depth is approximated to;
Although ground waters are saline, temperatures increasing with depth tend to reduce the water density and a common “normal” value of Gw is 0.433 psi/ft (0.1 kg/cm2/m), which is approximately a fresh water gradient. Gradients within the range 0 43 to 0 5 psi/ft are considered normalrange 0.43 to 0.5 psi/ft are considered normal

Reservoir Pressure

Reservoir PressureReservoir Pressure
H d b i f d id f t d d th fHydrocarbon reservoirs are found over a wide range of present day depths ofburial, the majority being in the range 500-4000 mSS. In our concept of thepetroliterous sedimentary basin a region of water into which sediment hasaccumulated and hydrocarbons have been generated and trapped, we may have
t ti f i l h d t ti di tan expectation of- a regional hydrostatic gradient.That is, in a water column representing vertical pore fluid continuity thepressure at any point is approximated by the relationship
where X is the depth below a reference datum (such as sea level) andG, is the pressure exerted by unit height of water.
The value of G, depends on the salinity of the waters and on the temperature inth t F h t hibit di t f 9 79 k / (0 433 i/ft) dthe system. Fresh water exhibits a gradient of 9.79 kpa/m (0.433 psi/ft) andreservoir water systems are commonly encountered with gradients in the rangeof 10 kpa/m (0.44 psi/ft) to 12 kpa/m (0.53 psi/ft). In reservoirs found at depthsbetween 2000 mSS and 4000 mSS we might use a gradient of 11 kpa/m topredict pore fluid pressures around 220 bar to 440 bar as shown in Table 2 1predict pore fluid pressures around 220 bar to 440 bar as shown in Table 2.1.

Reservoir PressureReservoir PressureGeneral Reservoir pore pressure in Brent Sand Equilibrium Gradien Pressure
Reservoir PressureReservoir Pressure
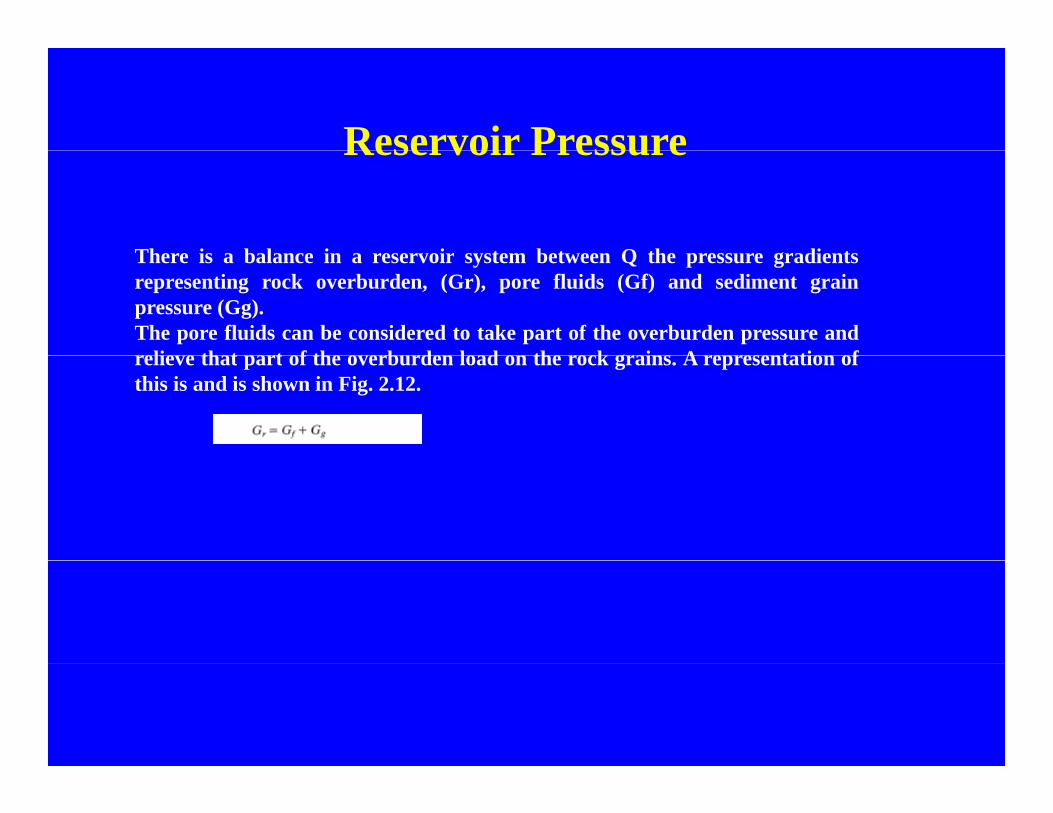
Th i b l i i t b t Q th di tThere is a balance in a reservoir system between Q the pressure gradientsrepresenting rock overburden, (Gr), pore fluids (Gf) and sediment grainpressure (Gg).The pore fluids can be considered to take part of the overburden pressure andrelie e that part of the o erb rden load on the rock grains A representation ofrelieve that part of the overburden load on the rock grains. A representation ofthis is and is shown in Fig. 2.12.

FLUID PRESSURES IN A HYDROCARBON ZONEWe will define a fluid contact between oil and water as the depth in the reservoirat which the pressure in the oil phase (P,) is equal to the pressure in thc waterphase ( P , ) . Reference to Fig. 2.13 shows this condition as an ecluilibriulncondition.Strictly speaking, the position Po = P, defines the free water level (FWL), as insome reservoirs a zone of 100% water saturation can occur above the free waterlevel by capillarity. In layered sand systems which do not have equilibrium with acommon aquifer, multiple fluid contacts can be found as shown in Fig. 2.14

FLUID PRESSURES IN A HYDROCARBON ZONEAt the water-oil contact, P, is given by the average tcmperature-salinity gradient otwater from the surface datum of sea level.As an equation of a straight line below
where the constant C, can reprcsent any degree of under- or overpressure.At somc dcyth, X,,,,, we can therefore write the prcssure Pw(owc) = Po(owc).Above thc water-oil contact the prcssure in the oil phasc is the pressure that the oil had at the water-oil contact less the density head of the oil. At any depth XD above the water-oil contact, the pressure in the oil phase will be Po(XD) as follows
where po is the local oil density. At the gas-oil contact Po(goc) = Pw(goc). The prcswre in the gas phase at the top of the reservoir XT will therefore be:
Where g' is the ratio of gravitational acceleration g to the universal constant g,

FLUID PRESSURES IN A HYDROCARBON ZONEThe estimat~on and recognition of flulci contacts are essential in evaluatinghydrocarbons in place.The placing of tluid contact\ often rcsults frorn consideration of information from
l iseveral sources, i.e.(a) equilibrium pressures from RFT or gradient surveys;(b) equilibrium pressures from well tests;(c) flow of particular fluid from particular minimum or maximum depth;(d) fl id d iti f f ti l(d) fluid densities from formation samples;(e) saturations interpreted from wireline log data;(f) capillary pressure data from core samples;(g) fluid saturations from recovered core.Th i f il t t t f fl t t i i t th t i l fThe proving of an oil-water contact from flow tests gives rise to the terminology ofLKO (lowest known oil) or ODT (oil down to) depths and HKW (highest knownwater) or WUT (water up to) depths. The combination of uncertainties in fluidproperties for gradient extrapolation and in well test intervals means that a fluid
t t i ft t d d th til d t f l ll icontact is often represented as a depth range until data from several wells in areservoir have been correlated.A particular difficulty in hydrocarbon-water contact evaluation concernsidentification in the presence of increasing shaliness. The effect of shaliness is
if t i ll th t d hi h th h ld ill hi h i hi hmanifest in small pore throats and high threshold capillary pressure which give highwater saturation.Some of these difficulties may be resolved by capillary pressure analysis usingrepresentative core samples.

Abnormal Pressures
Under certain depositional conditions or because of tectonicpmovements which close the reservoir structure, fluid pressures maydepart substantially from the normal range. Abnormal pressures canoccur when some part of the overburden load is transmitted to theformation fluids. Abnormal pressures corresponding to gradients of0.8 to 0.9 psi/ft and approaching the geostatic gradient (generallytaken as approximately equivalent to 1.0 psi/ft) may occasionally be
d d b id d d l hi hencountered and can be considered dangerously high.

RESERVOIR TEMPERATURESReservoir temperature may be expected to conform to the regional or localgeothermal gradient. In many petroliferous basins this is around 0.029 K/m (1.6oF/100 ft). The overburden and reservoir rock, which have large thermal capacities,t th ith l f f h t t f ithi th i l d ttogether with large surface areas for heat transfer within the reservoir, lead to areasonable assumption that reservoir condition processes tend to be isothermal.The temperature profile from surface conditions will reflect rock property variationsand can be obtained from maximum reading thermometers used with logging tools.Th l l th l di t b di t b d d llb b d illiThe local geothermal gradient can be disturbed around a wellbore by drillingoperations and fluids, and a Horner type analysis using a suite of temperatures at agiven depth from successive logging runs, can be used to obtain an indication of theundisturbed local temperature (Fig. 2.15). When temperature gradients are
t d b t i ht li f th f t th i i t l th brepresented by a straight line from the surface to the reservoir interval, there may bean implied correction for water depth in offshore operations.temperature of the North Sea has been taken as 43°C. As shown in Fig. 2.16, a typical geostatic temperature gradient in the reservoir interval of a northern North Sea well
i ht b 0 029 K/ (0 016 F/ft)might be 0.029oK/m (0.016oF/ft).
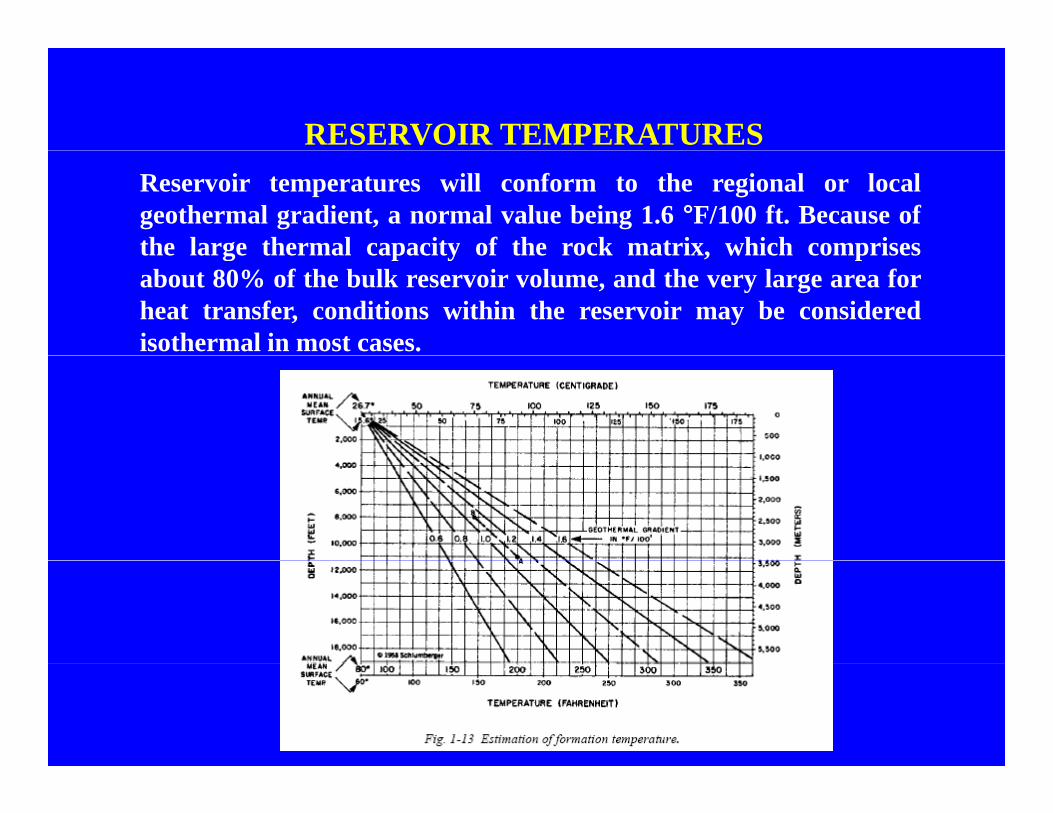
RESERVOIR TEMPERATURESReservoir temperatures will conform to the regional or localgeothermal gradient, a normal value being 1.6 °F/100 ft. Because ofthe large thermal capacity of the rock matrix, which comprisesthe large thermal capacity of the rock matrix, which comprisesabout 80% of the bulk reservoir volume, and the very large area forheat transfer, conditions within the reservoir may be consideredisothermal in most cases.

RESERVOIR TEMPERATURES

Reservoir Testing
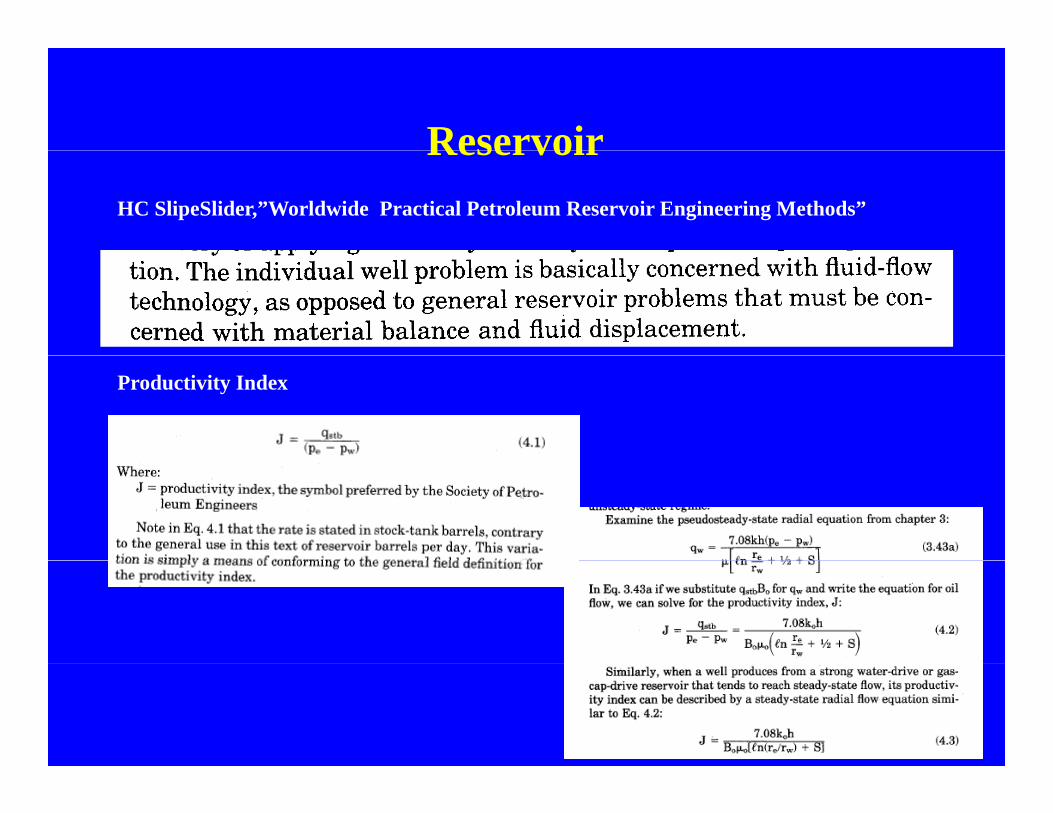
ReservoirReservoirHC SlipeSlider,”Worldwide Practical Petroleum Reservoir Engineering Methods”
Productivity Index

ReservoirReservoirDamage Ratio
Normalized PINormalized PI
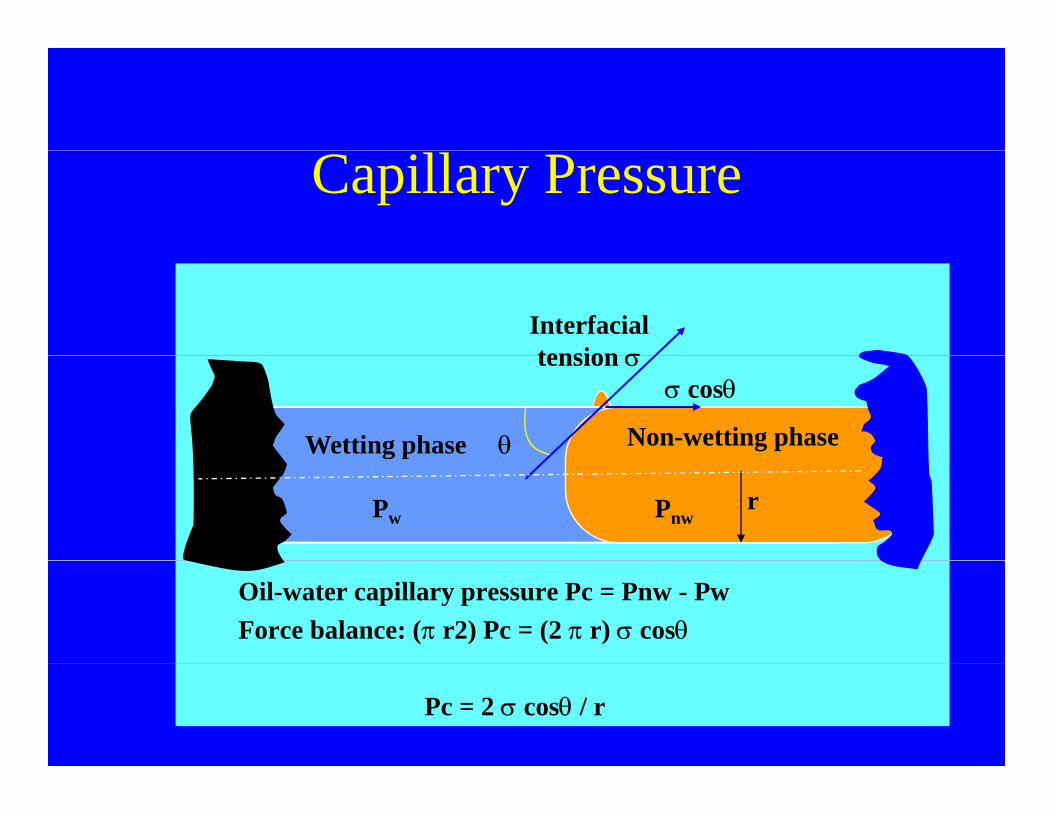
Capillary Pressure
Interfacial tension σ
θ
σ cosθtension σ
Non-wetting phaseWetting phase
r
g p
PnwPw
Oil-water capillary pressure Pc = Pnw - PwForce balance: (π r2) Pc = (2 π r) σ cosθ
Pc = 2 σ cosθ / r
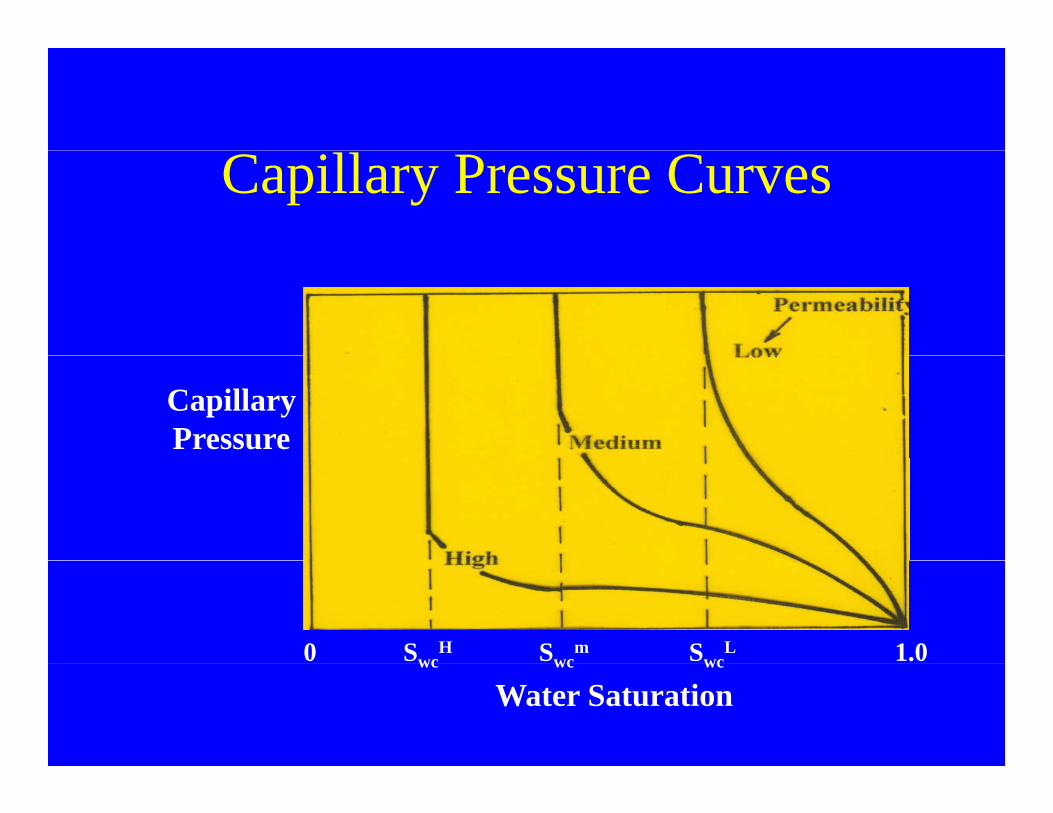
Capillary Pressure Curves
Capillary Pressure
0 SwcH Swc
m SwcL 1.0wc wc wc
Water Saturation
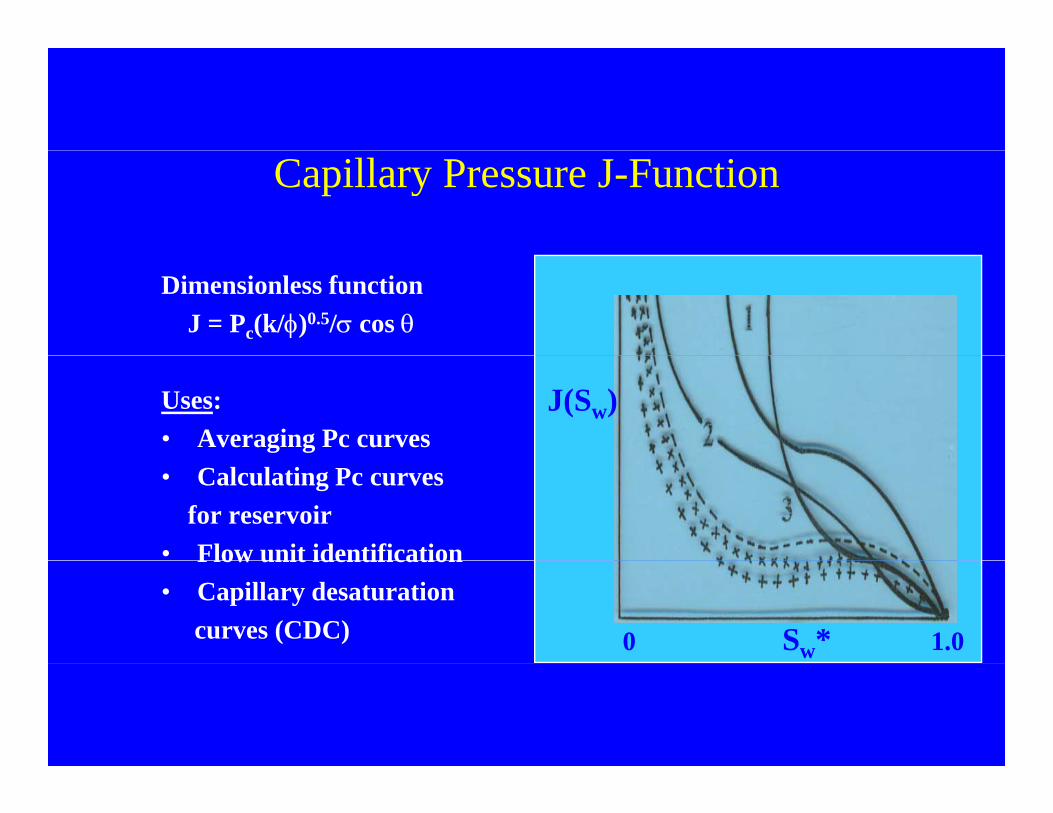
Capillary Pressure J-Function
Dimensionless functionJ = Pc(k/φ)0.5/σ cos θ
Uses:• Averaging Pc curves
J(Sw)
• Calculating Pc curvesfor reservoir
• Flow unit identificationFlow unit identification• Capillary desaturation
curves (CDC) 0 Sw* 1.0

Questions ?

Latihan soal1. Suatu reservoir dengan data sbb :g
kedalaman reservoir di sumur-A= 5000 mketinggian lantai bor = 1000 m above sea level (datum=mss)density minyak = 30 oAPIgradien grain pressure = 0,1 psi/ftHitung (dalam satuan psi) :a) Gradien fluid reservoir dan tekanan fluida reservoirb) T k ( i )b) Tekanan (grain pressure)c) Gradien overburden dan tekanan overburden reservoir tsb

Latihan soalLatihan soal
Suatu reservoir dg data sbb :•Laju alir = 250 m3/d•Laju alir = 250 m3/d•Permeabilitas = 200 md•Tekanan reservoir = 200 ksc (kg/cm2)•Tekanan di dasara sumur = 1900 psia•Viskositas minyak = 1 cpViskositas minyak 1 cp•Diameter casing produksi = 7 inch•Radius reservoir = 175 m•Skin=1•FVF = Bo =1FVF Bo 1•Tebal reservoir = 10 m
•Hitung :1. PI2 Specific PI2. Specific PI3. Jika diasumsi tdk ada skin hitung PI

PR-31. Apa yang dimaksud dengan Reservoir ? (nilai 10)p y g g ( )2. Sebutkan jenis-2 reservoir dan jelaskan secara singkat (nilai 10)3. Apa yang dimaksud dengan tekanan reservoir dan temperatur reservoir serta
jelaskan secara singkat fenomena ini (nilai 20)4. Suatu reservoir dengan data sbb :
kedalaman reservoir di sumur-A= 4000 mketinggian lantai bor = 1000 m above sea level (datum)density minyak = 20 oAPIdensity minyak = 20 oAPIgradien grain pressure = 0,1 psi/ftHitung (dalam satuan psi) :a) Gradien fluid reservoir dan tekanan fluida reservoir (nilai 20)a) Gradien fluid reservoir dan tekanan fluida reservoir (nilai 20)b) Tekanan (grain pressure) (nilai 20)c) Gradien overburden dan tekanan overburden reservoir tsb (nilai 20)