@k.r.bhattarai, business school, university of hull. 1 economic modelling lecture 2 neoclassical...
TRANSCRIPT

@K.R.Bhattarai, Business School, University of Hull.
1
Economic Modelling
Lecture 2
Neoclassical Solow Growth Model

@K.R.Bhattarai, Business School, University of Hull.
2
Growth Rates in the UK Economy
-6
-4
-2
0
2
4
6
8
10
12
GGDP
Linear (GGDP)

@K.R.Bhattarai, Business School, University of Hull.
3
Diaparity in Per Capita Income Across the World
35620
340
24430
34100
12990
370
3580
1370
9340
19103600
1470
18530
7300
5101120
3020
193 990
27080
2360
980
34100
23550
0
5000
10000
15000
20000
25000
30000
35000
40000
Japan Nepal SauthAfrica
Ghana Albania UK Haiti USA NewZeland Benin Brazil Bolivia
US
Dol
lars
us-dollar ppp
Source: Hull University Network.Start/Applications/Economics/ World Development Indicators 2002

@K.R.Bhattarai, Business School, University of Hull.
4
Growth Miracles, Average Annual Growth Rate 1960-2000
4.99%5.21%
4.06%
5.72%
4.19%
5.40%
3.86%
5.89%
4.49%
0.00%
1.00%
2.00%
3.00%
4.00%
5.00%
6.00%
7.00%
China
Hong K
ong,
Chin
a
Irelan
d
Korea,
Rep.
Japa
nM
alta
Portuga
l
Singa
pore
Thailan
d
Growth Rate of Per Capita Income Growth Miracle Countries
Source: Hull University Network. Start/Applications/Economics/ World Development Indicators 2002

@K.R.Bhattarai, Business School, University of Hull.
5
Growth Disasters, Average Annual Growth Rate 1960-2000
-0.75%-0.71%
-0.21%
-1.00%-1.11%
-0.79%
-1.61%
-0.24%
-1.04%
-0.30%
-1.26%
-1.80%
-1.60%
-1.40%
-1.20%
-1.00%
-0.80%
-0.60%
-0.40%
-0.20%
0.00%
CA
FR
P
Ch
ad
Gh
ana
Ha
iti
Mad
aga
sca
r
Nic
ara
gua
Nig
er
Se
neg
al
Sie
rra
Leo
ne
Ve
nezu
ela
, R
B
Za
mb
ia
Growth ate of Per Capita Income In Growth Disaster Countries
Source: Hull University Network.Start/Applications/Economics/ World Development Indicators 2002

@K.R.Bhattarai, Business School, University of Hull.
6
Solow Growth ModelProduction function with capital and labour as its inputs.Closed Economy without Government.
tLtKtAtY
tItCtY
Market clearing:
tsYtS
tKntI
tItS tIt
KtK 1
1
Household’s Saving Decision:
Investment requirement:
Closure rule in the model:
Dynamics: Capital accumulation:
Firm’s Production Function

@K.R.Bhattarai, Business School, University of Hull.
7
Y
K
Production Function
LAKY
Total capital stock
Tot
al o
utpu
t

@K.R.Bhattarai, Business School, University of Hull.
8
Intensive Production Function
k
L
K
L
LK
L
Yy
1L
Yy
L
KkPer capita capital
Per
cap
ita o
utpu
t

@K.R.Bhattarai, Business School, University of Hull.
9
Saving and Production Functions
k
L
K
L
LK
L
Yy
1
L
Yy
L
Kk
sksyS
@K.R.Bhattarai, Business School, University of Hull.
10
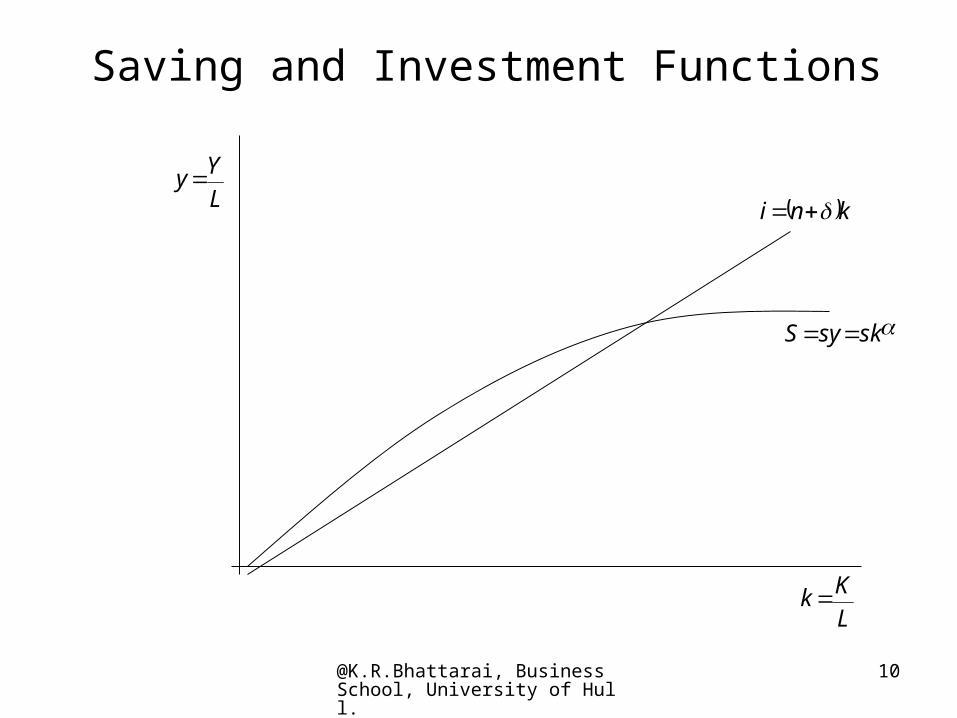
Saving and Investment Functions
L
Yy
L
Kk
sksyS
kni

@K.R.Bhattarai, Business School, University of Hull.
11
Per Capita Output and Per Capita Capital Stock in the Steady State
ky
L
Yy
L
Kk
sksyS
kni
0.5ks ks
Is and Ss

@K.R.Bhattarai, Business School, University of Hull.
12
Calculations of growth of Per Capita Output
Growth rate of Per Capita OutputL
Yy
LYy ggg
If Y grows by 5 percent, Labour grows by 2% then
03.002.005.0 LYy ggg
Similarly growth rate of Effective Per Capita Capital StockAL
Kk
LAKk gggg
01.002.002.005.0 LAKk gggg
If K grows by 5%, labour grows by 2% , technology grows by 2 % then:

@K.R.Bhattarai, Business School, University of Hull.
13
Growth Accounting
1LAKY
LKAY ln1lnlnln
LL
KK
AA
YY 1
LgKggYgYY
A 1
Take log of both sides:
Differentiate with respect to time :
@K.R.Bhattarai, Business School, University of Hull.
14
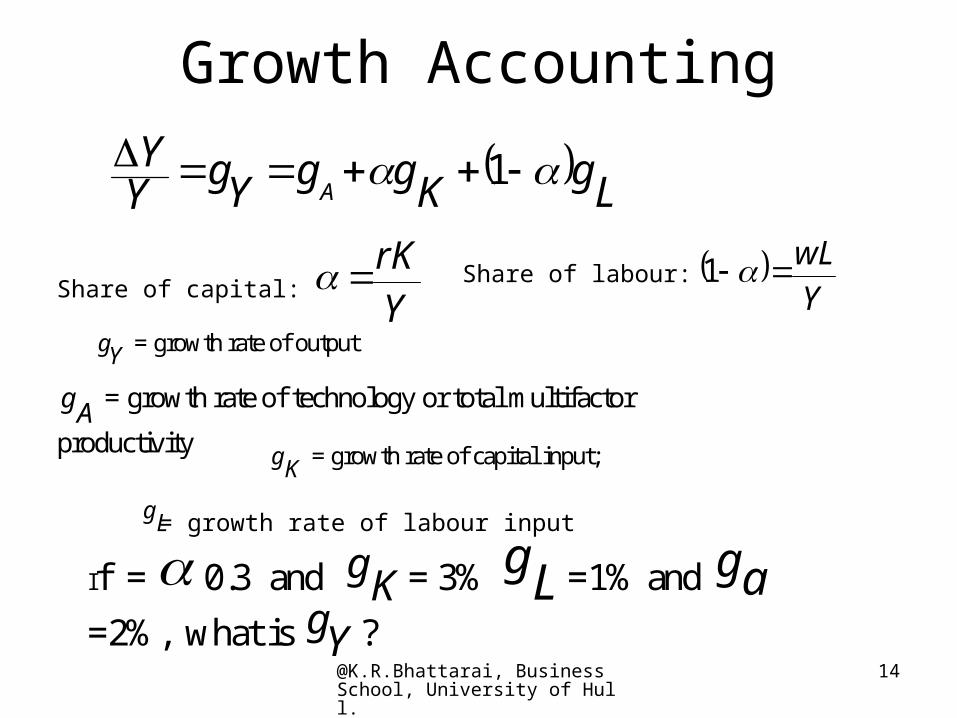
Growth Accounting
LgKggYgYY
A 1
Y
rKShare of capital:
Y
wL 1Share of labour:
Yg = growth rate of output
Ag = growth rate of technology or total multifactor
productivity
Kg = growth rate of capital input;
Lg = growth rate of labour input
If = 0.3 and Kg = 3% Lg =1% and ag
=2%, what is Yg ?
@K.R.Bhattarai, Business School, University of Hull.
15
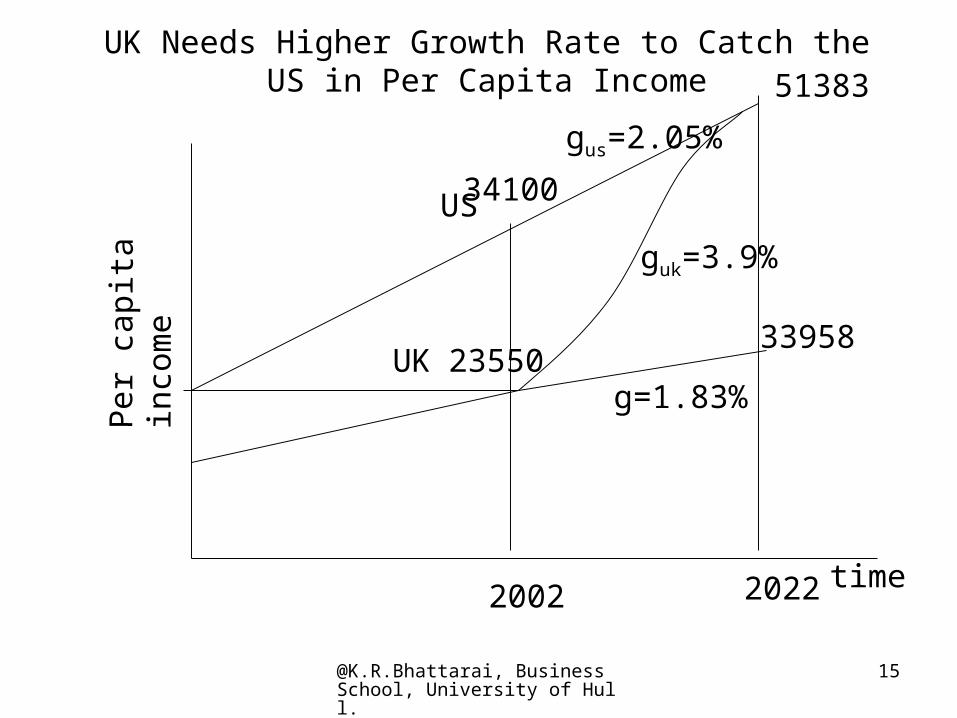
time
UK 23550
34100US
UK Needs Higher Growth Rate to Catch the US in Per Capita Income
Per
cap
ita
inco
me
2002 2022
51383
guk=3.9%
gus=2.05%
33958
g=1.83%
@K.R.Bhattarai, Business School, University of Hull.
16
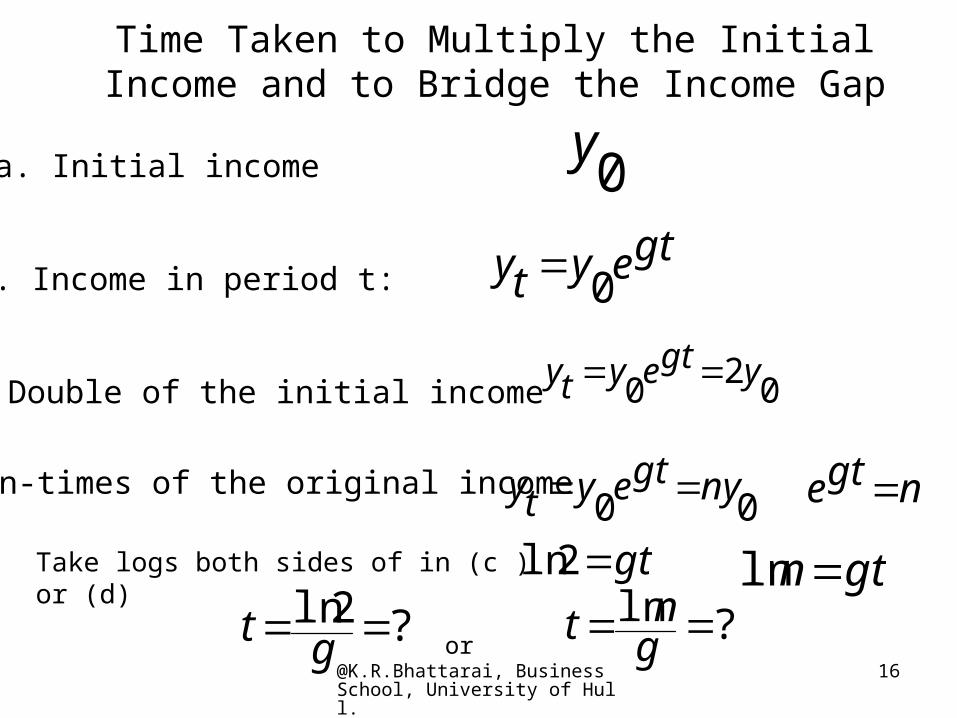
Time Taken to Multiply the Initial Income and to Bridge the Income Gap
a. Initial income 0y
b. Income in period t:gteyty 0
c. Double of the initial income 02
0ygteyty
d. n-times of the original income 00
nygteyty ngte
Take logs both sides of in (c ) or (d) gt2ln gtnln?2ln gt ?ln g
ntor

@K.R.Bhattarai, Business School, University of Hull.
17
Why Growth Rates Differ Across Countries?
Because of differences inCapital Stock (Buildings, Transportation and
Communication Networks, Machines)Labour input (Health and education of working
populations, their productive skills, knowledge)Technology (knowledge on how to combine inputs in
production; formula, design, software and management)
Economic Policy Natural resources?

@K.R.Bhattarai, Business School, University of Hull.
18
Reasons for Growth Miracle
Higher saving and investment rates.
Higher rate of technology adoption.
Better economic policy: close co-operation between the public and the private sector.
Realistic Trade and exchange rate policies.
Control of population growth rate.

@K.R.Bhattarai, Business School, University of Hull.
19
Reasons for Growth Disasters
Low Saving and Investment Rates.
Higher level of inflation and economic uncertainty.
Negative real interest rates.
High population growth rates.
Low exports and more imports and trade and balance of payment imbalance.
Weak Governments.

@K.R.Bhattarai, Business School, University of Hull.
20
Readings and References
Solow, Robert M. (1956) A Contribution to the Theory of Economic Growth, Quarterly Journal of Economics, pp.65-95.
Blanchard (10, 11)Mankiw (7)Burda Wyplosz (3) Miles and Scot (5-6)
Relevant web page:
http://www.bris.ac.uk/Depts/Economics/Growth/