krakatau suite management overview - power softwarepowersoftware.com/docs/justify/justify.pdf ·...
TRANSCRIPT

Krakatau Suite
Management Overview

1
Table of Contents Introduction....................................................................................................................2 Getting Started ...............................................................................................................3 Output ............................................................................................................................4
Graphical Environment..............................................................................................4 Viewing Symbols.......................................................................................................4 Graphical Comparison ...............................................................................................6 Setting Bounds ...........................................................................................................8 Reports .......................................................................................................................9
HTML ....................................................................................................................9 XML.....................................................................................................................10 CSV......................................................................................................................10
Tools in the Krakatau Suite..........................................................................................12 Krakatau Professional ..............................................................................................12 Krakatau Project Manager .......................................................................................12 Essential Metrics......................................................................................................14
Architecture..................................................................................................................15
Table of Figures Figure 1: Project Creation..............................................................................................3 Figure 2: File/Class & Method Lists..............................................................................4 Figure 3: Graphical Metric View...................................................................................6 Figure 4: Kiviat Diagram...............................................................................................7 Figure 5: Bounds Selection............................................................................................8 Figure 6: HTML Report.................................................................................................9 Figure 7: XML Report .................................................................................................10 Figure 8: CSV Report ..................................................................................................11 Figure 9: Pie Chart .......................................................................................................11 Figure 10: Changed Source Lines of Code ..................................................................13 Figure 12: Multiple Page HTML Report .....................................................................14 Figure 13: Design Overview........................................................................................15

2
Introduction ‘Every manufacturing process must control the quality of its products and processes’. In order to control any process you must be able to measure it. Krakatau Metrics from Power Software aims to bring control to the complex and investment-intensive manufacturing process of software engineering. By automatically measuring your source code we are able to tell you exact information about the size, complexity and maintainability of one of your most expensive and important assets. Drawing on many years of experience Power Software has designed and manufactured a complete range of software metrics tools. The Krakatau Metric Suite covers all aspects of the software metrics from simple size metrics, LOC & SLOC to complex object-oriented metrics. Changes in source code are also covered in the Project Manager tool. The aim of the Krakatau Suite is to allow software professionals to improve quality and robustness through the application of easy-to-use, non-intrusive metric tools.
For further information about Krakatau Professional, Krakatau Project Manager, Essential Metrics and VisualizeIt! please visit http://www.powersoftware.com/ or contact us at [email protected].

3
Getting Started Krakatau Metrics can be used on either C/C++ or Java source code. The principles of loading the source code are the same for both languages. Source code can be loaded in these ways
1. Create a directory-structure based 2. Create a project containing all of the files in a directory 3. Select individual files to be added to a project 4. Import files from a third party tool
Examples are shown in the figure below:
Figure 1: Project Creation This project creation can be accomplished quickly and simply – thereafter one mouse click starts Krakatau generating metric information for the given project. This ease of and non-intrusiveness has seen many users move from more cumbersome metric applications to Krakatau.

4
Output
Graphical Environment The benefits of a graphical environment are numerous. In Krakatau we provide an intuitive graphical environment that shows all the results in a simple yet powerful format. As well as showing absolute values of metrics for directories, files, classes, methods (and in Java packages and interfaces) we provide the ability to
1. View all Symbols (files, classes, methods etc.) 2. Compare all these graphically by a given metric e.g. size (LOC or SLOC) 3. Set upper and lower bounds to show ‘out of bounds’ symbols 4. View these results in bar charts or kiviat diagrams 5. Export the results for further analysis and presentation
Viewing Symbols As can be seen in figure 2, the graphical interface allows the user to view the symbols that are contained within their project.
Figure 2: File/Class & Method Lists

5
The tabs (figure 2) highlight the two main ways of navigating the contents of a project. The “Project” tab gives a containment tree, which allows symbols to be expanded to show their children. For example, it may show the functions or classes contained within a file. The other tabs (file, class etc.) give a list of symbols of that type. This is especially usefully for comparing symbols against each other to view their metric values side by side.

6
Graphical Comparison The user interface gives two graphical views, which can be used to visually compare metric values for symbols. The first type of graph (figure 3) is the Histogram view. This graph allows the selection of multiple symbols and shows the metric values for the symbols side by side. This gives a visual way of comparing metric values for symbols.
Figure 3: Graphical Metric View
7
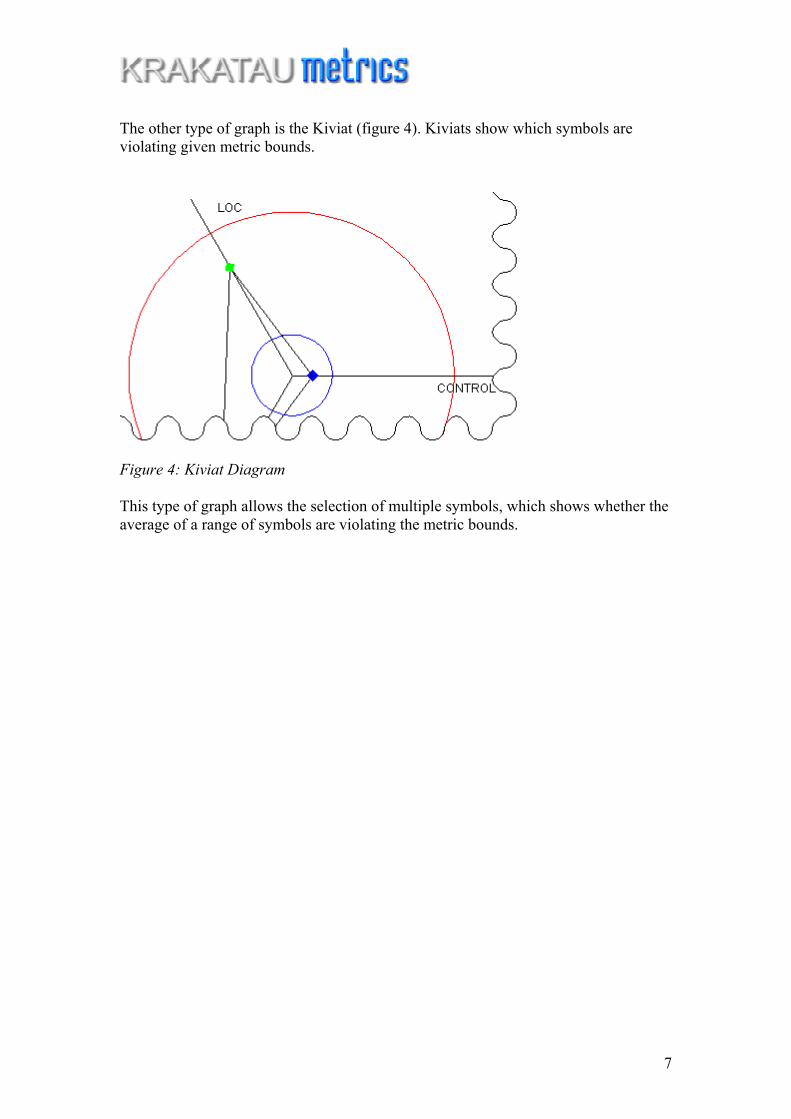
The other type of graph is the Kiviat (figure 4). Kiviats show which symbols are violating given metric bounds.
Figure 4: Kiviat Diagram This type of graph allows the selection of multiple symbols, which shows whether the average of a range of symbols are violating the metric bounds.

8
Setting Bounds Another valuable feature of the Krakatau Graphical Environment is the ability to set bounds for selected metrics. For example the lower bound for LOC could be set to 29 (figure 5). After this has been done, all symbols, which have LOC less than 29 will be flagged. Similarly upper bounds can be set on symbols.
Figure 5: Bounds Selection

9
Reports It is important to present the results in a way that matches each project needs. Krakatau Metrics allows the user to export all the data in the following popular formats.
HTML The HTML reports all feature navigation links in the header and footer (figure 6). They are produced with two or three clicks and are immediately usable. These are ideally suited for publishing on a company intranet.
Figure 6: HTML Report

10
XML The XML reporting facility allows the user to take the metric information from a project and manipulate the results as they please. Either using XSL to transform the results into a custom-made web page or to take into another application and perform further analysis. XML reports are available in Essential Metrics.
Figure 7: XML Report
CSV To allow the user to manipulate, or import the results into another application, the comma-separated report is provided. Figure 8 shows output from Krakatau Professional in Microsoft Excel.

11
Figure 8: CSV Report This allows the ability to perform further calculations based on the metric values. Another common use of exporting the data could to generate graphs. This can be illustrated by the pie chart (figure 9), which was populated by values exported via CSV to Microsoft Excel.
Figure 9: Pie Chart

12
Tools in the Krakatau Suite Power Software offers three Metrics tools to address the following requirements
Krakatau Professional Krakatau Professional is the most comprehensive, commercially supported source code metrics tool for C/C++ and Java projects. Krakatau Professional is scalable to millions of source lines of code and has over 70 source code measurements including Halstead size metrics, complexity and advanced object-oriented metrics. Metrics can be collected at the command line or using our specially designed GUI featuring histograms, kiviat diagrams and numerical reports. Violating metrics reports can be created by setting upper and lower bounds and all metrics can be sorted and selected/deselected. Output is to html (for intranets) or CDF/CSV (for spreadsheets or PC anaylsis applications). Krakatau Professional is aimed at the File, Class, and Method (Java also Interface and Package) level metrics.
Krakatau Project Manager Krakatau Project Manager is the only source code metrics tool that compares two C/C++ or Java projects and shows changed, deleted and added source lines of code between the projects. These changed metrics give essential information about developer activity and can be used to pinpoint problem areas in your source code projects. Krakatau Project Manager was designed and specified by our customers and is ideal for use with leading CMVC tools. Krakatau PM also shows all the 'differences' in the metrics between releases. Krakatau PM is aimed primarily at Project and File (Java also Package) level metrics. Single project metrics are also provided. Krakatau PM also includes a wide range of source code metrics like complexity, Halstead size metrics and numerous LOC metrics. The CHG_SLOC, ADD_SLOC and DEL_SLOC metrics are unique to Power Software and Krakatau PM.

13
Figure 10 shows an example of the widely required CHG_SLOC metric, at File level. CHG_SLOC is the number of changed source lines of code (for project or file) between versions of a project
Figure 10: Changed Source Lines of Code As well as calculating the Changed Metrics, Krakatau PM also highlights the difference in metrics (figure 11) between the two projects. That is, for example, if lines have been added to a file from one version to another, then LOC will be a positive number. Similarly if lines have been removed, LOC will be a negative number. These differences are shown for all of the metrics that Krakatau PM calculates.
Figure 11: Metric Differences

14
Essential Metrics Essential Metrics is an advanced command line metrics tool for C/C++ and Java software projects. Invoked directly at the command line, Essential Metrics delivers numerous popular metrics and allows these to be reported using CSV, HTML and XML. Essential Metrics is ideal for inclusion in your batch/build process for automated metric results. Essential Metrics also has extensive reporting facilities. Figure 12 shows a multiple page HTML “Symbol” report. This type of report gives a alphabetically sorted list of files, classes etc and for each Symbol shows all of the metrics calculated.
Figure 12: Multiple Page HTML Report

15
Architecture In designing the architecture of the Krakatau Metrics range we considered the following a. Many projects have large source code often millions of lines of code (LOC). b. Projects are interested in a variety of different measurements. c. Projects often require new or unique metrics. d. A graphical environment and a command line (batch) tool was required. The following diagram shows the principles of the architecture
Figure 13: Design Overview Notes The architecture is designed to work with any SQL database New metrics can be added with relative ease Krakatau Professional provides OO metrics based on cross-referencing methods Krakatau PM compares two projects to give comparative measurements The graphical environment and reports are written in Java and easy to upgrade The code parsers are optimised for scalability and speed