kpbs give now landing page revamp
TRANSCRIPT

KPBS Give Now Landing Page Revamp
Prepared by Leng Caloh, Interactive Strategies Manager

Before
• 4 options that didn't match logically becomes a cognitive barrier to completing your intended action of donating
• Asking you to make a decision about how you wanted to pay – before you're ready to payDon't
Make Me Think!

We Were Losing Too Many People
42%
55%
45%
57%54%
57%
Feb-2012 Mar-2012 Apr-2012 Jun-2012 Aug-2012 Sep-2012
FM Campaign TV Campaign FM Campaign TV Campaign TV Campaign TV Campaign
Exit Rate from Give Now landing page

Before: Average Time on Page
0:00:53It took nearly a minute to
decide what to do

After: Average Time on Page Cut Nearly in Half to 32 seconds
• Two options: – Monthly
– One-Time
• Sustaining clearly labeled
• Quicker decision: do you want to support us on an ongoing basis, or just once?
• Less confusion
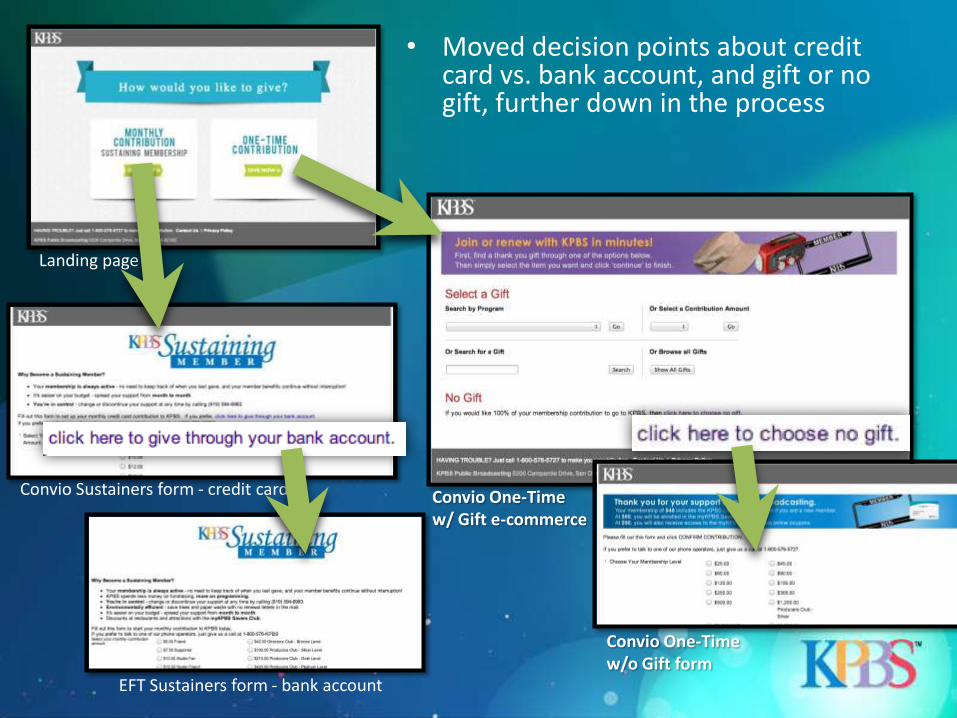
• Moved decision points about credit card vs. bank account, and gift or no gift, further down in the process
Landing page
Convio Sustainers form - credit card
EFT Sustainers form - bank account
Convio One-Time w/ Gift e-commerce
Convio One-Time w/o Gift form

WHAT DO EXIT RATES HAVE TO DO WITH MONEY?

Mo
re M
on
ey
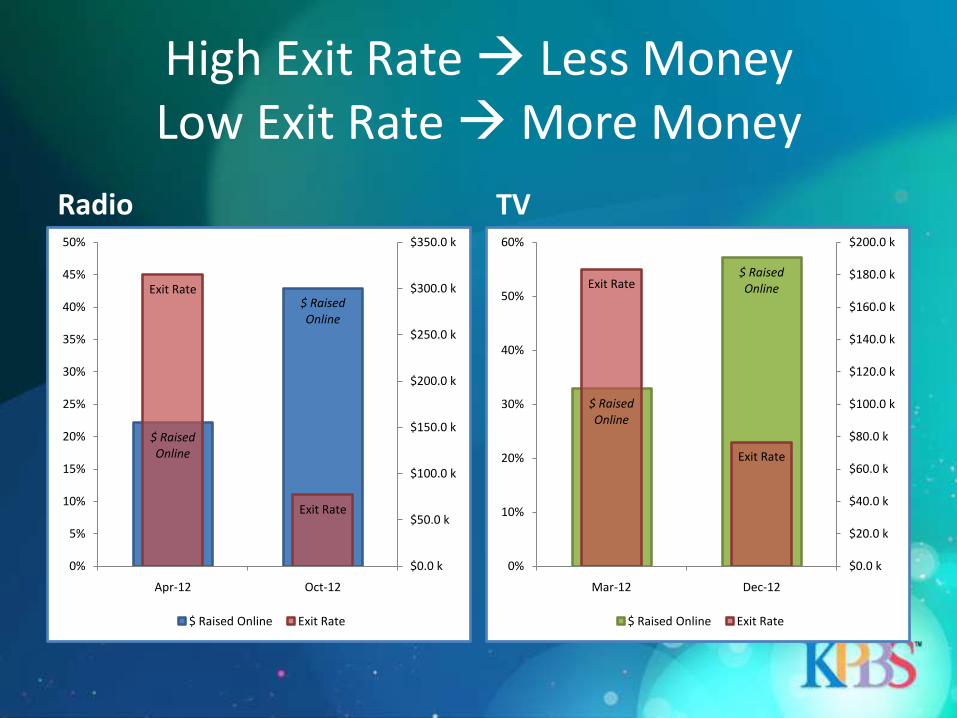
High Exit Rate Less MoneyLow Exit Rate More Money
Radio TV
$ Raised Online
$ Raised Online
Exit Rate
Exit Rate
0%
5%
10%
15%
20%
25%
30%
35%
40%
45%
50%
Apr-12 Oct-12
$0.0 k
$50.0 k
$100.0 k
$150.0 k
$200.0 k
$250.0 k
$300.0 k
$350.0 k
$ Raised Online Exit Rate
$ Raised Online
$ Raised OnlineExit Rate
Exit Rate
0%
10%
20%
30%
40%
50%
60%
Mar-12 Dec-12
$0.0 k
$20.0 k
$40.0 k
$60.0 k
$80.0 k
$100.0 k
$120.0 k
$140.0 k
$160.0 k
$180.0 k
$200.0 k
$ Raised Online Exit Rate

April Radio Campaign October Radio
45% Exit
11%
$155k
$300k
3,000 Unique
pageviews
4,700 Unique
pageviews
October Radio@ April Rates
$247k
4,700 Unique
pageviews
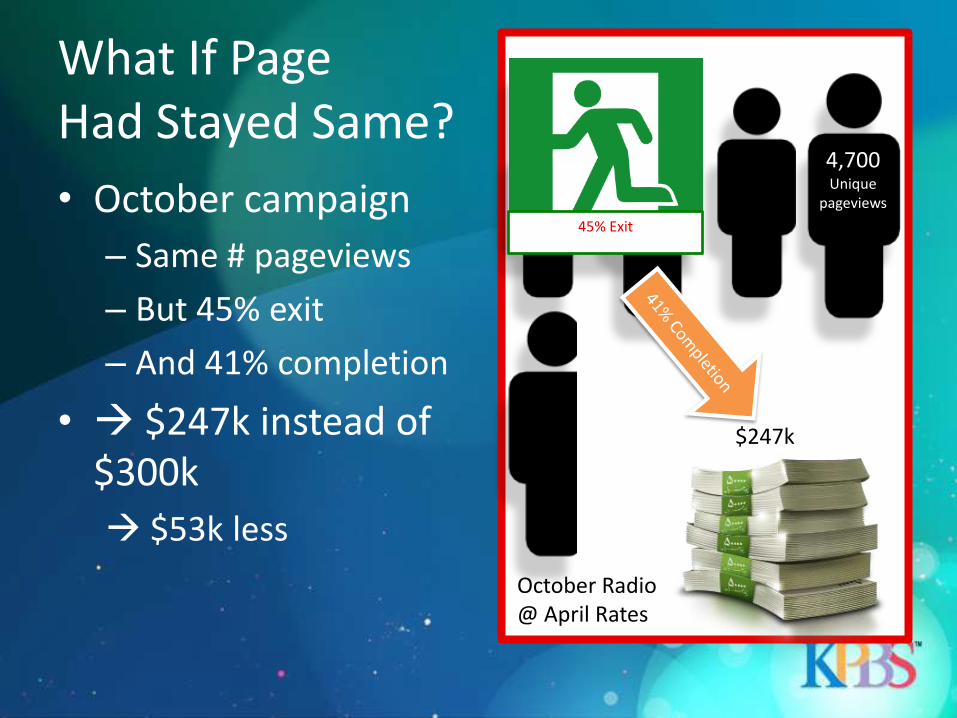
What If Page Had Stayed Same?
• October campaign
– Same # pageviews
– But 45% exit
– And 41% completion
• $247k instead of $300k
$53k less
45% Exit

March TV Campaign December TV
55% Exit
$109k
$190k
2,600 Unique
pageviews
4,000 Unique
pageviews
23% Exit
December TV@ March Rates
$159k
4,000 Unique
pageviews
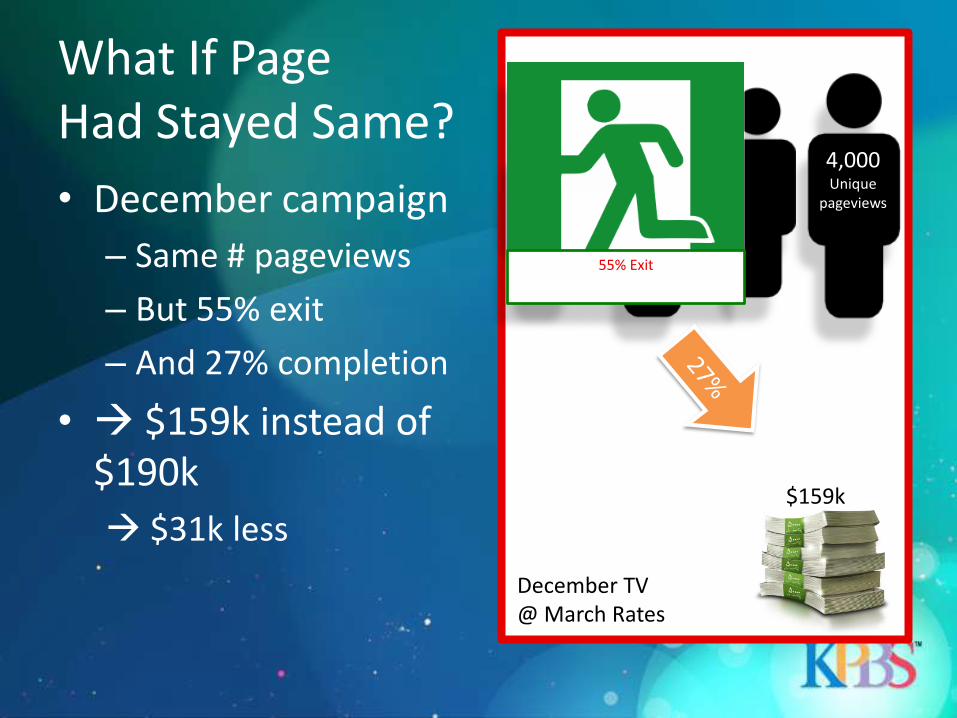
What If Page Had Stayed Same?
• December campaign
– Same # pageviews
– But 55% exit
– And 27% completion
• $159k instead of $190k
$31k less
55% Exit
But wait, there's more!
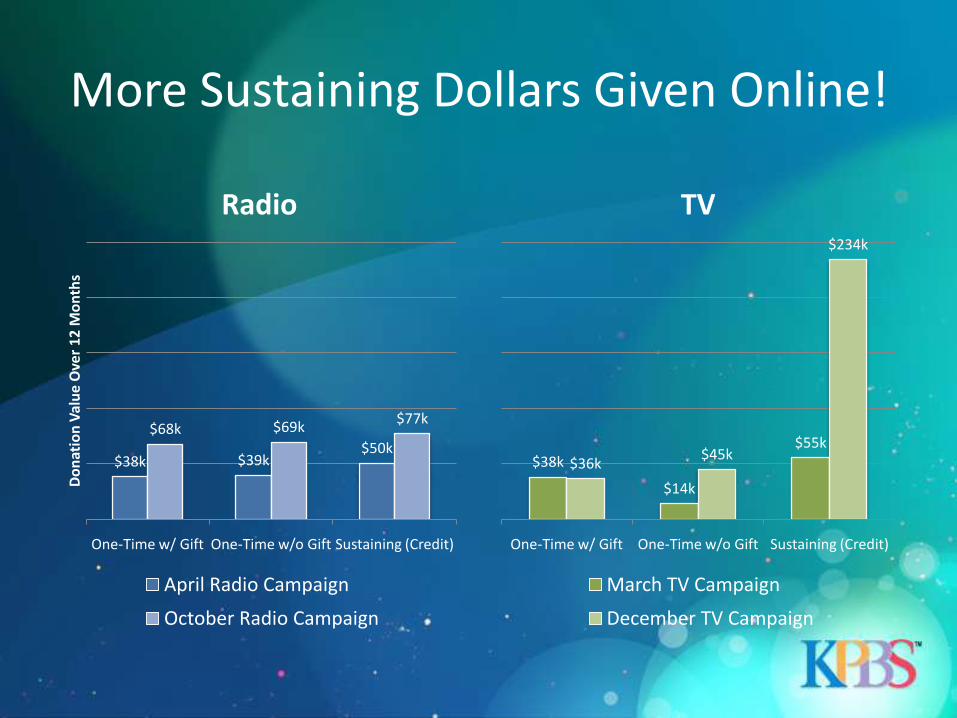
More Sustaining Dollars Given Online!
Radio TV
$38k $39k$50k
$68k $69k$77k
One-Time w/ Gift One-Time w/o Gift Sustaining (Credit)
Do
nat
ion
Val
ue
Ove
r 1
2 M
on
ths
April Radio Campaign
October Radio Campaign
$38k
$14k
$55k
$36k$45k
$234k
One-Time w/ Gift One-Time w/o Gift Sustaining (Credit)
March TV Campaign
December TV Campaign
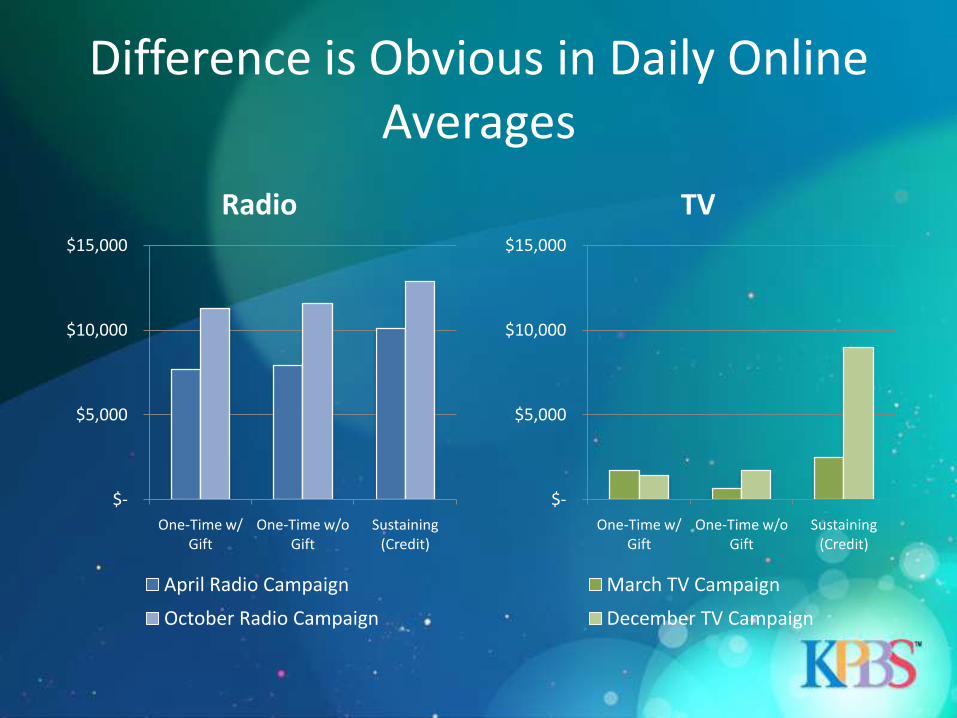
Difference is Obvious in Daily Online Averages
Radio TV
$-
$5,000
$10,000
$15,000
One-Time w/ Gift
One-Time w/o Gift
Sustaining (Credit)
March TV Campaign
December TV Campaign
$-
$5,000
$10,000
$15,000
One-Time w/ Gift
One-Time w/o Gift
Sustaining (Credit)
April Radio Campaign
October Radio Campaign
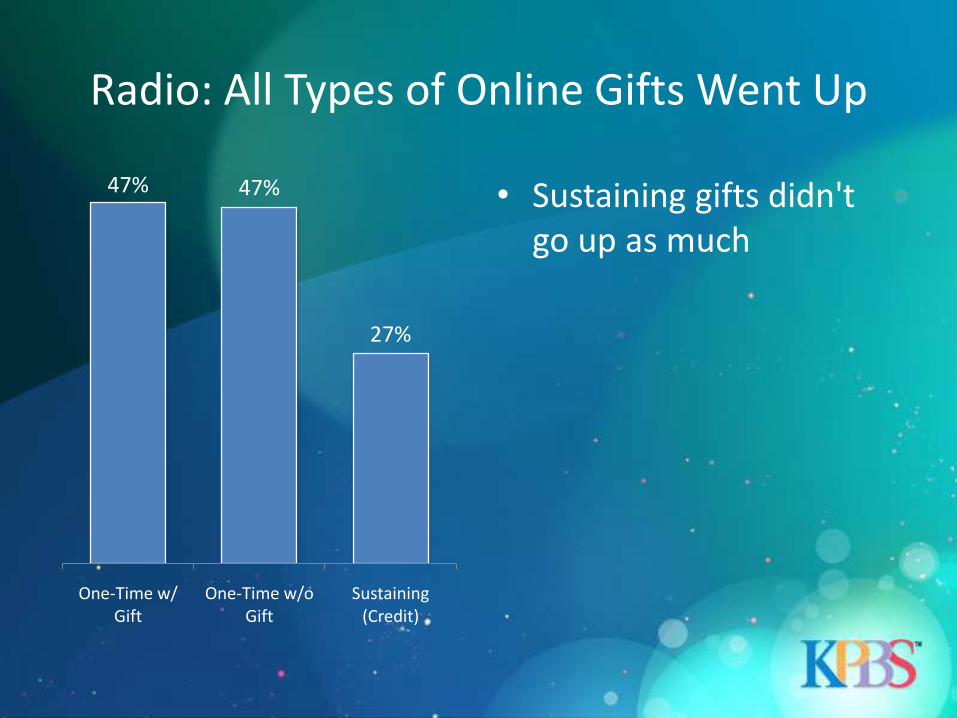
Radio: All Types of Online Gifts Went Up
47% 47%
27%
One-Time w/ Gift
One-Time w/o Gift
Sustaining (Credit)
• Sustaining gifts didn't go up as much

For TV Campaign, Online Sustaining Gifts Increased the Most
• One-Time with Gift went down... But Sustaining went way up
– We effectively reduced the number of people going to the more expensive, less-optimal option (e-commerce model)
– We simplified the choices, and made it easier for our TV audience to support us in an ongoing manner
-19%
173%
259%
One-Time w/ Gift One-Time w/o Gift Sustaining (Credit)
What Does That Mean?
• We made it much easier for our older TV audience to give us money, so we saw dramatic increases
• Our radio audience already knew how to give us money online – so the changes were more incremental

SO HOW WELL DID WE DO WITH THE REVAMPED GIVE NOW LANDING PAGE?

More People Donated Online Than in Previous Campaigns
Radio Up 44% Overall
44%
20%
64%
OVERALL TOTALS
Phone Web
TV Down -6% Overall
-6%-21%
56%
OVERALL TOTALS Phone Web
% CHANGE: Average Number of Daily Pledges by Source
Web up more ...BUT the
Web went up
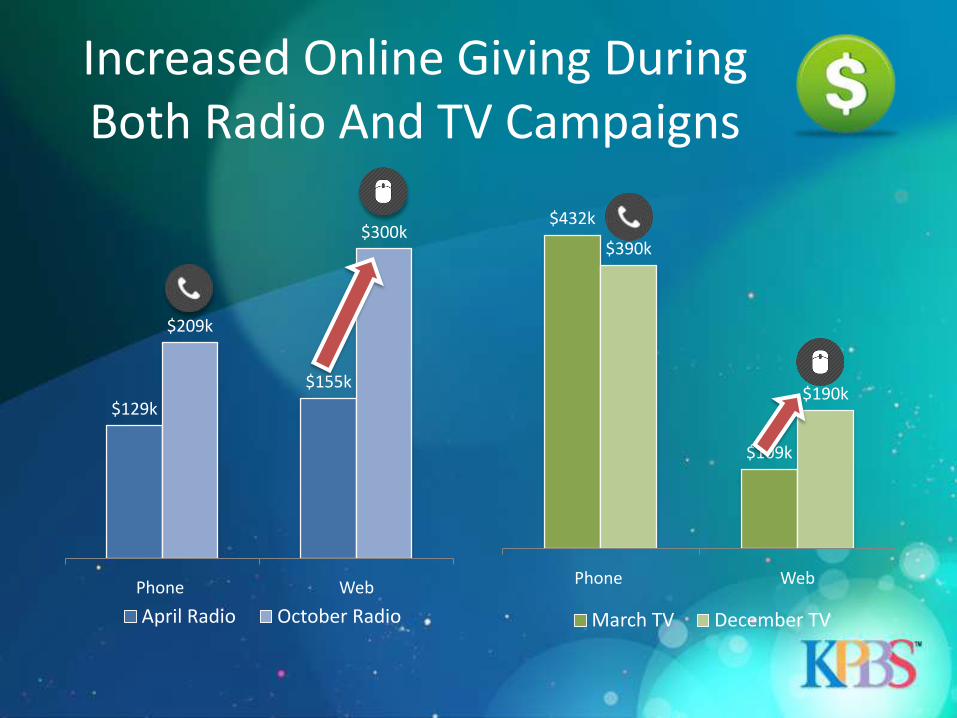
Increased Online Giving During Both Radio And TV Campaigns
$129k
$155k
$209k
$300k
Phone Web
April Radio October Radio
$432k
$109k
$390k
$190k
Phone Web
March TV December TV
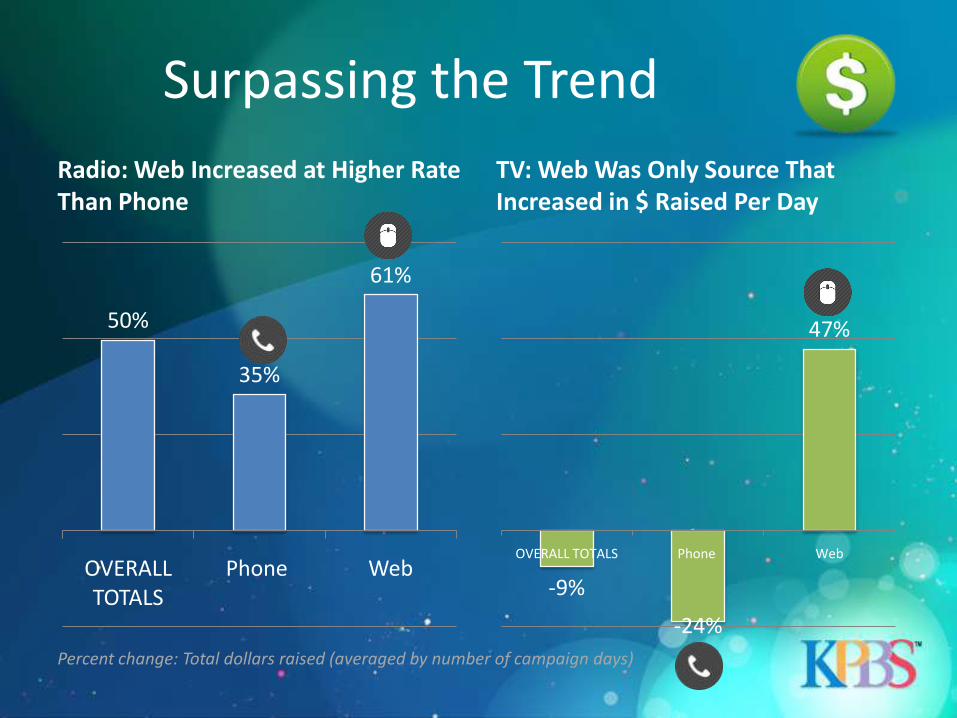
Surpassing the Trend
Radio: Web Increased at Higher Rate Than Phone
50%
35%
61%
OVERALL TOTALS
Phone Web
TV: Web Was Only Source That Increased in $ Raised Per Day
-9%
-24%
47%
OVERALL TOTALS Phone Web
Percent change: Total dollars raised (averaged by number of campaign days)
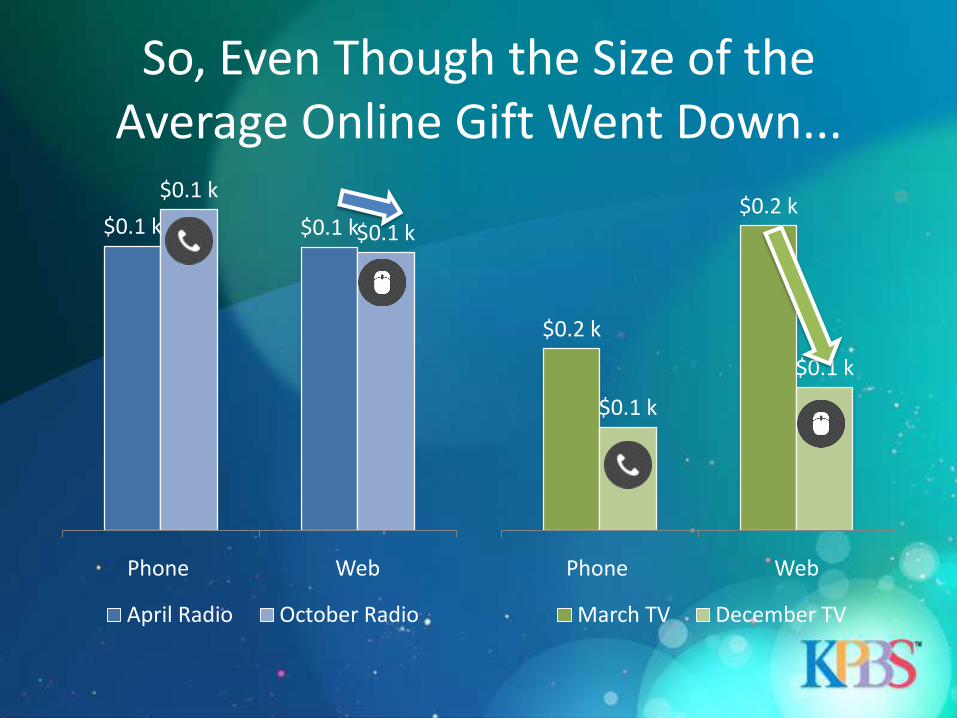
So, Even Though the Size of the Average Online Gift Went Down...
$0.2 k
$0.2 k
$0.1 k
$0.1 k
Phone Web
March TV December TV
$0.1 k $0.1 k
$0.1 k
$0.1 k
Phone Web
April Radio October Radio

... We Brought In More TOTAL Dollars Online ...
• ... Because more people successfully completed their donations online, thanks to an easier-to-use landing page
– Fewer people left the landing page out of confusion (lower exit rate)
– More people went on to donation pages
– AND more people went to the Sustainers form!
Yes!
• Web donations performed significantly better than phone donations, in both Radio and TV campaigns.
We can probably attribute the web's increase in successful pledges to
the Give Now page revamp

Lessons Learned
• Our needs / goals (more bank sustainers) shouldn't drive our design decisions. Our users' goals should drive them. What do our would-be donors want to do? SUPPORT US and GIVE US MONEY. Lead them down that path. Make it as easy as possible.

SO WHAT'S NEXT?

Work on Completion Rates
• While we significantly improved our Exit Rates, our Completion Rates* only went up a few percentage points (9 points for Radio, 5 points for TV).
• We want MORE of our visitors to successfully complete their donations.
*Completion Rate: Ratio of number of donations completed to unique pageviews of the Give Now landing page
45%41%
11%
50%
Exit Rate Completion Rate
April Radio October Radio
55%
27%23%
32%
Exit Rate Completion Rate
March TV December TV
How?
• Target Our Audiences– Radio and TV donors are
different• Age demographics
• Tech savviness
• Motivations
– So let's tailor message and design of the landing page to the audience we're reaching out to
• Identify how people are navigating the ecommerce store and make it easier for them to find what they want– Identify where people
are dropping off in the donation process and improve "sign posts" to move them along• Analytics
• Usability studies