kozminski university composite index of balanced economic ... · 3 rather use it as one of several...
TRANSCRIPT

1
Kozminski University Composite Index of Balanced Economic and Social Development:
Its Construction and Application in Times of Uncertainty,
Poland 1999-2015
Andrzej K. Koźmiński, Adam Noga, Katarzyna Piotrowska, Krzysztof Zagórski
Kozminski University
Abstract
Results of the interdisciplinary research on cyclical transformations of the Polish economy and
society are presented here. A new composite Kozminski University Index of Balanced
Economic and Social Development (IBESD) is proposed and applied to analyse and predict
socio-economic changes in Poland during 1999-2015 period. This is done in “beyond GDP”
paradigm, since traditional analyses of GDP, inflation, state budget etc., if analysed separately,
are of little use for understanding socio-economic conditions and do not enable to predict
their changes. We distinguish four groups of detailed indicators: two economic (external and
internal) and two social (concerning both objective and subjective current situation, and
concerning public expectations for the future). They are used to construct four middle level
indexes, which are subsequently aggregated into the general IBESD index. The congruency
between four middle level indexes are interpreted in terms of balance relevant for future
socio-economic development. The validity of index is proven by its high correlation with
psychological conditions of the society. The past socio-economic development is described
and the prognosis is made, based on a newly designed statistical model. The results are
interpreted in terms of balanced development and fragility versus antifragility of socio-
economic system.
Key words: socio-economic development, index, economic indicators, social indicators,
balanced development, evaluations, predictions, well-being, fragility.
Background
Until the second half of the twentieth century, the almost exclusively used general indicator of socio-economic development was the size and rate of growth of national income, more particularly Gross Domestic Product (usually per capita). Simon Kuznets, one of the forerunners of modern analysis of economic development, argued already 80 years ago in a report to the US Senate that this indicator was too simplistic and one-sided. „The valuable capacity of the human mind to simplify a complex situation in a compact characterization becomes dangerous when not controlled in terms of definitely stated criteria. With quantitative measurements especially, the definiteness of the result suggests, often misleadingly, a precision and simplicity in the outlines of the object measured. Measurements of national income are subject to this type of illusion and resulting abuse, especially since they deal with matters that are the center of conflict of opposing social groups where the effectiveness of an argument is often contingent upon oversimplification” (Kuznets 1934: 5-6). Despite this, the serious work

2
towards improving or replacing GDP started only around 50 years ago, in result of an interest in social indicators (Bauer 1966; Moser 1973) and in integrated system of social statistics that grew at an international level (UN 1975), including Poland (Zagórski 1972, 1972a, 1975). Previously, the work of Richard Stone was aimed at improving the system of national accounts and applying this method to socio-demographic accounts (Stone, Brown 1962; Stone 1966). Quickly, this work resulted in proposals for the construction of complex indexes of social development. The pioneer of this was the research programme of the UNRISD (McGranahan et al. 1970). More and more such attempts continue to appear, as well as works extending previous research programmes (Constanza et al. 2009 ; Espinoza, Somarriba Arechvala 2013 ; Madonia et al, 2013; NEF 2009; OECD 2013; Reig-Martinez 2013; Shopelmann et al. 2010 ; UNDP 2013). Recently, in addition to UN (particularly UNDP) and OECD, also state authorities express a growing interest in country-specific complex measures of socio-economic development, e.g. French President (Stiglitz et al. 2013), German Bundestag (Gisselmann et al. 2013) and Italian Parliament (BES 2014). The first such project was initiated a long-time ago by King of Bhutan. (Pennock, Ura 2011, Ura et al. 2012). Last economic crisis has caused growing interest in complex approach to development, with an emphasize on people’s well-being (Guardiola et.al. 2014; Samarriba Arechavala et.al. 2014).
Some of these projects only concern social indicators, whilst some others combine social and economic ones. Our work is in line with the ‘beyond GDP’ paradigm (Constanza et al. 2009; Fleurbaey, Blanchet, 2013; Thiry, 2014). We understood this paradigm as advocating to supplement rather than to disregard the measurements of national income that have up till now ignored certain economic issues and subjective as well as objective aspects of social conditions (see also Guardiola et.al. 2014). After separately analysing economic and social aspects of development (Zagorski 2011), we propose a composite Kozminski University Index of Balanced Economic and Social Development (further called IBESD) that includes GDP as one of its many components and allows for comprehensive analyses of socio-economic changes.
The preliminary results of our work, including preliminary version of IBESD, were already presented (Kozminski et.al., 2014). The project is still in progress. Our prime aim is to substantially improve the initially presented index, to analyse and to predict changes in Polish economy and society. We wish to advance a theory, method of index construction, analysis of current trends and to formulate a short-term prognosis of changes. The earlier analyses have uncovered that the phases of socio-economic cycles, as measured by IBESD, have their own beginning and end that are different from those of classical economic fluctuations. Our index should show how and why levels and specific configurations of four middle level indexes may cause an economic collapse or instigate growth.
Theoretical Foundations
Our research on balanced socio-economic development is based upon three complementary conceptions:
1. Measuring socio-economic development through the use of indicators that go beyond the index of gross domestic product. However, we do not disregard GDP but

3
rather use it as one of several indicators constituting the general index, and we take into consideration a larger number of economic and social aspects;
2. We consider balance of the socio-economic system as a condition of its controllability, that is its susceptibility to the processes of government and management;
3. That should lead to building the system’s anti-fragility, that is its resistance to difficult or impossible to predict imbalances. This aim is, however, beyond the scope of our present article.
The idea of a balanced economic and social development is based upon the concept of functional equilibrium as a condition for controlling a complex system and for its sustainability and development in a turbulent environment. This concept of equilibrium has been applied (or more often has been suggested) by many authors, in order to explain the dynamics of organisations (March 1981; Koźmiński, Obłój 1989) and larger, more complex, systems (Weintraub 1974; Koźmiński 1995).
The concept of equilibrium rests upon the assumption that a certain minimum level of balance is needed to steer the system Imbalances occur when, according to the theory of Liapunov (1992), individual elements excessively diverge from one another. In other words the partial equilibrium of the system is disrupted, which is reflected in the growth of standard deviations. Imbalances may pull the general index both up and down and have a positive as well as a negative effect. However, when imbalances grow over a long period of time, then this threatens the controllability of the system and its susceptibility to managerial impulses. In order to maintain sufficient control it is necessary to use the relationship between the equilibrium and optimal components (not necessarily entirely) to compensate for a fall of one another. In this way, the statistical picture of socio-economic equilibrium becomes a kind of “dashboard” for politicians, with green, orange and red indicators, showing the diagnosis and suggesting counteractive measures. Such an approach avoids economic-technocratic and social ‘inflection’.
The balance (understood as equilibrium, i.e. mutual adjustment and agreement measured as co-variation) should occur between four domains of development embraced by IBESD:
- external economic, - internal economic, - public expectations, - objective and subjective current social situation.
We have been able to choose the statistical indicators of these four domains of development, trace their changes and degree of balance (co-variation and agreement) in the period 1999-2012. The four middle level composite indices, which characterise the four aspects of socio-economic development, are collapsed into the general (synthetic) index of socio-economic development (IBESD). We have obtained empirical confirmation that this index reflects the state of not only the economy but also social well-being, as it is strongly negatively correlated with the number

4
of suicides and positively with the good psychological condition of the Polish population, the latter being measured year by year by the Public Opinion Research Centre. (CBOS, 2013). We have used these two indicators as an ultimate proof of IBESD validity consistently with the idea of socio-psychological flourishing. The flourishing is understood as mental health, in opposition to mental disorders and anxiety. It constitutes the crucial feature of good functioning socio-economic system and well-being of individuals (Diener et al. 2010; Huppert, So 2013; Hone et al. 2014).
Our interpretations of the data and the results stem from analysing changes in developmental processes and referring them to the ideas of fragility and anti-fragility. (Taleb, 2013) We also in particular pay attention to the issue of balance (or lack thereof) between the different aspects of development.
The idea of antifragility arose in response to the phenomenon of growing “general uncertainty”. Such uncertainty means that it is not possible to effectively forecast the key parameters for the survival and development of all socio-economic systems – ranging from families, to nations, and their ending of relations. This is caused, according to Taleb, by “black swans”. He understands “black swans” as important phenomena which essentially change the functioning parameters of a system, and which are highly unlikely and therefore difficult or impossible to predict. (Taleb 2007). Some authors tend to look for their causes in games conducted by actors within the system. (np.: Crozier, Friedberg 1982; Koźmiński, Zawiślak 1979; Koźmiński 2014) There are numerous examples, both within and outside the business world, that confirm this approach.
It is reasonable to suppose that “black swans” are the result of an unforeseeable disruption of the system's fragile balance, i.e. the alignment of small fluctuations (Lyapunov, 1992) between conflicting forces operating in the systems. The effects of these are entirely subject to unexpected amplifications, consistent with the theory of catastrophes (Thom, 1991).
We have built a statistical function, which describes dynamics of the synthetic index of socio-economic development (IBESD). It allows not only for the description of current trends, but also for forecasting its change by anticipating the points where an excessive drift of the four middle level indicators occur. Although the beginning and the acceleration of growth demand a certain loss of socio-economic balance, it can result in a loss of control over the system or, as suggested by Taleb (2013), in an increase in its fragility, if this loss of balance is too long and far-reaching. There is a risk in such a situation that the index characterising overall socio-economic development, will decline. More precisely, the danger of decline may occur in condition of imbalance growing after a period of development. There is another side of the coin in this respect, since some imbalance occurring after a period of socio-economic decline may result in future development. Thus, we believe that imbalance may incur both negative and positive changes in developmental trends. However, attempting prophecy or a simple extrapolation of known trends is a risky business. While forecasting, we settle for observing the growing fragility of the system and identifying the important determinants of this phenomenon. In formulating conclusions from our research, we concentrate on the “anti-fragility” of the system and its ability to overcome a looming crisis, whenever and from wherever it may come.

5
Constructing the Index
A primary and unique advantage of the ALK Index is its synthetic character, enabling it to simultaneously measure:
• the achieved level civilisation, covering a wealth of socio-economic aspects;
• the system’s functional balance assessed by the degree of convergence measured as standard deviation of the four basic dimensions.
As already said, our synthetic index includes four socio-demographic dimensions, two economic and two social ones. Each of these is described by a set of indicators drawn from publicly available statistics and from public opinion research. Detailed indicators obtained from these sources are then aggregated into four middle-level indexes, which – in turn – are aggregated into a general index (IBESD).
Previous analysis suggests that changes in international economic relations and the global economic environment come before those occurring domestically. We also discovered that changes in public opinion about expected future changes come ahead of subsequent evaluations and actual objective social change. (Koźmiński et al. 2014). Therefore, economic indicators have been divided into external (concerning international context of the Polish economy) and internal (describing various aspects of domestin economy). Social indicators have been grouped into the categories of social expectations (public hopes and fears concerning various aspects of economic and social life) and current social situation (subjective evaluations and objective state of socio-economic conditions). This division is displayed in Table 1.
We have placed the social mood (both in terms of assessment and expectations) alongside the objective social and economic elements, within the concept of socio-economic development. This has been done for two reasons. Firstly, because economic development cannot be treated as an aim in itself, but as a means to improve the “human condition”, which includes satisfaction, happiness, optimism, etc. This refers to the English term “well-being”. Secondly, social, political and economic moods influence individual and group behaviour, which in turn shape the state of the economy and society. There is a clear connection between the subjective and objective aspects of social, political and economic life. If this is disregarded then one cannot fully understand the dynamics of the economy and society.
Table 1. Four Categories of Socio-Economic Indicators
External/Leading Internal/Current

6
Economic “Economic External”
(International economic
relations)
“Internal Economic”
(Internal economic
situation)
Social “Social Expectations”
(Public expectations of
changes)
„Social Current Situation”
(Public assessment of
current situation and
current statistical indicators)
The initial pre-selection of simple indicators, which together formed the initial four middle level indexes, was largely intuitive (Kozminski et al., 2014). It was therefore necessary to analytically and statistically verify the original list. The statistical verification was done first through a correlation analysis, then the “Cronbach’s α” was applied to measure the internal consistency of the four synthetic indexes and served as a final criterion for including particular indicators in them. The final list of the indicators is as follows:
1. External Economic Indicators (α = .788)
- size of foreign direct investment (FDI) in Poland, - WIG 20 (Warsaw Stock Exchange index), - volume of import, - volume of export, - Euro/PLN exchange rate (inverted), - spread (difference) between the Polish interest rate on 10-year bonds and German
bonds (inverted) - spread between the Polish interest rate on 10-year bonds and US bonds USA
(inverted)
2. Internal Economic Indicators (α = 0,839)
- production of electricity, - number of dwellings completed, - increase in real-wages, - Gross Domestic Product, - size of consumption, - size of accumulation, - gross business profitability, - size of public debt to GDP (inverted) - inflation rate (inverted), - public debt (% of GDP)
3. Social expectations (predictions)
(α = 0,966)

7
The ratio of positive (“will improve”) to negative (“will deteriorate”) answers to the questions whether in a year time the situation will improve or deteriorate in respect to:
- anticipated changes in political situation in Poland, - anticipated changes in the economic situation in Poland, - anticipated changes in the overall situation in Poland, - anticipated changes in the workplace, - “Will your family live better or worse in a year's time?” - “Are you afraid that you may lose your job or not?”.
4. Current social situation
(α = 0,965) - attitude to the government (ratio of the number of supporters to opponents), - assessment of the political situation (ratio of those with 'positive' against 'negative'
opinions), - assessment of the economic situation (ratio of those with 'positive' against 'negative'
opinions), - how does the family presently live (ratio of those answering 'positively' against
'negatively'), - assessment of situation in the workplace (ratio of those with 'positive' against
'negative' opinions), - business confidence index, - people below extreme poverty line (inverted), - state budget expenditure on social welfare (%GDP) (inverted), - state budget expenditure on health (% GDP), - youth (15-24) unemployment (inverted), - access to Internet (% households), - birth rate, - infant deaths (reversed), - ratio of the population of pre-productive age compared to those of post-productive
age, - people aged 18-59 living in households in which no one is employed (%) (inverted) - number of tertiary education graduates (public and private combined) - number of scientific-research employees, - young people not continuing education (%) (inverted), - number of homicides (inverted), - number of thefts (inverted), - number of Polish students who went abroad on Erasmus grant, - number of foreign students in tertiary education institutions.
The standardised value was calculated for each of these indicators in the period 1999-2012 (later data were not available). The average value of the standardised indicators was then calculated for each year for the four different domains covered by middle level indexes. The
8
averages of the four middle level indexes, calculated for each year, make up the value of the general Kozminski University Index of Balanced Economic and Social Development (IBESD).
Although the time-scale during which we observed the dynamics of our indicators is short, it still gives a valuable picture. This is because it covers tumultuous changes occurred during the 1999-2012 period, including the 2007 outbreak of the most serious financial and economic world crisis since 1929. Thus, the index underwent a severe stress test.
The General Description of the Index and its Trend
As mentioned, the high convergence of the highlighted four aspects of development allows for the calculation of the general IBESD as the average of the four middle level indexes after their standardization. High correlations between all four middle level indexes in 14 years treated as 14 observations are shown in Table 2.
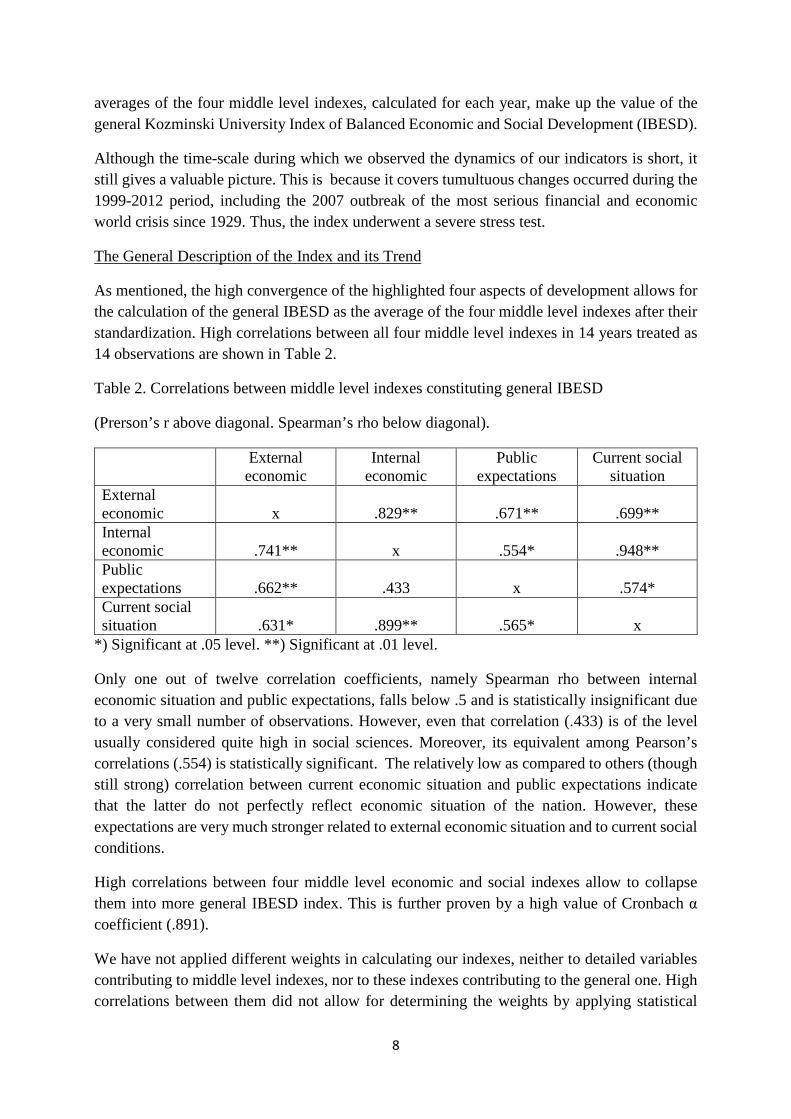
Table 2. Correlations between middle level indexes constituting general IBESD
(Prerson’s r above diagonal. Spearman’s rho below diagonal).
External economic
Internal economic
Public expectations
Current social situation
External economic
x
.829**
.671**
.699**
Internal economic
.741**
x
.554*
.948**
Public expectations
.662**
.433
x
.574*
Current social situation
.631*
.899**
.565*
x
*) Significant at .05 level. **) Significant at .01 level.
Only one out of twelve correlation coefficients, namely Spearman rho between internal economic situation and public expectations, falls below .5 and is statistically insignificant due to a very small number of observations. However, even that correlation (.433) is of the level usually considered quite high in social sciences. Moreover, its equivalent among Pearson’s correlations (.554) is statistically significant. The relatively low as compared to others (though still strong) correlation between current economic situation and public expectations indicate that the latter do not perfectly reflect economic situation of the nation. However, these expectations are very much stronger related to external economic situation and to current social conditions.
High correlations between four middle level economic and social indexes allow to collapse them into more general IBESD index. This is further proven by a high value of Cronbach α coefficient (.891).
We have not applied different weights in calculating our indexes, neither to detailed variables contributing to middle level indexes, nor to these indexes contributing to the general one. High correlations between them did not allow for determining the weights by applying statistical

9
criteria, such as often used factor analysis, the results of which are very unstable when colinearity occurs. Moreover, in substantive terms, high correlations between components suggest their more or less equal contribution to the higher level index. On the other hand, we restrained ourselves from subjectively and intuitively assigning different weights, especially to middle level indexes which we consider to be equally important. The changes in four middle level indexes and their means constituting the IBESD are presented in Figure 1.
Figure 1. The four standardized components of Kozminski University Index of Balanced
Economic and Social Development (IBESD), Poland 1999-2012.
It is clearly seen that the changes occurring in Poland take place in a similar manner for all the four dimensions of development but with different amplitude. Changes in the general index, calculated as an average, illustrate well the course of socio-economic development in Poland. An important point of clarification here is needed. Economists and politicians emphasise the steady although slow GDP growth in Poland during and after the world financial crisis. However, the overall socio-economic index shows a slight downward trend since 2007, with some fluctuations. This downward trend is caused mostly by social trends, especially by worsening public expectations, and – to a much lesser extent – by external economic circumstances (international economic environment), while current economic situation measured by a middle level composite index improves slightly since 2009 after temporary decline.
-1,5
-1
-0,5
0
0,5
1
1,5
2
2,5
1999 2000 2001 2002 2003 2004 2005 2006 2007 2008 2009 2010 2011 2012
Internal economic
factors
Leading (external)
ecomnomic factors
Social expectations
Current social situation
KU Index (IBESD)

10
This stands in contradiction to the general conviction of economists that the economic growth forms the social mood, as “the being determines the feelings (consciousness)”. There is no contradiction here however, since GDP is only one of economic indicators considered, whilst IBESD also applies to the social situation. This includes unemployment, poverty, the deteriorating demographic situation, insufficient social policy outcomes and the worsening economic and political mood. A slight downward trend has been observed in recent years, which is not revealed by one-sided indicators like GDP, which affects the overall socio-economic situation and not only the production of goods and services. It is also worth underlining, that during the past few years the growth in individual consumption, using one’s own means, has essentially stagnated and is clearly below the GDP growth rate. The continuous though slow growth of GDP during the world crisis was possible in Poland probably because of economizing on social expenditures and curbing individual consumption. These could lead to a worsening of the social mood, particularly when it comes to forecasting the future.
The data presented in Figure 1 indicate that the variability of middle level index of public expectations, which can be interpreted in terms of optimism and pessimism, is much greater than the variability of the other three synthetic components of the index. This is the reason of relatively low (though still not low in absolute terms) correlation between public expectations and economic situation, which we have already stressed. Such phenomenon is not unique to Poland. E. Noelle-Neumann (1989) presents German data for a near forty years period, showing that the degree of optimism and pessimism of society (drawn from answers to the question: “Do you look to next year with hope or fear?”), changes with greater amplitude than the economic situation defined as the GDP growth. Noelle-Neumann also suggests that changes in the level of optimism-pessimism often occur ahead of changes in GDP. However, if we count the years in which economic trends reversed (a phase of deterioration followed a period of improvement or vice-versa) then we find that social expectations changed ahead of GDP 4 times, were in line 6 times and happened after GDP change also 6 times. They moved in the same direction during remaining years. Irrespective of expectations being justly or wrongly treated as “leading indicators”, an excessive reaction of public opinion to an objective economic situation, observed both in Poland and Germany, has its counterpart in what is sometimes called “herd behaviour” in the stock-market, whereby players over-react to economic news.
Our finding of greater changes in social expectations than in the three remaining components of the index and in its overall value, shows the resolution and practical usefulness of the IBESD for politicians. As shown in Figure 2, the difference between GDP and the value of the IBESD has been recently increasing.
Two slowdowns (albeit not recessions) in socio-economic development occurred in Poland during the investigated period: one weaker (2000-2003) and one harsher (2008-2012), although this second one continues to this day.
Figure 2. GDP and Kozminski University Index of Balanced Economic and Social Development
(IBESD), Poland 1999-2012 (standardised)

11
The composite IBESD index accurately shows these slowdowns, which in itself in not a revelation although their social consequences are interesting. In the first case, the IBESD shows the slowdown while GDP was still growing (by 3.9% in 2003); and in the second case we have a flattening out of IBESD with minor fluctuations and tendency to decline despite the fact that GDP grew by 5.1% in 2008, 3.9% in 2010 and 4.3% in 2011. The ability to show this discrepancy is another valuable feature of the synthetic index, which much better indicates the state of society and the economy than the GDP, that ignores the social conditions.
IBESD and psychological conditions of the society In line with what we wrote in our previous work (Koźmiński et al. 2014: 384), the primary aim of economic and social development should be the improvement of people’s well-being rather than growth of GDP or any similar economic indicator. When examining the relevance of the Kozminski University Index of Balanced Economic and Social Development we should check whether its improvement results in a better life and a deterioration in a worse life of the society. It is thus important to find a distinct measure of well-being, that does not fall within the scope of our index. The concept of “flourishing” used by Diener et al. (2010), Huppert and So (2013) and Hone et al. (2014) emphasizes importance of mental health as opposed to disorder and anxiety. We take a similar approach, using representative surveys of Public Opinion Research Center (CBOS 2013) which annually measure the mental well-being of Poles. Mental well-being is measured by a short psychological test concerning people's own declared emotions and therefore is to a large degree subjective. It is calculated as a mean of interval scales constituting answers for nine questions about frequency of such positive feelings as being proud of one’s own achievement, curious and interested in something new, glad that something went well in life etc. and such negative feelings (inversely valued) as being nervous and irritated, helpless, angry, unhappy etc. As an objective indictor of similar nature we have adopted the inverted
-1,5
-1
-0,5
0
0,5
1
1,5
2
1999 2000 2001 2002 2003 2004 2005 2006 2007 2008 2009 2010 2011 2012
GDP KU Index (IBESD)

12
suicide rate (the less suicides the better). As shown in previous studies, this is a very good indicator of socio-psychological condition of the contemporary Polish society (Jarosz, 2004). It is not necessary to quote classic writings by Durkheim here. A comparison of these two indicators after their standardisation reveals a high level of convergence, thus allowing for calculation of a synthetic index representing people's psychological well-being (Figure 3). The next step should therefore be to examine how changes in IBESD influence psychological condition of the society (Figure 4).
Figure 3. Changes in psychological condition of Poles, 1999–2012
-2
-1,5
-1
-0,5
0
0,5
1
1,5
2
2,5
1999 2000 2001 2002 2003 2004 2005 2006 2007 2008 2009 2010 2011 2012
Mental Well-Being
Number of Suicides (inverted)
Psychological Condition of Polish Society

13
Figure 4. IBESD and the psychological condition of Poles, 1999–2012.
Figure 4 shows an extremely strong correlation between IBESD and the psychological condition treated as the ultimate measure of well-being (Pearson’s r = .952; Spearman’s rho = .908). This represents the best confirmation for the relevance and validity of IBESD. Irrespective of that, the larger variability in people's psychological condition compared to the general socio-economic situation should be emphasised. This once again proves the previously mentioned hyper-sensitivity of people to changes in the socio-economic situation. Poles are prone to great mood swings. This is perhaps the consequence of historically accumulated experiences.
Socio-economic balance
At this point, we need to return to the concept of balanced development. The standard deviation of the four IBESD components are taken as a measure of this balance. In accordance to our hypothesis, the changes from growth to decline, or vice versa, are taking place in time of increase in the standard deviation and thus in conditions of imbalance. The period of relative stagnation, or at least a slowdown in growth, at the beginning of the 21st century, was characterised by high balance. However, the beginning of economic crisis 2007-09 was marked by a rising imbalance. In 2007, the standard deviation crossed .65. That indicates a very high imbalance, and so the possibility of a worsening of the general socio-economic situation in the following years or at best a halting of growth. We should consider whether a similar rapid increase of imbalance in 2012 will lead again to a reversal in the trend and an overall improvement of the situation in the forthcoming years. We can attempt to give an answer to this question based on our statistical model, presented below in the section devoted to forecasting.
-1,5
-1
-0,5
0
0,5
1
1,5
2
1999 2000 2001 2002 2003 2004 2005 2006 2007 2008 2009 2010 2011 2012
Psychological Condition of Polish Society KU Index (IBESD)

14
Figure 5. Changes in IBESD and standard deviations of its four components, Poland 1999-2012.
Leading and lagging indexes
The balance or its lack can be interpreted in terms of leading and lagging indicators. Let us examine first the congruence between middle level economic indexes. As expected, there is a strong correlation between the internal (domestic) and external (international) aspects of economic development. The correlation coefficients for 14 pairs of observations are very high (Pearson’s r = 0,829 , Spearman’s rho = 0,741). This can be seen clearly in Table 2 and Figure 6.
Despite the expected high correlation, the graph also shows the leading nature of the external against the lagging nature of internal indicator of the country’s economy. The domestic economic situation in Poland began to quickly improve since 2002, while the external situation showed earlier improvement during 1999-2002. The temporary worsening of external conditions in 2003, was followed by a small slowing of internal growth in 2004. The next few years of improvement began internationally in 2004, whilst this started domestically a year later. The external situation was shaken in 2008 by the outbreak of the financial crisis, whilst its effect domestically was much less harsh and occurred in 2009. The slight improvement of external economic conditions in 2009 led to a similar improvement domestically a year later. This internal improvement was maintained throughout the next few years, despite some minor fluctuations externally, proving that there has been at least a partial decoupling of the domestic economy from its international context. All in all, it is clear that the external economic factors pulled up and down the internal economic ones.
-1,5
-1
-0,5
0
0,5
1
1,5
2
1999 2000 2001 2002 2003 2004 2005 2006 2007 2008 2009 2010 2011 2012
KU Index (IBESD) +/- 1 SD

15
Figure 6. Leading (external) and current (internal) indicators of economic aspects of development, Poland 1999-2012
Slightly more complicated is the question of the leading character of social expectations. Changes in both middle level social indexes show an expected strong correlation. The Pearson’s correlation coefficient is .574 and the Spearman's rho .565 (see Table 2 and Figure 7), but the question of leading index is not very clear.
Figure 7. Social expectations and current social situation as two aspects of development,
1999-2012.
-1,5
-1
-0,5
0
0,5
1
1999 2000 2001 2002 2003 2004 2005 2006 2007 2008 2009 2010 2011 2012
Current (internal) economic factors Leading (external) ecomnomic factors
-1,5
-1
-0,5
0
0,5
1
1,5
2
1999 2000 2001 2002 2003 2004 2005 2006 2007 2008 2009 2010 2011 2012
Social expectations Current social situation

16
The improvement in public expectations since 2004 began two years after the current evaluations and actual social situation started to improve in 2002. Thus, expectations seemed to be following rather than leading present situation. Subsequently, the degree of long lasting optimism for the future began to quickly fall in 2008, along with news of the global crisis and its expected imminent arrival in Poland. This was reflected in a much weaker fall in assessments of the current situation and also in objective social indicators a year later, i.e. in 2009. In this case, we can talk about the leading character of public expectations. The next turn from negative to positive change took place in 2010 in respect of both the expectations and the current conditions. A year later, also both these aspects have changed together, this time for worse. Thus, public expectations not always form a leading index preceding the index characterizing present situation. Expectations also do not constitute lagging index, following real changes. There is no regularity in this respect contrary to already mentioned Noelle-Neumann (1984) suggestion. There is, however, one regularity which may have very serious consequences for socio-economic processes: irrespective of changing earlier, simultaneously or later than actual social conditions, public expectations show – in turbulent times at least – much greater amplitude of fluctuations than the situation which they concern. Fears and hopes are formed by overreactions to actual conditions, being much influenced by the news. Good news about Polish economy before the crisis resulted in optimistic public expectations growing much faster than the improvement of jointly considered public evaluations of existing social conditions and their objective indicators. As clearly shown by Figure 7, sensational news about the coming crisis in 2007 caused decline in formerly too optimistic expectations much faster than it would be justified by negligible deterioration of social conditions. The subsequent news about Poland being a “green island” not affected by the crisis resulted in optimistic expectations rising much faster than changes in actual social conditions. Finally, the latest news about necessity to cut spending from state budget, particularly though not exclusively social spending, associated by the news about difficulties in pension system, caused again a drastic pessimism about the future in times of negligible real deterioration of social conditions. Overreaction to changing conditions is a very worrying phenomenon, as it is known in social sciences that political and economic attitudes and behaviour are influenced by optimism or pessimism stronger than by perception of the current situation.
Forecasts
A disadvantage with most of econometric forecasting methods is that they primarily predict “average” phenomena, free from the discontinuities that essentially alter the course of studied processes. Fortunately, such rapid changes occurred during the period we examined. We have attempted to design a model that can predict such changes.
Our proposed model is as follows:
In its general form:
�����′ = � + �� × ����� + �� × ∆ �� + �� × �∆ ���� − �� × ∆� − �� × �∆���
With regards to the specific values of the equation's coefficients:

17
�����′
= −0,096 + 0,614 × ����� + 0,052 × ∆ �� + 2,953 × �∆ ���� − 0,154 × ∆� − 2,013 × ∆��
where :
�����′ - IBESD value in the year t (predicted)
�������� - value of IBEDS in the previous year (t-1)
∆ �� - ����� − ����� (Difference between the IBESD value during the previous year and two years earlier)
∆� - ���� − ���� (Change in the standard deviation of the index's components between the previous year and two years ago)
���� - (Standard deviation of IBESD components in the previous year) (t-1)
The basic premise here is to assume a curved shape of the relationship between the pace of development and its degree of balance. We assume inverted “U” shape of basic relations between the two. Total lack of imbalance (complete equilibrium) is not conducive for development. Development requires some imbalance in one or a few areas. However, too large imbalance in condition of too quick growth, causes an “overheating of the system”, a lack of control and “fragility”. So we are here dealing with a process opposite to that described in the tale of the ugly duckling. In our case the over-developed “white swan” turns into a “black swan” (using Taleb’s metaphor). Applying this metaphor, we also use another one claiming that the fragility of material, as physics suggests, takes place both in conditions of overheating and freezing. In our opinion, this concerns socio-economic development as well. On the other hand, we assume that too large imbalance in condition of prolonged stagnation or decline prevent excessive freezing and causes the trend to reverse to developmental one.
Determining how one or the other (overheating and freezing) causes a trend to reverse is a matter of empirical analysis. Previous results allow us to formulate an assumptions that the desired level of balance, measured through the standard deviation of the four IBESD components, is about .4. Up till now, an imbalance at this level has always been associated with IBESD rise during the next year. Deviations far above (such as .67 in 2007) or below (e.g. .17 in 2001) this level tend to be followed by a worsening or stagnation of socio-economic conditions. Our hypothesis is that high imbalance following period of stagnation or decline should result in development, while high imbalance following period of growth should result in stagnation or decline. All in all, IBESD constitute a tool-box (Noll 2011) rather than a single universal tool, since it allows for analyses of its changes as well as changes in its four composite components, their interrelations (including incongruence) and their influence on the generalised socio-economic development.
In order to forecast IBESD changes, it was necessary to predict the standard deviation of its four components. For this purpose, we used the formula:
�′ = 0,238 + 0,427 × ���� + 0,398 × ∆� − 0,017 × �∆���

18
�′ = � + �� × ���� + �� × ∆� − �� × �∆���
(Notation as above).
Our model very accurately reproduces the actual shape of the IBESD curve. The Pearson’s r correlation between the actual values and those estimated by the model is as high as .97. Our estimates accurately showed the points where the trend changed, with an annual delay only observed in 2001 and 2003. From 2005 to 2012, actual and estimated curves completely overlap, even during the time of frequent fluctuations between 2007 and 2010. This has allowed us to predict the eventual change in the developmental trend in a relatively short time period. The model allows for an estimate of the IBESD three years ahead. In conditions of extreme uncertainty caused by world-wide economic turbulences, we have not been tempted to make long-term predictions. The results presented in Figure 8 compare the observed and the estimated IBESD curves up to 2012 and the estimates for 2013-2015 period. We predict a halting of the decline in the IBESD value and perhaps even a slight improvement.
Figure 8. The actual and predicted course of socio-economic development, measured by the
IBESD, 1999-2015
Pessimism and pace of socio-economic development
The statistical prediction can never be one hundred percent certain. It is know that Taleb’s “black swan” can fly into the world. Politicians and economists can only attempt to prevent a deterioration of the situation and stimulate anti-fragility, i.e. the resilience to shocks. The only hope is that according to Taleb anti-fragility should be understood as resilience to shocks growing with their number in the past, as a resilience to some illnesses does. Our analysis suggests, that one of several possible ways to increase the chances for balanced development is

19
to improve the quality of political life, which translates itself into the public mood, especially into expectations. To prevent large, hysterical fluctuations from social optimism to pessimism, it is essential to reduce feelings of uncertainty. The uncertainty is an important element of a crisis situation (Kozminski, Zagorski 2015).
Since we predict on the basis of our model that the downturn in socio-economic development will be halted and maybe even reversed, we need to consider how the benefits of this improvement can be dedicated more towards social than just strictly economic means. This should increase the anti-fragility of the system, along with its resistance to unpredictable external and internal shocks.
We need to look at the perspective for growth in the whole of Europe for the remainder of this decade, considering the proved impact that external economic factors has on the competitiveness of the Polish economy (Figure 1 and related comments). The initial international econometric forecasts, such as the OECD (Economic Outlook, www.oecd.org/eco/economicoutlook.htm), and World Bank (Global Economic Prospects, www.worldbank.org./en/publication/global-economc-prospects/), show that GDP growth in the whole Europe should average at 1.5%-1.8%, whilst in Germany this will be at the level of around 1.4%. In light of this analysis, we can say that Polish economy may grow similar or faster than during last few years until the end of the decade. The problem is, how to prevent a gap between economic and social aspects of development to increase. We have documented that the rising trend in social conditions in Poland was halted in 2008 and not improved later on despite economic improvement. During the period when Poland was promoted in the media as the “green island” not affected by the crisis, social conditions rose slightly and stagnate while public expectations dramatically deteriorated after some improvement.
Achieving socio-economic development until the end of the decade would require a series of intense domestic actions. Immediately it requires investing in improving the social mood, especially public expectations, and reducing feelings of uncertainty and threat. This means creating stable conditions for the four most important economic regulators: households, businesses, market and state. If this does not occur then social mood may pull down the economic and remaining social indicators as well as the whole index of socio-economic development. Present feeling of uncertainty towards the future bordering on hysteria and obsession is threating the stability of the whole system. The continuation may result in anti-systemic political behaviour, such as abstention from elections, relatively high support for extreme and strange “alternative” political groups, protest movements, outrage, etc.
One negative phenomenon is already apparent, namely the dramatic increase in number of suicides in 2013. We have not included data on mental well-being and suicides for 2013 in our earlier analysis (Figures 3 and 4), since there are no other data available for that year. It has to be remembered that mental well-being and suicides are measured separately and are not included in IBESD. Changes in these two psychological respects are compared here to changes in IBESD estimated till 2015 (Figure 9). Mental well-being, measured, as already explained, by a series of questions concerning declared frequency of positive and negative emotions, deteriorates during last few years similar to IBESD, including the estimated value of the latter

20
for 2013. This is not the case with suicides the number of which has increased at pace unseen in the whole period analysed.
Figure 9. IBESD, mental well-being and suicides, 1999-2013.
The suicides may represent the cases of subjectively felt ultimate human misery. The fact that recently they became very much more frequent than in the past, while their number was previously changing more in line with IBESD and psychological well-being, indicates excessively growing pessimism, uncertainty and overreacting of people to actual situation. That may be a “black swan” - in the Taleb’s understanding of this metaphor - making our IBESD predictions for 2013-2015 a bit too optimistic despite their statistical soundness. Recent trends in IBESD, its four components and indicators of psychological well-being (we prefer that term over “flourishing” which has too positive connotation) suggest fragility of Polish socio-economic development. Social reactions can grossly increase this fragility by decreasing the balance of the development. However, our statistical model, proved by high congruency between predicted and actual changes in IBESD, suggests that the imbalance may reverse recent trend and instigate further socio-economic development after a short period of relative stagnation in 2012-2015.
-3
-2,5
-2
-1,5
-1
-0,5
0
0,5
1
1,5
2
2,5
1999 2001 2003 2005 2007 2009 2011 2013 2015
KU Index (IBESD) -
predicted value
Mental Well-being
Number of Suicides
(inverted)

21
Bibliography
Baurer, R.A. (ed). (1966) Social Indicators. Cambridge: MIT Press.
BES (2014) Il benessere equo esastenbile in Italia. Roma: Cnel-Istat.
CBOS (2013) „Samopoczucie Polaków w roku 2013”. Komunikat z badań BS/181/2013.
Constanza, R., Hart, M., Posher, S., Tolberth, J. (2009) “Beyond GDP: The Need for New Measures of Progress”, The Pardee Papers, 4.
Crozier M., Friedberg E. (1982) Człowiek i system. Ograniczenia działania zespołowego Warszawa: PWN.
Diener, E., Wirtz, D., Tow, W., Kim-Prieto, C., Dong-Won, C., Oishi, S., Biswas-Diener, R. (2010) “New Well-Being Measures: Short Scales to Assess Flourishing and Positive ans Negative Feelings”, Social Indicators Research, 97 (143-156).
Espinoza P.Z., Somarriba Arechvala N. (2013) “An assessment of social welfare in Spain: territorial analysis using a synthetic welfare indicator”. Social Indicators Research, 111: 1-23.
Fleurbary M., Blanchet D. (2013) Beyond GDP – Measuring Welfare and Assessing Sustainability, Oxford: Oxford University Press.
Giesselmann, M., Hilmer, R, Siegel, N.A i Wagner, G.G. (2013). “Measuring Well-Being: W3 Indicators to Complement GDP”, DIW Economic Bulletin, 5: 10–19. Guardiola, J., Picazo-Tadeo, A., Rojas, M. (2014). “Economic Crisis and Well-Being in Europe: Introduction”. ”. Social Indicators Research. Published online first. DOI 10.1007/s11205-D14-0594-x.
Hagen, L.M. (2008). „Public opinion and the economy” w: W. Donsbach I M.W. Traugott (red), The SAGE Handbook of Public Opinion Research, London: SAGE Publications (526-533).
Hone, L., Jarden, A., Schofield, G. (2014) “Psychometric Proprieties of the Flourishing Scale in New Zealand”, Social Indicators Research, 119/2 (1031-1045).
Huppert, F.A., So, T.C. (2013). “Fluorishing Across Europe: Application of a New Conceptual Framework for Defining Well-Being”. Social Indicators Research. 110: 837-861.
Jarosz, M. (2004). „Samobójstwa – Ucieczka przegranych”. PWN, Warszawa 2004.
Keynes, J.M. (2013) The Collected Writings of John Maynard Keynes, t.IV, Cambridge University Press, Cambridge UK Kaufmann D., Kraay, A. Mastruzzi, M. (2010), “The Worldwide Governance Indicators: Methodology and Analytical Issues”, Working Paper No. 5430, World Bank Policy Research: http://ssrn.com/abstract=1682130.

22
Koźmiński A.K., Zawiślak A.M. (1979) Pewność i gra. Warszawa: PWE.
Koźmiński A.K., Obłój K. (1989) Zarys teorii równowagi organizacyjnej. Warszawa: PWE.
Koźmiński A.K. (1995) „Mikro I makro równowaga funkcjonalna w warunkach transformacji”. Ekonomista, 1-2: 157-164.
Koźmiński A.K. (2014) Czas pokera. Warszawa: Wolters Kluwer.
Koźmiński A.K. (2014a) Przedsiębiorcze państwo. Ekonomista, 2: 321-336.
Koźmiński A.K. Noga A. Piotrowska K. Zagórski K. (2014) „Kozminski University Index of Palanced Socio-Economic Development (IBESD) for Poland”. In: Kolodko, G. (ed.) Management and Economic Policy for Development. New York: Nova Science Publishers (161-182).
Kozminski, A.K., Zagorski, K. (2015) „Społeczenstwo w czasach kryzysu i niepewności: Założenia, pojęcia, metody” in: Zagorski, K. (ed) Postawy ekonomiczne w czasach niepewności. Warsaw: Scholar (forthcoming).
Kuznets, S. (1934). National Income 1929-32 – A Report to the U.S. Senate, 73rd Congress, 2nd Session. Washington: US Government Printing Office.
Llewellyn Consulting (2013) “UK Infrastructure. The Challenges for Investors and Policymakers”. White Paper: https://www.pensioncorporation.com/sites/default/files/news/pic_uk_infrastructure_investment_white_paper_july_2013.pdf
Lyapunov, A.M. (1992). The General Problem of the Stability of Motion. London: Taylor & Francis.
Madonia, G., Cracolicci, M.F. i Cuffaro, M. (2013).” Exploring wider wellbeing in the EU 15 countries. An empirical application of the Stiglitz Report”. Social Indicators Research, 111: 117–140
March J. G. (1981) “Footnotes to Organizational Change”. Administrative Science Quarterly, 26 (4): 563-577. McGranahan D.V., Richard-Proust C., Sovani N.V., Subramanian M. (1970) Content and Measurement of Socio-Economic Development – An Empirical Inquiry. Geneva: United Nations Research Institute for Social Development Report Nr. 70.10.
Moser, C.A. (1973). “Social Indicators – Systems, Methods and Problems”, The Review of Income and Wealth, 19(2): 133-141.
NEF The New Economics Foundation (2009) The Happy Planet Index: www.dowssx417g17s.cloudfront.net/nefoundation/defaultpage/-/files/happy-planet-index-report.pdf.

23
Noelle-Neumann, E. (1984), The spiral of silence: Public opinion – our social skin, Chicago: The University of Chicago Press.
Noll, H.H. (2011) ’The Stiglitz-Sen-Fitousi-Report : Old Wine in New Skins? Views from a Social Indicators Perspective’. Social Indicators Research, 102 : 111-116.
OECD The Organisation for Economic Co-operation and Development (2013) Better Life Index. Pobrano z: www.sttats.oecd.org/Index.aspx?DataSetCode=BLI#. Pennock M., Ura K. (2011) “Gross national happiness as a framework for health impact assessment. Environmental Impact Assessment Review”, 31: 61–65 doi:10.1016/j.eiar.2010.04.003
Reig-Martinez E. (2013) “Social and economic wellbeing in Europe and the Mediterranean Basin: Building an Enlarged Human Development Indicator”. Social Indicators Research, 111: 527-547
Reiss A. (1970) “Assessing the current crime wave”. in: B.N. McLennan (red.) Crime in Urban Society New York: Donellen: 23-42.
Rodrik, D., Subramianian, A. , Trebbi F. (2004), “Institutions Rule: The Primacy of Institutions over Geography and Integration in Economic Development”, Journal of Economic Growth, 9: 131-165.
Schiller, R.J. (2000). Irrational Excurbance. New York: Princeton University Press.
Schopelmann P., Goosens Y., Makipaa A. (red) (2010), Towards Sustainable Development – Alternative to GDP for Measuring Progress, Wuppertal: Wuppertal Institute.
Somarriba Arechavala, N., Zarzosa Espina, P., Pena Trapero, P. (2014) „The Economic Crisis and its Effects on the Quality of Life in Europe”. Social Indicators Research. Published online first. DOI 10.1007/s11205-D14-0595-9.
Stiglitz J.E., Sen A., Fitoussi J.P. (2013) Błąd pomiaru. Dlaczego PKB nie wystarcza Warszawa: PTE.
Stone, R. (1966) Input-output and demographic accounting: A tool for educational planning. Minerva 4 (3): 365-380.
Stone, R., Brown, A. (1962). A Computable Model of Economic Growth. London: Chapman and Hall.
Taleb N. (2007) The Black Swan: The Impact of the Highly Improbable New York: Random House.
Taleb, N. (2013) Antykruchość – O rzeczach, którym służą wstrząsy, Warszawa: Kurhaus.

24
Thiry G. (2014) „Beyond GDP: Conceptual Grounds of Qualification. The Case of Index of Economic Well-Being (IEWB)”. Social Indicators Research. DOI 10.1007/s 1205-014-0650-6 (published online first).
Thom R. (1991) Parabole i katastrofy. Rozmowy o matematyce, nauce i filozofii z Giulio Giorello i Simoną Marini, Warszawa: PIW.
UN United Nations (1975). Towards a System of Social and Demographic Statistics, Studies in Methods, Series F, No.18.
UNDP United Nations Development Programme (2013) Human Development Index: www.hdr.undp.org/en/statistics/hdi.
Ura K., Alkire S., Zangmo T., Wangdi K. (2012) An Extensive Analysis of GNH Index Centre for Bhutan Studies: http://www.grossnationalhappiness.com/wpcontent/uploads/2012/10/An%20Extensive%20Analysis%20of%20GNH%20Index.pdf
Weintraub E.R. (1974) General Equilibrium Theory London and Bassingstoke: Macmillan.
Zagórski, K. (1972) „Zintegrowany system statystyki społeczno-demograficznej”, Wiadomości Statystyczne, 8: 9-11.
Zagórski, K. (1972a) „Dwa typy kompleksowej analizy procesów społecznych”, in a reader: Ludność, Warszawa: GUS.
Zagórski, K. (1975)” Socio-demographic Statistics in the System of Central Socio-economic Planning”, Bulletin of the International Statistical Institute, 46: 511-522.
Zagorski, K. (2011) “Income and Happiness in Time of Post-Communist Modernization”, Social Indicators Research 104, (331-349).