kootenay lake update - british columbia meeting june 15... · kootenay lake recovery: update and...
TRANSCRIPT

Kootenay Lake Recovery:
Update and Actions
June 15, 2015
Matt Neufeld and Jeff Burrows Ministry of Forests, Lands and Natural Resource
Operations - Nelson

Outline • Recap of Kootenay Lake and February meeting • Biological and fishery update – new info since
February meeting o Kokanee fry o 2015 Gerrard Spawning o Fishery
• Action Update o Expert Team and recommendations o Actions o Monitoring
• Summary, Questions and how to stay informed

Recap of Kootenay Lake Status
• Recent low older Kokanee abundance • Kokanee fry ~ average abundance • Recent record high Gerrard trout abundance • Decreasing Gerrard rainbow trout size and
decreasing large trout abundance, degrading condition of trout in fishery
• High abundance of young Gerrard rainbow trout – could increase kokanee recovery time
• Nutrient program continues to produce fish food • IHN virus remains present – likely not a significant
issue currently

February 2015 - Meeting Outcomes • Outstanding written questions from February Meeting • Provide a Sport Fishing Update on the state of Kootenay
Lake • Form an Expert team, facilitate team meetings and
develop an Expert Team Report related to Kootenay Lake recovery
• All three are on the Ministry Regional website: o www.env.gov.bc.ca/kootenay/fsh/main/mainfish.htm o Google “Kootenay Fisheries”
• Ministry action plan to speed recovery – summary
tonight

2015 Kokanee Fry Abundance • Kokanee numbers
fluctuate • Improvements since
nutrient restoration • Fry estimates more than
doubled with nutrient restoration and have remained high
• 2014 was post nutrient average and 2015 looking relatively strong
• Egg to fry survival >70%, highest ever recorded
• 7.5 Million fry out of Meadow Creek in 2015, and an additional 3.5 to 5 million expected from Lardeau.
• Likely fall fry estimate of 9 -10 million (suitable for quick recovery)
1984 1994 2004 2014
Num
ber o
f kok
anee
fry
Fall In-Lake Kokanee Estimate
2015?
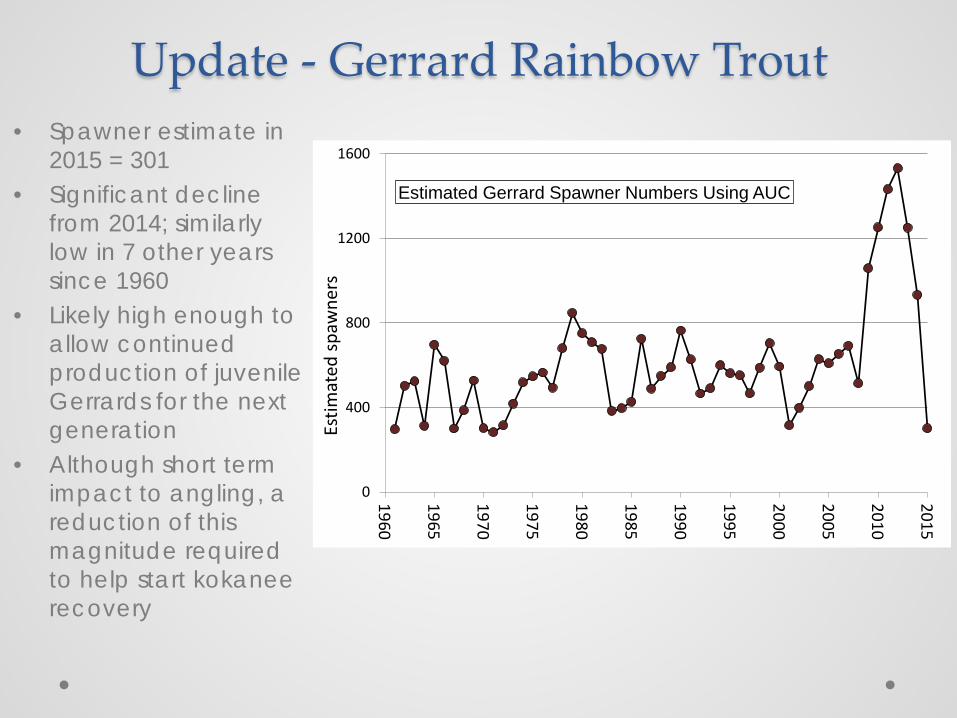
Update - Gerrard Rainbow Trout • Spawner estimate in
2015 = 301 • Significant decline
from 2014; similarly low in 7 other years since 1960
• Likely high enough to allow continued production of juvenile Gerrards for the next generation
• Although short term impact to angling, a reduction of this magnitude required to help start kokanee recovery
0
400
800
1200
1600
1960
1965
1970
1975
1980
1985
1990
1995
2000
2005
2010
2015
Estim
ated
spa
wne
rs
Estimated Gerrard Spawner Numbers Using AUC

Kootenay Lake Rainbow Trout Survey • > 50cm rainbow and bull
trout catch rates all show decrease in 2014-15
• Small rainbow catch continued increases (~250% higher than average)
• Small bull trout catch level, but very high
• 2014-15 KLRT sales ~5,000 • 2015-16 KLRT sales ~ 75%
0.0000
0.0500
0.1000
0.1500
0.2000
0.2500
Catc
h/ho
ur
Year
KLRT - Rainbow Trout Catch Rate
< 2kg RB2-5kg RB 5-7kg RB> 7kg RB
0.0000
0.0100
0.0200
0.0300
0.0400
0.0500
0.0600Ca
tch/
hour
Year
KLRT - Bull Trout Catch Rate
< 2kg BT2-5kg BT5-7kg BT> 7kg BT

Actions - Expert Team • The Ministry formed a team of fisheries experts comprised
of Provincial fish biologists, Freshwater Fisheries Society of BC, the Ktunaxa First Nation, and a BC Wildlife Federation technical expert to discuss all options to speed recovery of kokanee stocks and maintain their numbers.
• Kootenay Lake Fisheries Advisory Team examined 20 actions to restore a productive and sustainable Gerrard trout fishery.
• Actions considered included options to: o 1) as quickly as possible, restore the main lake kokanee population to support
a sustainable trophy Gerrard and bull trout fishery, while also providing ecosystem benefits to the lake; and,
o 2) reduce, on a temporary basis, the predator population, to ensure kokanee recovery.
• Experts prioritized Actions: high, medium, low/long term

Actions – Plan Implementation
• The Ministry will or already has implemented all high and some moderate priority actions identified by the expert team in 2015
• Additional moderate and long term actions in the coming years will only be implemented if needed
• Actions set to implement include short term kokanee supplementation (if spawner abundance drops in 2015) and changes or improvements to the nutrient addition program, spawning channel operations and angling regulations.

Angling Regulation Actions • Temporary reductions in kokanee harvest and increase
in predator harvest has likely benefits for recovery time • Increases in kokanee survival are required to start
recovery Actions • Regulation change
• decrease in kokanee quota (0/day) effective April 2015. Could provide 2.5 million extra eggs
• Daily rainbow quota on the Main Lake increase to 4/day, 1 over 50cm - decreasing juvenile Gerrard abundance has likely benefits for kokanee recovery (50,000 caught in 2014-15, only 16,000 harvested);
• Reviewing a change to bull trout quota (< 2kg catch very high)

Nutrient Restoration Actions • Proven performer • Quick kokanee recovery depends on continued
nutrients (food for fish) • Action: Optimization of timing and inputs
o Increase the length of the nutrient addition period into Fall if environmental conditions are suitable (warm), to increase kokanee overwinter survival
o Increased monitoring and continued consideration of natural variability and climatic events (flow, temperatures and natural nutrient inputs) will ensure nutrient additions are managed to best move up the food chain.
Kokanee Supplementation Actions • Temporary infusion of kokanee through
supplementation has likely benefits for recovery time, if natural production drops below 2014 levels
• Increases in kokanee survival are required to start recovery
Actions • Fry Stocking
• 95,000 kokanee fry were stocked in May 2015 into Crawford and Hendryx Creeks (FFSBC, FLNR, Eastshore Freshwater Habitat Society)
• An additional 500,000 for Spring 2016 • Eyed Egg Plants
• Requested 5 million “eyed” kokanee eggs Fall 2015 and plant to Meadow Creek Spawning Channel and/or suitable Kootenay Lake tributary

Spawning Channel Actions
• We will continue to limit IHN virus at spawning channels where we have some control o carcass removal o flushing o summer drying o kokanee testing will continue annually
• Continued improvements to operation and maintenance procedures

Review and Modelling
• Expert team work will continue • Review in-season data when available as a trigger for
recommendations to the Province around recovery actions;
• Assist in analysis/modelling to understand predator/prey dynamics in the lake and better inform future management decisions
Moderate priority: • Make additional areas of Kootenay Lake fishable by removing
angling closures (longer term; 2017-19 synopsis review). • Change regulation on number of rods that anglers can have
in the water at one time – allow 2 or more rods per person (not a Regional decision, will recommend to Provincial Committee).
• Investigate opportunities to increase entrainment of kokanee past Libby Dam (likely no feasible options).
• Test kokanee from trawl samples for IHN virus (exploring potential of historic samples to inform future actions)
• Research feasibility and benefits of Mysid harvest (medium term, necessary to act if mysid abundance increases)
Low priority or long term potential but no immediate benefit to short term recovery: • Conduct stream habitat improvements to benefit kokanee
spawning. • Conduct mysid harvest if required in future
What else may be done?

What are we not doing currently? Moderate priority: • Allow guides by Scientific Collection Permit to collect
additional Gerrard trout for biological sampling and kokanee predator reduction (not client consumption).
• Remove bull trout in spawning tributaries.
Low priority or long term potential but no immediate benefit: • Tag Gerrard trout with floy tags, and have a lottery style
reward for fish harvested. • Reduce Kootenay Lake rainbow trout licence to $0. • Reduce Gerrard trout in Lardeau River or at Gerrard. • Transplant kokanee fry or eggs from Meadow Creek to
another Kootenay tributary.

Monitoring • How we know our actions are working:
o Kokanee abundance – spawners and in-lake o In-lake kokanee survival (likely first indication of
recovery) o Fishery results – participation, trout kept and released o Gerrard spawner numbers o Bull trout spawner numbers o Zooplankton and Mysis abundance o Meadow Creek spawning channel performance
(kokanee size, fecundity, egg to fry survival rates) o Looking for improvement in all of these, though with
the right timing (kokanee before trout)

Questions and Updates • Looking to keep you informed and answer
questions as we implement and further develop actions o If you want to know more: answers to common questions,
information on current monitoring and updates around ongoing actions are and will be here:
o www.env.gov.bc.ca/kootenay/fsh/main/mainfish.htm o Google “Kootenay Fisheries”
• Contact info


How Long Until Recovery? • Recovery time hard to predict because of
uncertainty in predator response • Best case – Less than one kokanee generation (~2
years) o We currently have the building blocks for quick recovery - fry
production (15 million in 2014, ~10 million in 2015?) and young Gerrard abundance (highest ever KLRT catch)
o Potential upturn in kokanee spawners by 2017 and concurrent stabilization in Gerrard catch rate and size
o Requires an increase in kokanee survival rates, and a corresponding strong reduction in predator abundance (currently underway)
• Worst Case – two kokanee generations or more (8+ years) o If predator numbers are slow to drop off and young Gerrards exert
additional pressure on depressed kokanee stocks

Other questions • 2015 contingencies for low flows, temperatures
o Meadow never a problem o West Arm – July fishery closed o Less handling o Access to tributaries
• Pikeminnow
o eat some kokanee (up to 50% of diet for the largest fish) o part of the fish community that benefits from kokanee o unlikely that pikeminnow or other non-game fish are contributing in a
significant way to recent kokanee mortality increases o There is an unlimited daily quota for non-game fish, but we can’t definitively
say if additional harvest would be beneficial at a full lake scale. o reviewed our fish monitoring (eg trawl) not adequate so we don’t know, can
review if no turnaround

How you can help
• Stay informed • Participate in Angling
• Join and help local NGOs
Why not act sooner? • Kokanee and Gerrard rainbow trout numbers have fluctuated significantly
over the last 50 years, sometimes high and sometimes low. • In fall 2011, kokanee numbers were nearly the highest ever recorded, and in
spring 2012, Gerrard numbers were the highest ever recorded at the spawning grounds.
• At the time, this was good news for anglers and Gerrards which consume kokanee.
• Kokanee spawner numbers started to decline in 2012, as did Gerrards in 2013. • This trend was part of what would be expected given previous cycles in
population abundance for both fish. • Questionnaire lags fishery by > 1 y, fishery anecdotes led to concerns late
2013, through 2014 • Although declines in abundance were underway in 2012, it was not until 2014
that both data on Gerrard spawner abundance (June 2014), kokanee spawners (October 2014), and in lake kokanee abundance (January 2015) were lower than what would have been expected given previous lows in predator prey cycles.
• Addressing virtually immediately

Kootenay Lake Rainbow Trout License Sales
• 2014-15 sales high (~5,000),
• 2014-15 effort remained high, likely drop in 2015
• 2015-16 sales ~75%?? • Angler harvest low
despite high effort (~13%; harvest likely not driving current change in abundance)
0
50,000
100,000
150,000
200,000
250,000
300,000
1994
-95
1995
-96
1999
-00
2000
-01
2001
-02
2002
-03
2003
-04
2004
-05
2005
-06
2006
-07
2007
-08
2008
-09
2009
-10
2010
-11
2011
-12
2012
-13
2013
-14
2014
-15
Ang
ler H
ours
Year

KLRT Creel Survey Comparison
• KLRT vs Creel: effort estimates – within 0.5% of each other (Creel 46,053; KLRT 46,311angler days)
• >50cm BT and RB catch and harvest – 1.5 to 2x higher in KLRT – likely reflects survey bias that is well recognized including anglers that do not report if they did not catch, recollection bias as creel completed on day of catch (with harvest in hand) and survey up to 1.5yrs latter, anglers reporting boat catch not personal catch and other (creel survey a valuable reference point to correct for survey bias)
• Year to year predictive power is internally consistent - KLRT catch rates by size class in one year predict future catch rates of larger fish, so useful index of abundance and fishery performance

Where are the Really Big Fish (>25 lbs) • Was happening well before current
pred:prey mismatch • Catch data not suitable to differentiate big
(>15lbs) vs very big (>25lbs). • Peaks in the past (small numbers) but not
since mid 2000’s. 1. Natural mortality plus angler harvest
removal at high enough rate for none to make it to > 25 lbs (need to get >8yrs old).
2. Large fish corresponded in past with Gerrard peaks, but latest peak 2x past peaks, so competition with each other may have been strong enough to limit size
3. Adequate prey size not available for the very biggest (energetics poor if kokanee size is small for very largest fish?).
4. Genetic Selection – anglers preferentially remove the largest fish
5. Combination of some of the above.
0.00
0.00
0.00
0.01
0.01
0.01
0.01
Catc
h/Ho
ur
Year
CPUE Gerrard > 7kg (15lbs)

Worms in Fish • Worms reported by anglers are “broad fish tapeworm”, native to Kootenay
Lake • Larvae infect both freshwater and marine fishes, and are always present in
the Kootenay Lake rainbow population at some level. • There is no practical way of controlling parasites in wild fish populations. For
anglers, the key consideration is care in the preparation of your catch prior to consumption.
• Tapeworm eggs are excreted in the feces of animals hosting the adult tapeworm (fish-eating birds or mammals), develop in water into larvae that work their way through the food chain and eventually into fish.
• Heavy infestations of these larval tapeworms could kill some fish, especially those an already weakened condition, such as older fish, malnourished fish, or post-spawning migrants that are just returning to the lake.
• Parasite loads fluctuate. Although more trout appear to be affected by these parasites now than in the recent past, some anglers and retired fish biologists recall relatively high levels of parasites in past decades.
• We don’t know for sure why these parasites are more common at some times, but this cycle is common in other populations

Impact of Proposed Regulation Changes
Assumed potential harvest under 15/d limit = 10,000KO limit harvest number of extra eggs to MC
0 0 2,500,000 2 6125 968,750 5 9125 218,750
15 10000 0
Gerrard Rainbow Trout • annual small rainbow catch is 10,000-15,000 fish, and only 25-30%
harvested • Anglers can help: there is potential to reduce the young Gerrard
population by as much as 10,000 fish in one year if all fish were kept.
• For perspective, total production of 1 year old Gerrards annually is ~20,000, which decreases by the time they enter the fishery. Anglers catch and could keep almost one entire year class of juveniles in one year.
Kokanee • measurable increase in egg numbers from 0 harvest. The estimated
gain could be ~10% or more in 2015.

Nutrients – why not stop South Arm?
• Following slides • North and south results prove food increase • Currently not too much…..compare to Cominco

Kokanee Distribution

Kokanee Distribution • Density of kokanee
higher after south arm nutrients
• No significant change in distribution, with high densities at all transects in both the north and south arms

Secchi – measure of transparency

South Arm Secchi
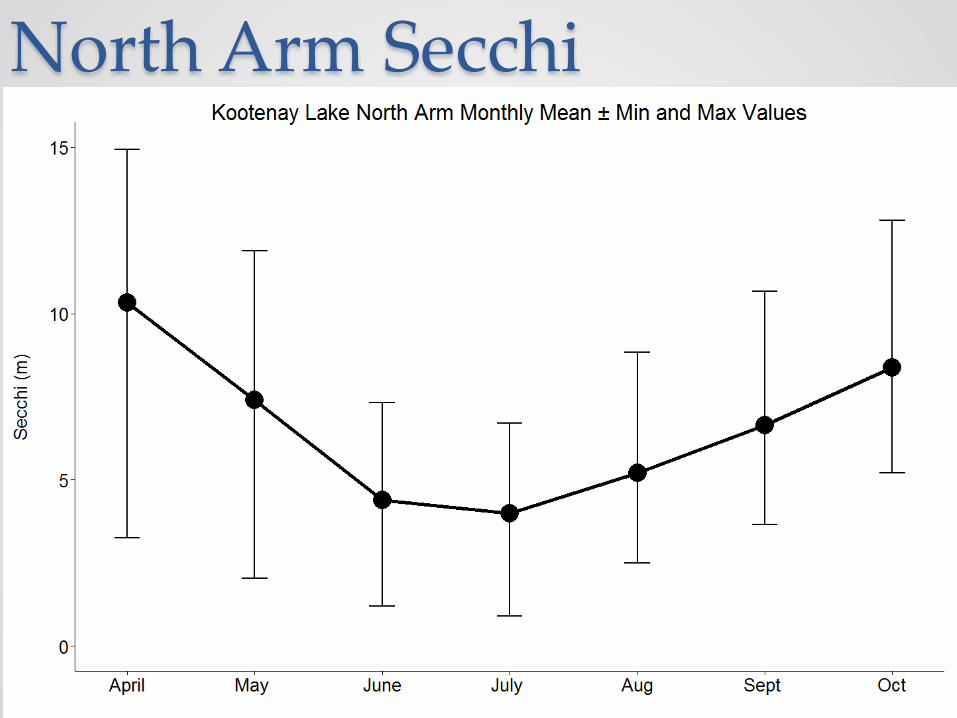
North Arm Secchi

Turbidity
Northern most station
Southern most station
April-June July-September October-November

pH

Phytoplankton

Zooplankton – Adult Kokanee Food Daphnia

Zooplankton – Kokanee Food Total Density

Phosphorus – Top 20 meters

Phosphorus - Bottom

Oxygen Profile in a higher phytoplankton year
0
25
50
75
100
125
150
0 5 10 15 20 25
Dep
th (m
)
North: KL2 Oxygen (mg/L)
6-Apr-09
4-May-09
8-Jun-09
6-Jul-09
3-Aug-09
31-Aug-09
Oct-09 - no data
2-Nov-09
0
25
50
75
100
125
150
0 5 10 15 20 25
Dep
th (m
)
South: KL6 Oxygen (mg/L)
6-Apr-09
4-May-09
8-Jun-09
6-Jul-09
3-Aug-09
31-Aug-09
28-Sep-09
2-Nov-09

Phosphorus loading
0
10
20
30
40
50
60
70
1960
1964
1968
1972
1976
1980
1984
1988
1992
1996
2000
2004
2008
Year
Tonn
es P
Duncan R P Fertilizer P
Duncan Dam completed

Phosphorus loading
0
10
20
30
40
50
60
70
1960 1965 1970 1975 1980 1985 1990 1995 2000
Phos
phor
us (t
onne
s)
Year
Duncan River Phosphorus Loading
Duncan Dam completed

Phosphorus loading in Kootenay River
2003
2003
2003
2004
2004
2004
2005
2005
2005
2006
2006
2006
2007
2007
2007
2008
2008
2008
2009
2009
2009
2010
2010
2010
2011
2011
2011
2012
2012
2012
2013
2013
2013
2014
2014
2014
0
5
10
15
20
25
30
KR1 KR2 KR9.1
Tota
l Pho
spho
rus (
µg/L
)
Kootenay River Average Annual Total Phosphorus
Downstream of Creston
Upstream of Creston
Kootenay River nutrient addition zone Idaho/Montana Border

KR9.1
KR9
KR7
KR6
KR5
KR4
KR3
KR2
KR1
KR10
KR11 KR12
KR13
KR14
Libby Dam
PRIMARY NUTRIENT EFFECTS ZONE
Canada
United States
Idah
o
Montana
Kootenai(y) River Nutrient Addition Bio-Monitoring Sites
SECONDARY NUTRIENT
EFFECTS ZONE

Nutrient addition Zones
Kaslo
South Arm
nutrient addition
zone
North Arm nutrient addition
zone
Balfour