knowledge & interpretation – graphic communication @ st aidans high
TRANSCRIPT
KNOWLEDGE & INTERPRETATION –
graphic communication @ st aidans highgraphic communication @ st aidans high
KNOWLEDGE & INTERPRETATION –
graphic communication @ st aidans high
GANTT CHARTS
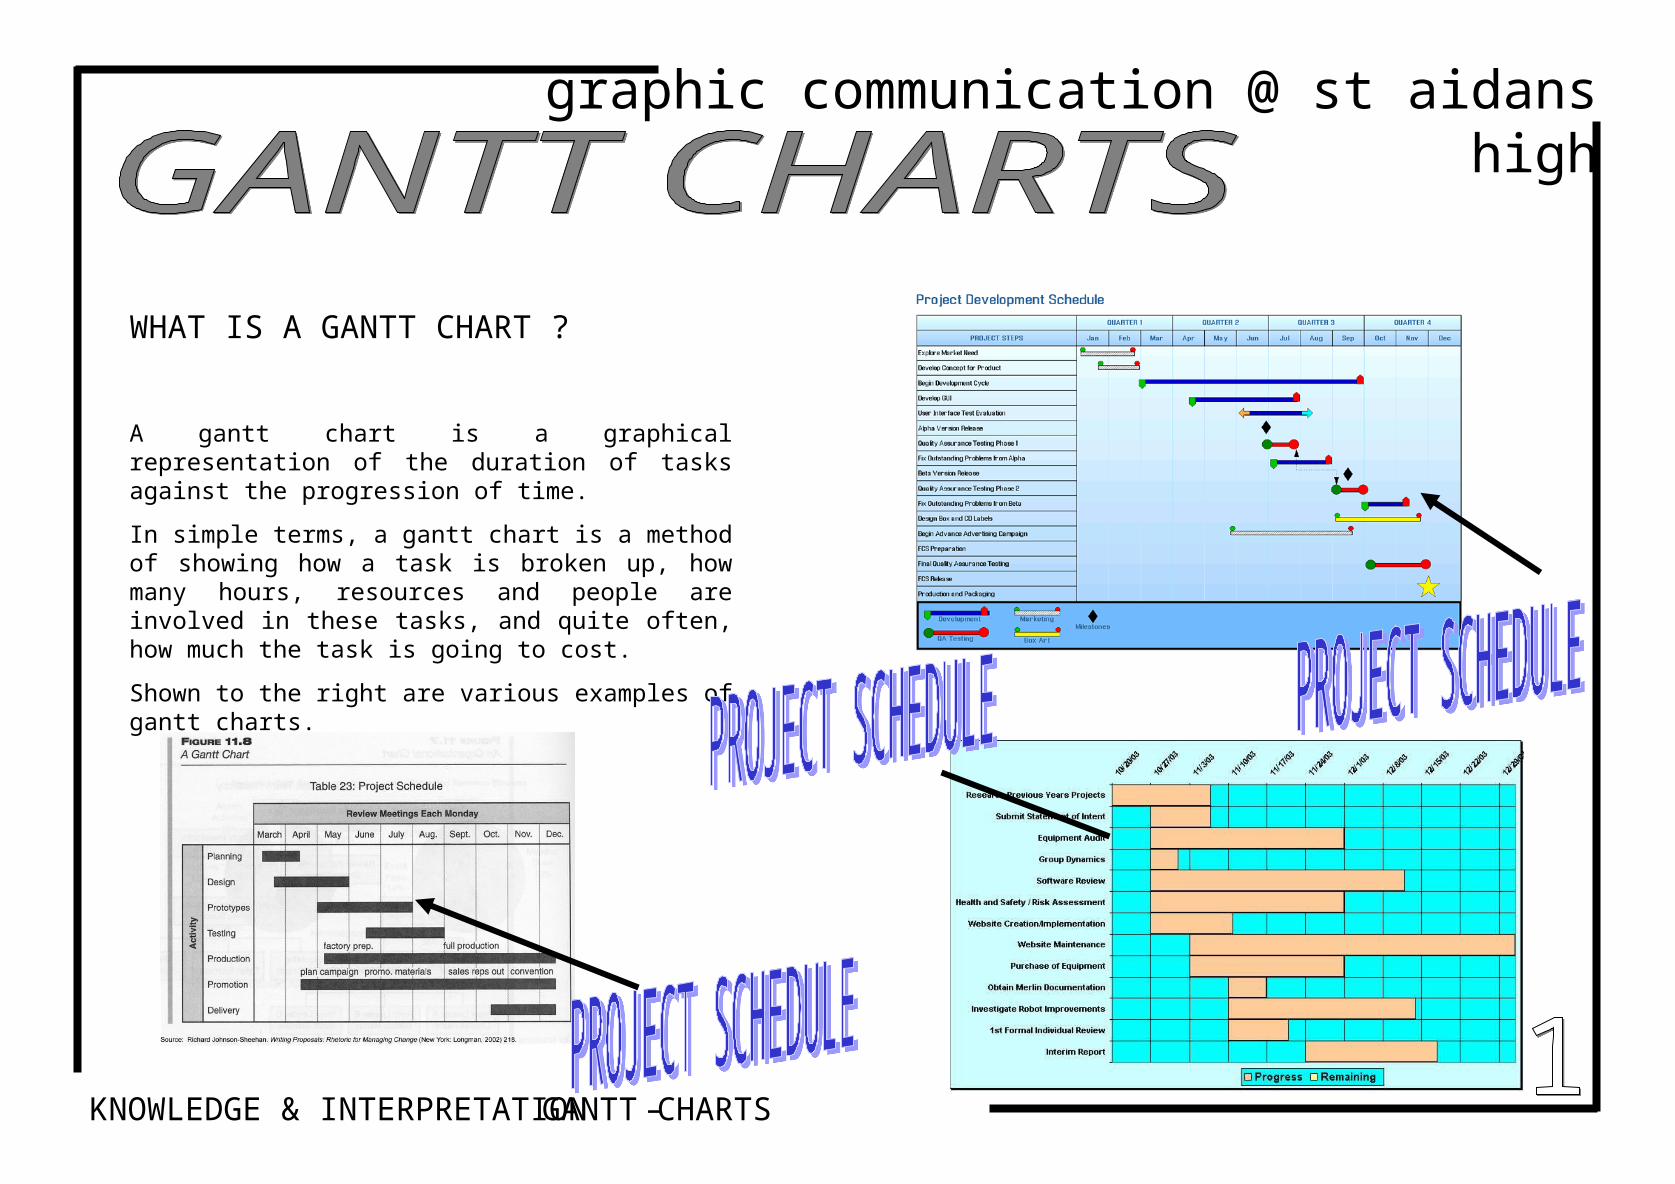
WHAT IS A GANTT CHART ?
A gantt chart is a graphical representation of the duration of tasks against the progression of time.
In simple terms, a gantt chart is a method of showing how a task is broken up, how many hours, resources and people are involved in these tasks, and quite often, how much the task is going to cost.
Shown to the right are various examples of gantt charts.
KNOWLEDGE & INTERPRETATION –
graphic communication @ st aidans high
GANTT CHARTS
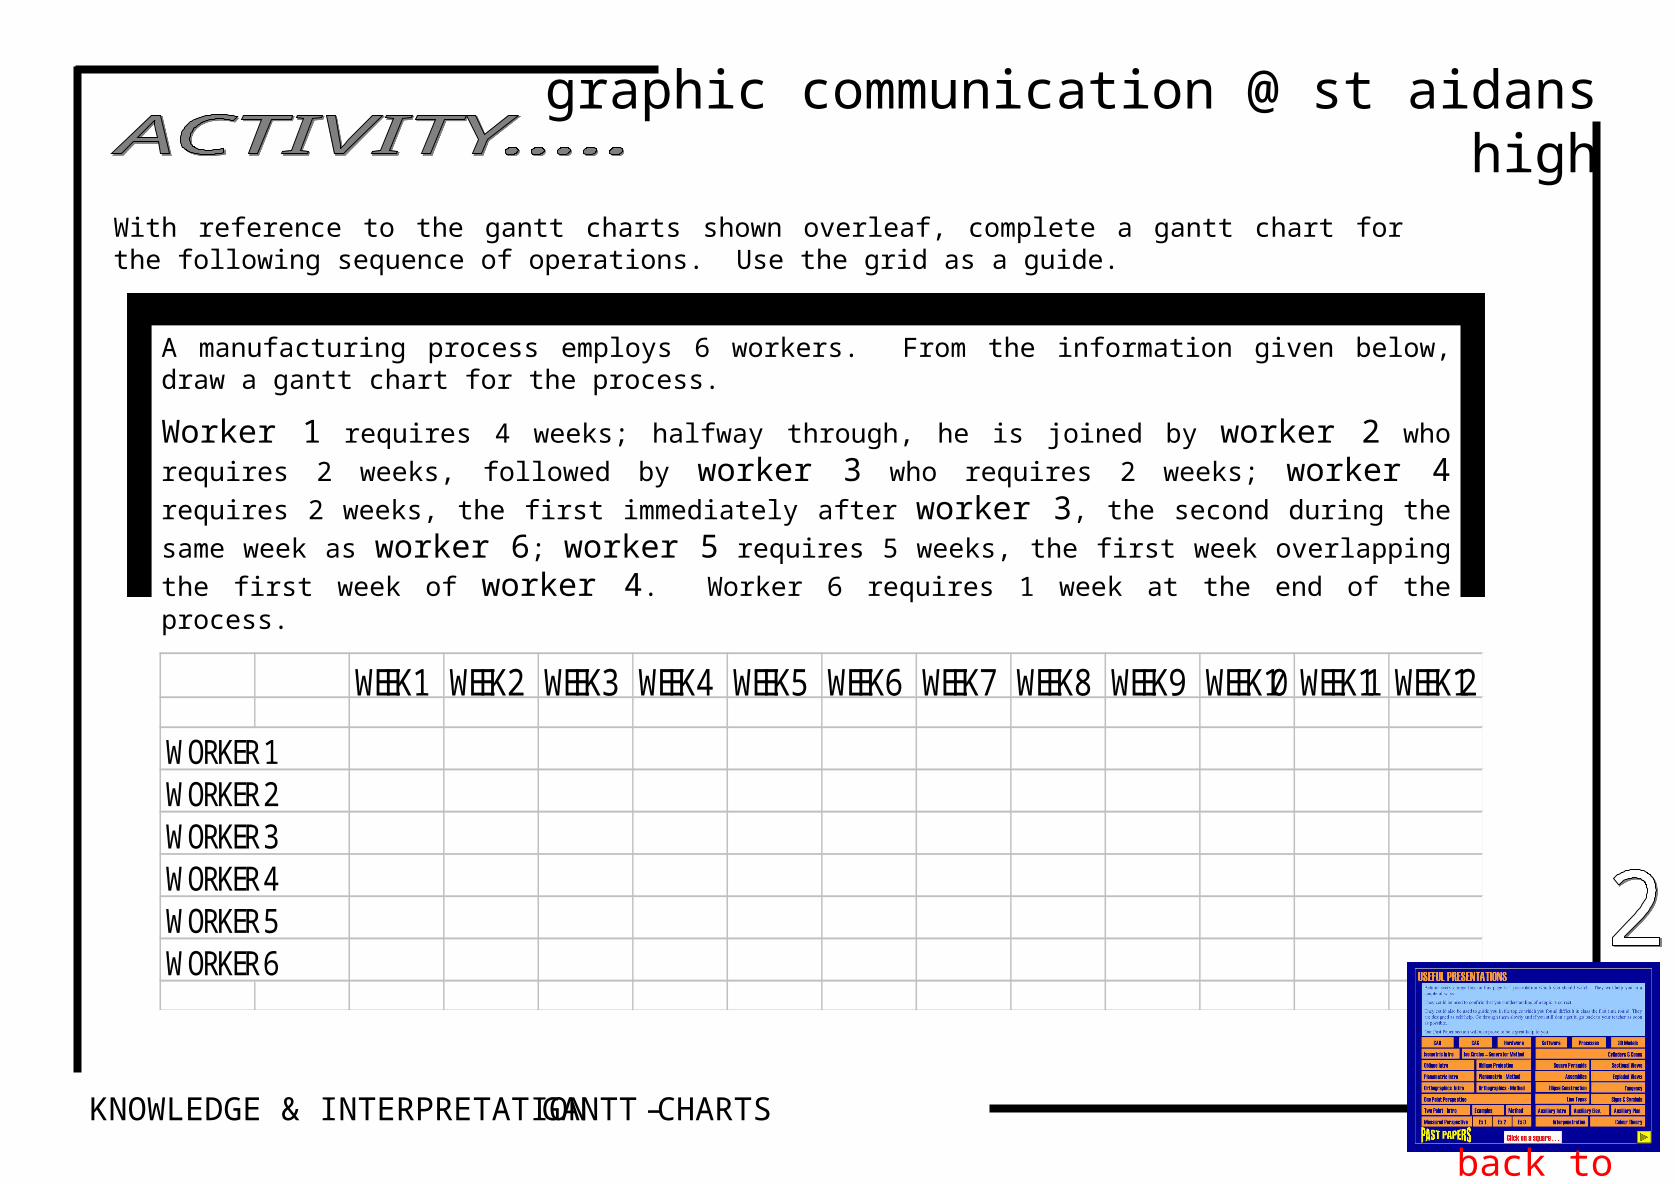
With reference to the gantt charts shown overleaf, complete a gantt chart for the following sequence of operations. Use the grid as a guide.
A manufacturing process employs 6 workers. From the information given below, draw a gantt chart for the process.
Worker 1 requires 4 weeks; halfway through, he is joined by worker 2 who requires 2 weeks, followed by worker 3 who requires 2 weeks; worker 4 requires 2 weeks, the first immediately after worker 3, the second during the same week as worker 6; worker 5 requires 5 weeks, the first week overlapping the first week of worker 4. Worker 6 requires 1 week at the end of the process.
WEEK 1 WEEK 2 WEEK 3 WEEK 4 WEEK 5 WEEK 6 WEEK 7 WEEK 8 WEEK 9 WEEK 10 WEEK 11 WEEK 12
WORKER 1WORKER 2WORKER 3WORKER 4WORKER 5WORKER 6
back to menu