klimawandel & meeresspiegelanstieg aktuelle szenarien · c a u department of geography –...
TRANSCRIPT
Department of Geography – Coastal Geography and Natural Hazards C A U
Klimawandel & Meeresspiegelanstieg
aktuelle Szenarien
Horst Sterr Department of Geography
Coastal Geography & Natural Hazards

Department of Geography – Coastal Geography and Natural Hazards C A U
Folgen des Klimawandels für die Küsten?Meeresspiegelanstieg
Stürme global und regional

Department of Geography – Coastal Geography and Natural Hazards C A U
Meeresspiegelanstieg - Effekte

Department of Geography – Coastal Geography and Natural Hazards C A U
Quelle: IPCC 2002
Department of Geography – Coastal Geography and Natural Hazards C A U
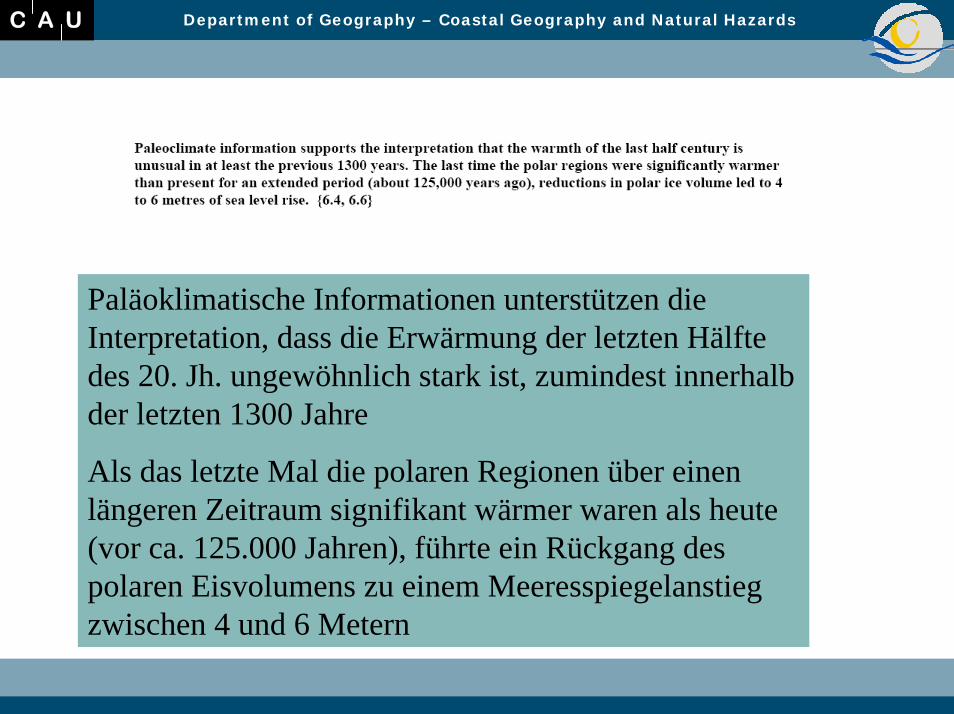
Paläoklimatische Informationen unterstützen die Interpretation, dass die Erwärmung der letzten Hälfte des 20. Jh. ungewöhnlich stark ist, zumindest innerhalb der letzten 1300 Jahre
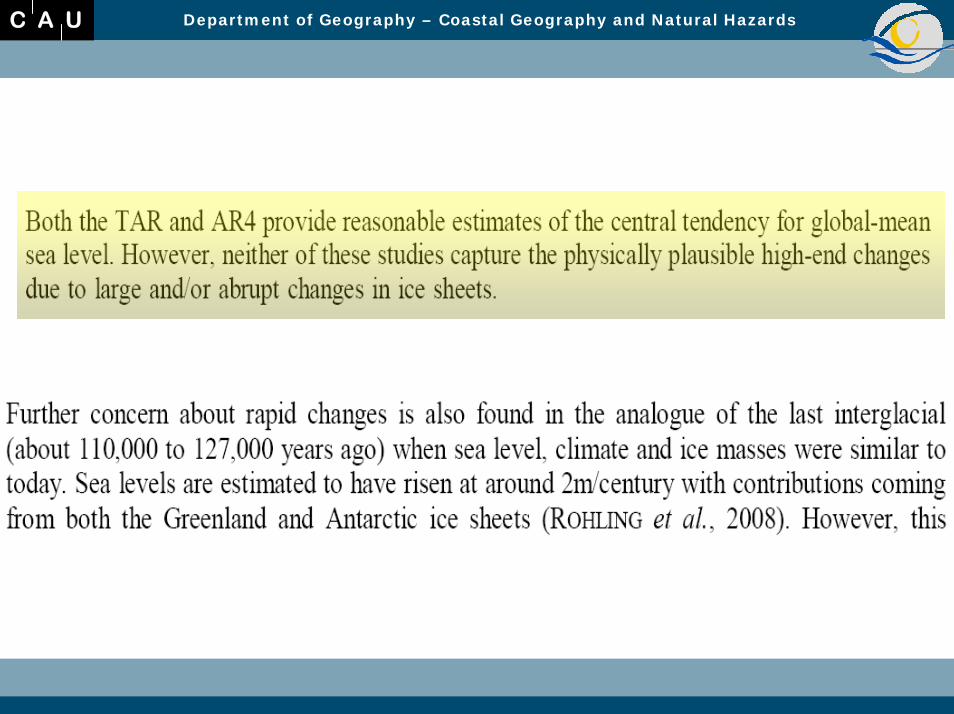
Als das letzte Mal die polaren Regionen über einen längeren Zeitraum signifikant wärmer waren als heute (vor ca. 125.000 Jahren), führte ein Rückgang des polaren Eisvolumens zu einem Meeresspiegelanstieg zwischen 4 und 6 Metern
Department of Geography – Coastal Geography and Natural Hazards C A U
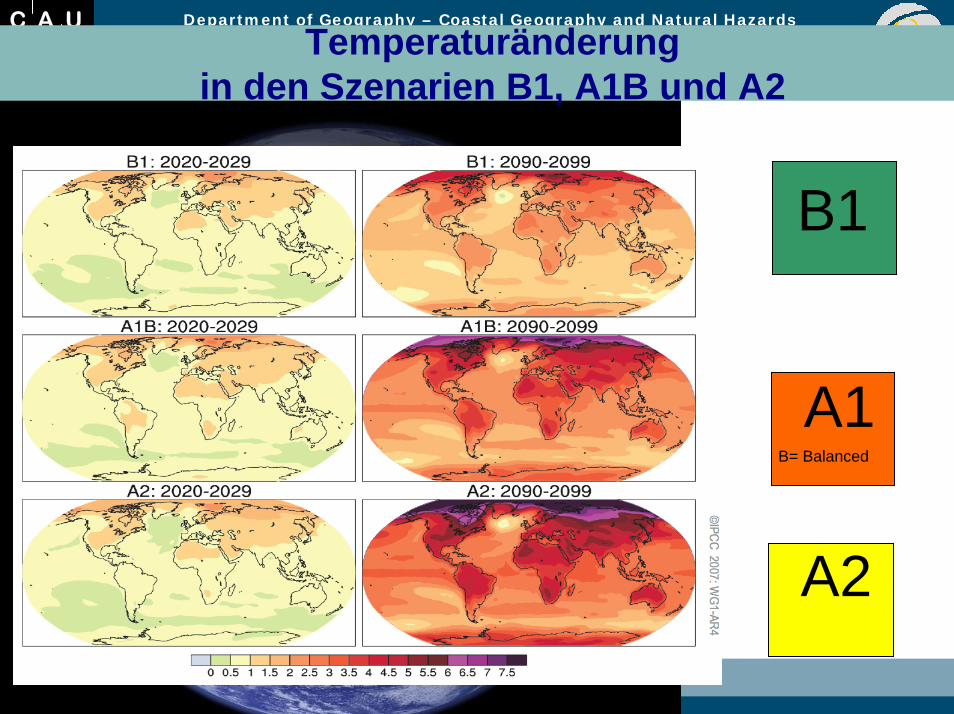
Department of Geography – Coastal Geography and Natural Hazards C A UTemperaturänderung
in den Szenarien B1, A1B und A2
Glo
bal
Ökologisch
Glo
bal B1
Ökonomisch
Glo
bal
A1B= Balanced
Ökonomisch
Regional
A2
Department of Geography – Coastal Geography and Natural Hazards C A U
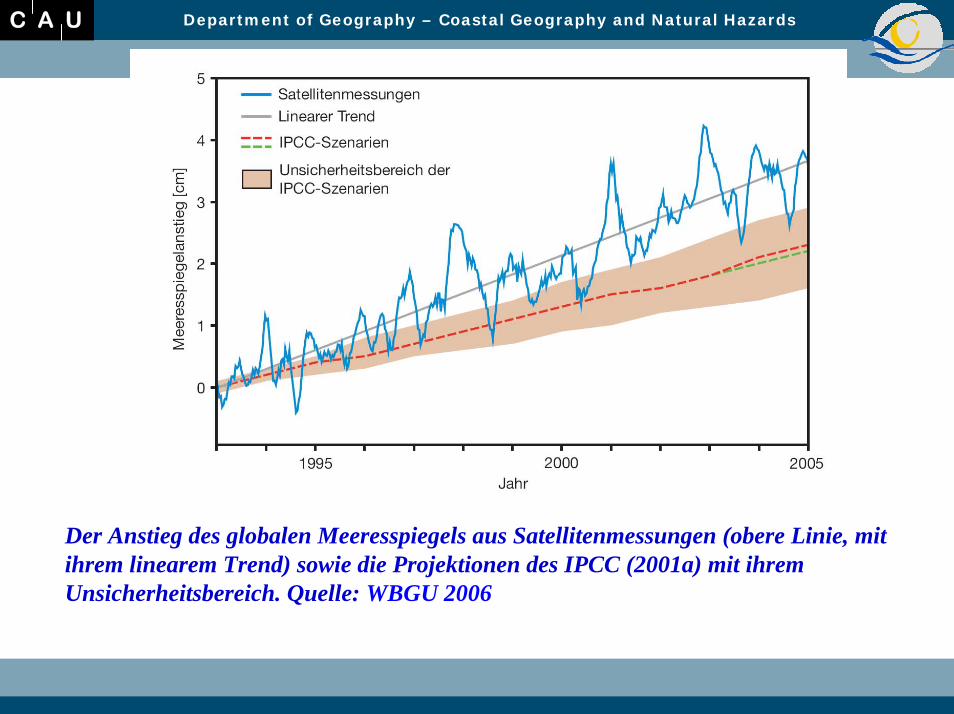
Der Anstieg des globalen Meeresspiegels aus Satellitenmessungen (obere Linie, mit ihrem linearem Trend) sowie die Projektionen des IPCC (2001a) mit ihrem Unsicherheitsbereich. Quelle: WBGU 2006

Department of Geography – Coastal Geography and Natural Hazards C A UBeobachtete Veränderungen
a) der globalen Durchschnittstemperatur
b) des durchschnittlichen globalenMeeresspiegelanstieg (Pegeldaten = blau; Satellitendaten = rot)
c) der Schneedecke der nördlichenHemisphäre (März – April)
Alle Veränderungen sind relativ zu den Durchschnittswerten der Jahre 1961-1990. Geglättete Kurven wurden aus dekadischen Durchschnittswerten gebildet, Kreisestellen jährliche Werte dar, schattierte Bereiche stellen geschätzte Unsicherheitsintervalle dar (aus umfassenden Analysen bekannter Unsicherheiten (a,b) sowie aus Zeitreihenanalysen (c)
Quelle: WBGU 2006
Temperatur: +0.8°
Meeresspiegelanstieg: +15cm
Schneebedeckung: -2 Mio.km2
Department of Geography – Coastal Geography and Natural Hazards C A U

Department of Geography – Coastal Geography and Natural Hazards C A U
Mit Klimamodellen berechnete Werte
Gemessene Werte
Differenz zwischen Messwerte u. Berechnung
Mit Klimamodellen berechnete Werte
Department of Geography – Coastal Geography and Natural Hazards C A U

Department of Geography – Coastal Geography and Natural Hazards C A U
FAQ 5.1, Figure 1
SLR Berechnungen vs. Messungen
IPCC, 2007
Department of Geography – Coastal Geography and Natural Hazards C A U

Department of Geography – Coastal Geography and Natural Hazards C A U

Department of Geography – Coastal Geography and Natural Hazards C A U
links 1992, rechts 2002
20081992
Flächen des Grönlandeises (orange), die einen Massenverlust aufweisen

Department of Geography – Coastal Geography and Natural Hazards C A U

Department of Geography – Coastal Geography and Natural Hazards C A U

Department of Geography – Coastal Geography and Natural Hazards C A U

Department of Geography – Coastal Geography and Natural Hazards C A U

Department of Geography – Coastal Geography and Natural Hazards C A U
Department of Geography – Coastal Geography and Natural Hazards C A U

Department of Geography – Coastal Geography and Natural Hazards C A U
Quelle: Grinstead, A. et al. (2008)
Reconstructing sea level from paleo and projected temperatures 200 - 2100

Department of Geography – Coastal Geography and Natural Hazards C A U
Tab. 3 Geschätzter globaler Meeresspiegelanstieg bis zum Jahr 2300 bei einer auf 3°C begrenzten
globalen Erwärmung (Quelle: WBGU 2006)

Department of Geography – Coastal Geography and Natural Hazards C A U

Department of Geography – Coastal Geography and Natural Hazards C A U

Department of Geography – Coastal Geography and Natural Hazards C A U Einfluss des Meeresspiegelanstiegs auf die Häufigkeit von Sturm-flutwasserständen: bei einer Anhebung des Pegelniveaus um 80 cm wird aus einer Jahrhundertflut eine „Zwanzigjahres-Flut“
500
600
700
800
900
1000
1100
1200
1300
1 10 100 1000Wiederkehrintervall in Jahren
Was
sers
tand
(PN
+ 5
00 c
m)
WEIBULLJENKINSON D
Quelle: MLR, 2000
Pegel BüsumHäufigkeitsverteilung der jährlichen HThw
für die Abflussjahre 1944 - 1993
25020

Department of Geography – Coastal Geography and Natural Hazards C A U Sturmstärken können zunehmen
ZunahmeAbnahmeW
oth,
200
5
Department of Geography – Coastal Geography and Natural Hazards C A U

Department of Geography – Coastal Geography and Natural Hazards C A U

Department of Geography – Coastal Geography and Natural Hazards C A U

Department of Geography – Coastal Geography and Natural Hazards C A U
Department of Geography – Coastal Geography and Natural Hazards C A U

Department of Geography – Coastal Geography and Natural Hazards C A U
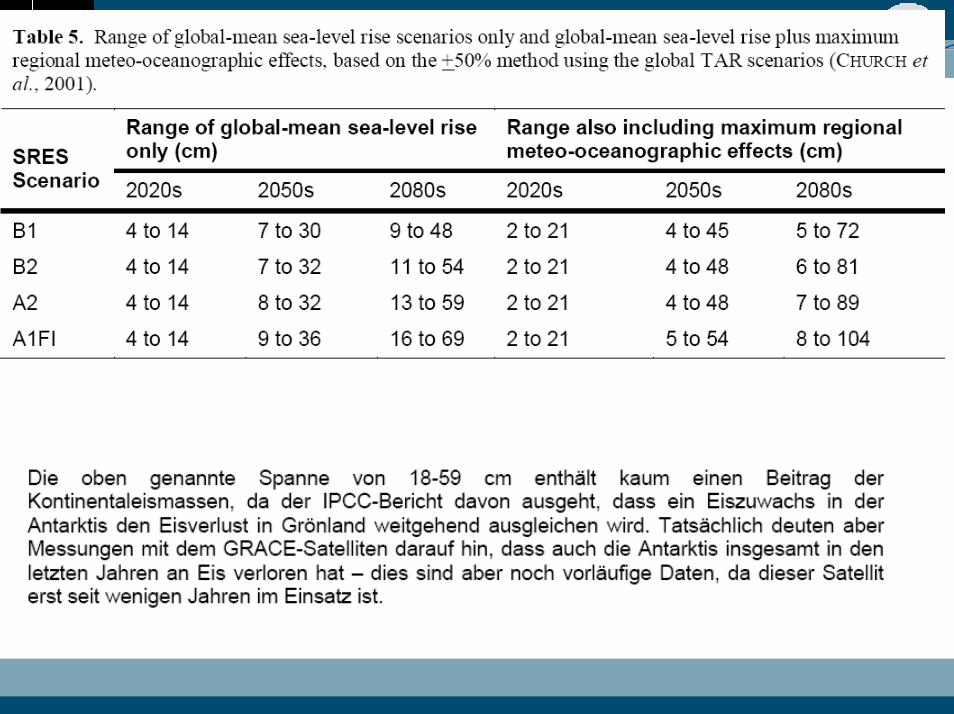
Wahrscheinlichster Wert des SLR bis 2100 = 40 cm
Entspricht einer 2-3 fachen Steigerung des bisherigen Wertes
Der wahrscheinliche Meeresspiegelanstieg im 21. Jhd. nach IPCC

Department of Geography – Coastal Geography and Natural Hazards C A U