kingspan interim results 22nd august 2011
TRANSCRIPT

Kingspan Interim Results 22nd August 2011

Disclaimer
Forward Looking Statements This presentation contains certain forward-looking statements. Actual results may differ materially from those projected or implied in such forward-looking statements. Such forward-looking information involves risks and uncertainties that could affect expected results.
2
Full Year Results 2010 28th February 2011

2011 Interim Management Report
Key Highlights Gene Murtagh CEO
Financial Review Geoff Doherty CFO
Business Review Gene Murtagh CEO
Strategy & Outlook Gene Murtagh CEO
Q&A 3
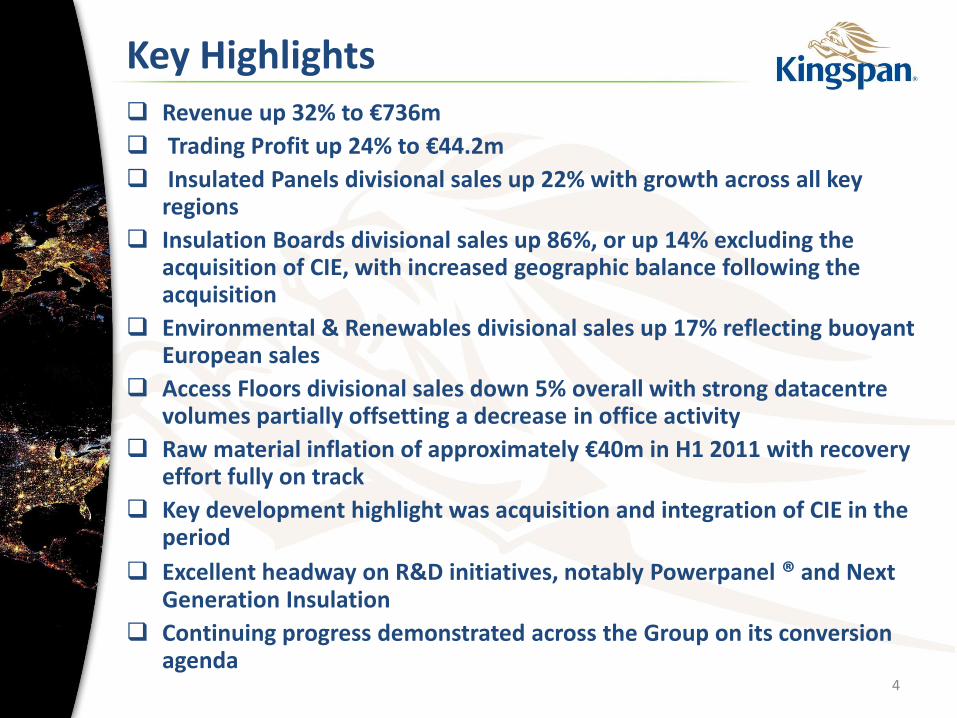
Revenue up 32% to €736m
Trading Profit up 24% to €44.2m
Insulated Panels divisional sales up 22% with growth across all key regions
Insulation Boards divisional sales up 86%, or up 14% excluding the acquisition of CIE, with increased geographic balance following the acquisition
Environmental & Renewables divisional sales up 17% reflecting buoyant European sales
Access Floors divisional sales down 5% overall with strong datacentre volumes partially offsetting a decrease in office activity
Raw material inflation of approximately €40m in H1 2011 with recovery effort fully on track
Key development highlight was acquisition and integration of CIE in the period
Excellent headway on R&D initiatives, notably Powerpanel ® and Next Generation Insulation
Continuing progress demonstrated across the Group on its conversion agenda
4
Key Highlights

5
2011 Interim Management Statement
FINANCIAL REVIEW
Financial Highlights
6
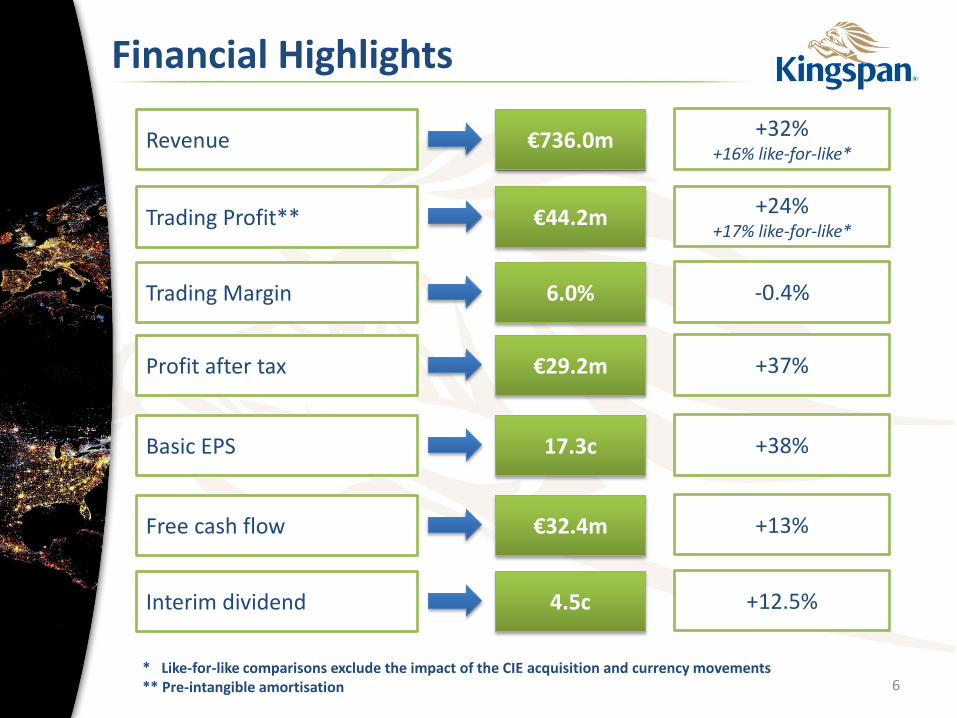
Revenue €736.0m +32% +16% like-for-like*
Trading Profit** €44.2m +24% +17% like-for-like*
Trading Margin 6.0% -0.4%
Profit after tax €29.2m +37%
Basic EPS 17.3c +38%
Free cash flow €32.4m +13%
* Like-for-like comparisons exclude the impact of the CIE acquisition and currency movements ** Pre-intangible amortisation
€32.4m Interim dividend 4.5c +12.5%

0
100
200
300
400
500
600
700
800
Revenue H1 10 Currency Volume Price/Mix Acquisition Revenue H1 11
558.7
736.0
0.6
55.5
36.7
85.7 €
m
7
Sales Bridge

Margin %
H1 11 H1 10 FY 10
Insulated Panels 6.2% 4.8% 5.6%
Insulation Boards 6.5% 9.0% 6.7%
Environmental & Renewables 1.2% 1.1% 0.5%
Access Floors 10.4% 15.0% 13.8%
Group 6.0% 6.4% 6.0%
8
Trading Profit Growth
0.0
0.0
0.0
0.0
0.0
0.1
H1 2010 H1 2011
35.7
44.2
€m
Trading Profit
9
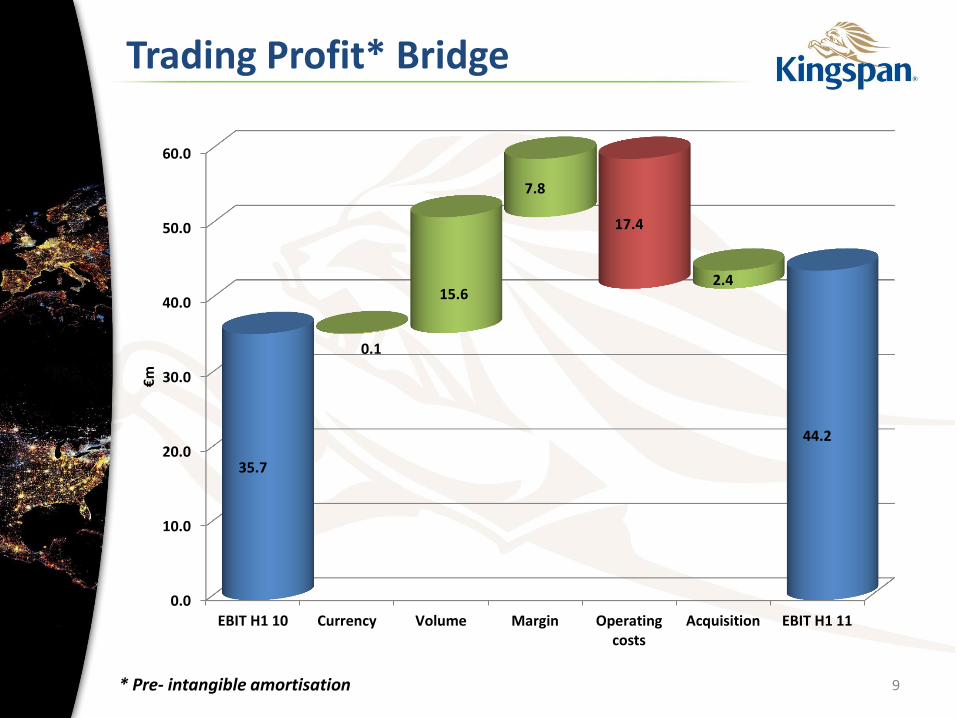
Trading Profit* Bridge
0.0
10.0
20.0
30.0
40.0
50.0
60.0
EBIT H1 10 Currency Volume Margin Operatingcosts
Acquisition EBIT H1 11
35.7
44.2
17.4
0.1
15.6
7.8
2.4
€m
* Pre- intangible amortisation
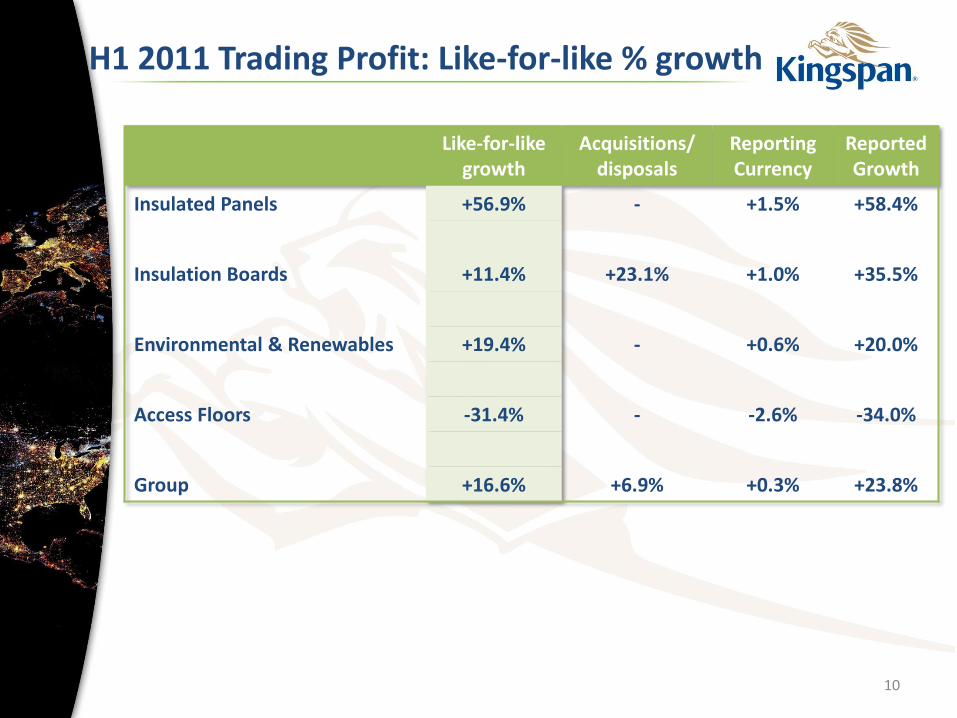
H1 2011 Trading Profit: Like-for-like % growth
10
Like-for-like growth
Acquisitions/ disposals
Reporting Currency
Reported Growth
Insulated Panels +56.9% - +1.5% +58.4%
Insulation Boards +11.4% +23.1% +1.0% +35.5%
Environmental & Renewables +19.4% - +0.6% +20.0%
Access Floors -31.4% - -2.6% -34.0%
Group +16.6% +6.9% +0.3% +23.8%

€m H1 11 H1 10
EBITDA 63.5 53.0
Working Capital (increase)/decrease (14.7) (8.7)
Interest and taxation (8.3) (9.1)
Net capital expenditure (10.6) (4.4)
Other including pension 2.5 (2.1)
Free cash flow 32.4 28.7
Acquisitions (108.3) 0.0
Dividends paid (9.8) (0.3)
Cashflow Movement (85.7) 28.4
Debt Translation (2.1) 0.8
Decrease/(increase) in net debt (87.8) 29.2
Net debt at start of period (128.7) (164.3)
Net debt at end of period (216.5) (135.1)
11
Cashflow Statement

Key Ratios
12
Key Ratios H1 11 H1 10 FY 10
Gearing (Net Debt: Shareholders Funds) 32.1% 20.8% 19.3%
Net Debt/EBITDA 1.83 1.28 1.2
Interest Cover 12.2 10.5 11.9
ROCE 9.1% 8.4% 8.4%
Working Capital as % of Sales 12.5% 12.1% 12.8%
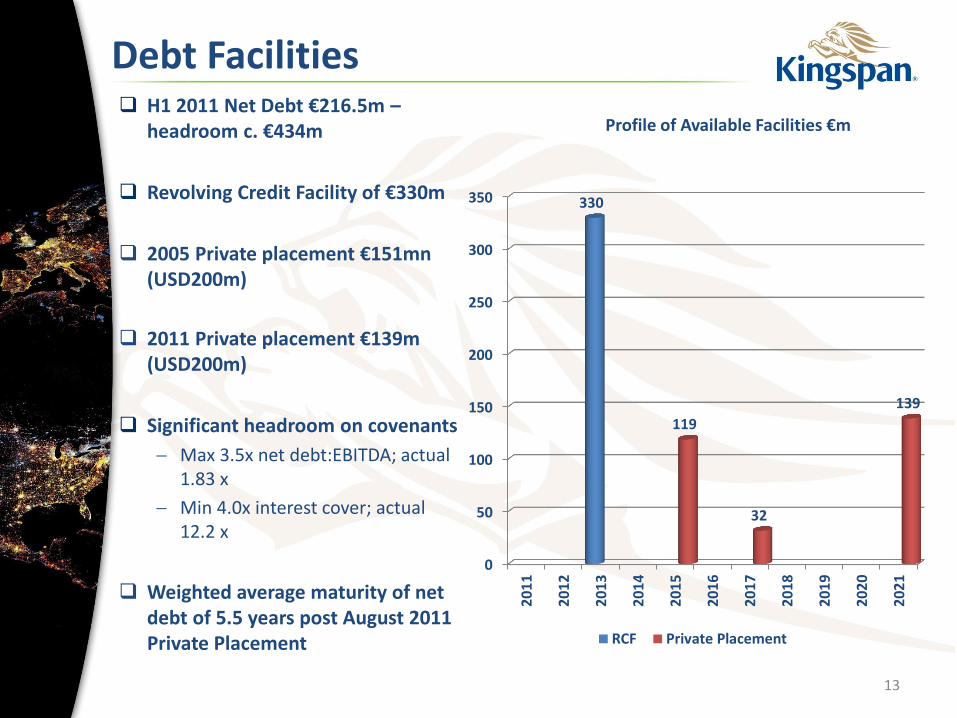
H1 2011 Net Debt €216.5m – headroom c. €434m
Revolving Credit Facility of €330m
2005 Private placement €151mn (USD200m)
2011 Private placement €139m (USD200m)
Significant headroom on covenants
Max 3.5x net debt:EBITDA; actual 1.83 x
Min 4.0x interest cover; actual 12.2 x
Weighted average maturity of net debt of 5.5 years post August 2011 Private Placement
13
Debt Facilities
0
50
100
150
200
250
300
350
20
11
20
12
20
13
20
14
20
15
20
16
20
17
20
18
20
19
20
20
20
21
330
119
32
139
Profile of Available Facilities €m
RCF Private Placement

14
2011 Interim Management Statement
BUSINESS REVIEW & OUTLOOK
€mn H1 11 H1 10 % Change at Constant
Rates
YoY % Change
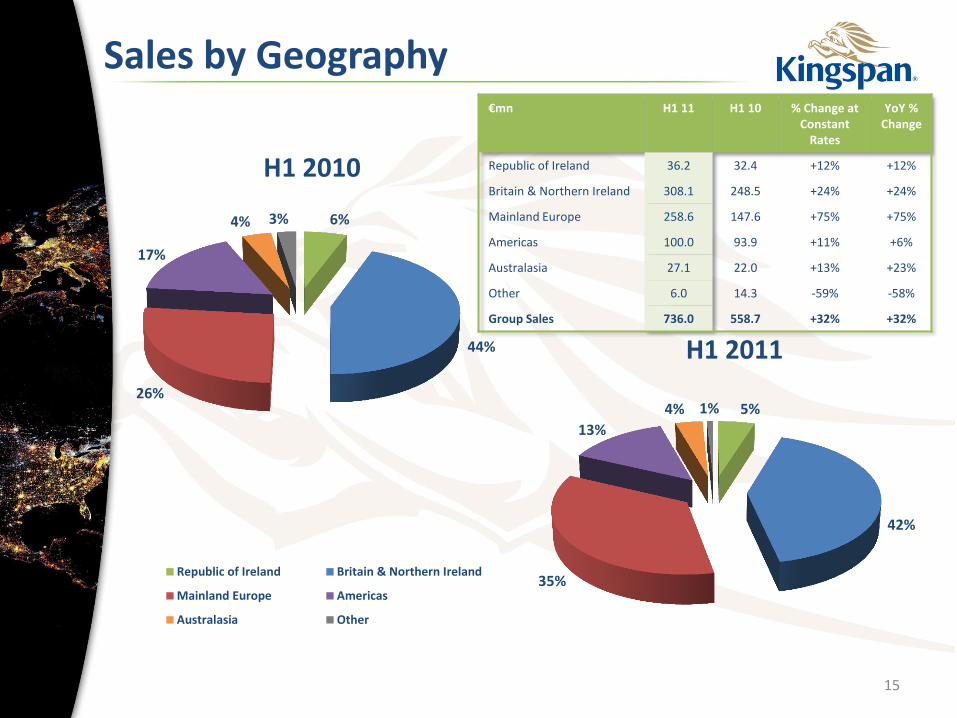
Republic of Ireland 36.2 32.4 +12% +12%
Britain & Northern Ireland 308.1 248.5 +24% +24%
Mainland Europe 258.6 147.6 +75% +75%
Americas 100.0 93.9 +11% +6%
Australasia 27.1 22.0 +13% +23%
Other 6.0 14.3 -59% -58%
Group Sales 736.0 558.7 +32% +32%
6%
44%
26%
17%
4% 3%
H1 2010
Republic of Ireland Britain & Northern Ireland
Mainland Europe Americas
Australasia Other
5%
42%
35%
13%
4% 1%
H1 2011
15
Sales by Geography

€m H1 11 H1 10 % Change at Constant
Rates
YoY % Change
Insulated Panels 350.4 287.0 +22% +22%
Insulation Boards 222.6 119.9 +85% +86%
Environmental & Renewables 97.9 83.4 +17% +17%
Access Floors 65.1 68.4 -2% -5%
Group Sales 736.0 558.7 +32% +32%
0
50
100
150
200
250
300
350
400
Insulated Panels Insulation Environmental &Renewables
Access Floors
€’m
n
H1 2011
H1 2010
16
Sales by Product Group
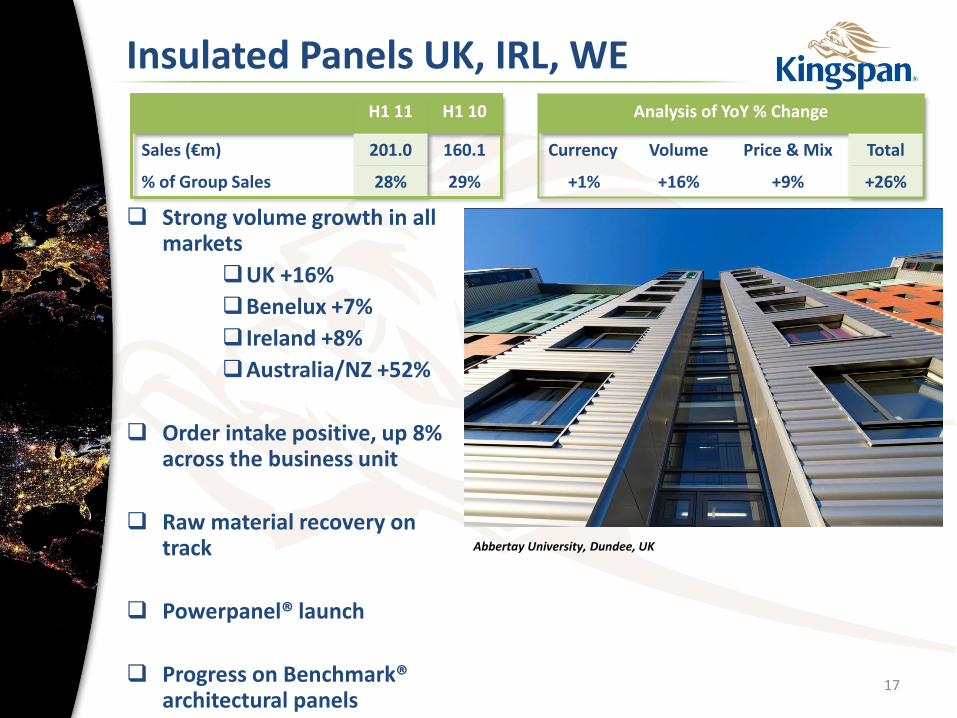
Strong volume growth in all markets
UK +16%
Benelux +7%
Ireland +8%
Australia/NZ +52%
Order intake positive, up 8% across the business unit
Raw material recovery on track
Powerpanel® launch
Progress on Benchmark® architectural panels
H1 11 H1 10
Sales (€m) 201.0 160.1
% of Group Sales 28% 29%
Analysis of YoY % Change
Currency Volume Price & Mix Total
+1% +16% +9% +26%
17
Insulated Panels UK, IRL, WE
Abbertay University, Dundee, UK
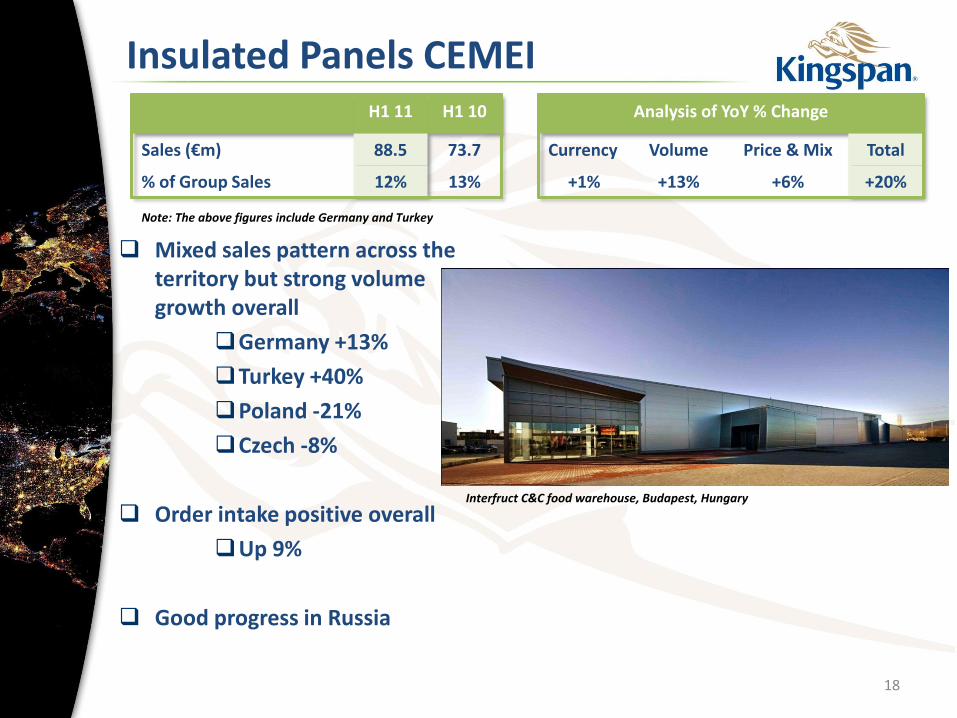
Mixed sales pattern across the territory but strong volume growth overall
Germany +13%
Turkey +40%
Poland -21%
Czech -8%
Order intake positive overall
Up 9%
Good progress in Russia
H1 11 H1 10
Sales (€m) 88.5 73.7
% of Group Sales 12% 13%
Analysis of YoY % Change
Currency Volume Price & Mix Total
+1% +13% +6% +20%
Note: The above figures include Germany and Turkey
18
Insulated Panels CEMEI
Interfruct C&C food warehouse, Budapest, Hungary

Robust volume growth in H1
US +5%
Canada +14%
Overall Order Intake -8%
Commercial and Industrial volumes strong
Coldstore volumes strong but margin pressure
Architectural disappointing sales but strong intake
US/Canada integration working very well
H1 11 H1 10
Sales (€m) 60.9 53.2
% of Group Sales 8% 10%
Analysis of YoY % Change
Currency Volume Price & Mix Total
-4% +7% +12% +15%
19
Insulated Panels North America
Print Innovators, Fredricksberg, Virginia, USA

CIE integration on track, WE strong in PIR
Robust underlying performance in UK & WE
Chemical increases a significant challenge. Recovery underway and ongoing in Q3
Phenolic conversion on track in all markets
Australia/New Zealand solid performance and improving through Q2
H1 11 H1 10
Sales (€m) 222.6 119.9
% of Group Sales 30% 21%
Analysis of YoY % Change
Currency Volume Price & Mix Acquisition Total
+1% +4% +9% +72% +86%
ExCel, London, UK
20
Insulation

Solid performance
throughout the business
unit
Continental Europe
strong, particularly
France
Solarthermal growth in
UK, US & Ireland.
Borealis case complete.
Ruling expected Jan 2012
H1 11 H1 10
Sales (€m) 97.9 83.4
% of Group Sales 13% 15%
Analysis of YoY % Change
Currency Volume, Price & Mix Total
0% +17% +17%
21
Environmental & Renewables
George Washington University, Washington DC, USA

Sales declining as expected,
down 4%
US office activity at all-time
low, likely to remain so for
ca. 2 years
Robustness of datacentre
market key counterbalance.
New product introduction
in this segment encouraging
UK market volume now in
recovery, albeit with margin
weakness
H1 11 H1 10
Sales (€m) 65.1 68.4
% of Group Sales 9% 12%
Analysis of YoY % Change
Currency Volume Price & Mix Total
-3% -4% +2% -5%
22
Access Floors
Kansas City Power & Light, USA

23
Strategy
Drive conversion to high
performance solutions
Increase penetration
Extend and develop new territories
Continuous R&D e.g. Powerpanel®
Capitalise NetZero energy → a
significant and tangible opportunity
for building occupiers over time
aided by Kingspan solutions
Haletra, The Netherlands
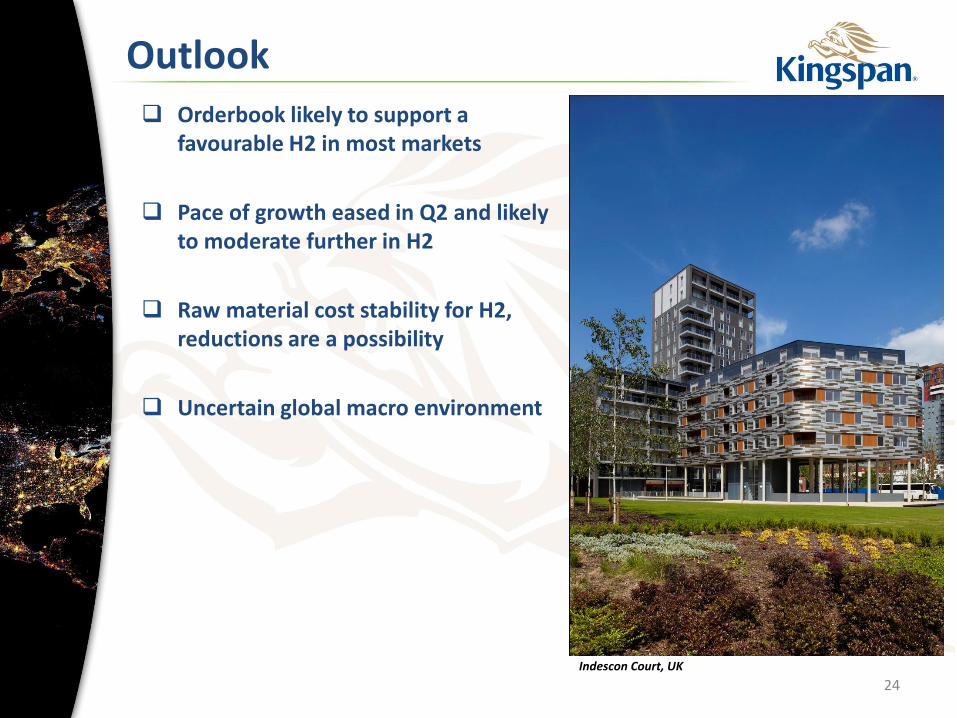
Orderbook likely to support a favourable H2 in most markets
Pace of growth eased in Q2 and likely to moderate further in H2
Raw material cost stability for H2, reductions are a possibility
Uncertain global macro environment
24
Outlook
Indescon Court, UK
25
2011 Interim Management Statement
ADDITIONAL INFORMATION
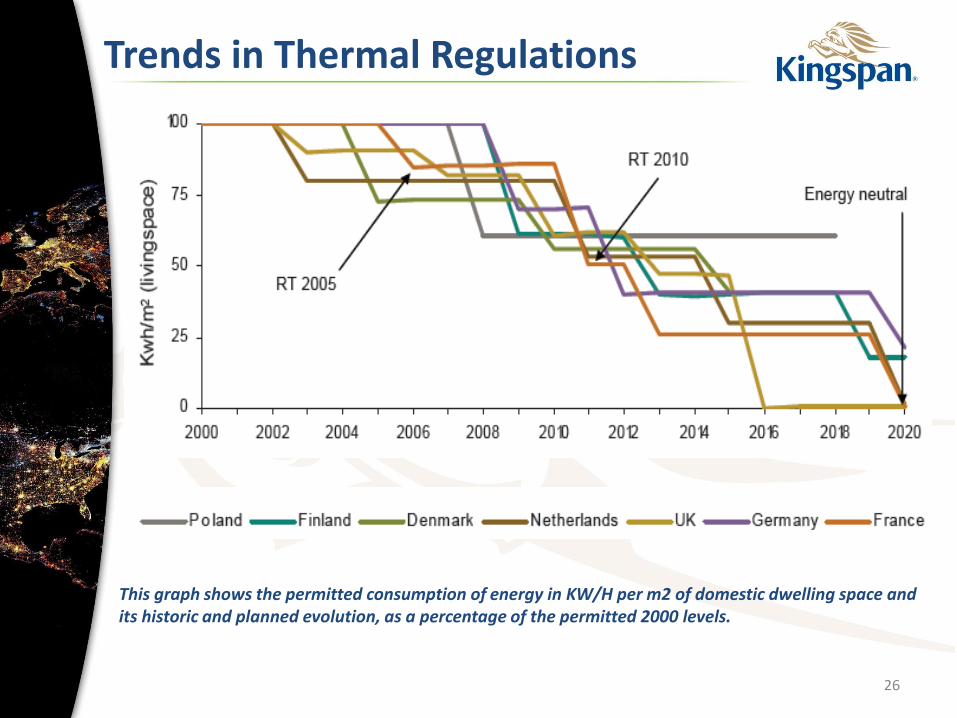
Trends in Thermal Regulations
26
This graph shows the permitted consumption of energy in KW/H per m2 of domestic dwelling space and its historic and planned evolution, as a percentage of the permitted 2000 levels.
28
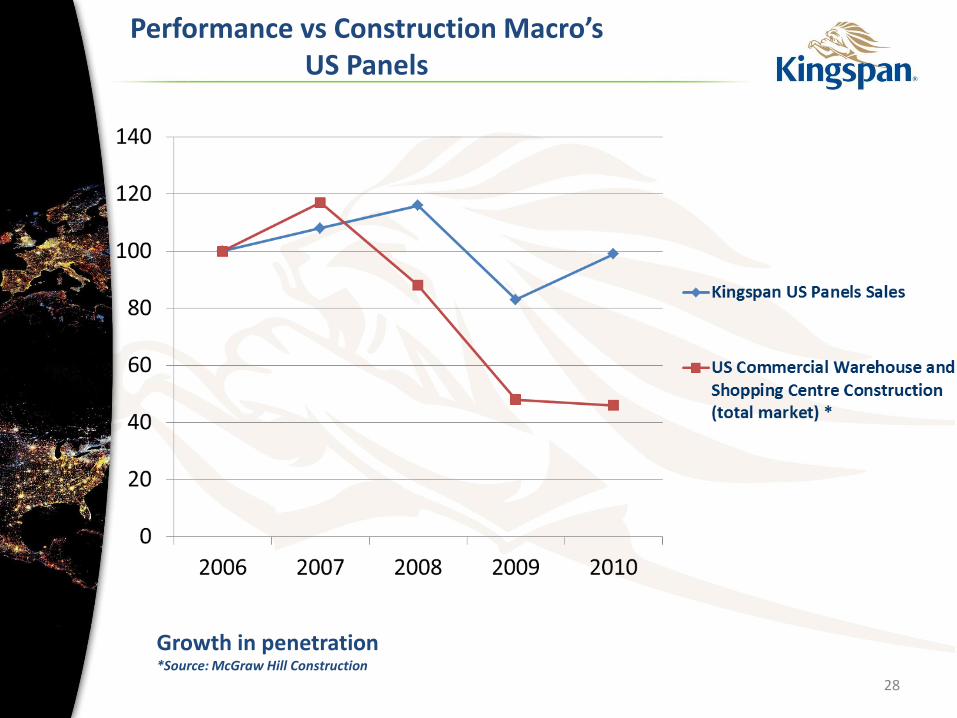
Performance vs Construction Macro’s US Panels
Growth in penetration *Source: McGraw Hill Construction

29
Performance vs Construction Macro’s UK Insulation
“Conversion” enabling out-performance

Penetration Potential
2005A 2010A 2015F
Insulated Panels UK 55% 62% 75%
Insulated Panels NA 5% 8% 11%
UK Insulation 30% 34% 38%
Germany External Wall 0% 2% 10%
CEE Insulation Board 0% 0.7% 6%
30

General improvement in UK residential and low rise commercial likely to continue in the near term. Office construction anticipated to fall further, and state-funded projects will decline
Insulated Panels and Insulation expect solid H12011, stable in the UK, growth in Mainland Europe and North America
Growth in refurbishment globally. Many exciting initiatives, including the UK’s “Green Deal”
Rising steel prices and contracting Access Floors activity will present margin challenges across the Group through 2011
Outlook
31