kinase inhibitors in rheumatoid arthritis: jak/ stat...
TRANSCRIPT
Kinase inhibitors in rheumatoid arthritis: JAK/STAT signaling pathway
Professor Peter C. Taylor MA, PhD, FRCP
Tyrosine Kinase Inhibitors in Health and Rheumatic Diseases Ankara, Turkey. 12 March 2011
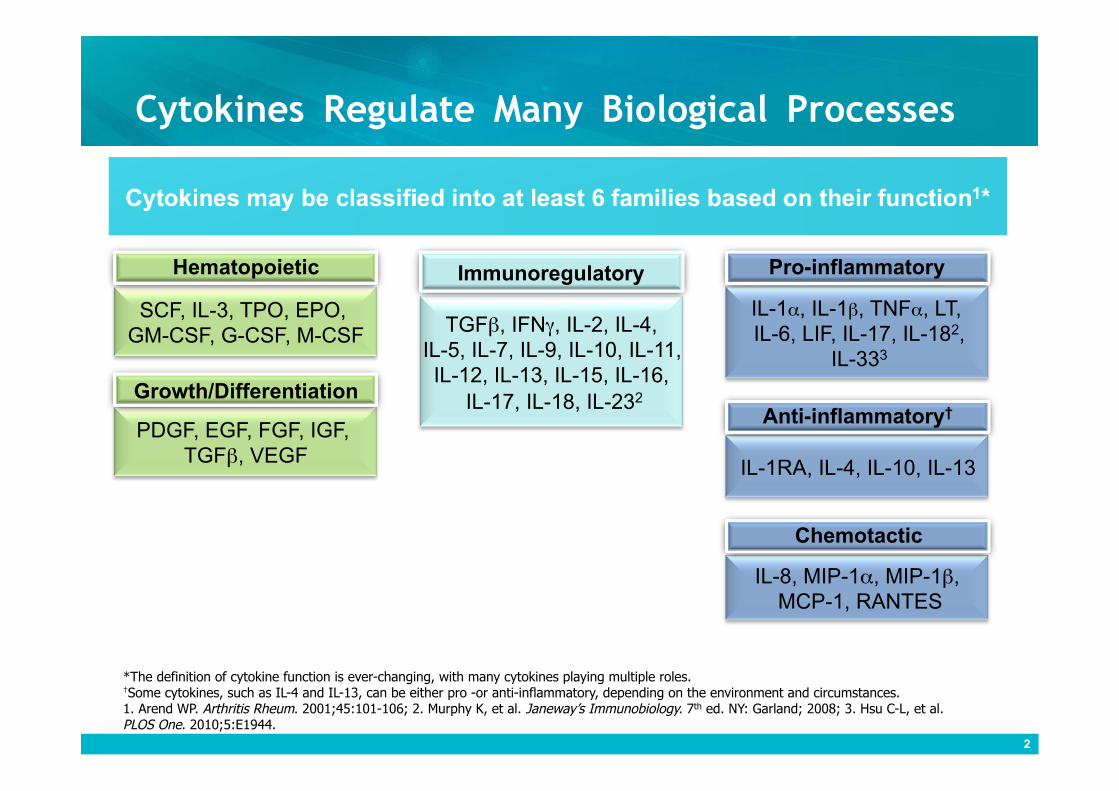
Cytokines Regulate Many Biological Processes
2
SCF, IL-3, TPO, EPO, GM-CSF, G-CSF, M-CSF
Hematopoietic
PDGF, EGF, FGF, IGF, TGFβ, VEGF
Growth/Differentiation
TGFβ, IFNγ, IL-2, IL-4, IL-5, IL-7, IL-9, IL-10, IL-11, IL-12, IL-13, IL-15, IL-16,
IL-17, IL-18, IL-232
Immunoregulatory
IL-1α, IL-1β, TNFα, LT, IL-6, LIF, IL-17, IL-182,
IL-333
Pro-inflammatory
IL-1RA, IL-4, IL-10, IL-13
Anti-inflammatory†
IL-8, MIP-1α, MIP-1β, MCP-1, RANTES
Chemotactic
*The definition of cytokine function is ever-changing, with many cytokines playing multiple roles. †Some cytokines, such as IL-4 and IL-13, can be either pro -or anti-inflammatory, depending on the environment and circumstances. 1. Arend WP. Arthritis Rheum. 2001;45:101-106; 2. Murphy K, et al. Janeway’s Immunobiology. 7th ed. NY: Garland; 2008; 3. Hsu C-L, et al. PLOS One. 2010;5:E1944.
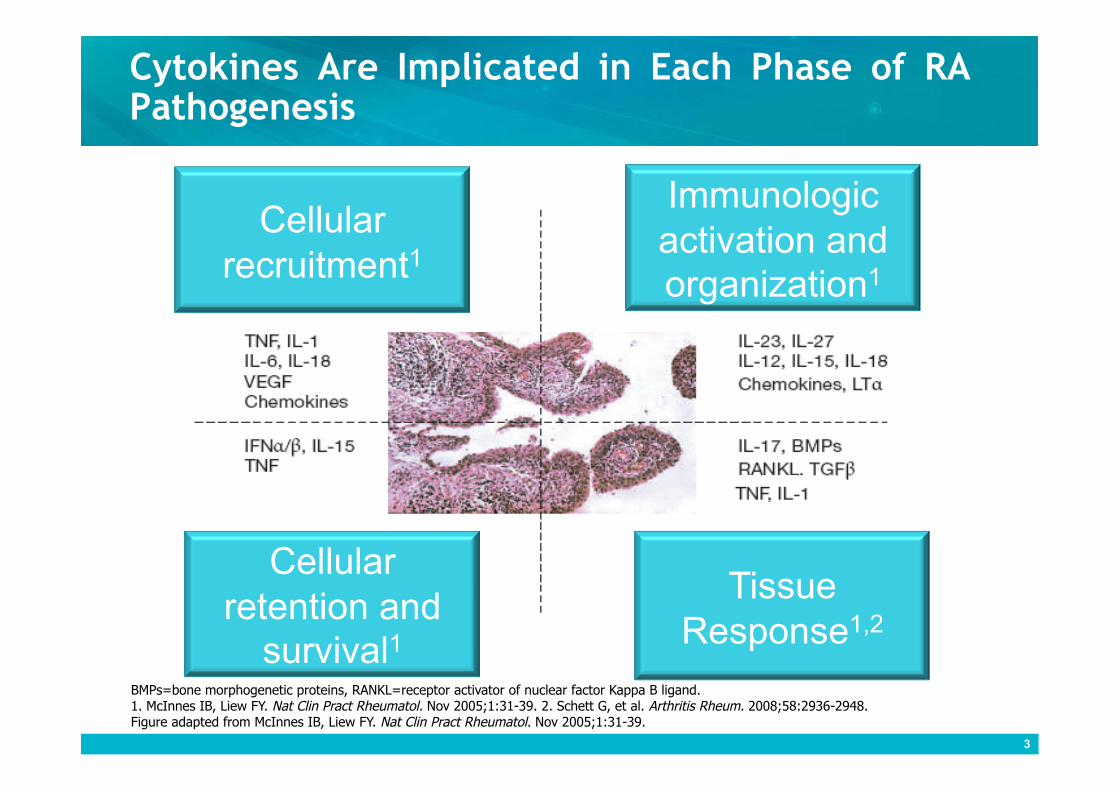
Cytokines Are Implicated in Each Phase of RA Pathogenesis
3
Cellular recruitment1
Immunologic activation and organization1
Cellular retention and
survival1
Tissue Response1,2
BMPs=bone morphogenetic proteins, RANKL=receptor activator of nuclear factor Kappa B ligand. 1. McInnes IB, Liew FY. Nat Clin Pract Rheumatol. Nov 2005;1:31-39. 2. Schett G, et al. Arthritis Rheum. 2008;58:2936-2948. Figure adapted from McInnes IB, Liew FY. Nat Clin Pract Rheumatol. Nov 2005;1:31-39.
Cytokines and Intracellular Signaling Pathways in RA
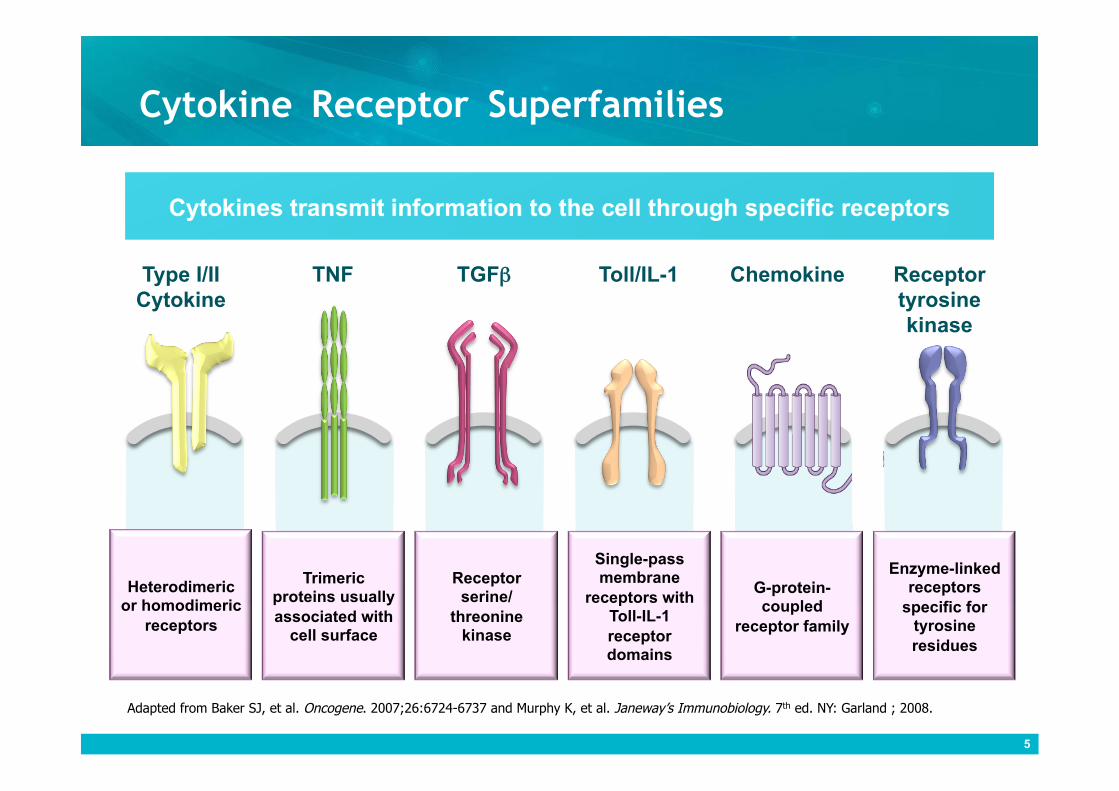
Cytokine Receptor Superfamilies
Chemokine Toll/IL-1 TGFβ TNF Type I/II Cytokine
Receptor tyrosine kinase
Trimeric proteins usually associated with
cell surface
Receptor serine/
threonine kinase
G-protein-coupled
receptor family
Enzyme-linked receptors
specific for tyrosine residues
Heterodimeric or homodimeric
receptors
Single-pass membrane
receptors with Toll-IL-1 receptor domains
5
Adapted from Baker SJ, et al. Oncogene. 2007;26:6724-6737 and Murphy K, et al. Janeway’s Immunobiology. 7th ed. NY: Garland ; 2008.
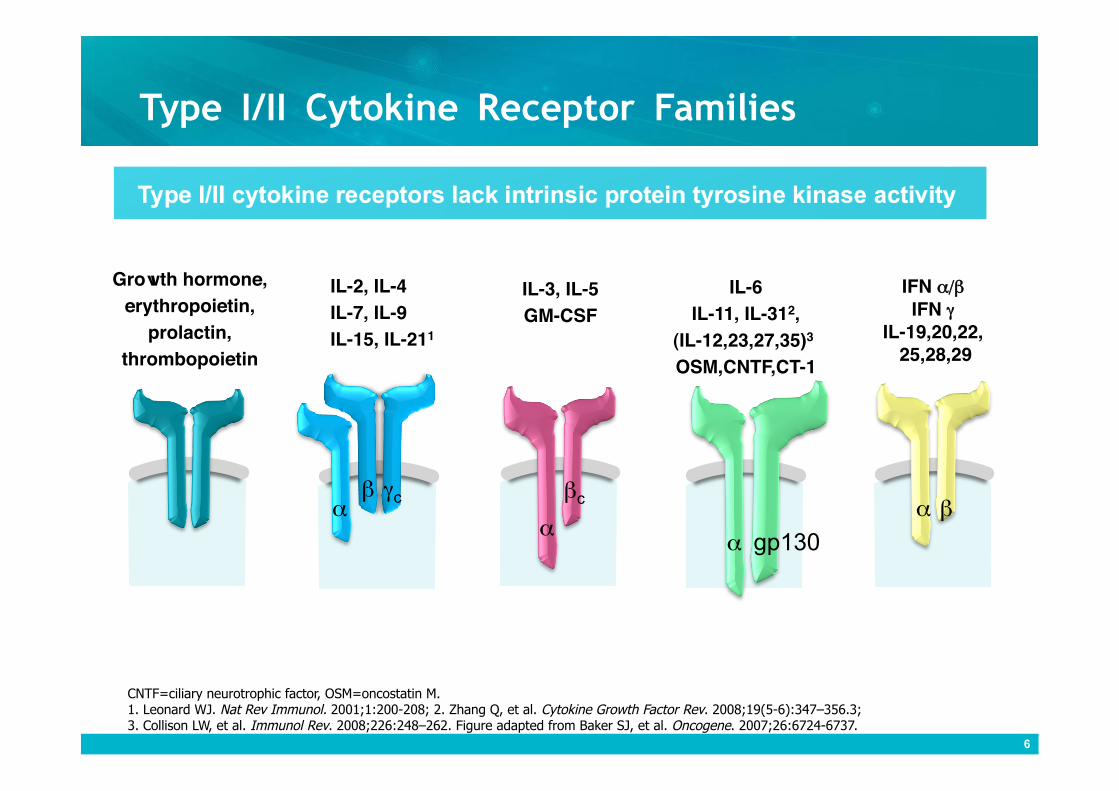
Type I/II Cytokine Receptor Families
IL-2, IL-4 IL-7, IL-9 IL-15, IL-211
Growth hormone, erythropoietin,
prolactin, thrombopoietin
IL-3, IL-5 GM-CSF
IL-6 IL-11, IL-312,
(IL-12,23,27,35)3 OSM,CNTF,CT-1
IFN α/β IFN γ
IL-19,20,22,��� 25,28,29
α β γc
α
βc
α gp130
α β
CNTF=ciliary neurotrophic factor, OSM=oncostatin M. 1. Leonard WJ. Nat Rev Immunol. 2001;1:200-208; 2. Zhang Q, et al. Cytokine Growth Factor Rev. 2008;19(5-6):347–356.3; 3. Collison LW, et al. Immunol Rev. 2008;226:248–262. Figure adapted from Baker SJ, et al. Oncogene. 2007;26:6724-6737.
6
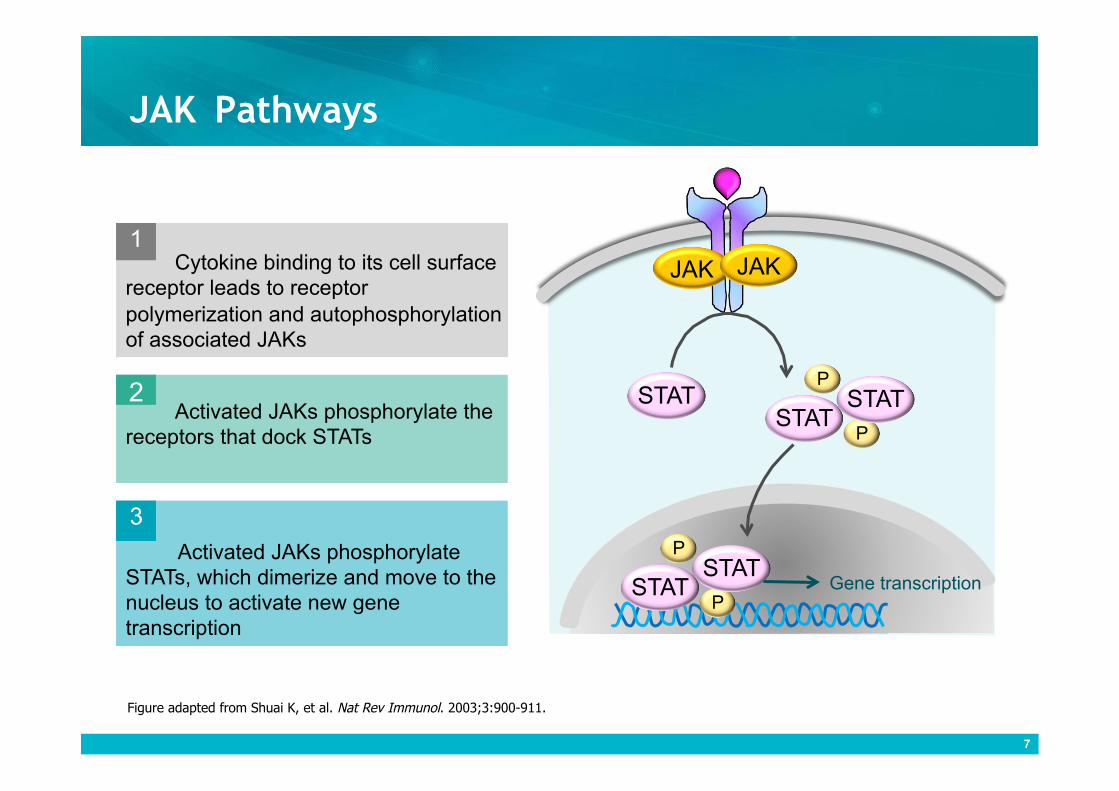
JAK Pathways
7
Cytokine binding to its cell surface receptor leads to receptor polymerization and autophosphorylation of associated JAKs
1
Activated JAKs phosphorylate the receptors that dock STATs
2
Activated JAKs phosphorylate STATs, which dimerize and move to the nucleus to activate new gene transcription
3
JAK JAK
STAT
P STAT
P STAT
P STAT
P STAT
Gene transcription
7
Figure adapted from Shuai K, et al. Nat Rev Immunol. 2003;3:900-911.
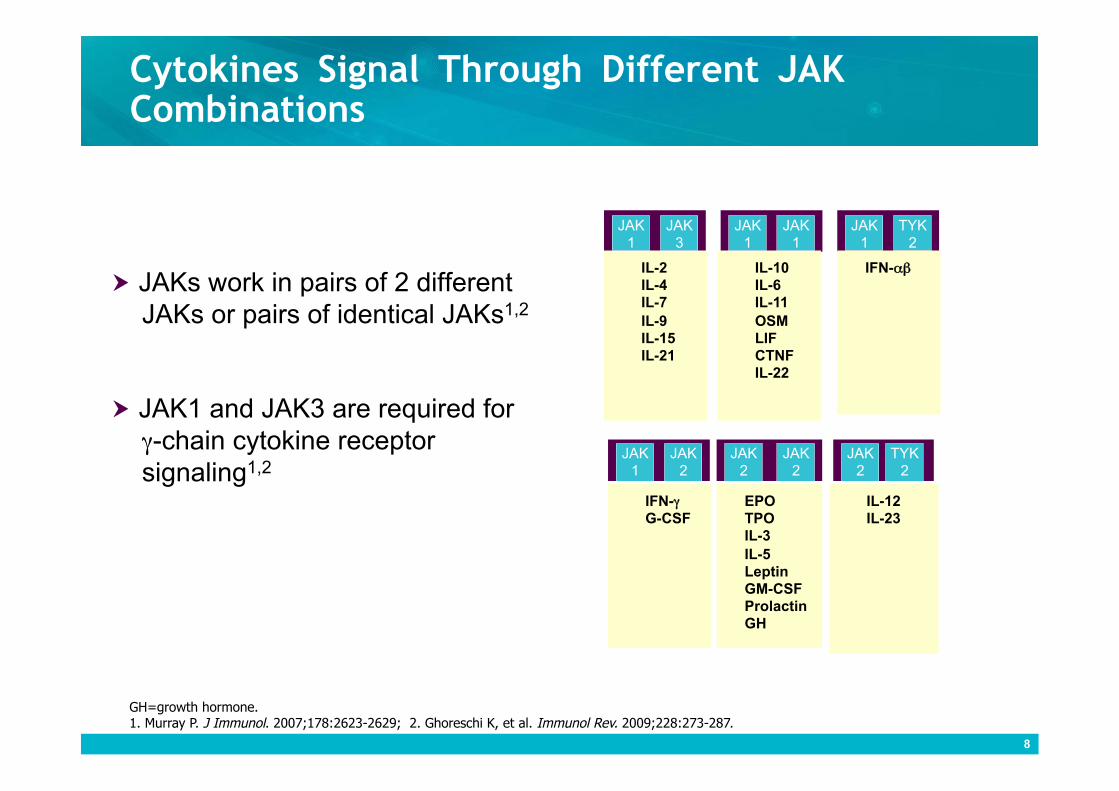
Cytokines Signal Through Different JAK Combinations
GH=growth hormone. 1. Murray P. J Immunol. 2007;178:2623-2629; 2. Ghoreschi K, et al. Immunol Rev. 2009;228:273-287.
TYK 2
IL-10 IL-6 IL-11 OSM LIF CTNF IL-22
JAK 1
TYK 2
JAK 1
JAK 1
JAK 1
JAK 2
JAK 2
JAK 2
JAK 2
IFN-αβ IL-2 IL-4 IL-7 IL-9 IL-15 IL-21
JAK 1
JAK 3
EPO TPO IL-3 IL-5 Leptin GM-CSF Prolactin GH
IL-12 IL-23
IFN-γ G-CSF
8
JAKs work in pairs of 2 different JAKs or pairs of identical JAKs1,2
JAK1 and JAK3 are required for γ-chain cytokine receptor signaling1,2
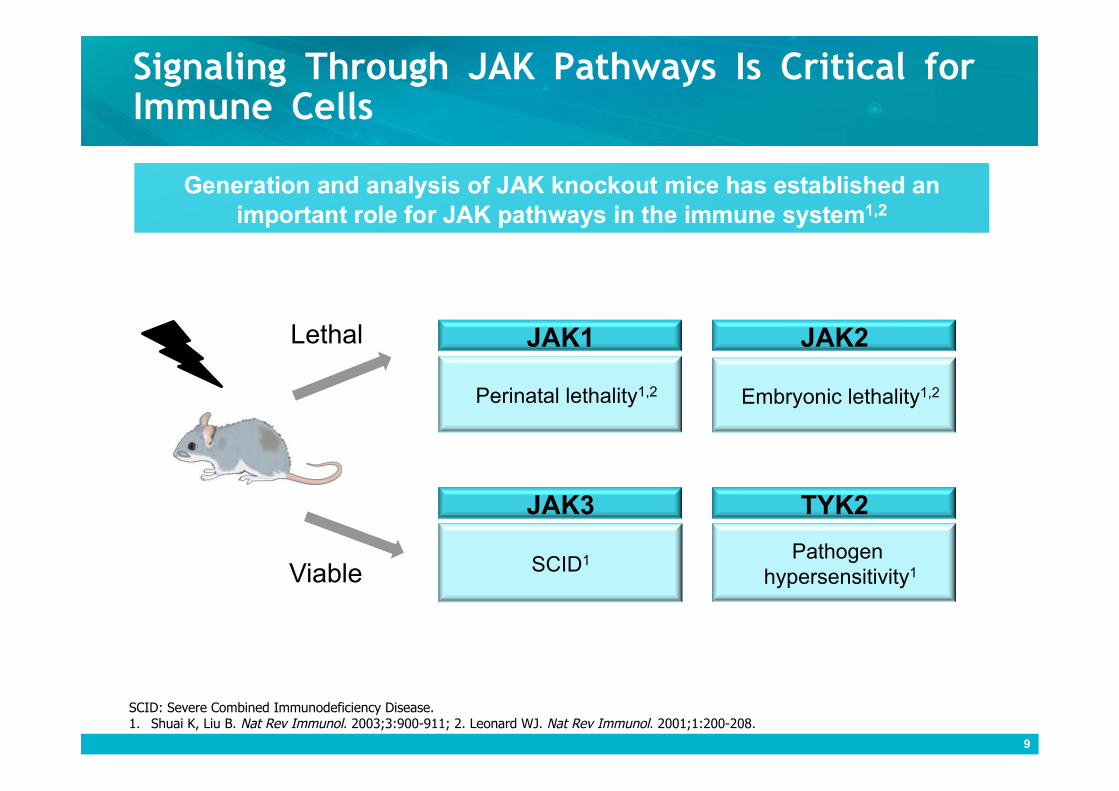
Signaling Through JAK Pathways Is Critical for Immune Cells
9
Perinatal lethality1,2
JAK1
Pathogen hypersensitivity1
TYK2
Embryonic lethality1,2
JAK2
SCID1
JAK3
Lethal
Viable
SCID: Severe Combined Immunodeficiency Disease. 1. Shuai K, Liu B. Nat Rev Immunol. 2003;3:900-911; 2. Leonard WJ. Nat Rev Immunol. 2001;1:200-208.
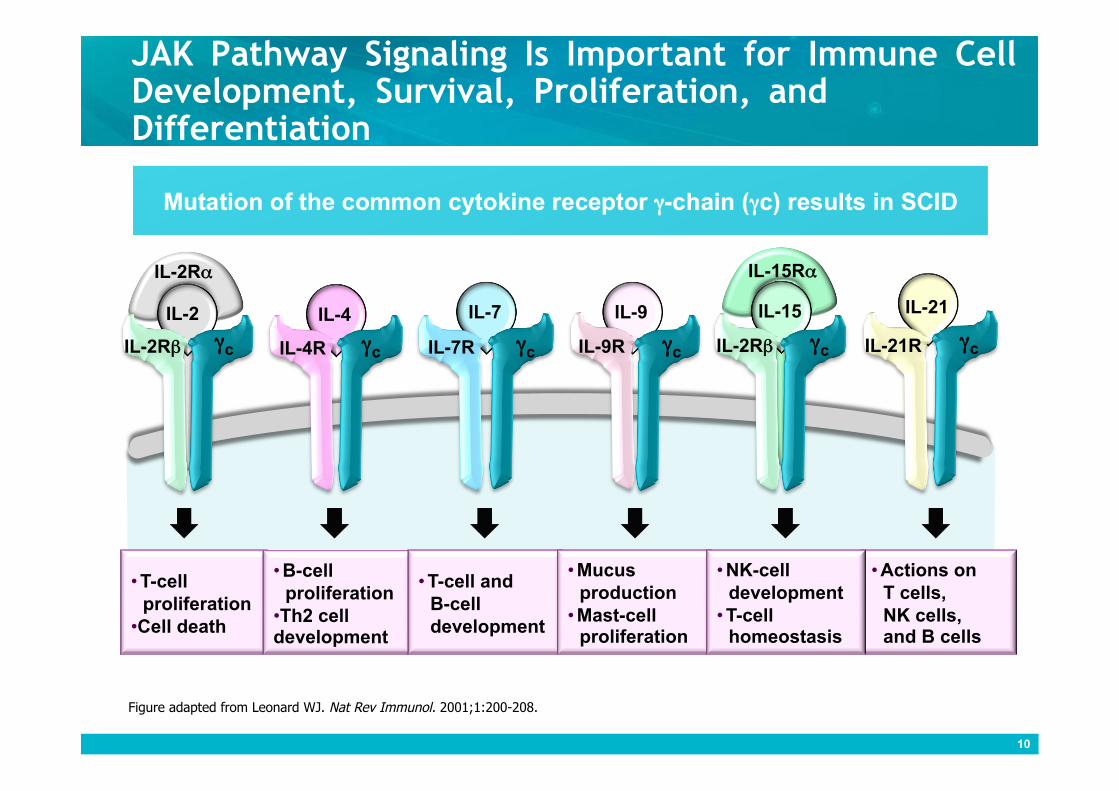
JAK Pathway Signaling Is Important for Immune Cell Development, Survival, Proliferation, and Differentiation
10
IL-21 IL-15
IL-15Rα
IL-2
IL-2Rα
IL-4 IL-7 IL-9
γc γc γc γc γc γc IL-4R IL-2Rβ IL-7R IL-9R IL-2Rβ
• T-cell proliferation
• Cell death
• B-cell proliferation
• Th2 cell development
• T-cell and B-cell development
• Actions on T cells, NK cells, and B cells
• Mucus production
• Mast-cell proliferation
• NK-cell development
• T-cell homeostasis
Figure adapted from Leonard WJ. Nat Rev Immunol. 2001;1:200-208.
IL-21R
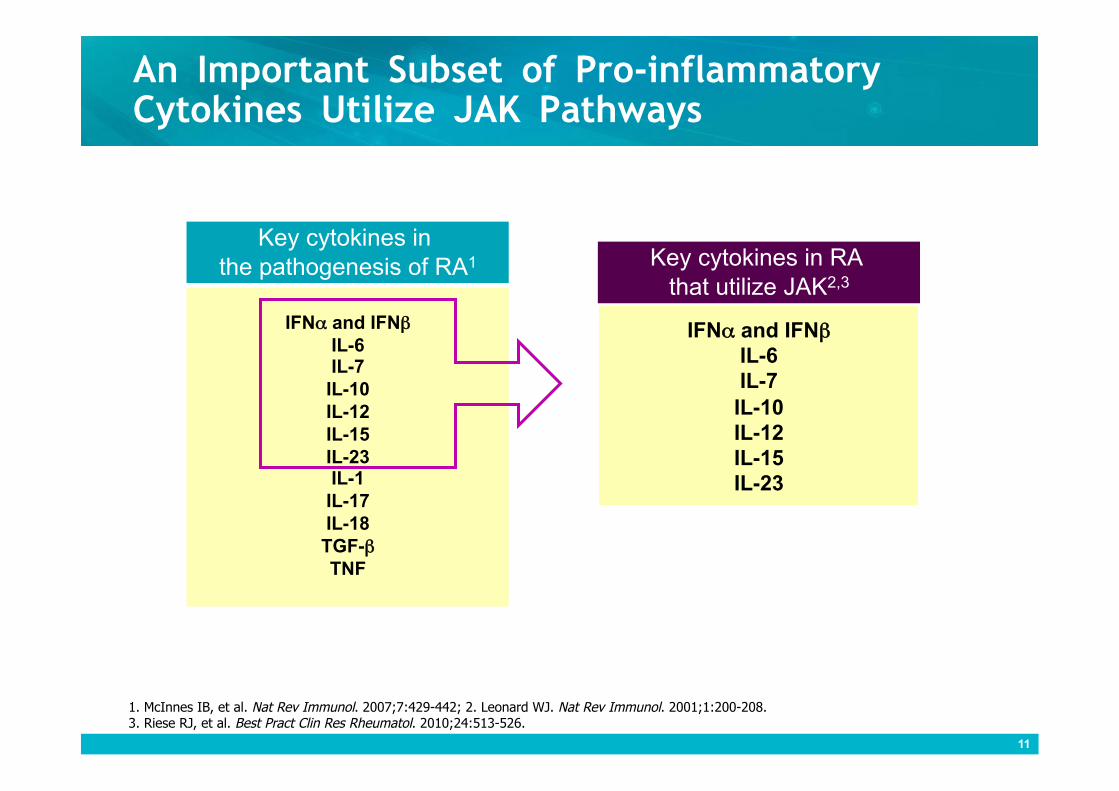
An Important Subset of Pro-inflammatory Cytokines Utilize JAK Pathways
IFNα and IFNβ IL-6 IL-7
IL-10 IL-12 IL-15 IL-23 IL-1
IL-17 IL-18 TGF-β TNF
IFNα and IFNβ IL-6 IL-7
IL-10 IL-12 IL-15 IL-23
Key cytokines in the pathogenesis of RA1 Key cytokines in RA
that utilize JAK2,3
11
1. McInnes IB, et al. Nat Rev Immunol. 2007;7:429-442; 2. Leonard WJ. Nat Rev Immunol. 2001;1:200-208. 3. Riese RJ, et al. Best Pract Clin Res Rheumatol. 2010;24:513-526.
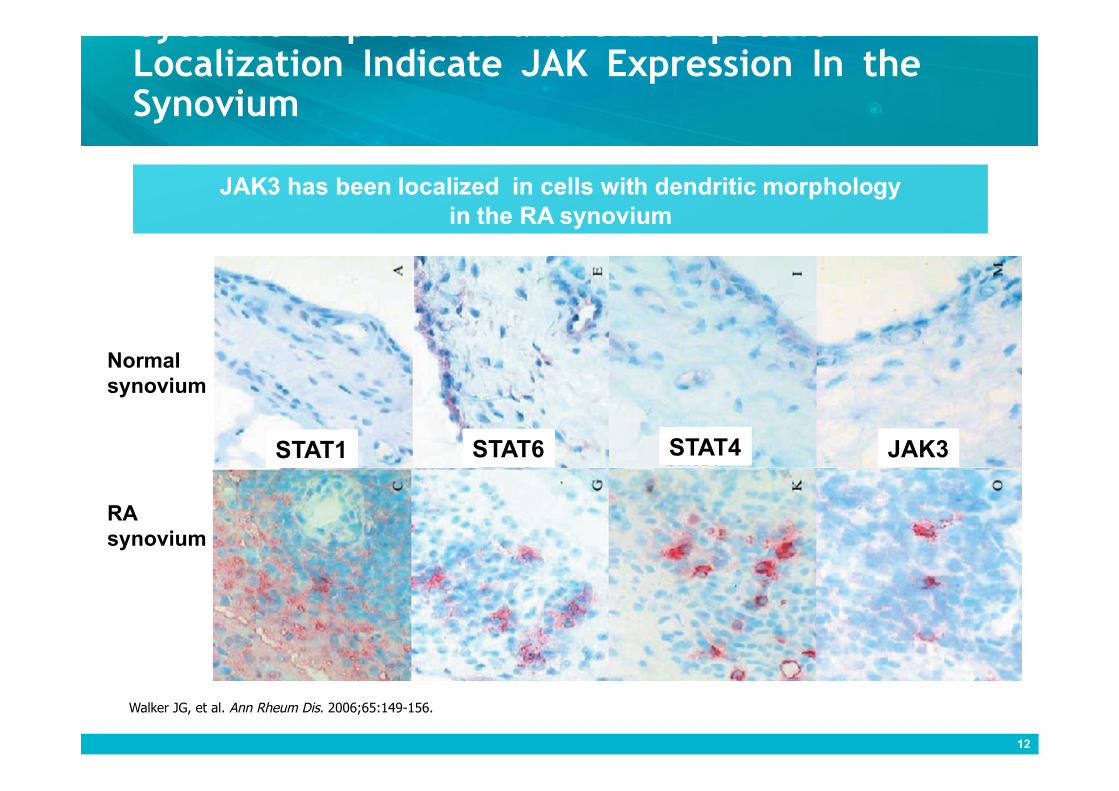
Cytokine Expression and JAK3-specific Localization Indicate JAK Expression In the Synovium
Normal synovium
RA synovium
Walker JG, et al. Ann Rheum Dis. 2006;65:149-156.
STAT1 STAT6 STAT4 JAK3
12
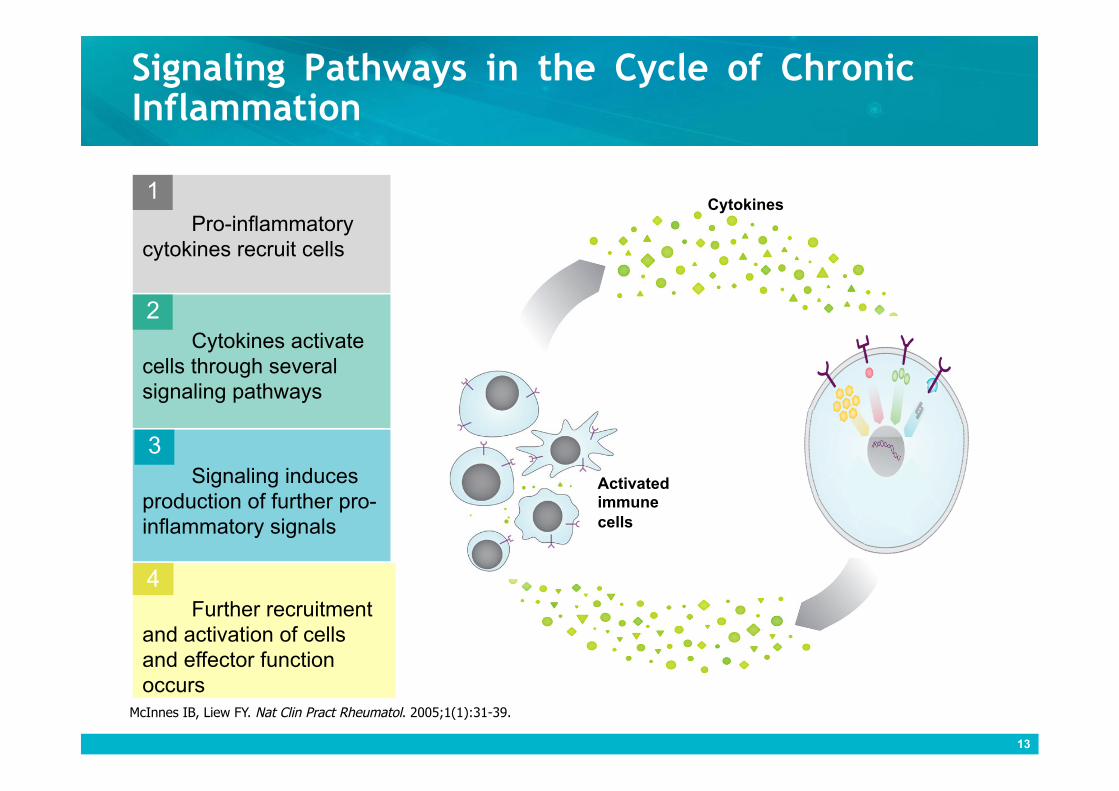
Signaling Pathways in the Cycle of Chronic Inflammation
Cytokines activate cells through several signaling pathways
2
Signaling induces production of further pro-inflammatory signals
3
Further recruitment and activation of cells and effector function occurs
4
Pro-inflammatory cytokines recruit cells
1 Cytokines
Activated immune cells
McInnes IB, Liew FY. Nat Clin Pract Rheumatol. 2005;1(1):31-39.
13
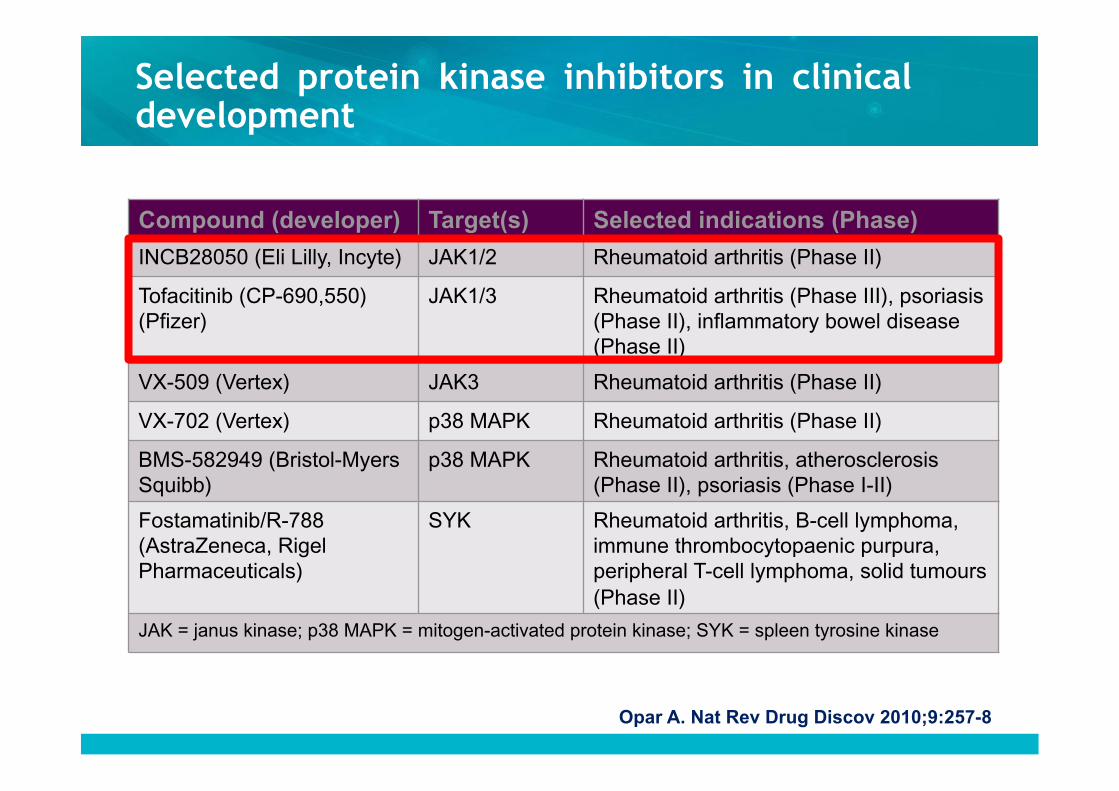
Opar A. Nat Rev Drug Discov 2010;9:257-8
Compound (developer) Target(s) Selected indications (Phase)
INCB28050 (Eli Lilly, Incyte) JAK1/2 Rheumatoid arthritis (Phase II)
Tofacitinib (CP-690,550) (Pfizer)
JAK1/3 Rheumatoid arthritis (Phase III), psoriasis (Phase II), inflammatory bowel disease (Phase II)
VX-509 (Vertex) JAK3 Rheumatoid arthritis (Phase II)
VX-702 (Vertex) p38 MAPK Rheumatoid arthritis (Phase II)
BMS-582949 (Bristol-Myers Squibb)
p38 MAPK Rheumatoid arthritis, atherosclerosis (Phase II), psoriasis (Phase I-II)
Fostamatinib/R-788 (AstraZeneca, Rigel Pharmaceuticals)
SYK Rheumatoid arthritis, B-cell lymphoma, immune thrombocytopaenic purpura, peripheral T-cell lymphoma, solid tumours (Phase II)
JAK = janus kinase; p38 MAPK = mitogen-activated protein kinase; SYK = spleen tyrosine kinase
Selected protein kinase inhibitors in clinical development
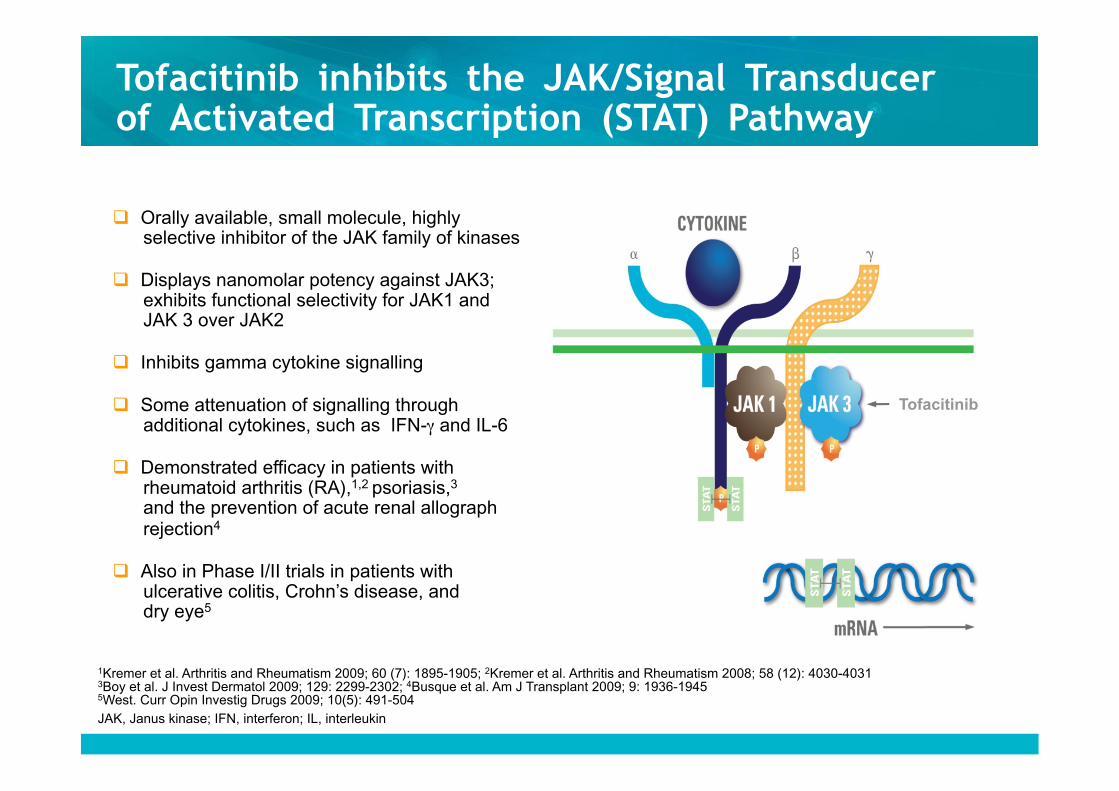
Orally available, small molecule, highly selective inhibitor of the JAK family of kinases
Displays nanomolar potency against JAK3; exhibits functional selectivity for JAK1 and JAK 3 over JAK2
Inhibits gamma cytokine signalling
Some attenuation of signalling through additional cytokines, such as IFN-γ and IL-6
Demonstrated efficacy in patients with rheumatoid arthritis (RA),1,2 psoriasis,3 and the prevention of acute renal allograph rejection4
Also in Phase I/II trials in patients with ulcerative colitis, Crohn’s disease, and dry eye5
1Kremer et al. Arthritis and Rheumatism 2009; 60 (7): 1895-1905; 2Kremer et al. Arthritis and Rheumatism 2008; 58 (12): 4030-4031 3Boy et al. J Invest Dermatol 2009; 129: 2299-2302; 4Busque et al. Am J Transplant 2009; 9: 1936-1945 5West. Curr Opin Investig Drugs 2009; 10(5): 491-504 JAK, Janus kinase; IFN, interferon; IL, interleukin
Tofacitinib inhibits the JAK/Signal Transducer of Activated Transcription (STAT) Pathway
Tofacitinib
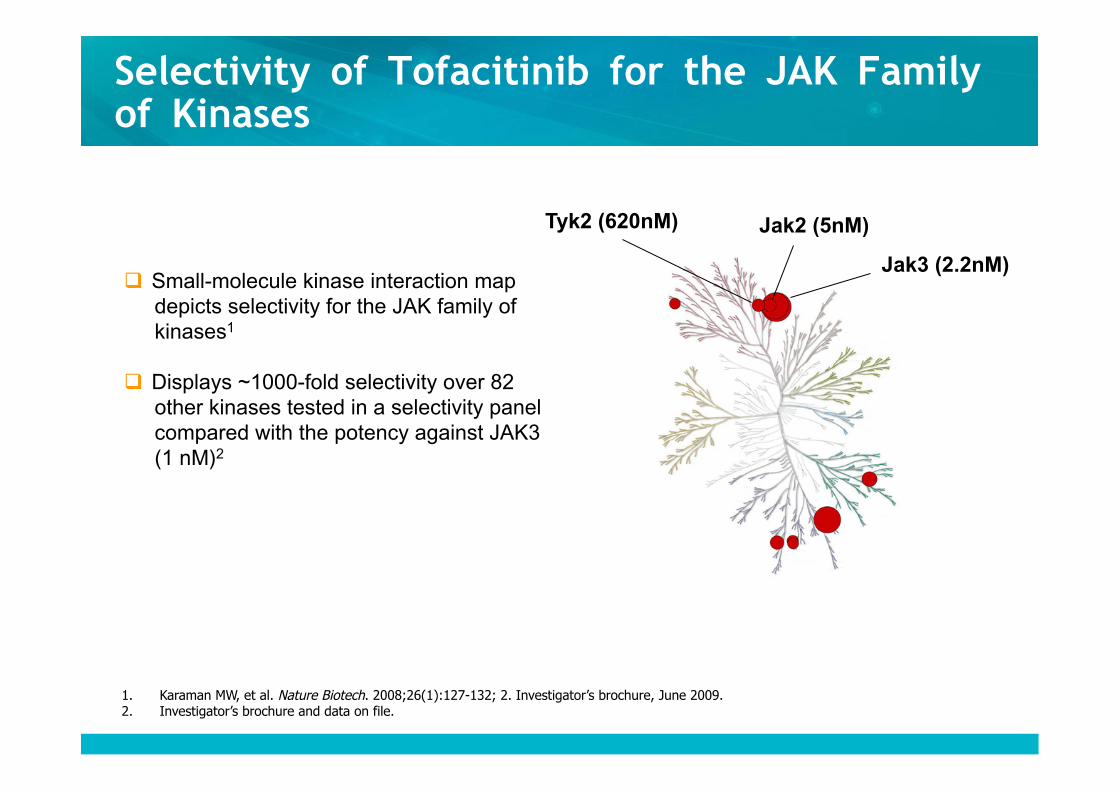
Selectivity of Tofacitinib for the JAK Family of Kinases
Small-molecule kinase interaction map depicts selectivity for the JAK family of kinases1
Displays ~1000-fold selectivity over 82 other kinases tested in a selectivity panel compared with the potency against JAK3 (1 nM)2
Jak3 (2.2nM)
Jak2 (5nM) Tyk2 (620nM)
1. Karaman MW, et al. Nature Biotech. 2008;26(1):127-132; 2. Investigator’s brochure, June 2009. 2. Investigator’s brochure and data on file.
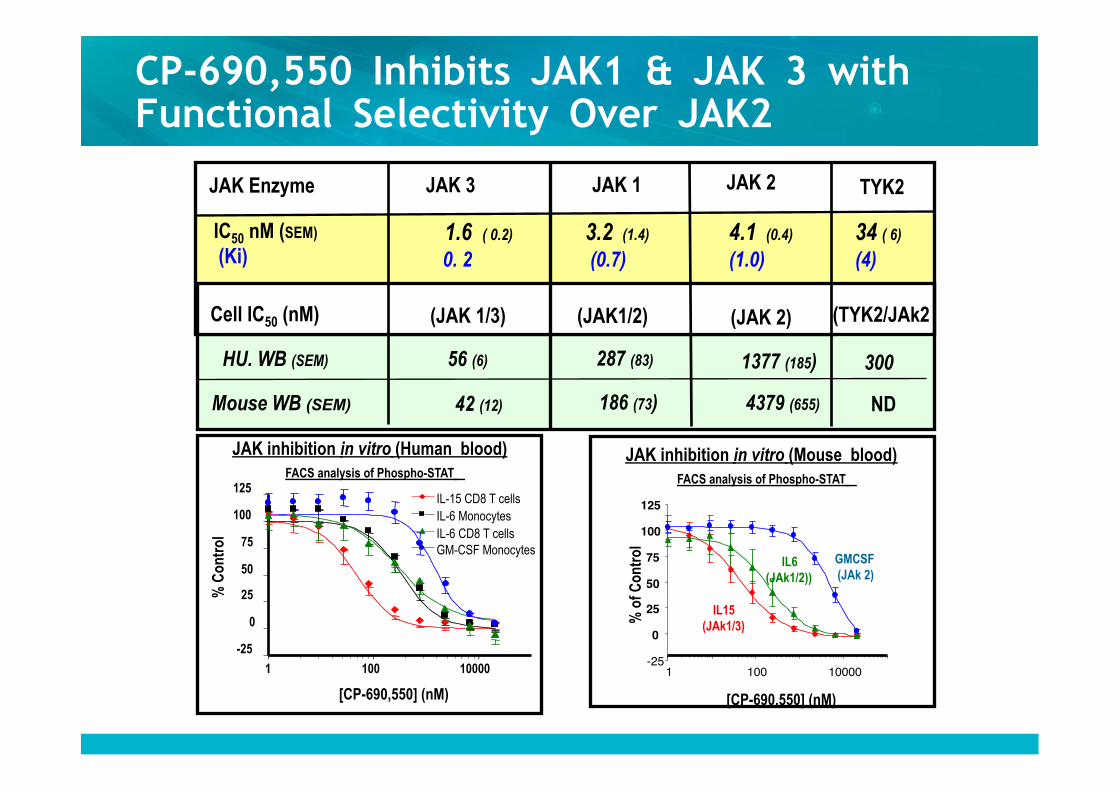
JAK inhibition in vitro (Human blood) FACS analysis of Phospho-STAT
-25
0
25
50
75
100
125
1 100 10000
[CP-690,550] (nM)
% C
ontr
ol
IL-15 CD8 T cells IL-6 Monocytes IL-6 CD8 T cells GM-CSF Monocytes
JAK Enzyme JAK 1 JAK 2 JAK 3
IC50 nM (SEM) (Ki)
3.2 (1.4)
(0.7) 4.1 (0.4)
(1.0) 1.6 ( 0.2)
0. 2
Cell IC50 (nM) (JAK1/2)
HU. WB (SEM) 287 (83) 1377 (185) 56 (6)
Mouse WB (SEM) 186 (73) 4379 (655) 42 (12)
(JAK 2) (JAK 1/3)
JAK inhibition in vitro (Mouse blood) FACS analysis of Phospho-STAT
-25 0
25 50 75
100 125
1 100 10000 [CP-690,550] (nM)
% o
f Con
trol
IL15 (JAk1/3)
IL6 (JAk1/2))
GMCSF (JAk 2)
TYK2
34 ( 6)
(4)
(TYK2/JAk2
300
ND
CP-690,550 Inhibits JAK1 & JAK 3 with Functional Selectivity Over JAK2
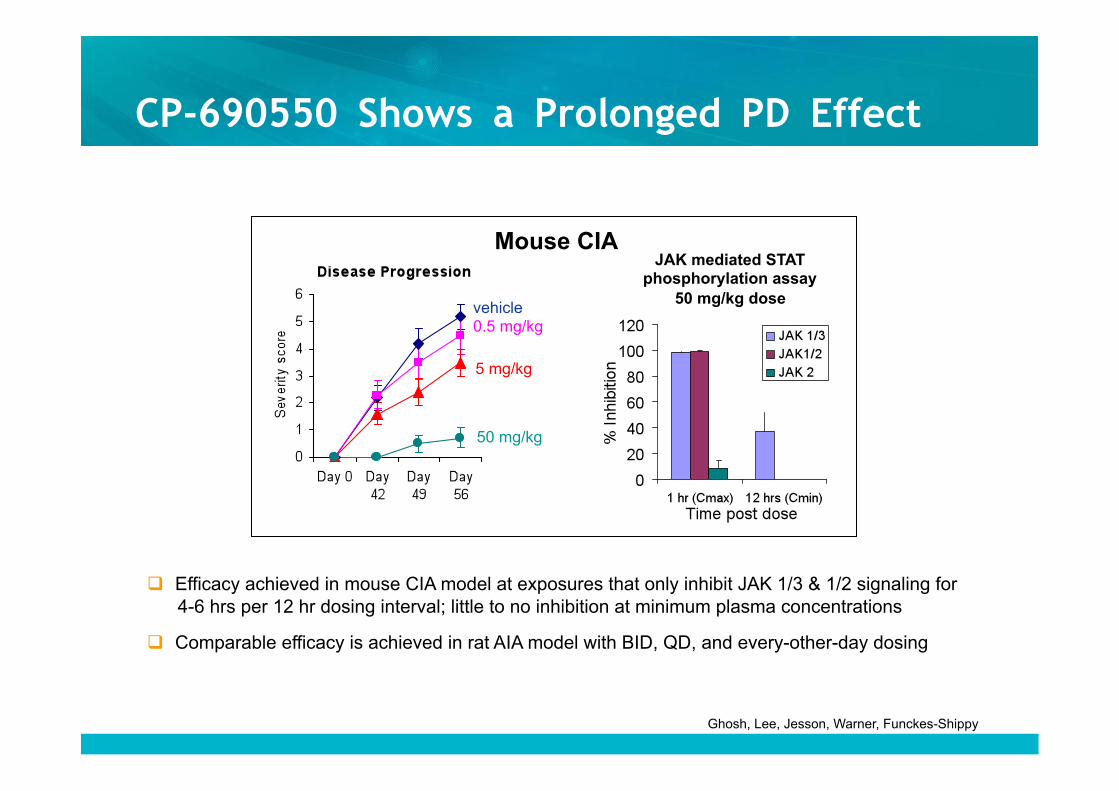
CP-690550 Shows a Prolonged PD Effect
Efficacy achieved in mouse CIA model at exposures that only inhibit JAK 1/3 & 1/2 signaling for 4-6 hrs per 12 hr dosing interval; little to no inhibition at minimum plasma concentrations
Comparable efficacy is achieved in rat AIA model with BID, QD, and every-other-day dosing
Ghosh, Lee, Jesson, Warner, Funckes-Shippy
Mouse CIA JAK mediated STAT
phosphorylation assay 50 mg/kg dose
50 mg/kg
5 mg/kg
vehicle 0.5 mg/kg
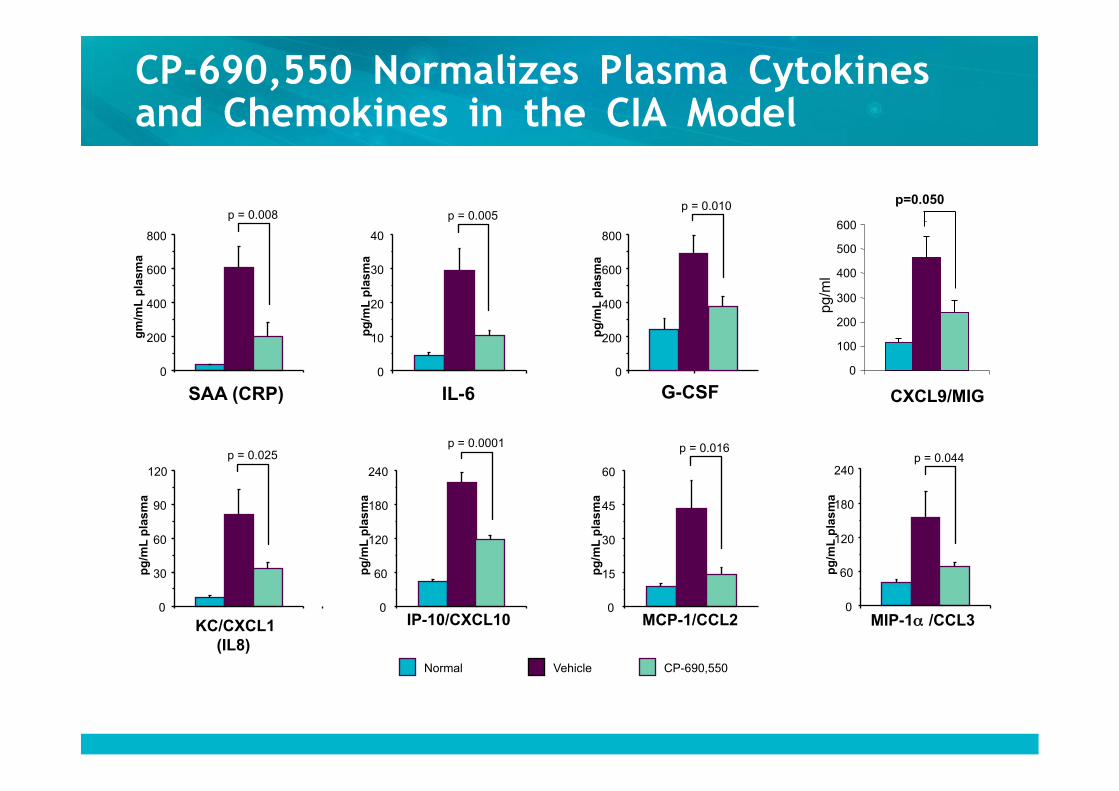
CP-690,550 Normalizes Plasma Cytokines and Chemokines in the CIA Model
SAA (CRP) 0
200
400
600
800
gm
/mL
pla
sma
p = 0.008
G-CSF 0
200
400
600
800
pg
/mL
pla
sma
p = 0.010
MCP-1/CCL2 0
15
30
45
60
pg
/mL
pla
sma
p = 0.016
IL-6 0
10
20
30
40
pg
/mL
pla
sma
p = 0.005
IP-10/CXCL10 0
60
120
180
240
pg
/mL
pla
sma
p = 0.0001
Normal Vehicle CP-690,550
MIP-1α /CCL3 0
60
120
180
240
pg
/mL
pla
sma
p = 0.044
0 100 200 300 400 500 600
CXCL9/MIG
pg/m
l
p=0.050
KC/CXCL1 0
30
60
90
120
pg
/mL
pla
sma
p = 0.025
(IL8)
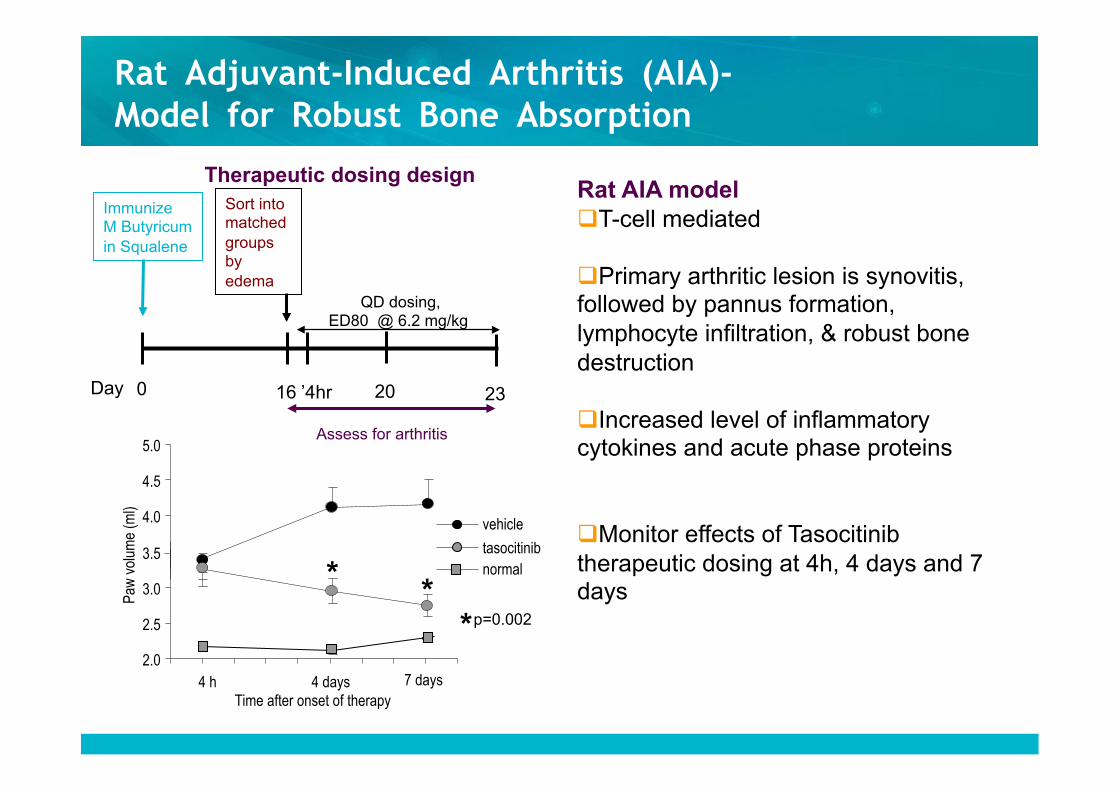
2.0
2.5
3.0
3.5
4.0
4.5
5.0
4 h 4 days
Paw
vol
ume
(ml)
vehicle
tasocitinib normal
Time after onset of therapy 7 days
* * * p=0.002
Assess for arthritis
Immunize M Butyricum in Squalene
Day 0 16 23 ’4hr
QD dosing, ED80 @ 6.2 mg/kg
Therapeutic dosing design
20
Sort into matched groups by edema
Rat Adjuvant-Induced Arthritis (AIA)- Model for Robust Bone Absorption
Rat AIA model T-cell mediated
Primary arthritic lesion is synovitis, followed by pannus formation, lymphocyte infiltration, & robust bone destruction
Increased level of inflammatory cytokines and acute phase proteins
Monitor effects of Tasocitinib therapeutic dosing at 4h, 4 days and 7 days
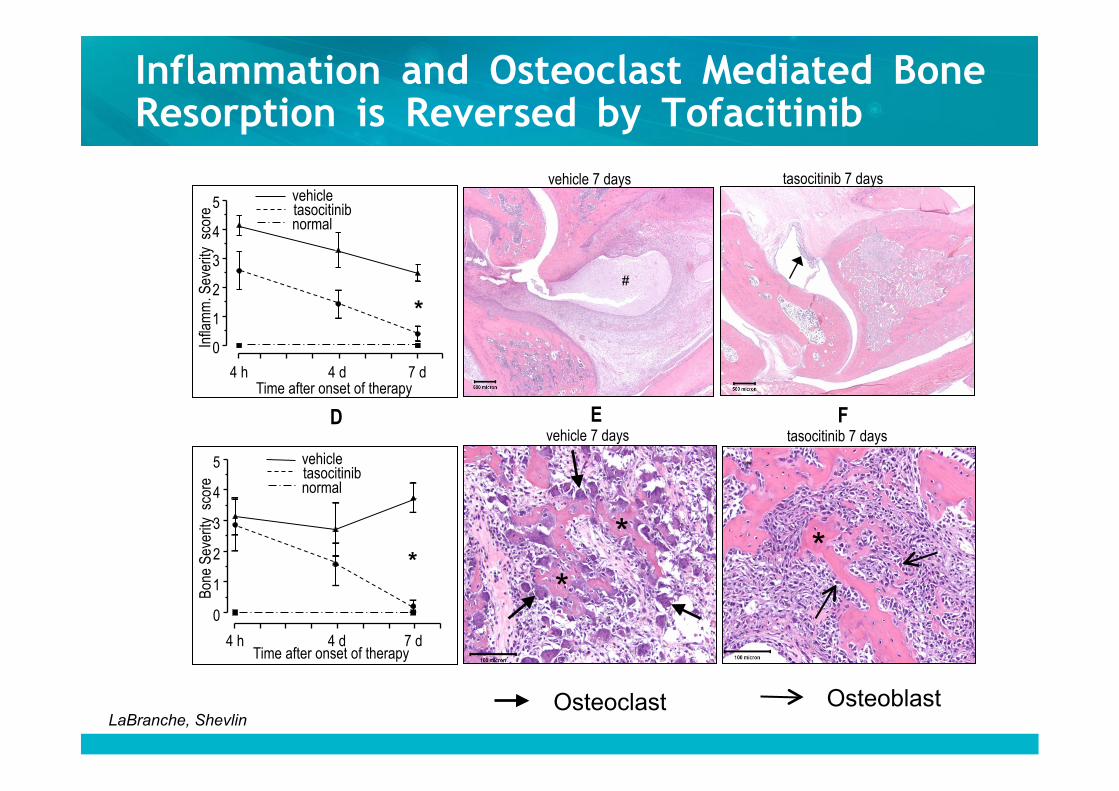
Inflammation and Osteoclast Mediated Bone Resorption is Reversed by Tofacitinib
tasocitinib 7 days vehicle 7 days
tasocitinib 7 days
F D E
0
1
2
3
4
5 vehicle tasocitinib normal
Infla
mm
. Sev
erity
sco
re
4 h 4 d 7 d
0
1
2
3
4
5
Bon
e Se
verit
y s
core
vehicle tasocitinib normal
4 h 4 d 7 d
Time after onset of therapy
Time after onset of therapy
vehicle 7 days
*
*
#
*
*
*
Osteoclast Osteoblast LaBranche, Shevlin
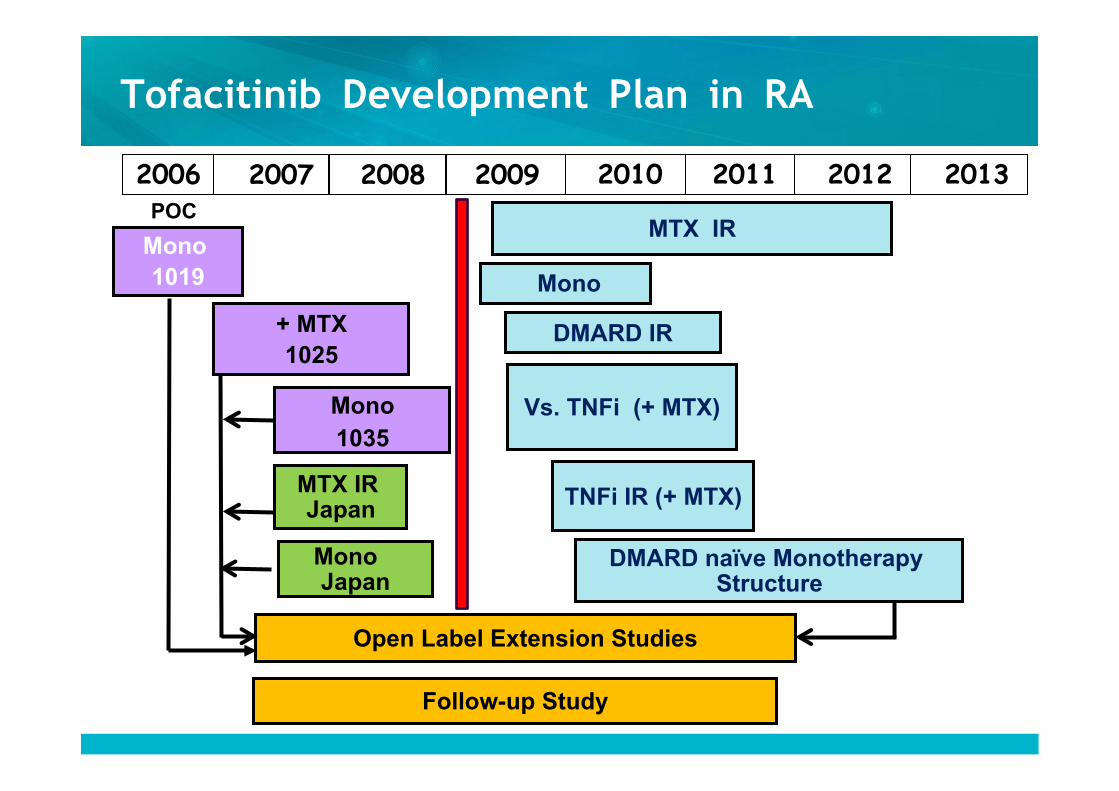
Tofacitinib Development Plan in RA
POC
2007 2006 2008 2009 2010 2011 2012 2013
+ MTX 1025
MTX IR Japan
Open Label Extension Studies
Follow-up Study
Mono 1019
Mono 1035
MTX IR
DMARD naïve Monotherapy Structure
Mono
DMARD IR
Vs. TNFi (+ MTX)
TNFi IR (+ MTX)
Mono Japan
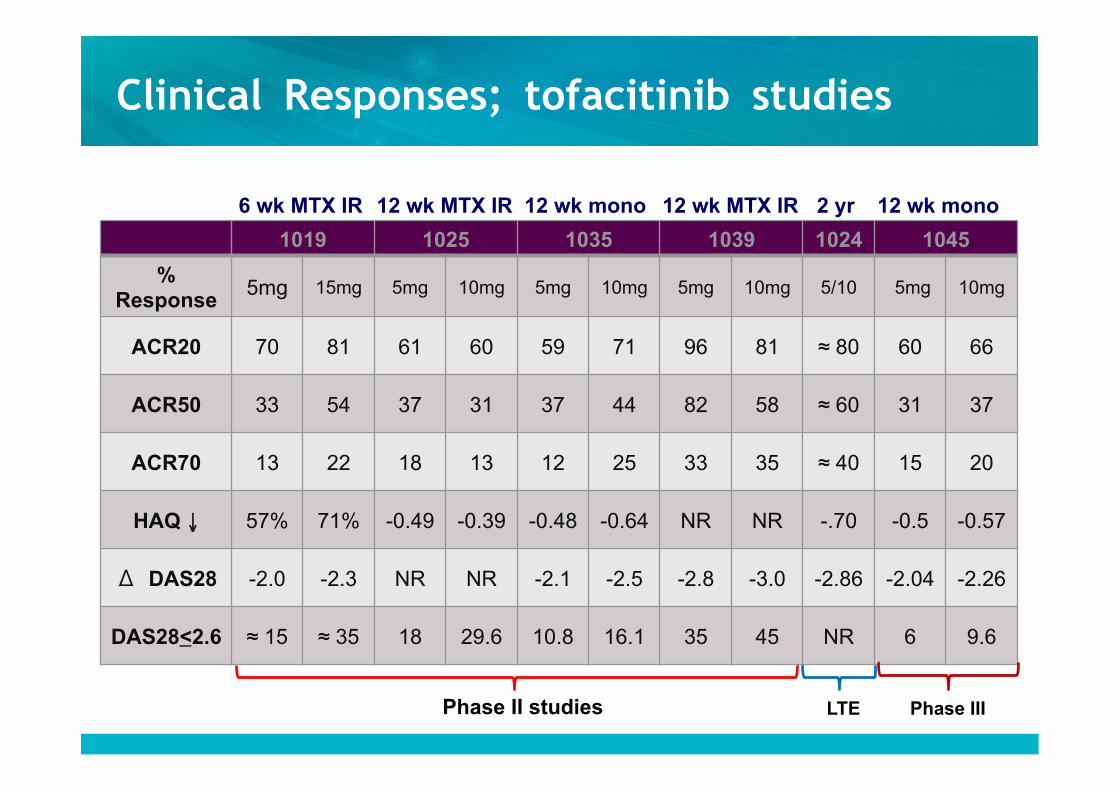
Clinical Responses; tofacitinib studies
1019 1025 1035 1039 1024 1045
% Response
5mg 15mg 5mg 10mg 5mg 10mg 5mg 10mg 5/10 5mg 10mg
ACR20 70 81 61 60 59 71 96 81 ≈ 80 60 66
ACR50 33 54 37 31 37 44 82 58 ≈ 60 31 37
ACR70 13 22 18 13 12 25 33 35 ≈ 40 15 20
HAQ ↓ 57% 71% -0.49 -0.39 -0.48 -0.64 NR NR -.70 -0.5 -0.57
Δ DAS28 -2.0 -2.3 NR NR -2.1 -2.5 -2.8 -3.0 -2.86 -2.04 -2.26
DAS28<2.6 ≈ 15 ≈ 35 18 29.6 10.8 16.1 35 45 NR 6 9.6
Phase II studies LTE Phase III
6 wk MTX IR 12 wk MTX IR 12 wk MTX IR 12 wk mono 2 yr 12 wk mono
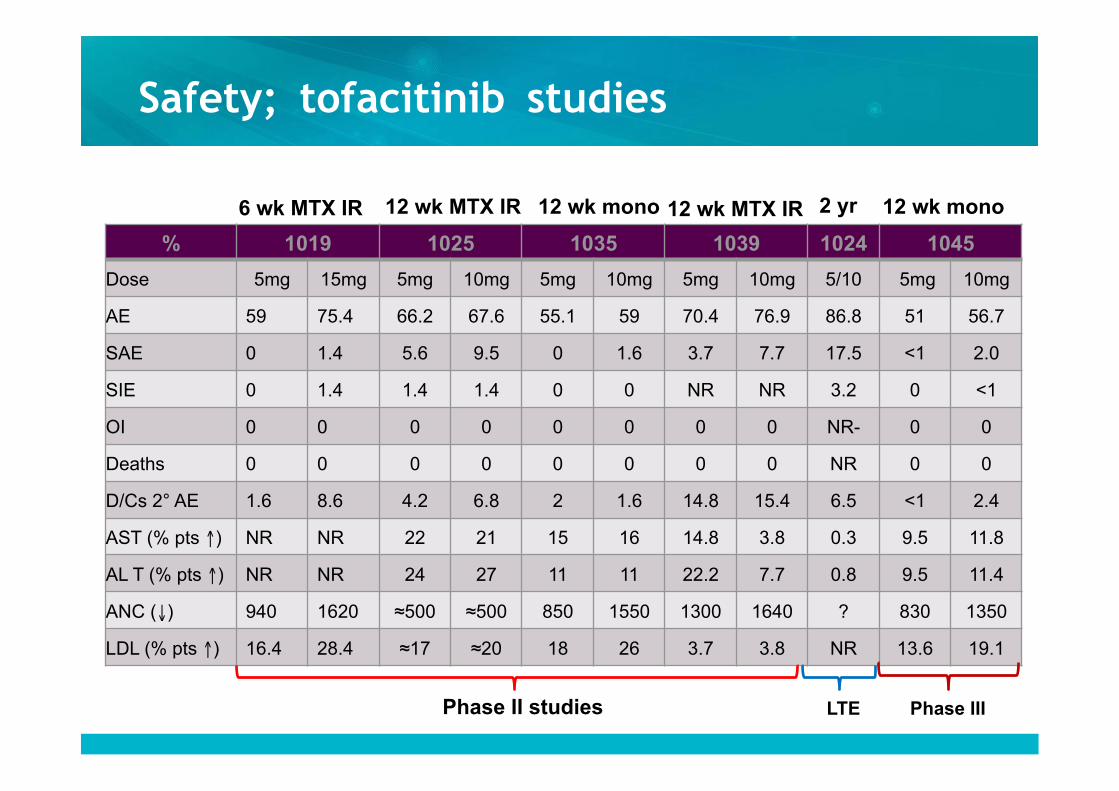
Safety; tofacitinib studies
% 1019 1025 1035 1039 1024 1045
Dose 5mg 15mg 5mg 10mg 5mg 10mg 5mg 10mg 5/10 5mg 10mg
AE 59 75.4 66.2 67.6 55.1 59 70.4 76.9 86.8 51 56.7
SAE 0 1.4 5.6 9.5 0 1.6 3.7 7.7 17.5 <1 2.0
SIE 0 1.4 1.4 1.4 0 0 NR NR 3.2 0 <1
OI 0 0 0 0 0 0 0 0 NR- 0 0
Deaths 0 0 0 0 0 0 0 0 NR 0 0
D/Cs 2° AE 1.6 8.6 4.2 6.8 2 1.6 14.8 15.4 6.5 <1 2.4
AST (% pts ↑) NR NR 22 21 15 16 14.8 3.8 0.3 9.5 11.8
AL T (% pts ↑) NR NR 24 27 11 11 22.2 7.7 0.8 9.5 11.4
ANC (↓) 940 1620 ≈500 ≈500 850 1550 1300 1640 ? 830 1350
LDL (% pts ↑) 16.4 28.4 ≈17 ≈20 18 26 3.7 3.8 NR 13.6 19.1
6 wk MTX IR 12 wk MTX IR 12 wk mono 12 wk mono 12 wk MTX IR 2 yr
Phase II studies LTE Phase III
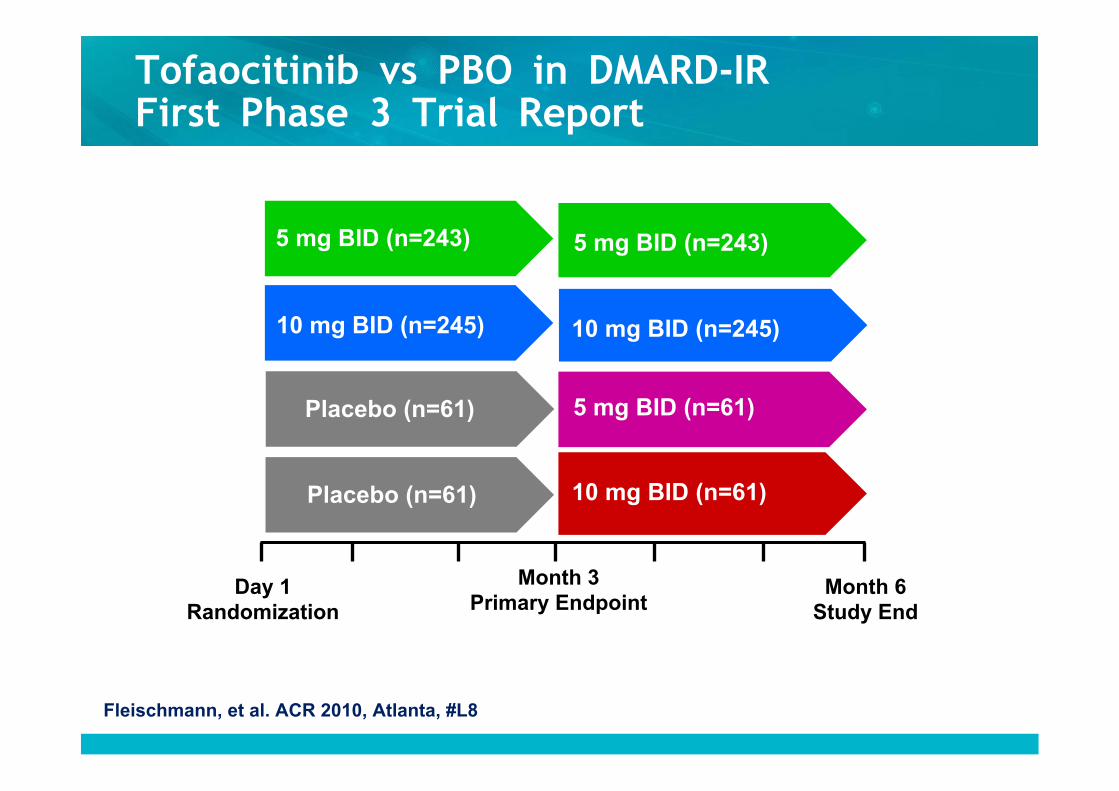
Tofaocitinib vs PBO in DMARD-IR First Phase 3 Trial Report
Day 1 Randomization
Month 3 Primary Endpoint
Month 6 Study End
5 mg BID (n=243)
Placebo (n=61)
Placebo (n=61) 10 mg BID (n=61)
5 mg BID (n=61)
10 mg BID (n=245)
5 mg BID (n=243)
10 mg BID (n=245)
Fleischmann, et al. ACR 2010, Atlanta, #L8
26
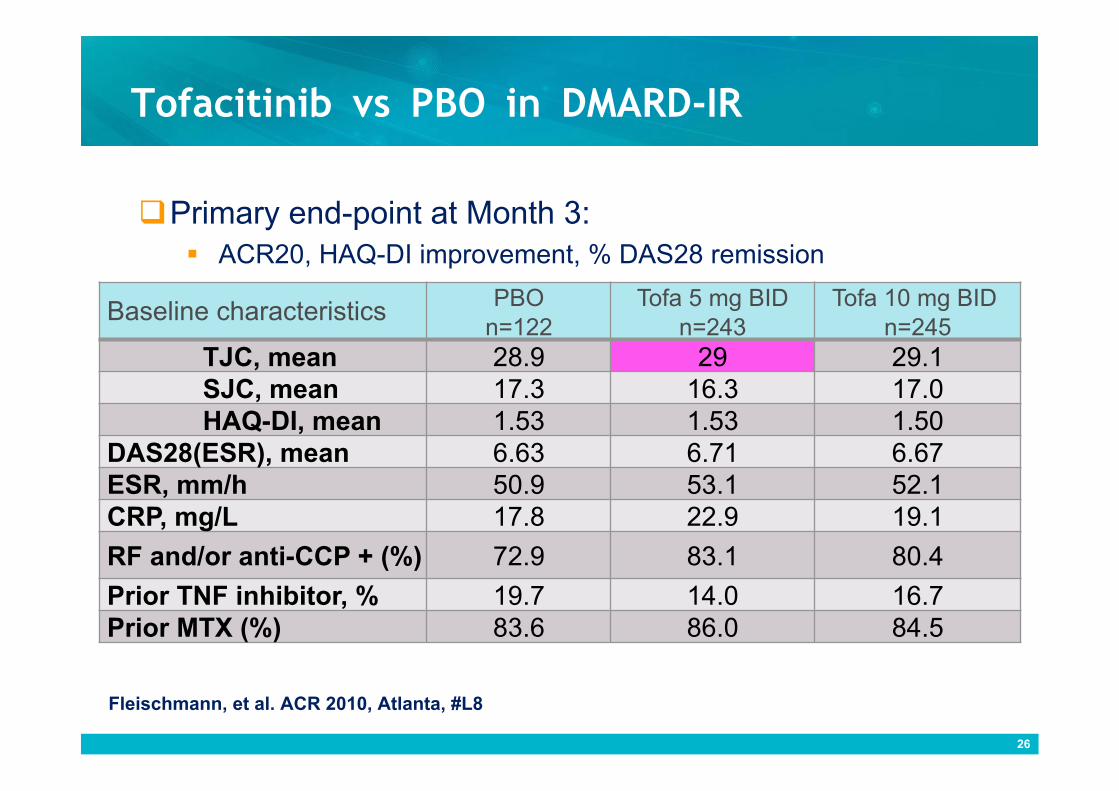
Tofacitinib vs PBO in DMARD-IR
Baseline characteristics PBO n=122
Tofa 5 mg BID n=243
Tofa 10 mg BID n=245
TJC, mean 28.9 29 29.1 SJC, mean 17.3 16.3 17.0 HAQ-DI, mean 1.53 1.53 1.50
DAS28(ESR), mean 6.63 6.71 6.67 ESR, mm/h 50.9 53.1 52.1 CRP, mg/L 17.8 22.9 19.1
RF and/or anti-CCP + (%) 72.9 83.1 80.4
Prior TNF inhibitor, % 19.7 14.0 16.7 Prior MTX (%) 83.6 86.0 84.5
Primary end-point at Month 3: ACR20, HAQ-DI improvement, % DAS28 remission
Fleischmann, et al. ACR 2010, Atlanta, #L8
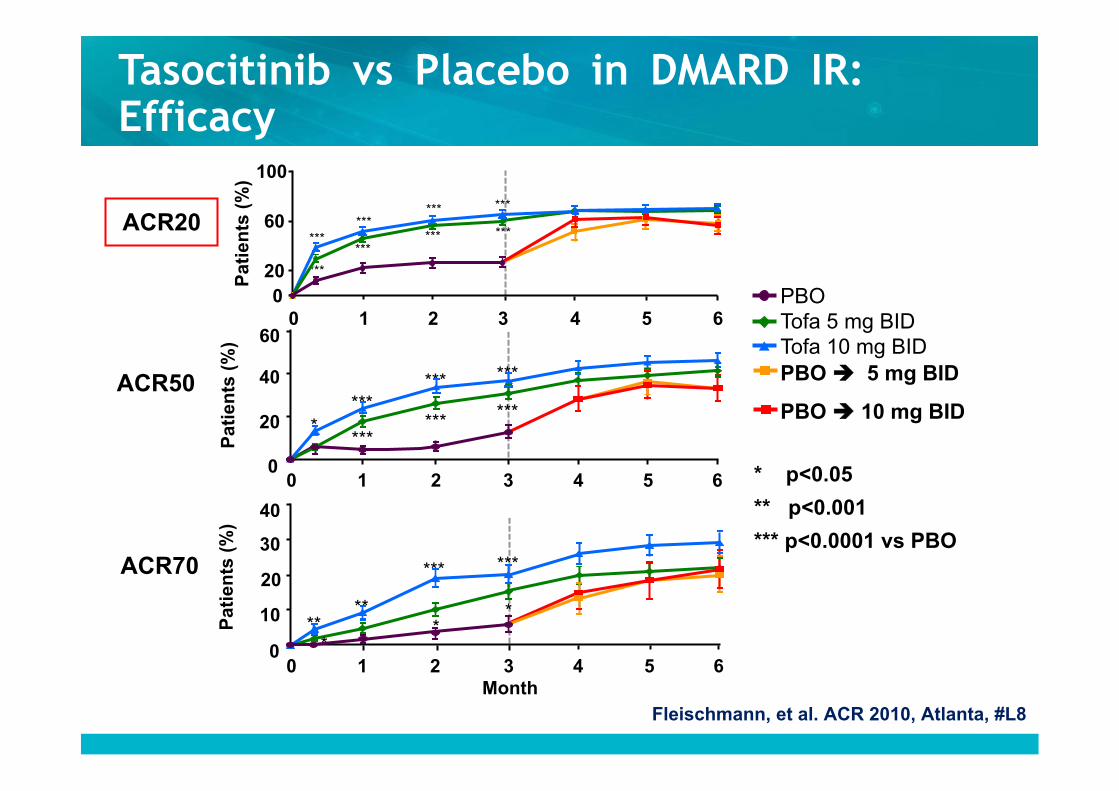
* p<0.05
** p<0.001
*** p<0.0001 vs PBO
PBO Tofa 5 mg BID Tofa 10 mg BID PBO 5 mg BID
PBO 10 mg BID
Tasocitinib vs Placebo in DMARD IR: Efficacy
ACR20
ACR70
ACR50
Pat
ien
ts (
%)
***
*** ***
***
***
*** ***
***
3 0 1 2 4 5 6 0
20
60
100
***
** **
***
Pat
ien
ts (
%)
* *
3 0 1 2 4 5 6 0
10
20
30
40
Month
*
Pat
ien
ts (
%)
* ***
***
***
***
***
***
3 0 1 2 4 5 6 0
20
40
60
Fleischmann, et al. ACR 2010, Atlanta, #L8

Tofacitinib vs PBO in DMARD-IR: Efficacy
DAS28 <2.6
HAQ-DI
* p<0.05
** p<0.001
*** p<0.0001 vs PBO
DAS28(ESR) Improvement
***
*** ***
*** ***
***
*
**
3 4 5 6 0 1 2
-0.9
-0.6
-0.3
0
Pat
ient
s (%
)
3 4 5 6 0 1 2 0
10
20
30
LS m
ean
chan
ge fr
om B
L
***
***
3 0 1 2 4 5 6
-3
-2
-1
0
LS m
ean
chan
ge fr
om B
L
Red dotted line indicates MCID HAQ (-0.22)
PBO Tofa 5 mg BID Tofa 10 mg BID PBO 5 mg BID
PBO 10 mg BID
Month
Fleischmann, et al. ACR 2010, Atlanta, #L8
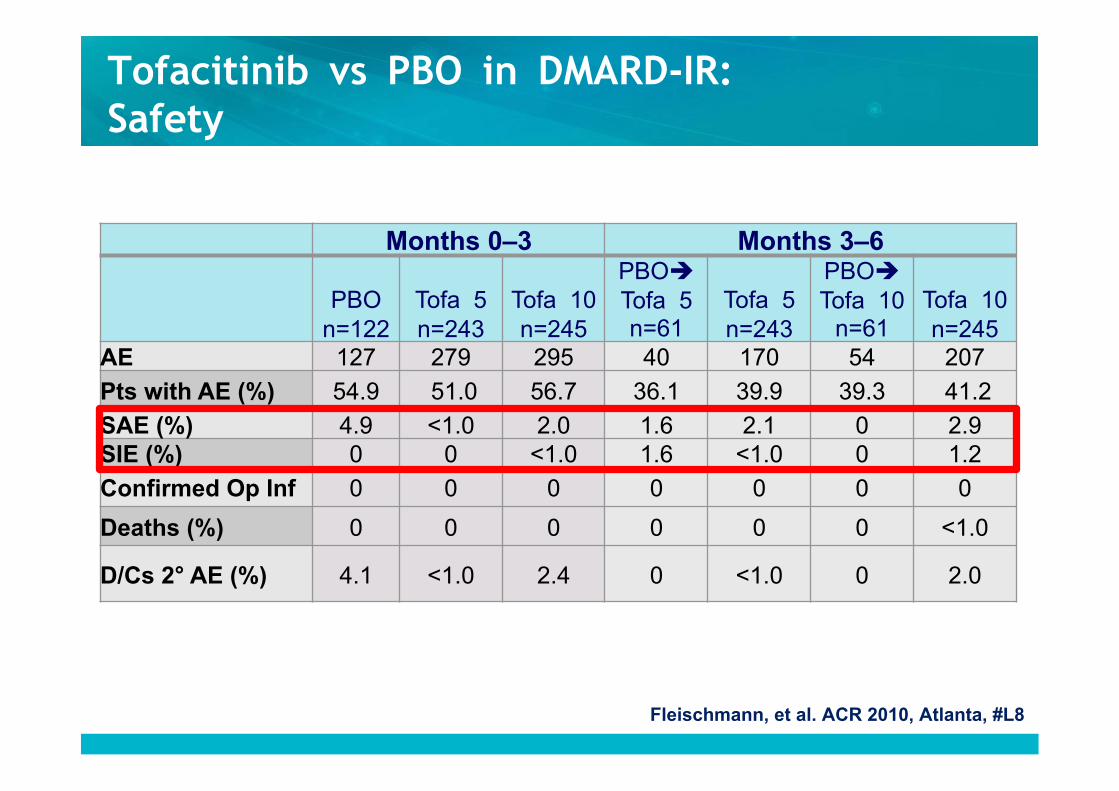
Months 0–3 Months 3–6
PBO n=122
Tofa 5 n=243
Tofa 10 n=245
PBO Tofa 5 n=61
Tofa 5 n=243
PBO Tofa 10
n=61 Tofa 10 n=245
AE 127 279 295 40 170 54 207
Pts with AE (%) 54.9 51.0 56.7 36.1 39.9 39.3 41.2
SAE (%) 4.9 <1.0 2.0 1.6 2.1 0 2.9 SIE (%) 0 0 <1.0 1.6 <1.0 0 1.2
Confirmed Op Inf 0 0 0 0 0 0 0
Deaths (%) 0 0 0 0 0 0 <1.0
D/Cs 2° AE (%) 4.1 <1.0 2.4 0 <1.0 0 2.0
Tofacitinib vs PBO in DMARD-IR: Safety
Fleischmann, et al. ACR 2010, Atlanta, #L8
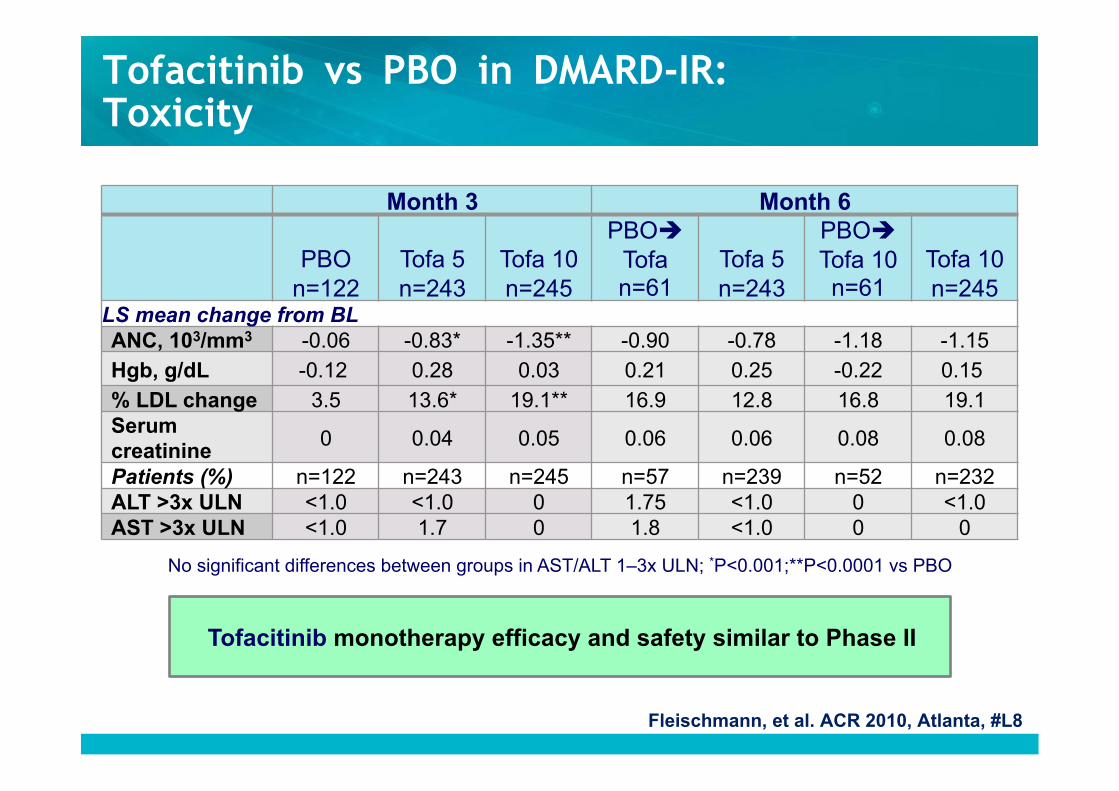
Tofacitinib vs PBO in DMARD-IR: Toxicity
No significant differences between groups in AST/ALT 1–3x ULN; *P<0.001;**P<0.0001 vs PBO
Tofacitinib monotherapy efficacy and safety similar to Phase II
Month 3 Month 6
PBO n=122
Tofa 5 n=243
Tofa 10 n=245
PBO Tofa n=61
Tofa 5 n=243
PBO Tofa 10 n=61
Tofa 10 n=245
LS mean change from BL
ANC, 103/mm3 -0.06 -0.83* -1.35** -0.90 -0.78 -1.18 -1.15
Hgb, g/dL -0.12 0.28 0.03 0.21 0.25 -0.22 0.15 % LDL change 3.5 13.6* 19.1** 16.9 12.8 16.8 19.1 Serum creatinine
0 0.04 0.05 0.06 0.06 0.08 0.08
Patients (%) n=122 n=243 n=245 n=57 n=239 n=52 n=232 ALT >3x ULN <1.0 <1.0 0 1.75 <1.0 0 <1.0 AST >3x ULN <1.0 1.7 0 1.8 <1.0 0 0
Fleischmann, et al. ACR 2010, Atlanta, #L8
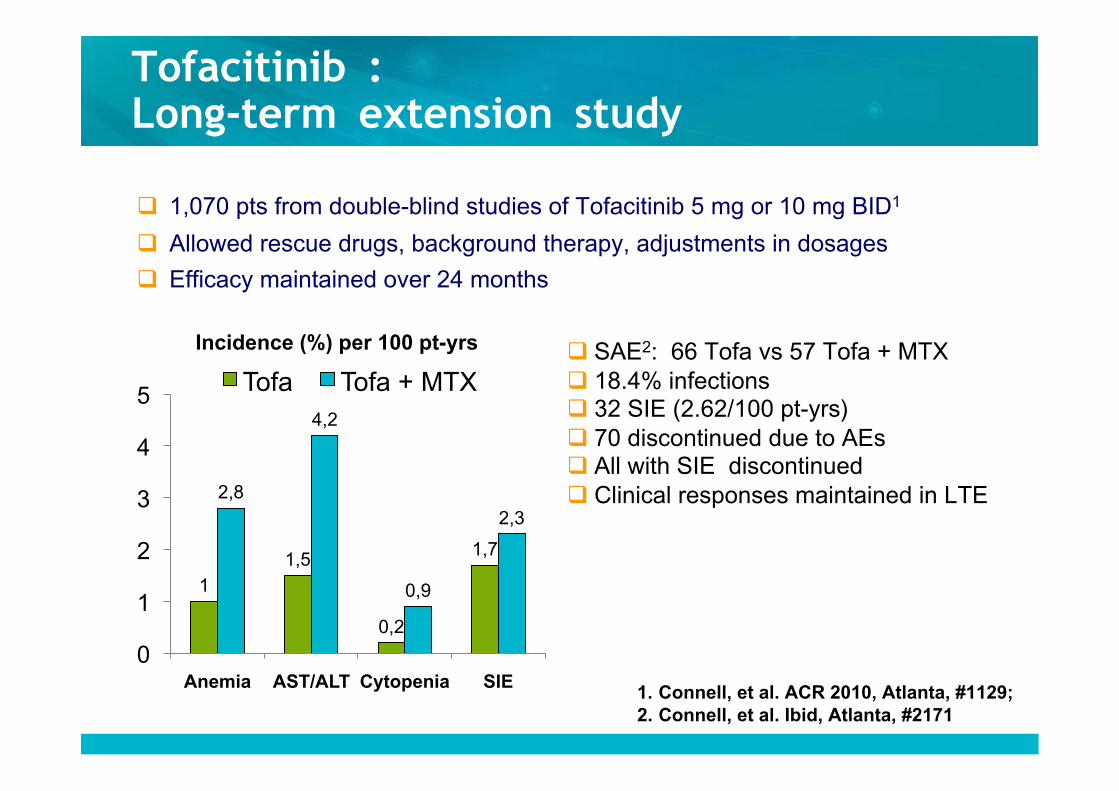
Tofacitinib : Long-term extension study
1 1,5
0,2
1,7
2,8
4,2
0,9
2,3
0
1
2
3
4
5
Anemia AST/ALT Cytopenia SIE
Incidence (%) per 100 pt-yrs
Tofa Tofa + MTX SAE2: 66 Tofa vs 57 Tofa + MTX 18.4% infections 32 SIE (2.62/100 pt-yrs) 70 discontinued due to AEs All with SIE discontinued Clinical responses maintained in LTE
1,070 pts from double-blind studies of Tofacitinib 5 mg or 10 mg BID1
Allowed rescue drugs, background therapy, adjustments in dosages
Efficacy maintained over 24 months
1. Connell, et al. ACR 2010, Atlanta, #1129; 2. Connell, et al. Ibid, Atlanta, #2171
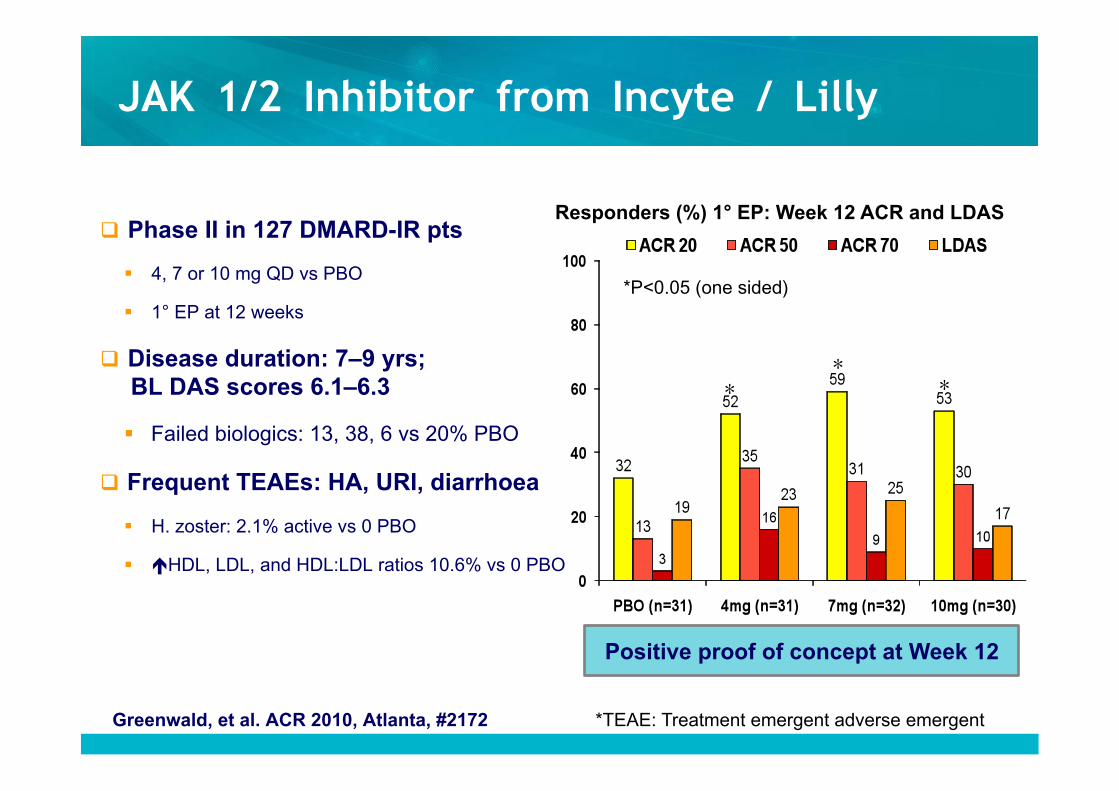
JAK 1/2 Inhibitor from Incyte / Lilly
Phase II in 127 DMARD-IR pts
4, 7 or 10 mg QD vs PBO
1° EP at 12 weeks
Disease duration: 7–9 yrs; BL DAS scores 6.1–6.3
Failed biologics: 13, 38, 6 vs 20% PBO
Frequent TEAEs: HA, URI, diarrhoea
H. zoster: 2.1% active vs 0 PBO
HDL, LDL, and HDL:LDL ratios 10.6% vs 0 PBO
Positive proof of concept at Week 12
Greenwald, et al. ACR 2010, Atlanta, #2172
Responders (%) 1° EP: Week 12 ACR and LDAS
* * *
*P<0.05 (one sided)
*TEAE: Treatment emergent adverse emergent
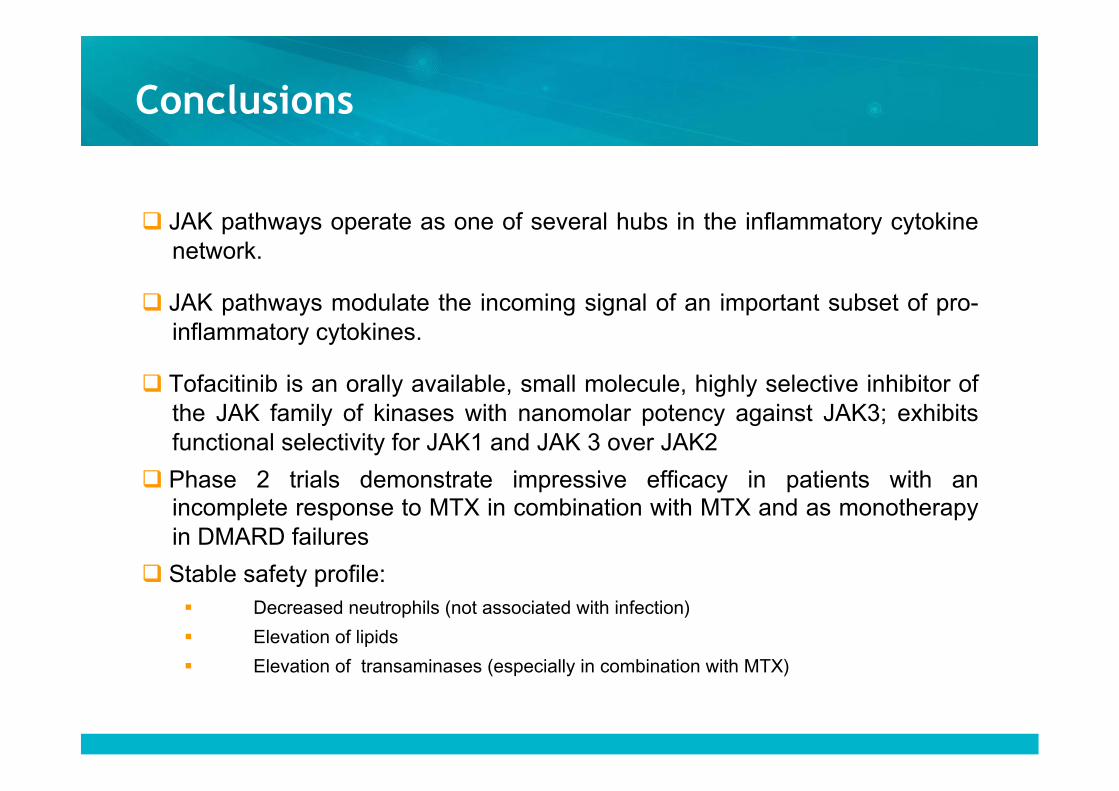
Conclusions
JAK pathways operate as one of several hubs in the inflammatory cytokine network.
JAK pathways modulate the incoming signal of an important subset of pro-inflammatory cytokines.
Tofacitinib is an orally available, small molecule, highly selective inhibitor of the JAK family of kinases with nanomolar potency against JAK3; exhibits functional selectivity for JAK1 and JAK 3 over JAK2
Phase 2 trials demonstrate impressive efficacy in patients with an incomplete response to MTX in combination with MTX and as monotherapy in DMARD failures
Stable safety profile: Decreased neutrophils (not associated with infection)
Elevation of lipids
Elevation of transaminases (especially in combination with MTX)