key performance indicators to evaluate the integration of solar...
TRANSCRIPT

Prepared by: CEA
Date: 06/11/2018
Key Performance Indicators to evaluate the integration of solar heating in industrial processes Deliverable 2.3 WP2. SHIP2FAIR Use cases and Boundary conditions SHIP2FAIR - Solar Heat for Industrial Process towards Food and Agro Industries commitment in Renewables Grant agreement: 792276 From April 2018 to March 2022
This project has received funding from the European Union’s Horizon 2020 research and innovation programme under grant agreement No 792276. Disclaimer: The sole responsibility for any error or omissions lies with the editor. The content does not necessarily reflect the opinion of the European Commission. The European Commission is also not responsible for any use that may be made of the

2/45
Document:
D2.3. Key Performance Indicators to evaluate the integration of solar heating in industrial processes
Author:
CEA Version: 1 Reference: D2.3 SHIP2FAIR ID GA 792276 Date: 14/11/18
DELIVERABLE FACTSHEET Deliverable no.: Deliverable 2.3 Key Performance Indicators to evaluate the integration of solar heating in industrial processes Responsible Partner: CEA
WP no. and title: 2. SHIP2FAIR Use Cases and Boundary Conditions Task no. and title: 2.4. Demonstration KPIs definition Version: 1 Version Date: 06/11/2018
Dissemination level
X PU = Public
PP = Restricted to other programme participants (including the EC)
RE = Restricted to a group specified by the consortium (including the EC)
CO = Confidential, only for members of the consortium (including the EC)
Approvals
Company Author/s
CEA Reviewers RINA-C, CIRCE
Task Leader CEA WP Leader CEA

3/45
Document:
D2.3. Key Performance Indicators to evaluate the integration of solar heating in industrial processes
Author:
CEA Version: 1 Reference: D2.3 SHIP2FAIR ID GA 792276 Date: 14/11/18
DISCLAIMER OF WARRANTIES “This project has received funding from the European Union’s Horizon 2020 research and innovation program under Grant Agreement No 792276”.
This document has been prepared by SHIP2FAIR project partners as an account of work carried out within the framework of the EC-GA contract no 792276. Neither Project Coordinator, nor any signatory party of SHIP2FAIR Project Consortium Agreement, nor any person acting on behalf of any of them:
(a) makes any warranty or representation whatsoever, expressed or implied,
(i). with respect to the use of any information, apparatus, method, process, or similar item disclosed in this document, including merchantability and fitness for a particular purpose, or
(ii). that such use does not infringe on or interfere with privately owned rights, including any party's intellectual property, or
(iii). that this document is suitable to any particular user's circumstance; or
(b) assumes responsibility for any damages or other liability whatsoever (including any consequential damages, even if the Project Coordinator or any representative of a signatory party of the SHIP2FAIR Project Consortium Agreement has been informed of the possibility of such damages) resulting from your selection or use of this document or any information, apparatus, method, process, or similar item disclosed in this document.

4/45
Document:
D2.3. Key Performance Indicators to evaluate the integration of solar heating in industrial processes
Author:
CEA Version: 1 Reference: D2.3 SHIP2FAIR ID GA 792276 Date: 14/11/18
ABREVIATIONS CAPEX: CAPital Expenditures CSP: Concentrated Solar Power DNI: Direct Normal Irradiation DSS: Decision Support System EPTB: Energy Pay Back Time EROI: Energy Return On Energy Invest FTE: Full Time Equivalent Job GNI: Global Normal Irradiation HCV: High Calorific Value KPI: Key performance Indicator LCoH: Levelized Cost of Heat LCV: Low Calorific Value OPEX: OPerational Expenditures PP: Payback Period ROI: Return On Investment SDT: Relative Shut Down Time SHIP: Solar Heat for Industrial Process STE: Solar Thermal Energy WACC: Weight Average Cost of Capital
PARTNERS SHORT NAMES CIRCE: FUNDACIÓN CIRCE CENTRO DE INVESTIGACIÓN DE RECURSOS Y CONSUMOS ENERGÉTICOS RINA-C: RINA Consulting S.p.A. CEA: Commissariat à l'énergie atomique et aux énergies alternatives ISMB: Istituto Superiore Mario Boella sulle tecnologie dell’informazione e delle telecomunicazioni SOLID: S.O.L.I.D. Gesellschaft für Solarinstallation und Design mbh TVP: TVP Solar ISG: Industrial Solar GmbH BE2020: Bioenergy 2020+ GmbH M&R: Martini & Rossi S.p.A. RODA: Bodegas Roda S.A. RAR: RAR – Refinarias de Açúcar Reunidas S.A. ABC: ABC Industrie SAS EDF: Electricité de France EUREC: EUREC EESV SPANISH CO-OPS: Cooperativas Agro-alimentarias de España, U. de Coop.

5/45
Document:
D2.3. Key Performance Indicators to evaluate the integration of solar heating in industrial processes
Author:
CEA Version: 1 Reference: D2.3 SHIP2FAIR ID GA 792276 Date: 14/11/18
PUBLISHABLE SUMMARY This report establishes a list of indicators to assess the benefit of solar heat integration in industrial processes (SHIP). These indicators are Key Performance Indicators (KPI), they are linked to determined quantities calculated with relations approved by the consortium. Used in the frame of the present SHIP2FAIR project, these KPIs are generic and usable for future replication projects.
In the first part, the required inputs to calculate KPIs are identified and listed. These inputs are to be supplied by equipment providers, engineering and design offices, and end-users. These data characterize the state of reference of the process before SHIP integration and the new state after SHIP integration.
In the second part, KPIs are listed. To facilitate their understanding, they are split into five different categories related to technical, economic, environmental, social and regulation aspects. When necessary, a calculation method is proposed. As solar energy is not a constant resource, data collection is spread over time. To this effect, a reference period and a sampling rate are suggested. Depending on differences between different projects, some KPIs can be more relevant than others, a selection is to be done. At this step, it will be useful to define KPI's target and then check the degree of matching between target and actual value.
When conversions are required for data reduction, in the absence of precise conversion factor, generic values are proposed to complete calculations.
To evaluate economic indicators, a table of different energies cost is proposed for European countries, with a focus on electricity and natural gas costs.
The set of KPIs selected during this analysis will enable the assessment of impacts related to the implementation of solar plants.
All the KPIs and their characteristics are to be validated by the consortium of SHIP2FAIR to have a common basis of evaluation for the project and for future SHIP replications (Replication Tool). Some of these KPIs will be selected and implemented in the future monitoring system and decision support system (DSS).

6/45
Document:
D2.3. Key Performance Indicators to evaluate the integration of solar heating in industrial processes
Author:
CEA Version: 1 Reference: D2.3 SHIP2FAIR ID GA 792276 Date: 14/11/18
TABLE OF CONTENTS TABLE OF CONTENTS .......................................................................................................................................... 6
1. INTRODUCTION .......................................................................................................................................... 9
2. METHODOLOGY ........................................................................................................................................ 10
3. INPUTS LIST ............................................................................................................................................... 11
3.1. REAL ONSITE SOLAR RESOURCE AND AMBIENT CONDITIONS ......................................................... 11
3.2. TEMPERATURE DEMAND PROFILE ................................................................................................... 11
3.3. THERMAL POWER DEMAND PROFILE .............................................................................................. 11
3.4. FOSSIL ENERGY CONSUMPTION ....................................................................................................... 11
3.5. ADDITIONAL AND SAVED POWER CONSUMPTION .......................................................................... 11
3.6. CAPEX ............................................................................................................................................... 12
3.7. OPEX ................................................................................................................................................. 13
3.8. SPACE AVALAIBLE AND CHARACTERISTICS ....................................................................................... 14
3.9. PRODUCTION UNIT REFERENCE ....................................................................................................... 14
3.10. DISTANCE FROM PROCESS ........................................................................................................... 14
3.11. INTERFACE WITH END-USER ......................................................................................................... 14
4. TECHNICAL INDICATORS ........................................................................................................................... 15
4.1. TOTAL SOLAR ENERGY PRODUCTION ............................................................................................... 15
4.1.1. Total solar energy production: absolute value ......................................................................... 15
4.1.2. Total solar energy production: specific value........................................................................... 17
4.2. SATISFACTION OF REQUIRED TEMPERATURE LEVEL(S) ................................................................... 18
4.3. SOLAR OVERALL EFFICIENCY ............................................................................................................ 19
4.4. THERMAL POWER SIMULTANEITY .................................................................................................... 20
4.5. THERMAL STORAGE EFFICIENCY ...................................................................................................... 21
4.6. THERMAL STORAGE EFFICACY .......................................................................................................... 22
4.7. VOLUMETRIC ENERGY DENSITY ........................................................................................................ 22
4.8. STORAGE BY SOLAR SURFACE RATIO ............................................................................................... 23
4.9. ADDITIONAL SPECIFIC ENERGY CONSUMPTION (OR COP) ............................................................... 23
4.10. EXTENDED ENERGY SAVING RATE ................................................................................................ 24
4.11. OVERALL EQUIPMENT EFFECTIVENESS ........................................................................................ 25
5. ECONOMIC INDICATORS .......................................................................................................................... 26
5.1. IMPACT ON ENERGY BILL .................................................................................................................. 27

7/45
Document:
D2.3. Key Performance Indicators to evaluate the integration of solar heating in industrial processes
Author:
CEA Version: 1 Reference: D2.3 SHIP2FAIR ID GA 792276 Date: 14/11/18
5.2. IMPACT ON PROCESS DURING BUILDING ........................................................................................ 28
5.3. SOLAR ENERGY COST (LCoH: Levelized Cost of Heat) ...................................................................... 29
5.4. RETURN ON INVESTMENT (ROI) ....................................................................................................... 30
5.5. COST OF STORED HEAT ..................................................................................................................... 31
5.6. PAYBACK PERIOD (PP) ...................................................................................................................... 32
6. ENVIRONMENTAL INDICATORS ................................................................................................................ 33
6.1. FOSSIL ENERGY SAVING .................................................................................................................... 33
6.2. EQUIVALENT CO2 REDUCTION .......................................................................................................... 34
6.3. ENERGY RETURN ON ENERGY INVEST (EROI) ................................................................................... 35
6.4. ENERGY PAY BACK TIME (EPBT) ....................................................................................................... 35
6.5. RATIO OF STE/TOTAL ENERGY .......................................................................................................... 35
6.6. OTHER POLLUTIONS SOURCES ......................................................................................................... 35
6.7. VISUAL IMPACT ................................................................................................................................. 35
6.8. RESOURCES USED OR SAVED ............................................................................................................ 36
7. SOCIAL INDICATORS ................................................................................................................................. 37
7.1. SOCIAL IMPACT ................................................................................................................................. 37
7.1.1. Intranet level ............................................................................................................................ 37
7.1.2. Internet level ............................................................................................................................ 37
7.2. DIRECT/INDIRECT JOBS CREATION (FTE) .......................................................................................... 38
7.3. LOCAL EMPLOYMENT ....................................................................................................................... 38
7.4. GENDER EQUITY ............................................................................................................................... 38
7.5. SAFETY .............................................................................................................................................. 38
8. REGULATORY ............................................................................................................................................ 39
8.1. INCENTIVIZATION ............................................................................................................................. 39
8.2. INVOLVEMENT OF PUBLIC AUTHORITIES ......................................................................................... 39
8.3. COMPARISON BETWEEN THE COMPANY RENEWABLE ENERGY INTEGRATION AND THE EUROPEAN ROADMAP (ENER-SHARE) ............................................................................................................................. 39
9. CONCLUSIONS .......................................................................................................................................... 40
REFERENCES ..................................................................................................................................................... 42
ANNEXES ........................................................................................................................................................... 43
ANNEX I: Natural gas cost for European countries ...................................................................................... 43
ANNEX II: Energy cost for European countries ............................................................................................. 44
ANNEX III: Electricity cost for European countries ....................................................................................... 45

8/45
Document:
D2.3. Key Performance Indicators to evaluate the integration of solar heating in industrial processes
Author:
CEA Version: 1 Reference: D2.3 SHIP2FAIR ID GA 792276 Date: 14/11/18
List of figures
Figure 4-1. Links between Inputs and ‘’Total Solar Energy Production’’ KPI ................................................... 15 Figure 4-2. Solar field, liquid heat carrier ......................................................................................................... 15 Figure 4-3. Solar field, direct steam production ............................................................................................... 16 Figure 4-4. Links between Inputs and ‘’Satisfaction of required temperature level(s)’’ KPI............................ 18 Figure 4-5. Parameters for the calculation of the temperature level(s) .......................................................... 18 Figure 4-6. Links between Inputs and ‘’Solar overall efficiency’’ KPI ............................................................... 19 Figure 4-7. TVP collector efficiency .................................................................................................................. 19 Figure 4-8. Required and supplied thermal power .......................................................................................... 20 Figure 4-9. Thermocline thermal storage, inputs and ouputs ......................................................................... 21 Figure 4-10. Links between Inputs and ‘’Extended energy saving rate’’ KPI .................................................... 24 Figure 4-11. Links between Inputs and ‘’Overall equipment effectiveness’’ KPI ............................................. 25 Figure 5-1. Links between Inputs and ‘’Impact on energy bill’’ KPI ................................................................. 27 Figure 5-2. Links between Inputs and ‘’Levelized Cost of Heat’’ KPI ................................................................ 29 Figure 5-3. Links between Inputs and ‘’Return on Investment’’ KPI ................................................................ 30 Figure 5-4. Links between Inputs and ‘’Payback period’’ KPI ........................................................................... 32 Figure 6-1. List of environmental indicators .................................................................................................... 33 Figure 7-1. List of social indicators ................................................................................................................... 37

9/45
Document:
D2.3. Key Performance Indicators to evaluate the integration of solar heating in industrial processes
Author:
CEA Version: 1 Reference: D2.3 SHIP2FAIR ID GA 792276 Date: 14/11/18
1. INTRODUCTION The objective of this deliverable is to establish a list, as exhaustive as possible, of objective criteria to evaluate the benefits of SHIP implementation in existing industrial processes of demonstration sites. This guideline can be replicated for future projects. When criteria are only qualitative, it is more difficult to allow comparisons between different sites or scenarios. On the other hand, they become very relevant when they are associated to figures and targets if possible. For that purpose, their method of calculation must be very clear and transparent to have a common understanding on their meaning. The acceptation of the method at least by the equipment supplier and end user is mandatory. Only under these conditions, a criterion can be regarded as a key performance indicator (KPI).
To help the understanding of the impact of solar heat integration in a process, relevant information can also be highlighted by the use of different type of KPIs. They can be used in expertise and analyze tasks. For example, in the case of a thermocline thermal storage integrated to smooth the available thermal power, tracking the stratification degree of the storage is useful to be correlated with heat storage efficiency, even if finally, only overall thermal efficiency is a KPI. Some of these KPIs will be useful for the monitoring of the solar plant. These indicators will be used to check and make sure that the plant is aging as expected.
A relevant list of KPIs, accompanied by their method of calculation is proposed. Objectives are suggested for some KPIs. But in the replication tool, the designer will choose the KPI driving his sizing. Economic and environmental (CO2, and other greenhouse gas emissions) aspects seems to be the main drivers, but in this document we will not define neither KPI priority neither KPI fixed targets.
An appreciation of the KPIs scope of application is also defined: It is worth noting that the priority of the KPI relevance may vary in function of the subject perspective. For example, the KPI associated to environment will be strongly supported by the community while the more technical and economical KPI would be crucial for the plant operation.
A normalization of number of KPIs is necessary to take into account that their value can depend on a variable volume of production, what leads to calculate specific quantities instead of absolute quantities. Additionally, some KPIs can be expressed in term of overall energy or in term of specific energy.
The main results are summarised in the conclusions section at the end of the document (section 9).
Deliverable 2.3 has been developed under the activities of the Task 2.4 Demonstration KPIs definition, within the Document of Action of SHIP2FAIR project.

10/45
Document:
D2.3. Key Performance Indicators to evaluate the integration of solar heating in industrial processes
Author:
CEA Version: 1 Reference: D2.3 SHIP2FAIR ID GA 792276 Date: 14/11/18
2. METHODOLOGY The list of criteria to be determined and then regarded as KPIs, is split into five categories:
• Technical • Economic • Environmental • Social • Regulatory
Links between categories are mainly the following:
• The adequate technical integration of solar installations in industrial processes allows considerable energy savings, which mean direct economic savings in energy sources for the ownership, but also environmental benefits for the whole society.
• Furthermore, the environmental impact has economic benefits due to regulations: reduction of CO2 emissions decreases carbon tax to be paid. Social impact can be evaluated by jobs creation: a cost for a manufacturing company but mostly net profits for it and less unemployed persons for the community.
As mentioned in the introduction, a great number of criteria can be tracked but only a part will be regarded as KPIs. When possible, each KPI is described by characteristics listed hereafter.
• KPI title and description. • Unit: indicator unit is not always trivial, especially when defining specific quantities. Basis of
normalization must be clearly defined. • Required inputs: calculations need input data. They must be identified all well as their precision level
to guarantee an accuracy level of KPIs. The unit system used in these inputs should be verified in order to assure the validation of the calculations.
• Calculation method: it must be detailed clearly, without confusing source. • Reference period: an indicator or an input is leveled over a representative period. Characteristic time
can be less than one hour up to one year after integration of shorter periods. • Accuracy level (expected error): standard measurement errors can give a good idea about the
uncertainty to be expected on KPIs.
All the KPIs and their characteristics are to be validated by the consortium of SHIP2FAIR to have a common basis of evaluation for the project and for future SHIP replications (Replication Tool). Some of these KPIs will be selected and implemented in the future monitoring system and decision support system (DSS).

11/45
Document:
D2.3. Key Performance Indicators to evaluate the integration of solar heating in industrial processes
Author:
CEA Version: 1 Reference: D2.3 SHIP2FAIR ID GA 792276 Date: 14/11/18
3. INPUTS LIST A generic list of inputs can be established because they are mandatory to evaluate the relevance of solar heat integration and, thus, most of the related KPIs.
3.1. REAL ONSITE SOLAR RESOURCE AND AMBIENT CONDITIONS
This data is extremely relevant since it drives the thermal power able to be supplied to processes. The real solar resource needs to be measured on site, in real time with global normal irradiation (GNI) and direct normal irradiation (DNI) sensors. Other weather data like wind direction, speed and ambient temperature may also be useful for analysis tasks. The sampling rate is at least mean values over one hour, hour per hour for each day of the year. This data must be collected before SHIP implementation for design purposes and during operation for evaluation purposes. When no measurement is available, it is possible to use services like ‘’Meteonorm’’ to evaluate the solar resource. During operation, it is mandatory to have a measurement of this resource. This input parameter will depend on the solar field technology, typically DNI for CSP or solar field with tracker and GNI for stationary collector.
3.2. TEMPERATURE DEMAND PROFILE
This is a requirement of the SHIP end-user. The temperature profile of the heat source must match with the demand profile. Thermal storage management and control system are key points to achieve this requirement. Daily, hour per hour data is the minimum sampling rate; at least, this is to be known for typical days over the year to size properly the system and then to evaluate the benefit of solar heat. Control of temperature is possible as soon as the stagnation temperature is higher than the required temperature. Actual thermal power delivered adjusts according with the collectors' characteristic. With the thermal power demand, it is one of the most important inputs for the engineering step.
3.3. THERMAL POWER DEMAND PROFILE
With temperature profile, this is an important input data to size properly the solar field and the thermal storage answering to an objective of low carbon energy supply. If an hourly sampling rate all over the year cannot be established, the profile should be established at least hour per hour, for a typical day of each month of the year. In any case, it must be consistent with temperature profile.
3.4. FOSSIL ENERGY CONSUMPTION
Precise counting of primary energy consumption with a timeline is mandatory. The reason is that it is a key input in order to evaluate fossil energy saving, cost saving and payback time. Records in a monthly basis prior to SHIP integration for 2-3 years would be very useful, if available; however, a minimum of one year recordings is mandatory. A daily gas consumption is easy to measure; in the case of fuel oil, a flow counter is probably required as the accuracy of the fuel tank filling frequency is not enough.
3.5. ADDITIONAL AND SAVED POWER CONSUMPTION
This is the electric consumption of additional or cancelled systems to operate SHIP and process. If SHIP integration decreases the consumption of the process itself, it can be taken into account here as a negative

12/45
Document:
D2.3. Key Performance Indicators to evaluate the integration of solar heating in industrial processes
Author:
CEA Version: 1 Reference: D2.3 SHIP2FAIR ID GA 792276 Date: 14/11/18
quantity. As variable speed pumps are frequently used to control flow rates and minimize electric consumption, energy counting with an hourly sampling rate may be preferable.
3.6. CAPEX
The Capital Expenditures (CAPEX) includes the cost of solar field factory onboard and all other costs to be supported until the solar plant start up:
- Direct construction costs · Solar field · Thermal storage · Electrical and instrumentation systems · Civil engineering for site preparation · Transportation · Auxiliary utilities · Buildings · Construction · Start up, commissioning and acceptance testing
- Project engineering · Preliminary engineering · Detailed design · Construction management and oversight
- Project development · Administration, contracting, management · Environmental permitting · Legal services
- Project financing costs · Interest during construction · Debt service reserve · Other financing costs
- Contingency
The CAPEX could be expressed in k€ (or M€). In order to make a comparison between solar technologies or between solar fields with different sizes it may be useful to use €/m² for the collectors: the reference area represents the gross area of the solar collector for stationary solar field or the area of the mirror for the CSP. It allows making a link with a physical component: a solar collector, a tracker with its mirrors… All these costs may depend on the site and country where SHIP is implemented. They also strongly depend on the characteristics of the installation: roof / floor, size (number of collector, etc.), environmental constraints, type of financing…
In order to have an overview of these variations, table 3-1 gives the collector's cost determined by different literature values. The cost curve for solar technology is steep, so exact value is difficult to be determined before studies in the frame of a concrete project.

13/45
Document:
D2.3. Key Performance Indicators to evaluate the integration of solar heating in industrial processes
Author:
CEA Version: 1 Reference: D2.3 SHIP2FAIR ID GA 792276 Date: 14/11/18
Table 3-1 Cost range of different collector technologies
3.7. OPEX
The Operational Expenditures (OPEX) involve the ongoing costs for operating the solar system in an industrial plant, such as maintenance works and energy consumption to operate. It can be expressed in euros per a reference period - day, month, year…- or in euros per unit of "delivered service" - kWhth, etc.
Fixed costs and variable components contribute to OPEX.
- Fixed costs · Labor costs · Maintenance costs · Plant performance monitoring costs · Indirect operation and maintenance costs (i.e. subcontracted tasks)
- Variable costs · Power · Chemicals · Wastes disposal
OPEX are quite difficult to estimate: some parameters can be evaluated (like the power consumption of the auxiliaries) but others are more uncertain (cleaning of the mirrors, defective piece replacement…). Annual maintenance costs are often taken as a percentage of investment cost, but contingency may have a strong effect on them. In order to give an idea, for large solar field, the OPEX is about 0.3 to 0.5% of the CAPEX. As for CAPEX, OPEX can be site and country dependant.
Table 3-2 lists OPEX for different collector technologies in term of €/kW. Unlike conventional installations, the OPEX of solar installations is quite low. The OPEX is higher for CSP technologies because they involve trackers.
Table 3-2 OPEX range of different collector technologies
Motion Collector type Absorber type OPEX [€/kW]
Stationary Flat plate collector (FPC) Flat 3 Evacuated tube collector (ETC) Flat 3 Ultra High Vacuum FPC (UHV-FPC) Flat 3 Compound Parabolic Collector (CPC) Tubular -
Single axis tracking Linear Fresnel reflector (LFR) Tubular 4 - 10 Parabolic trough collector (PTC) Tubular -
Two axis tracking Parabolic dish reflector (PDR) Point - Heliostat field collector (HFC) Point -
Motion Collector type Absorber type Unit cost [€/kW]
Stationary Flat plate collector (FPC) Flat 250 - 700 Evacuated tube collector (ETC) Flat 800 - 1,100 Ultra High Vacuum FPC (UHV-FPC) Flat 1,200 Compound Parabolic Collector (CPC) Tubular 600 - 1,300
1 tracker Linear Fresnel Tubular 1,000 - 1,500

14/45
Document:
D2.3. Key Performance Indicators to evaluate the integration of solar heating in industrial processes
Author:
CEA Version: 1 Reference: D2.3 SHIP2FAIR ID GA 792276 Date: 14/11/18
When designing the plant, forecasted OPEX can be reduced by increasing CAPEX - i.e. selection of more efficient collectors -. Contribution of CAPEX amortization in final cost is higher. Optimization by cost of service minimization helps to share OPEX and CAPEX in final cost.
Regarding power costs, although they may be low compared to other OPEX contributions, ANNEX III: Electricity cost for European countries gives electricity cost for European countries. These data can be used for evaluation tasks.
3.8. SPACE AVALAIBLE AND CHARACTERISTICS
This is a site data. Space may limit the collector surface to be installed, but also the additional equipment for the solar system, with a direct consequence on the interest of SHIP integration. Then, if all available space is occupied, it is used to calculate the ratio aperture/available space. If space is directly or indirectly costly, a maximum ratio may be among the decision criteria to be considered to select the solar collector technology and the temperature range of solar energy supplied to the process. In parallel, space characteristics are important. For example, different types of roof-top or ground spaces and their specific features have advantages and drawbacks to be considered during collector's selection and their structural supporting system. The orientation of available space and shading are also major parameters: it is important to take care of the surrounding environment (building, trees, mountains, etc.) which may shade the solar field and then reduce the solar resource. Special location with respect to the potential link(s) with existing facilities and process(es) needs to be considered. Specific software tools may be used to calculate the shading mask on the solar field.
3.9. PRODUCTION UNIT REFERENCE
Some of the KPIs will be used during the whole lifetime of the solar plant. Since the annual energy need can change from a period to another according to the volume of the production, it maybe be necessary to refer to specific value of production. The end-user must define a production unit reference (volume of wine, liquor, mass of sugar, etc.). This approach supposes that there will be no changes in the manufacturing process. This input is also need to compare some KPIs before and after the use of solar heat.
3.10. DISTANCE FROM PROCESS
The distance between the solar field and point(s) of use needs to be considered in heat transportation cost contribution in CAPEX and OPEX. Also, it is a parameter to consider when determining the global solar plant efficiency taking into account thermal losses.
3.11. INTERFACE WITH END-USER
The calculation of OPEX could be significantly affected if the site buys solar heat to an independent owner and energy provider. Another situation that should be taken into account is if the solar plant is included in the site technical staff scope.

15/45
Document:
D2.3. Key Performance Indicators to evaluate the integration of solar heating in industrial processes
Author:
CEA Version: 1 Reference: D2.3 SHIP2FAIR ID GA 792276 Date: 14/11/18
4. TECHNICAL INDICATORS The different KPIs are listed in the following sections. Figure 4-1 shows who is usually in charge of supply inputs, end-user or solar system provider, and who is the most concerned by the KPI.
4.1. TOTAL SOLAR ENERGY PRODUCTION
Figure 4-1. Links between Inputs and ‘’Total Solar Energy Production’’ KPI
This refers to the gross thermal power delivered by the solar field. This KPI can be expressed in two forms: an absolute value and a specific value. Concerning the specific value, it can be referred to the solar field area (see below).
4.1.1. Total solar energy production: absolute value
A thermal power counter with an integration function is able to give delivered energy during a sampling time. Cumulating this energy over a given period gives an accurate indicator about collected solar heat. The method of measurement depends on the collectors' technology. In the case of a liquid heat carrier (Figure 4-2, flat collectors), a single flowrate with inlet and outlet temperature measurements give the instant thermal power, to be integrated. Calculation is done according to equation 1.
Figure 4-2. Solar field, liquid heat carrier
ESE = mhc. Cp. (Tout − Tin). dt (1) ESE: delivered solar energy over period dt, kWh (1 kWh = 3.6 MJ) mhc: heat carrier flowrate, kg·s-1
Cp: mean heat carrier specific heat capacity, J·kg-1·K Tout: temperature at solar field outlet, K

16/45
Document:
D2.3. Key Performance Indicators to evaluate the integration of solar heating in industrial processes
Author:
CEA Version: 1 Reference: D2.3 SHIP2FAIR ID GA 792276 Date: 14/11/18
Tin: temperature at solar field inlet, K dt: sampling period, s
If the solar field is used to produce steam directly (Figure 4-3), it is fed by pressurized liquid water and after partial vaporization and separation of the remaining liquid fraction, saturated steam is supplied to the process. In this case, thermal energy is calculated from enthalpy balance, according to equation 2.
Figure 4-3. Solar field, direct steam production
𝐸𝐸𝑆𝑆𝑆𝑆 = ����𝑚𝑊𝑊,𝑖𝑖𝑖𝑖 − ��𝑚𝑊𝑊,𝑜𝑜𝑜𝑜𝑜𝑜�. ℎ𝑆𝑆,𝑜𝑜𝑜𝑜𝑜𝑜 + ��𝑚𝑊𝑊,𝑜𝑜𝑜𝑜𝑜𝑜 . ℎ𝑊𝑊,𝑜𝑜𝑜𝑜𝑜𝑜 − ��𝑚𝑊𝑊,𝑖𝑖𝑖𝑖. ℎ𝑊𝑊,𝑖𝑖𝑖𝑖�.𝑑𝑑𝑑𝑑 (2)
ESE: delivered solar energy over period dt, kWh (1 kWh = 3.6 MJ) m𝑊𝑊,𝑖𝑖𝑖𝑖: inlet liquid water flowrate, kg·s-1
m𝑊𝑊,𝑜𝑜𝑜𝑜𝑜𝑜: outlet liquid water flowrate, kg·s-1
hS,out: steam enthalpy at separator outlet, J·kg-1
hW,out: water enthalpy at separator outlet, J·kg-1
hW,in: water enthalpy at solar field inlet, J·kg-1 dt: sampling period, s
The calculation of enthalpies assumes that temperature and pressure sensors are available at the solar field inlet and outlet.
For both cases, the reference period will be one year. The scope of application is the solar field itself, excluding a possible thermal storage. The degree of accuracy of this KPI must be high. According to equation 1, Table 4-1 gives an example of error propagation from each parameter to ESE, in the case of water at low temperature as liquid heat carrier.
Table 4-1 Error estimation for liquid water heat carrier
The error to be expected about ESE value is about 5%.
Table 4-2 gives the same evaluation for a solar saturated steam generator at 8 bars (other demonstration sites).
Parameter Reference value Parameter error ESE absolute deviation ESE relative deviation ��𝐦𝒉𝒉𝒉𝒉 kg/s 1.2 2% 0.004 kWh 2.0% Inlet temperature °C 80 0.2°C 0.003 kWh 1.3% Outlet temperature °C 95 0.2°C 0.003 kWh 1.3% Sampling time s 10 0.05 s 0.001 kWh 0.5% ESE calculated value kWh 0.21 - - 5.1%

17/45
Document:
D2.3. Key Performance Indicators to evaluate the integration of solar heating in industrial processes
Author:
CEA Version: 1 Reference: D2.3 SHIP2FAIR ID GA 792276 Date: 14/11/18
Table 4-2 Error estimation for saturated steam heat carrier
It will not be possible to expect an error less than 3% to determine ESE.
4.1.2. Total solar energy production: specific value
Delivered solar energy per unit of occupied surface is calculated, considering that no room remains available for another use. This takes into account the effective area occupied to deliver a given thermal energy. This can give recommendation for duplicated projects, keeping in mind that this depends strongly on location, collector's technology and integration, and on temperature of thermal power supply. Reference period for this indicator must be large, at least one year.
Equation (3) is a suggestion for the calculation.
𝐸𝐸𝑠𝑠 =𝐸𝐸𝑆𝑆𝑆𝑆𝑆𝑆𝑟𝑟𝑟𝑟𝑟𝑟
(3)
Es: delivered solar energy per unit surface over the reference period, kWh/year ESE: delivered solar energy over the reference period, kWh/year Sref: two surfaces maybe defined,
Soccupied: overall area occupied by collector's field, m² Scollector: gross area of the solar collector for stationary solar field (or mirror area for the CSP), m²
Using the overall surface of the solar field allows to compare two technologies in term of occupied area. Using the gross area of the solar collector allows to compare two suppliers with a same technology, for example two kinds of solar flat collectors. Of course, these comparisons suppose same temperature and solar resource.
Parameter Reference value Parameter error ESE absolute deviation ESE relative deviation ��𝐦𝑾𝑾,𝒊𝒊𝒊𝒊 kg/s 0.45 2% 0.063 kWh 2.2% ��𝐦𝑾𝑾,𝒐𝒐𝒐𝒐𝒐𝒐 kg/s 0.045 (10% of m𝑊𝑊,𝑖𝑖𝑖𝑖) 2% 0.006 kWh 0.2% Condensate return temperature °C 60 0.2°C 0.001 kWh 0.03%
Steam temperature °C 170 0.5°C 0.0 kWh 0.03% Sampling time s 10 0.05 s 0.014 kWh 0.5% ESE calculated value kWh 2.98 - - 3.0%

18/45
Document:
D2.3. Key Performance Indicators to evaluate the integration of solar heating in industrial processes
Author:
CEA Version: 1 Reference: D2.3 SHIP2FAIR ID GA 792276 Date: 14/11/18
4.2. SATISFACTION OF REQUIRED TEMPERATURE LEVEL(S)
Figure 4-4. Links between Inputs and ‘’Satisfaction of required temperature level(s)’’ KPI
Although the required temperature level(s) does not characterize the performance of the solar unit, it is important to check if it is able to supply thermal energy at a suitable temperature level. When used only as preheating, temperature level of solar energy always meets the need as the solar unit is in series with a conventional heating system. Only a target of preheating energy to reach can be defined. When the solar plant is used in parallel of a conventional heater, if the thermal power is not always available at required level, it will not be used and then it will be probably lost. This indicator can be defined by the fraction of time with solar heat available at the required temperature level. The reference period can be days covering one year. Equation (4) proposes a method of calculation of temperature availability.
Figure 4-5. Parameters for the calculation of the temperature level(s)
𝜏𝜏1 =𝑜𝑜@𝑇𝑇𝑃𝑃1𝑜𝑜𝑠𝑠𝑠𝑠𝑠𝑠𝑠𝑠𝑠𝑠
𝜏𝜏2 =𝑜𝑜@𝑇𝑇𝑃𝑃2𝑜𝑜𝑠𝑠𝑠𝑠𝑠𝑠𝑠𝑠𝑠𝑠
…. 𝜏𝜏𝑖𝑖 =𝑜𝑜@𝑇𝑇𝑃𝑃𝑃𝑃𝑜𝑜𝑠𝑠𝑠𝑠𝑠𝑠𝑠𝑠𝑠𝑠
(4)
τ1, τ2, τn: fraction of time with heat available at accurate temperature for process 1, 2,… n TP1…n: required temperature for process 1 to n 𝑑𝑑@𝑇𝑇𝑃𝑃1..𝑃𝑃: duration of heat supply at accurate temperature for process 1 ton, hours tsolar: duration of solar field in service, hours
The scope of application of this indicator is the whole solar system, including thermal storage if any.
As time measurements are the only input of this indicator, its precision is high. A source of error may result of the estimation of solar temperature matching with the required process one.
Inputs
End-user Provider
KPI
End-user
Tech
nica
l
SATISFACTION OF REQUIRED TEMPERATURE
LEVEL(S)
Real onsite solar resource
Thermal demand profile
Temperature demand profile
Space available Solar plant
Thermal storage

19/45
Document:
D2.3. Key Performance Indicators to evaluate the integration of solar heating in industrial processes
Author:
CEA Version: 1 Reference: D2.3 SHIP2FAIR ID GA 792276 Date: 14/11/18
4.3. SOLAR OVERALL EFFICIENCY
Figure 4-6. Links between Inputs and ‘’Solar overall efficiency’’ KPI
The combination of GNI/DNI, ambient conditions, characteristics of solar field and delivered solar energy allows to calculate overall solar efficiency which is done over a long time period for the field itself, including or not thermal storage. Value for instant, or short time efficiency is useful to check if collectors' characteristic is the expected one. Mean efficiency over a long period - i.e. a year - characterizes global operation giving a rough idea about thermal energy able to be collected for a given site over the period.
However, normalization procedures for solar thermal efficiency assessment, for extended technologies as flat plate collectors, have been developed during last years, and registered and updated in the corresponding UNE standards in Europe. Figure 4-7 gives an example of the efficiency curve for a flat vacuum solar collector.
Figure 4-7. TVP collector efficiency
Inputs
End-user Provider
KPI
End-user
Tech
nica
l
Total solar energy production Real onsite solar
resource
Thermal demand profile
Temperature demand profile
Space available Solar plant
Thermal storage
SOLAR OVERALL EFFICIENCY
Provider

20/45
Document:
D2.3. Key Performance Indicators to evaluate the integration of solar heating in industrial processes
Author:
CEA Version: 1 Reference: D2.3 SHIP2FAIR ID GA 792276 Date: 14/11/18
This thermal efficiency can be defined as the ratio of collected energy and incident energy, according to equation (5):
𝜂𝜂𝑠𝑠𝑜𝑜𝑠𝑠𝑠𝑠𝑟𝑟 =∫ 𝑃𝑃𝑜𝑜ℎ𝑟𝑟𝑟𝑟𝑒𝑒𝑠𝑠𝑠𝑠 (𝑜𝑜)𝑑𝑑𝑑𝑑𝑇𝑇0
∫ 𝜑𝜑𝑠𝑠𝑜𝑜𝑠𝑠𝑠𝑠𝑟𝑟(𝑜𝑜)𝑑𝑑𝑑𝑑𝑇𝑇0
(5)
T: duration of the period considered, days, month or year Pthermal: thermal power delivered by the solar field. This power can be evaluated at the solar field level or at the solar installation level (solar field + storage…), kW, MW ϕsolar: solar resource on the solar field. For the calculation of this resource, it is necessary to take into account the orientation of the collector, the shading... The reference area is the gross area for the stationary collectors (flat, ETC…) and the mirror area for the CSP collectors, kW, MW.
4.4. THERMAL POWER SIMULTANEITY
Availability of thermal power at the right temperature level must meet thermal demand. This can be completed by the use of thermal storage. Simultaneity can be measured for both cases: with and without thermal storage. The percentage of operation time when both match can be a good indicator calculation. A ponderation by amount of heat demand may be useful to highlight those periods with high demand being more important than periods with low demand. The level of mismatching would help to analyse the adequate dimension for the solar thermal storage.
Figure 4-8. Required and supplied thermal power
To calculate this indicator, required and supplied thermal power (P, p inFigure 4-8) must be known or measured. For above example, the average thermal power is calculated for each step:
𝑝𝑝1��� =1𝑑𝑑1� 𝑝𝑝(𝑜𝑜)𝑑𝑑𝑑𝑑𝑜𝑜0+𝑜𝑜1
𝑜𝑜0 ; 𝑝𝑝2��� = 𝑃𝑃 ; 𝑝𝑝3��� =
1𝑑𝑑3� 𝑝𝑝(𝑜𝑜)𝑑𝑑𝑑𝑑𝑜𝑜0+𝑜𝑜1+𝑜𝑜2+𝑜𝑜3
𝑜𝑜0+𝑜𝑜1+𝑜𝑜2
(6)
Simultaneity can be defined by the ratio of duration fully satisfying the required thermal power:
𝐶𝐶𝐹𝐹 =𝑑𝑑2𝑇𝑇
(7)
21/45
Document:
D2.3. Key Performance Indicators to evaluate the integration of solar heating in industrial processes
Author:
CEA Version: 1 Reference: D2.3 SHIP2FAIR ID GA 792276 Date: 14/11/18
When supplied thermal power satisfies only partially or fully the required power, a second indicator can be calculated for the period:
𝐶𝐶𝑃𝑃 =∑ 𝑝𝑝𝑖𝑖 . 𝑑𝑑𝑖𝑖𝑖𝑖1
min (𝑃𝑃.𝑇𝑇 ; ∑ 𝑝𝑝𝑖𝑖 . 𝑑𝑑𝑖𝑖𝑖𝑖1 )
(8)
CF: time fraction at full thermal power satisfied, dimensionless CP: time fraction at full or partial thermal power satisfied, dimensionless P: required thermal power, kW or MW 𝑝𝑝𝚤𝚤� : averaged thermal power over period ti, kW or MW p(t): instant thermal power, kW or MW ti: period duration, hours T: duration of required thermal power, hours
4.5. THERMAL STORAGE EFFICIENCY
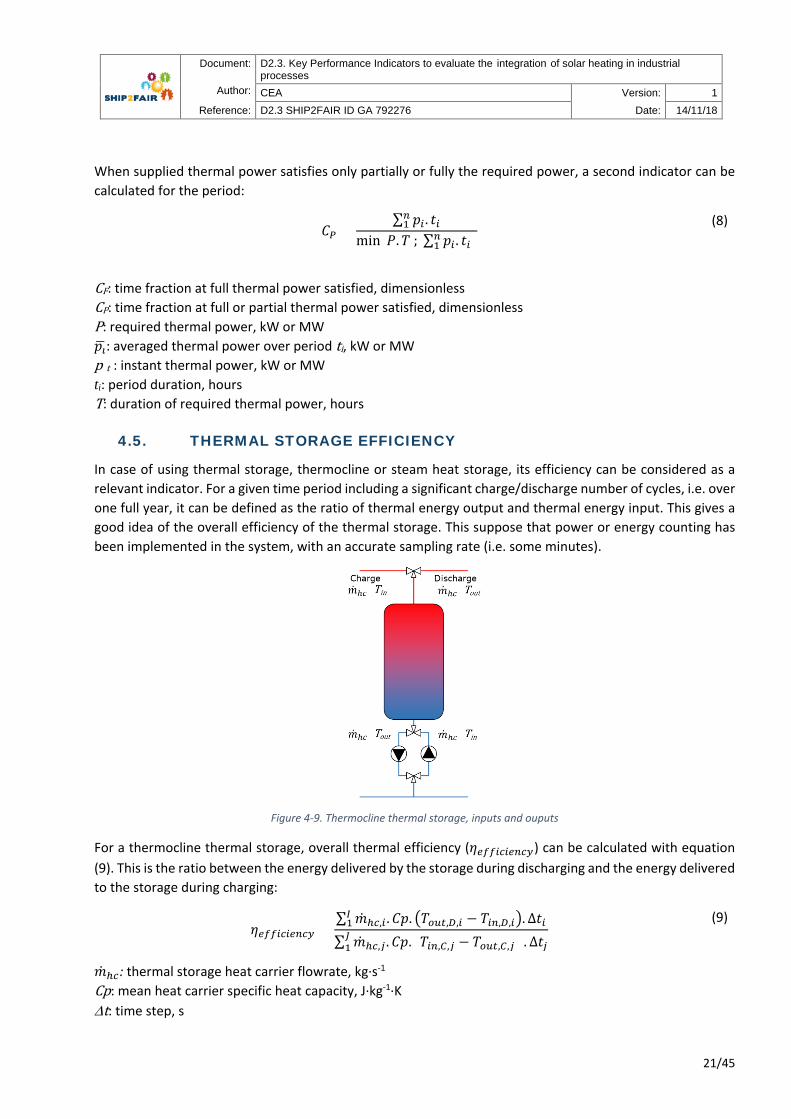
In case of using thermal storage, thermocline or steam heat storage, its efficiency can be considered as a relevant indicator. For a given time period including a significant charge/discharge number of cycles, i.e. over one full year, it can be defined as the ratio of thermal energy output and thermal energy input. This gives a good idea of the overall efficiency of the thermal storage. This suppose that power or energy counting has been implemented in the system, with an accurate sampling rate (i.e. some minutes).
Figure 4-9. Thermocline thermal storage, inputs and ouputs
For a thermocline thermal storage, overall thermal efficiency (𝜂𝜂𝑟𝑟𝑟𝑟𝑟𝑟𝑖𝑖𝑒𝑒𝑖𝑖𝑟𝑟𝑖𝑖𝑒𝑒𝑒𝑒) can be calculated with equation (9). This is the ratio between the energy delivered by the storage during discharging and the energy delivered to the storage during charging:
𝜂𝜂𝑟𝑟𝑟𝑟𝑟𝑟𝑖𝑖𝑒𝑒𝑖𝑖𝑟𝑟𝑖𝑖𝑒𝑒𝑒𝑒 =∑ ��𝑚ℎ𝑒𝑒,𝑖𝑖 .𝐶𝐶𝑝𝑝. �𝑇𝑇𝑜𝑜𝑜𝑜𝑜𝑜,𝐷𝐷,𝑖𝑖 − 𝑇𝑇𝑖𝑖𝑖𝑖,𝐷𝐷,𝑖𝑖�.Δ𝑑𝑑𝑖𝑖𝐼𝐼1
∑ ��𝑚ℎ𝑒𝑒,𝑗𝑗 .𝐶𝐶𝑝𝑝. (𝑇𝑇𝑖𝑖𝑖𝑖,𝐶𝐶,𝑗𝑗 − 𝑇𝑇𝑜𝑜𝑜𝑜𝑜𝑜,𝐶𝐶,𝑗𝑗)𝐽𝐽1 .Δ𝑑𝑑𝑗𝑗
(9)
��𝑚ℎ𝑒𝑒: thermal storage heat carrier flowrate, kg·s-1
Cp: mean heat carrier specific heat capacity, J·kg-1·K ∆t: time step, s

22/45
Document:
D2.3. Key Performance Indicators to evaluate the integration of solar heating in industrial processes
Author:
CEA Version: 1 Reference: D2.3 SHIP2FAIR ID GA 792276 Date: 14/11/18
Tin,C: temperature of heat carrier at thermal storage inlet during charging, K Tin,D: temperature of heat carrier at thermal storage inlet during discharging, K Tout,C: temperature of heat carrier at thermal storage outlet during charging, K Tout,D: temperature of heat carrier at thermal storage outlet during discharging, K i: index of time step during discharging j: index of time step during charging It is worth noting that the storage efficiency depends on the technology and kind of storage, where is placed in the plant, on the dynamic factors of the plant (temperature and flow, depending in turn on demand and solar supply) and also on a static factor, namely the insolation. Equation (9) can be use in the case of a sensible heat storage associated with a solar field using a liquid heat carrier (Figure 4-2). In the case of solar field producing steam (Figure 4-3), the associated storage maybe more complex (multi-stages storage, steam storage…), equation (9) is no more applicable, but the KPI remains the same : ratio between the energy delivered by the storage and the energy delivered to the storage. The detailed definition depends on the storage system.
4.6. THERMAL STORAGE EFFICACY
This KPI is used to evaluate the efficacy of the thermal storage in order to:
• Evaluate if the proper storage is in place • Evaluate the part of the solar energy which is stored
This indicator is calculated as the ratio between the energy delivered by the thermal storage and the energy delivered by the solar plant over a given period (net energy delivered to the processes).
𝜂𝜂𝑟𝑟𝑟𝑟𝑟𝑟𝑖𝑖𝑒𝑒𝑠𝑠𝑒𝑒𝑒𝑒 =∑ ��𝑚ℎ𝑒𝑒,𝑖𝑖 .𝐶𝐶𝑝𝑝. �𝑇𝑇𝑜𝑜𝑜𝑜𝑜𝑜,𝐷𝐷,𝑖𝑖 − 𝑇𝑇𝑖𝑖𝑖𝑖,𝐷𝐷,𝑖𝑖�.Δ𝑑𝑑𝑖𝑖𝐼𝐼1
𝐸𝐸𝑠𝑠𝑜𝑜𝑠𝑠𝑠𝑠𝑟𝑟,𝑖𝑖𝑟𝑟𝑜𝑜
(10)
��𝑚ℎ𝑒𝑒: thermal storage heat carrier flowrate, kg·s-1
Cp: mean heat carrier specific heat capacity, J·kg-1·K ∆t: time step, s Tin,D: temperature of heat carrier at thermal storage inlet during discharging, K Tout,D: temperature of heat carrier at thermal storage outlet during discharging, K i: index of time step during discharging Esolar,net: net solar energy delivered by the solar plant to the processes over the period, kWh (1 kWh = 3.6 MJ) As in §4.5, equation (10) needs to be adapt in the case of a solar field producing steam.
4.7. VOLUMETRIC ENERGY DENSITY
The concept of thermal storage efficiency could be also seen as the energy saved thanks to storage that otherwise would have been lost, in a time basis (i.e. one cycle, one week, or one year of operation) depending on the production process. This is the volumetric energy density (Ev𝑇𝑇𝑆𝑆𝑆𝑆).
This indicator is calculated as the ratio between all the energy that has been delivered by the thermal storage, which otherwise would have been just released to the environment or wasted, divided by the volume of the overall thermal storage system able to recovered the heat (i.e. heat exchanger, water/steam accumulation

23/45
Document:
D2.3. Key Performance Indicators to evaluate the integration of solar heating in industrial processes
Author:
CEA Version: 1 Reference: D2.3 SHIP2FAIR ID GA 792276 Date: 14/11/18
tank, or any other thermochemical or latent heat storage system). It can be measured in kWh/m3 or MJ/m3and it is calculated according to equation (11):
Ev𝑇𝑇𝑆𝑆𝑆𝑆 =∑ ��𝑚ℎ𝑒𝑒,𝑗𝑗 .𝐶𝐶𝑝𝑝. (𝑇𝑇𝑖𝑖𝑖𝑖,𝐶𝐶,𝑗𝑗 − 𝑇𝑇𝑜𝑜𝑜𝑜𝑜𝑜,𝐶𝐶,𝑗𝑗)𝑗𝑗1 .Δ𝑑𝑑𝑗𝑗
V𝑇𝑇𝑆𝑆𝑆𝑆𝑠𝑠
(11)
Ev𝑇𝑇𝑆𝑆𝑆𝑆: volumetric energy density, MJ/m3 or kWh/m3 ��𝑚ℎ𝑒𝑒: thermal storage heat carrier flowrate, kg·s-1
Cp: mean heat carrier specific heat capacity, J·kg-1·K ∆t: time step, s Tin,C: temperature of heat carrier at thermal storage inlet during charging, K Tout,C: temperature of heat carrier at thermal storage outlet during charging, K j: index of time step during charging VTESs: Volume of TES system, m3
4.8. STORAGE BY SOLAR SURFACE RATIO
This ratio aims at defining ratio between the volume of the thermal storage system and the surface of the solar collector field, according to equation (12). This KPI is applicable to sensible heat storage.
Given an energy density for a specific storage technology, higher ratios mean that there is a clear necessity of storage during the operation, since it is needed to store the energy generated by the solar field. Conversely, if the ratio is low, it means that the overall process requires almost all the solar energy generated.
𝑅𝑅𝑠𝑠𝑠𝑠 =𝑉𝑉𝑇𝑇𝑆𝑆𝑆𝑆𝑠𝑠𝑆𝑆𝑟𝑟𝑟𝑟𝑟𝑟
(12)
𝑅𝑅𝑠𝑠𝑠𝑠: ratio between the thermal storage volume and the solar collector surface, m3/ m2
VTESs: volume of TES system, m3
Sref: two surfaces maybe defined, Soccupied: overall area occupied by collector's field, m² Scollector: gross area of the solar collector for stationary solar field, m²
4.9. ADDITIONAL SPECIFIC ENERGY CONSUMPTION (OR COP)
This is the electric consumption of additional pumps and other auxiliaries which are necessary for the operation of the SHIP. Since the solar may include storage, the reference period for this indicator must be large, at least one month and ideally one year. The COP (Coefficient of Performance) can be expressed as the ratio between the energy delivered by the solar plant (solar field and storage) to the process and the electrical consumption of the solar plant.
𝐶𝐶𝐶𝐶𝑃𝑃 =∑ ��𝑚ℎ𝑒𝑒,𝑖𝑖 .𝐶𝐶𝑝𝑝. �𝑇𝑇𝑖𝑖𝑖𝑖,𝑖𝑖 − 𝑇𝑇𝑜𝑜𝑜𝑜𝑜𝑜,𝑖𝑖�.Δ𝑑𝑑𝐼𝐼1
∑ 𝑊𝑊𝑠𝑠(𝑖𝑖)𝐼𝐼1 .∆𝑑𝑑𝑠𝑠𝑠𝑠
(13)
��𝑚ℎ𝑒𝑒,𝑖𝑖: heat carrier flowrate at process inlet during step i, kg·s-1
Cp: mean heat carrier specific heat capacity, J·kg-1·K ∆t: time step, s
24/45
Document:
D2.3. Key Performance Indicators to evaluate the integration of solar heating in industrial processes
Author:
CEA Version: 1 Reference: D2.3 SHIP2FAIR ID GA 792276 Date: 14/11/18
Tin,i: temperature of heat carrier at process inlet, K Tout,i: temperature of heat carrier at process outlet, K Was: power to solar plant auxiliaries during time step i, W
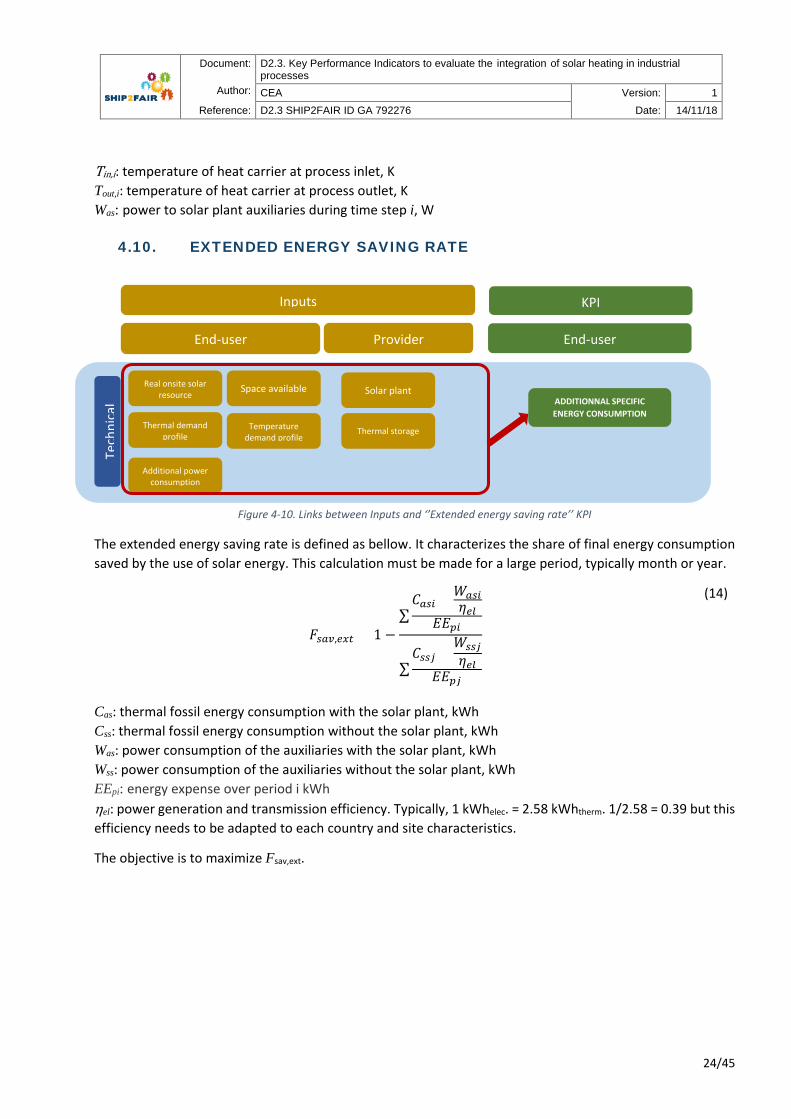
4.10. EXTENDED ENERGY SAVING RATE
Figure 4-10. Links between Inputs and ‘’Extended energy saving rate’’ KPI
The extended energy saving rate is defined as bellow. It characterizes the share of final energy consumption saved by the use of solar energy. This calculation must be made for a large period, typically month or year.
𝐹𝐹𝑠𝑠𝑠𝑠𝑠𝑠,𝑟𝑟𝑒𝑒𝑜𝑜 = 1 −∑𝐶𝐶𝑠𝑠𝑠𝑠𝑖𝑖 + 𝑊𝑊𝑠𝑠𝑠𝑠𝑖𝑖
𝜂𝜂𝑟𝑟𝑠𝑠𝐸𝐸𝐸𝐸𝑝𝑝𝑖𝑖
∑𝐶𝐶𝑠𝑠𝑠𝑠𝑗𝑗 +
𝑊𝑊𝑠𝑠𝑠𝑠𝑗𝑗𝜂𝜂𝑟𝑟𝑠𝑠
𝐸𝐸𝐸𝐸𝑝𝑝𝑗𝑗
(14)
Cas: thermal fossil energy consumption with the solar plant, kWh Css: thermal fossil energy consumption without the solar plant, kWh Was: power consumption of the auxiliaries with the solar plant, kWh Wss: power consumption of the auxiliaries without the solar plant, kWh EEpi: energy expense over period i kWh ηel: power generation and transmission efficiency. Typically, 1 kWhelec. = 2.58 kWhtherm. 1/2.58 = 0.39 but this efficiency needs to be adapted to each country and site characteristics.
The objective is to maximize Fsav,ext.
Inputs
End-user Provider
KPI
End-user
Tech
nica
l
Real onsite solar resource
Thermal demand profile
Temperature demand profile
Additional power consumption
Space available Solar plant
Thermal storage
ADDITIONNAL SPECIFIC ENERGY CONSUMPTION

25/45
Document:
D2.3. Key Performance Indicators to evaluate the integration of solar heating in industrial processes
Author:
CEA Version: 1 Reference: D2.3 SHIP2FAIR ID GA 792276 Date: 14/11/18
4.11. OVERALL EQUIPMENT EFFECTIVENESS
Figure 4-11. Links between Inputs and ‘’Overall equipment effectiveness’’ KPI
The integration of SHIP, including or not thermal storage, will lead to additional maintenance operations or troubleshooting to be supported by the end-user. This should be transparent and without any impacts and consequences on the solar plant process. A good way to survey this parameter is the overall equipment effectiveness: it is the ratio, over a given period, between the time period during which the solar field is really operated and the time period during which the solar field is supposed to be operated (regarding the availability of solar resource). This indicator can be used to survey the solar plant during its 20 years (or more) of exploitation. This ratio should be equal to 1. A decrease of this ratio should lead to a detailed analysis: maintenance operation to improve, degradation of the solar field…
𝐶𝐶𝐸𝐸𝐸𝐸 =∫ (��𝑉𝑠𝑠𝑜𝑜𝑠𝑠𝑠𝑠𝑟𝑟 𝑟𝑟𝑖𝑖𝑟𝑟𝑠𝑠𝑓𝑓 > 0)𝑑𝑑𝑑𝑑𝑇𝑇0
∫ (𝑇𝑇0 𝜑𝜑𝑠𝑠𝑜𝑜𝑠𝑠𝑠𝑠𝑟𝑟 > 𝜑𝜑𝑠𝑠𝑜𝑜𝑠𝑠𝑠𝑠𝑟𝑟,𝑟𝑟𝑟𝑟𝑟𝑟)𝑑𝑑𝑑𝑑
(15)
T: duration of the period considered, typically month or year ϕsolar: solar heat flux measured, W/m² ϕsolar, ref: solar heat flux which allow to operate the solar file, typically 50-100 W/m² Vsolar field: volume flow measured in the solar field, any unit
Inputs
End-user Provider
KPI
End-user
Tech
nica
l
Real onsite solar resource
Thermal demand profile
Temperature demand profile
Additional power consumption
Space available Solar plant
Thermal storage
OVERALL EQUIPMENT EFFECTIVENESS
26/45
Document:
D2.3. Key Performance Indicators to evaluate the integration of solar heating in industrial processes
Author:
CEA Version: 1 Reference: D2.3 SHIP2FAIR ID GA 792276 Date: 14/11/18
5. ECONOMIC INDICATORS Like many renewable energy technologies, solar heating is characterized by higher upfront investment costs and lower operation and maintenance (O&M) costs than conventional technologies.
Total investment costs for a thermal solar system consist of:
• basic equipment including the solar collectors • additional equipment such as collector mounting components, storage vessel and plumbing • engineering costs • installation and commissioning costs, which may include system redesign on site, assembly and
scaffolding, and finally putting into operation the system
Investment costs for solar heating depend on system design and application characteristics, the complexity of the chosen technology and market conditions in the country of operation.
Thermosiphon systems using natural circulation avoid the need for pumping and the associated equipment, installation and operating costs but are mainly limited to frost free climates. In other regions, higher-cost forced circulation systems will be required. However, due to the complexity and usually big dimensions of the facilities and processes, thermosiphon systems are not suitable for an industrial sector.
Apart from the system type, costs of labor and design characteristics and the size of the local solar heating and cooling market can also considerably influence the overall investment costs.
Large-scale solar hot water systems, whether used in district heating, industrial applications or commercial buildings, do benefit from economies of scale: installation costs comprise a smaller share of total Investment costs.
Investment costs for solar cooling are difficult to assess due to the limited experience and a high proportion of demonstration projects, which may include a large amount of R&D funding.
Operation and maintenance costs for solar heating and cooling systems are generally low as the systems require no fuel and use little electricity (to run auxiliary systems such as circulation pumps). But regular mirror cleaning of concentrating technologies is mandatory.
However regular servicing and light maintenance by a trained technician is required the solar thermal facilities, especially for absorption and adsorption chillers to maintain vacuum seals.
Maintenance for desiccant systems is simple and unspecialized, usually limited to air filter changes for cleaning, whereas operation of these systems is subject to more complex control strategies. As a result of the diverging investment and operating costs for different solar heating and cooling technologies, solar heat costs will vary widely depending on the technology and the local market conditions [IEA, 2012].
In the case of lack of data and for evaluation tasks, Annexes I, II and III give energy costs for European countries. They detail over the period 2014-2018 the average cost of electricity and natural gas. Annex II is extended to other fuels for some countries.

27/45
Document:
D2.3. Key Performance Indicators to evaluate the integration of solar heating in industrial processes
Author:
CEA Version: 1 Reference: D2.3 SHIP2FAIR ID GA 792276 Date: 14/11/18
5.1. IMPACT ON ENERGY BILL
Figure 5-1. Links between Inputs and ‘’Impact on energy bill’’ KPI
The use of solar energy affects the energy bill. This is an important KPI to be tracked during the system lifetime because the price of fossil energy will rise in the future. This indicator must be normalized by the production volume because it can change from one reference period to another one or it can be calculated over different periods.
𝐸𝐸𝐸𝐸𝑠𝑠𝑠𝑠𝑠𝑠𝑟𝑟𝑓𝑓∗ =𝐸𝐸𝐸𝐸𝑝𝑝1𝑃𝑃𝑝𝑝1
− 𝐸𝐸𝐸𝐸𝑝𝑝2𝑃𝑃𝑝𝑝2
(16)
Unit cost can be calculated per unit of volume, mass or manufactured object.
𝐸𝐸𝐸𝐸𝑠𝑠𝑠𝑠𝑠𝑠𝑟𝑟𝑓𝑓∗ : unit energy expenses saved, €/unit EEp1: energy expense over period p1, € EEp2: energy expense over period p2, € Pp1: production during period p1, units, volume, mass, etc. Pp2: production during period p2, units, volume, mass, etc.
Inputs
End-user
KPI
End-user
Tech
nica
l
Fossil Energy consumption
Econ
omic
Financial parameter
IMPACT ON ENERGY BILL
Envi
ronm
enta
l Fossil energy saving
Production Unit reference

28/45
Document:
D2.3. Key Performance Indicators to evaluate the integration of solar heating in industrial processes
Author:
CEA Version: 1 Reference: D2.3 SHIP2FAIR ID GA 792276 Date: 14/11/18
5.2. IMPACT ON PROCESS DURING BUILDING
During the building of solar plant, it should be considered if it is required to stop or reduce the plant production during a time to be defined. Also it should be taken into account if personal affected to production switches temporarily to SHIP integration into the plant.
Relative shut down time (SDT) due to SHIP integration can be an indicator:
𝑆𝑆𝑆𝑆𝑇𝑇 =𝑇𝑇𝑆𝑆𝐷𝐷𝑇𝑇𝑂𝑂𝑝𝑝
. 100 (17)
SDT: relative shut down time, % TSD: duration of shut down during SHIP integration, h TOp: duration of full operation during a reference period (i.e. year), h
If production is only reduced, production loss (PL) can be used as indicator:
𝑃𝑃𝑃𝑃 =𝑃𝑃𝑆𝑆𝑆𝑆𝑃𝑃𝐹𝐹𝑃𝑃
. 100 (18)
PL: relative production loss, % PSB: production during SHIP building, volume, mass, manufactured objects PFP: production at full production rate during a reference period (i.e. year), volume, mass, manufactured objects
Both indicators can be converted into money loss due to SHIP building.
Regarding the shift of human resources from production to SHIP building, different categories of personnel may be concerned:
• staff from design office for integration tasks • administrative personnel for authorizations, follow-up, contractual and commercial tasks, security… • workers for operations on factory's systems • etc.
This contribution can be converted from person·month to money and included in CAPEX calculation.

29/45
Document:
D2.3. Key Performance Indicators to evaluate the integration of solar heating in industrial processes
Author:
CEA Version: 1 Reference: D2.3 SHIP2FAIR ID GA 792276 Date: 14/11/18
5.3. SOLAR ENERGY COST (LCoH: Levelized Cost of Heat)
Figure 5-2. Links between Inputs and ‘’Levelized Cost of Heat’’ KPI
The solar energy cost is very important for the provider. The Levelized Cost of Heat (LCoH) evaluates the cost of heat produced by solar thermal systems over their life time. This enables the comparison of different designs and technical solutions. This is the combination of CAPEX and OPEX over the expected and actual lifetime of the solar plant. The LCoH is given in €/kWh.
The formula for the calculation of the LCoH is given by equation (19).
𝑃𝑃𝐶𝐶𝐿𝐿𝐿𝐿 =𝐶𝐶𝐶𝐶𝑃𝑃𝐸𝐸𝐶𝐶 + ∑ � 𝐶𝐶𝑃𝑃𝐸𝐸𝐶𝐶(𝑑𝑑)
(1 + 𝑊𝑊𝐶𝐶𝐶𝐶𝐶𝐶𝑖𝑖𝑜𝑜𝑒𝑒)𝑖𝑖�𝑘𝑘𝑖𝑖=1
∑ �𝑃𝑃𝑃𝑃𝐿𝐿𝑑𝑑0 ∗ (1 − 𝑆𝑆e𝑔𝑔𝑃𝑃𝑔𝑔𝑑𝑑)𝑖𝑖(1 + 𝑊𝑊𝐶𝐶𝐶𝐶𝐶𝐶𝑟𝑟ea𝑠𝑠)𝑖𝑖
�𝑘𝑘𝑖𝑖=1
(19)
OPEX: operation and maintenance expenditure (O&M) [€/year]. CAPEX: total investment expenditure [€]. Degrad: annual degradation of the nominal power of the system per year [%], Prod: Initial annual utilisation of the heat. n: economic lifetime of the system (typically 20 years). 𝑊𝑊𝐶𝐶𝐶𝐶𝐶𝐶𝑖𝑖𝑜𝑜𝑒𝑒 : Weighted Average Cost of Capital. This is the average rate expected by shareholders. WACC may
vary according to the project (between 2 to 10%) and the typology of the investors. 𝑊𝑊𝐶𝐶𝐶𝐶𝐶𝐶𝑟𝑟é𝑟𝑟𝑠𝑠 : Real Weighted Average Cost of Capital: this WACC take care of the inflation.
Inputs
End-user Provider
KPI
End-user
Tech
nica
l
Total solar energy production
Real onsite solar resource
Thermal demand profile
Temperature demand profile
Space available Solar plant
Thermal storage
Econ
omic
CAPEX
OPEX
Financial
Levelized Cost of Heat
Provider

30/45
Document:
D2.3. Key Performance Indicators to evaluate the integration of solar heating in industrial processes
Author:
CEA Version: 1 Reference: D2.3 SHIP2FAIR ID GA 792276 Date: 14/11/18
WACC calculation includes four economic inputs:
𝑊𝑊𝐶𝐶𝐶𝐶𝐶𝐶𝑖𝑖𝑜𝑜𝑒𝑒 = 𝑃𝑃𝑔𝑔𝑑𝑑𝑟𝑟_𝐿𝐿𝑜𝑜_𝑑𝑑𝑟𝑟𝑑𝑑𝑑𝑑 ∗ 𝑠𝑠ℎ𝑔𝑔𝑃𝑃𝑟𝑟_𝐿𝐿𝑜𝑜_𝑑𝑑𝑟𝑟𝑑𝑑𝑑𝑑 + 𝑃𝑃𝑔𝑔𝑑𝑑𝑟𝑟_𝐿𝐿𝑜𝑜_𝑃𝑃𝑟𝑟𝑑𝑑𝑟𝑟𝑃𝑃𝑟𝑟_𝐿𝐿𝑜𝑜_𝐿𝐿𝑜𝑜𝑟𝑟_𝑜𝑜𝑟𝑟𝑟𝑟𝑑𝑑𝑠𝑠 ∗ 𝑠𝑠ℎ𝑔𝑔𝑃𝑃𝑟𝑟_𝐿𝐿𝑜𝑜_𝐿𝐿𝑜𝑜𝑟𝑟_𝑜𝑜𝑟𝑟𝑟𝑟𝑑𝑑𝑠𝑠 (20)
The link between 𝑊𝑊𝐶𝐶𝐶𝐶𝐶𝐶𝑖𝑖𝑜𝑜𝑒𝑒 and 𝑊𝑊𝐶𝐶𝐶𝐶𝐶𝐶𝑟𝑟𝑟𝑟𝑠𝑠𝑠𝑠 is given by:
𝑊𝑊𝐶𝐶𝐶𝐶𝐶𝐶𝑟𝑟𝑟𝑟𝑠𝑠𝑠𝑠 =1 + 𝑊𝑊𝐶𝐶𝐶𝐶𝐶𝐶𝑖𝑖𝑜𝑜𝑒𝑒
1 + 𝐼𝐼𝑟𝑟𝑜𝑜𝐼𝐼𝑔𝑔𝑑𝑑𝐼𝐼𝐿𝐿𝑟𝑟 𝑃𝑃𝑔𝑔𝑑𝑑𝑟𝑟− 1
(21)
For thermal solar energy, these typical values can be used:
n: 20 to 25 years Degrad: Thermal degradation of the performance of 0.5%/year WACC: 4% Inflation rate: 0%
LCoH is useful to make comparison between different solutions and technologies. Of course this comparison is valid only if the same parameters are included in the evaluation of the CAPEX and OPEX.
5.4. RETURN ON INVESTMENT (ROI)
Figure 5-3. Links between Inputs and ‘’Return on Investment’’ KPI
Inputs
End-user Provider
KPI
End-user
Tech
nica
Fossil Energy consumption
Econ
omic
Financial parameter
RETURN ON INVESTMENT
Envi
ronm
enta
Fossil energy saving
CAPEX
OPEX
Additional specific energy consumption

31/45
Document:
D2.3. Key Performance Indicators to evaluate the integration of solar heating in industrial processes
Author:
CEA Version: 1 Reference: D2.3 SHIP2FAIR ID GA 792276 Date: 14/11/18
Return on investment (ROI) is a conventional economic indicator to be calculated taking into account actualization over the lifetime of the solar plant. The options of public funding and bank loan are to be considered through one or several business models.
ROI = (Gain from Investment – Investment cost)/ Investment cost (22)
5.5. COST OF STORED HEAT
Other criteria as energy density, market costs, heat losses can be also considered for thermal storage. Some of them can be gathered into the KPI called cost of heat stored. The improvement of dispatchability would be achieved by the reduction of the investment on cost of storage from 35,000 €/kWhth in 2010 to 15,000 €/kWhth in 2050 [Cabeza, 2015].
𝐶𝐶𝑆𝑆𝑆𝑆 =𝐼𝐼𝑜𝑜𝑠𝑠
∑ ��𝑚ℎ𝑐𝑐,𝐼𝐼.𝐶𝐶𝑝𝑝. �𝑇𝑇𝐿𝐿𝑟𝑟𝑑𝑑,𝑆𝑆,𝐼𝐼 − 𝑇𝑇𝐼𝐼𝑟𝑟,𝑆𝑆,𝐼𝐼�.Δ𝑑𝑑𝐼𝐼𝐼𝐼1
(23)
𝐶𝐶𝑆𝑆𝑆𝑆: ratio between the investment cost of storage system per accumulated energy unit, €/kWhth 𝐼𝐼𝑜𝑜𝑠𝑠: investment cost of the thermal storage system to be installed, € ��𝑚ℎ𝑒𝑒: thermal storage heat carrier flowrate, kg·s-1
Cp: mean heat carrier specific heat capacity, J·kg-1·K ∆t: time step, s Tin,D: temperature of heat carrier at thermal storage inlet during discharging, K Tout,D: temperature of heat carrier at thermal storage outlet during discharging, K i: index of time step during discharging

32/45
Document:
D2.3. Key Performance Indicators to evaluate the integration of solar heating in industrial processes
Author:
CEA Version: 1 Reference: D2.3 SHIP2FAIR ID GA 792276 Date: 14/11/18
5.6. PAYBACK PERIOD (PP)
Figure 5-4. Links between Inputs and ‘’Payback period’’ KPI
It is also a conventional economic indicator to determine when profit generation starts. It is determinate by filling a cumulated cash flow table established year per year (table 5-1). Cash flow is negative the first year of investment; when it becomes positive, payback period has been reached:
Table 5-1 Determination of payback period
Year Cash flow 0 - Investment 1 - Investment - OPEX1 + Savings1 2 - Investment - OPEX1 + Savings1 - OPEX2 + Savings2 … … N - Investment - ΣOPEX + ΣSavings
Over a long period, time value of money can be taken into account.
Payback period is very simple to calculate. It can be a measure of risk inherent in a project. Since cash flows that occur later in a project's life are considered more uncertain, payback period provides an indication of how certain the project cash inflows are. For companies facing liquidity problems, it provides a good ranking of projects that would return money rapidly.
Payback period does not take into account the time value of money which is a serious drawback since it can lead to wrong decisions. It does not take into account, the cash flows that occur after the payback period.
Additionnal specific energy consumption
Inputs
End-user Provider
KPI
End-user
Tech
nica
Fossil Energy consumption
Econ
omic
Financial parameter
PAYBACK PERIOD
Envi
ronm
enta
Fossil energy saving
CAPEX
OPEX
Overall Equipment Effectiveness

33/45
Document:
D2.3. Key Performance Indicators to evaluate the integration of solar heating in industrial processes
Author:
CEA Version: 1 Reference: D2.3 SHIP2FAIR ID GA 792276 Date: 14/11/18
6. ENVIRONMENTAL INDICATORS The list of the environmental indicators is given on Figure 6-1.
Figure 6-1. List of environmental indicators
6.1. FOSSIL ENERGY SAVING
This is one of the most important KPIs because the economic evaluation of the demonstration depends mainly on it. The energy balance of the plant, before and after SHIP integration will lead to this KPI.
This suppose that the end user is able to count exactly which the actual fossil fuel consumption is. If gas is used, a gas meter is always available, reading and recording the index can be satisfying. The best is to automatize recording. If fuel oil is used, only the volume filled in a fuel tank is known. If the refill frequency is high, the error due to level variations in the tank can be neglected. Otherwise, and this solution would be preferable in any case, an in-line fuel meter must be implemented. Yearly fossil consumption before and after SHIP integration can be measured. However, this assumes that the conditions of the process are similar. Differences can result of:
• Production volume different from one year to another: if energy savings are shared between different products, it is mandatory to split energy consumption and assign to each product its own consumption. Then, energy consumption can be normalized and given for identical quantities of production, before and after SHIP integration.
• Changes in process operation: if a temperature is changed in a manufacturing process, the energy consumption is also changed. Saving evaluation must be done at constant total (fossil and renewable) energy per unit of manufactured product.
A first approach is to calculate the ratio of solar energy over total energy (solar plus fossil).
𝐹𝐹𝐸𝐸𝑠𝑠𝑠𝑠𝑠𝑠𝑟𝑟𝑓𝑓 =𝑆𝑆𝐸𝐸
𝑆𝑆𝐸𝐸 + 𝐹𝐹𝐸𝐸. 100
(24)
FE: consumption of fossil energy during reference period, kWh FEsaved: fossil energy saved during reference period, %
Envi
ronm
enta
l
Fossil energy consumption
Fossil energy saving
CO2 Reduction
EROI
EPBT
Inputs
End-user Provider
KPI
End-user Provider

34/45
Document:
D2.3. Key Performance Indicators to evaluate the integration of solar heating in industrial processes
Author:
CEA Version: 1 Reference: D2.3 SHIP2FAIR ID GA 792276 Date: 14/11/18
SE: solar energy supplied to the process during the same reference period, kWh
Conversion of fossil energy consumption from amount (m3, tons,…) to kWh must be done carefully to take into account properly the conversion fuel to heat. Table 6-1 can be used to this effect.
Table 5-1: Fossil energy conversion [source: ATEE, 2015]
Fossil energy HCV/LCV kWh LCV Natural gas 1.11 9.7 kWh/m3 Heavy fuel oil 1.06 11.1 kWh/kg Light fuel oil 1.07 9.96 kWh/l Coal 1.05 7.22 kWh/t
The advantage of this calculation method is that it is independent of the production of final product. Nevertheless, if a kWh of solar energy can be directly used, a kWh contained in fossil fuel has to be converted into a boiler or heater to be usable. The efficiency of conversion must be considered to be used with solar kWh. High Calorific Value (HCV) or Low Calorific Value (LCV) is selected at this step. The efficiency is defined as the ratio between net delivered thermal power and thermal power contained in the fuel. If the fuel is fuel oil, the efficiency ranges from 75 to 95%. With natural gas, 90 to 93% is frequent for boilers, but up to 98% can be reached with condensing heaters.
6.2. EQUIVALENT CO2 REDUCTION
SHIP reduces fossil fuel consumption. The reduction is converted into equivalent CO2. Subtraction of carbon footprint over the solar plant lifetime may be necessary (CO2 "contained" in material, concreate, transport, erecting…). Extra electricity used is also to be taken into account in this carbon balance. Reduction of other GHG emission can be separately counted and converted into equivalent CO2 if they are identified, listed and measurable. For example, NOx emission can be tracked but this suppose that a measurement before SHIP integration is available.
Conversion of fuel consumption to CO2 emission is a characteristic of the fuel. Conversion factor has to be supplied by the fuel provider. If it is not possible, table 6-2 can be used.
Table 6-2 Conversion of fuel consumption to CO2 emission
Fuel CO2 emission (g/kWh) Light fuel oil 300 Heavy fuel oil 320 Natural gas 234 Propane or butane gas 274 Coal 384 Wood 13* Heating network 20 to 373
*Wood is a green energy. CO2 emitted by wood combustion is recycled by the growing biomass. CO2 emission is 355 g/kWh without replanting.

35/45
Document:
D2.3. Key Performance Indicators to evaluate the integration of solar heating in industrial processes
Author:
CEA Version: 1 Reference: D2.3 SHIP2FAIR ID GA 792276 Date: 14/11/18
6.3. ENERGY RETURN ON ENERGY INVEST (EROI)
This KPI is defined as the ratio between the energy which is delivered by the solar plant during its lifetime and the energy used for the manufacturing of the component, the construction and the operation of the power plant.
𝐸𝐸𝑅𝑅𝐶𝐶𝐼𝐼 =∑ 𝐸𝐸𝑠𝑠𝑜𝑜𝑠𝑠𝑠𝑠𝑟𝑟,𝑖𝑖𝑟𝑟𝑜𝑜,𝑖𝑖𝑖𝑖1
𝐸𝐸𝑒𝑒𝑜𝑜𝑒𝑒𝑝𝑝𝑜𝑜𝑖𝑖𝑟𝑟𝑖𝑖𝑜𝑜𝑠𝑠 𝑒𝑒𝑠𝑠𝑖𝑖𝑜𝑜𝑟𝑟𝑠𝑠𝑒𝑒𝑜𝑜𝑜𝑜𝑟𝑟𝑖𝑖𝑖𝑖𝑚𝑚 + 𝐸𝐸𝑒𝑒𝑜𝑜𝑖𝑖𝑠𝑠𝑜𝑜𝑟𝑟𝑜𝑜𝑒𝑒𝑜𝑜𝑖𝑖𝑜𝑜𝑖𝑖 + ∑ 𝐸𝐸𝑜𝑜𝑝𝑝𝑟𝑟𝑟𝑟𝑠𝑠𝑜𝑜𝑖𝑖𝑜𝑜𝑖𝑖,𝑖𝑖𝑖𝑖1
(25)
EROI, dimensionless, depends on the solar resource (in the south of Europe EPBT -Energy Payback Time calculated hereafter- is lower than in areas with a lower rate of radiation), the type of system (integrated, applied, orientation and inclination of the modules) and technology (efficiency of modules and type of production process).
6.4. ENERGY PAY BACK TIME (EPBT)
The Energy pay-back time, refers to the time, in years, required for the complete power plant to compensate for the use of energy for its production. The energy payback time depends on the amount of radiation.
𝐸𝐸𝑃𝑃𝐸𝐸𝑇𝑇 =𝐸𝐸𝑒𝑒𝑠𝑠𝑖𝑖𝑜𝑜𝑟𝑟𝑠𝑠𝑒𝑒𝑜𝑜𝑜𝑜𝑟𝑟𝑖𝑖𝑖𝑖𝑚𝑚 + 𝐸𝐸𝑒𝑒𝑜𝑜𝑖𝑖𝑠𝑠𝑜𝑜𝑟𝑟𝑜𝑜𝑒𝑒𝑜𝑜𝑖𝑖𝑜𝑜𝑖𝑖 + ∑ 𝐸𝐸𝑜𝑜𝑝𝑝𝑟𝑟𝑟𝑟𝑠𝑠𝑜𝑜𝑖𝑖𝑜𝑜𝑖𝑖,𝑖𝑖
𝑖𝑖1
𝐸𝐸𝑠𝑠𝑜𝑜𝑠𝑠𝑠𝑠𝑟𝑟,𝑖𝑖𝑟𝑟𝑜𝑜,0
(26)
As for the EROI, the EPBT depends on the solar resource, on the technology and on the application (process temperature).
6.5. RATIO OF STE/TOTAL ENERGY
This indicator represents the fraction of solar thermal energy (STE) over the total energy consumption, including extra electricity, generally negligible. It can be used for marketing purpose.
𝑆𝑆𝑇𝑇𝐸𝐸 𝑜𝑜𝑃𝑃𝑔𝑔𝑐𝑐𝑑𝑑𝐼𝐼𝐿𝐿𝑟𝑟 = 𝐸𝐸𝑆𝑆𝑇𝑇𝑆𝑆𝐸𝐸𝑜𝑜𝑜𝑜𝑜𝑜𝑠𝑠𝑠𝑠
(27)
STE fraction: fraction of solar thermal energy in total thermal energy consumption ESTE: solar thermal energy over a long reference period, kWh/year Etotal: total thermal energy consumption during the same period, kWh/year
6.6. OTHER POLLUTIONS SOURCES
This has to be defined according to the site specificity. It may include PM10 reduction, VOC, waste water, etc.
This is also linked to fossil energy saving if emission source is fuel oil for example.
6.7. VISUAL IMPACT
This indicator is very subjective. It can be a rated on an arbitrary scale 1 (low impact) to 4 (high impact). It may be a composite indicator taking into account degree of visibility, aesthetic, integration in the landscape and existing buildings… with ponderation factors.

36/45
Document:
D2.3. Key Performance Indicators to evaluate the integration of solar heating in industrial processes
Author:
CEA Version: 1 Reference: D2.3 SHIP2FAIR ID GA 792276 Date: 14/11/18
6.8. RESOURCES USED OR SAVED
This is related to extra resources to be used or saved. They may be indirectly yet taken into account in OPEX and CO2 reduction. Nevertheless, highlighting them is relevant for SHIP assessment. For example, water used to clean the collectors is a new resource consumption, requiring eventually liquid waste treatment. Other option is the saving of water used with refrigeration purposes, if it is avoided. Electricity for additional pumps can also be mentioned (maybe already considered in the extended energy saving rate KPI §4.10). Can be given as absolute value as m3 of water/year and normalized value as m3 of water/solar kWh, kWh elec/kWh thermal. Special attention should be paid to possible resources relevantly pollutant or critical raw material used/saved.

37/45
Document:
D2.3. Key Performance Indicators to evaluate the integration of solar heating in industrial processes
Author:
CEA Version: 1 Reference: D2.3 SHIP2FAIR ID GA 792276 Date: 14/11/18
7. SOCIAL INDICATORS
Figure 7-1. List of social indicators
7.1. SOCIAL IMPACT
In order to evaluate the social impact of the project, we propose to have a measurement of the internet or intranet traffic. The indicator can be used for large companies and/or for companies having an intranet.
7.1.1. Intranet level
A specific webpage should be developed on the intranet of the company. According to the progress of the project, this page should give:
- Information about the solar plant: objectives, interest, location, environmental impact…. - Progress on the construction - As far as the plan is in operation: monthly and annual results (with some of the KPIs of this report) - Collected solar energy counter in real time
It would be interesting to have the comments, remarks and suggestion from the employees.
A weekly or monthly counter of the number of logins to this webpage (reported to the number of employees) will allow to evaluate the interest and the implication of the employees in the solar project.
7.1.2. Internet level
The same approach should be used at the internet level. A specific link or webpage should be developed on the internet site of the company. Since the marketing is important at this level the information delivered should be controlled by the commercial and marketing department, but the objective would be to describe the project and the impact of the SHIP on the environmental aspects. In order to evaluate the social impact, a good indicator would be the ratio between the number of visitors on the dedicated webpage/links and the number of visitors on the web site of the company.
Inputs
End-user Provider
KPI
End-user Provider
Soci
al
European roadmap
Social Impact
Jobs creation (FTE)
Local employment
Gender equity
Safety

38/45
Document:
D2.3. Key Performance Indicators to evaluate the integration of solar heating in industrial processes
Author:
CEA Version: 1 Reference: D2.3 SHIP2FAIR ID GA 792276 Date: 14/11/18
7.2. DIRECT/INDIRECT JOBS CREATION (FTE)
The studies, the construction, the operation and the maintenance of the solar power plant will allow the creation of jobs. Some of these jobs will be located at the collector manufacturers. The expected data should be given by the manufacturer.
The job creation will be considered over the lifetime of the installation (typically 20 years). It will be expressed in terms of Full Time Equivalent Job (FTE), in person·year (p·y). In order to compare technologies or technical solutions it could be interesting to report the job creation to the solar plant net production (p·y/GWh).
𝐽𝐽𝐿𝐿𝑑𝑑 𝑐𝑐𝑃𝑃𝑟𝑟𝑔𝑔𝑑𝑑𝐼𝐼𝐿𝐿𝑟𝑟 = 𝐽𝐽𝐿𝐿𝑑𝑑𝑒𝑒𝑜𝑜𝑒𝑒𝑝𝑝 + 𝐽𝐽𝐿𝐿𝑑𝑑𝑠𝑠𝑜𝑜𝑜𝑜𝑓𝑓 + 𝐽𝐽𝐿𝐿𝑑𝑑𝑒𝑒𝑜𝑜𝑖𝑖𝑠𝑠𝑜𝑜 + �𝐽𝐽𝐿𝐿𝑑𝑑𝑜𝑜𝑝𝑝
𝑖𝑖
𝑖𝑖=1
− 𝐽𝐽𝐿𝐿𝑑𝑑𝑓𝑓𝑟𝑟𝑠𝑠𝑜𝑜 (28)
Jobcomp: job creation for the component manufacturing Jobstud: job creation for the studies Jobconst: job creation for the power plant construction Jobop: job creation for the power plant operation Jobdest: job destruction linked to the no-use of conventional energy
7.3. LOCAL EMPLOYMENT
A part of the jobs will be created locally, for example within a 100 km distance around the company; it should be interesting to give the share of the local job creation to the total job creation (%).
This indicator will be used for communication purposes: website, involvement of public authorities, etc.
7.4. GENDER EQUITY
This indicator is related to personnel involved in the solar activities with respect to those associated to fossil based facilities. An indicator of this equity could be the gender share in the job creation. The objective is to reach 50%.
7.5. SAFETY
This lists incidents directly attributed to SHIP. Incidents are split into lost-time incidents and no lost-time incidents. In order to take care of the solar plant production, the following indicator maybe defined:
𝑁𝑁𝑖𝑖−𝑠𝑠−𝑜𝑜 = 𝑁𝑁𝑜𝑜𝑒𝑒𝑁𝑁𝑟𝑟𝑟𝑟 𝑜𝑜𝑟𝑟 𝑖𝑖𝑖𝑖𝑒𝑒𝑖𝑖𝑓𝑓𝑟𝑟𝑖𝑖𝑜𝑜 𝑤𝑤𝑖𝑖𝑜𝑜ℎ𝑜𝑜𝑜𝑜𝑜𝑜 𝑠𝑠𝑜𝑜𝑠𝑠𝑜𝑜 𝑜𝑜𝑖𝑖𝑒𝑒𝑟𝑟𝑆𝑆𝑠𝑠𝑠𝑠𝑠𝑠𝑠𝑠𝑠𝑠,𝑃𝑃𝑛𝑛𝑛𝑛
(29)
𝑟𝑟𝑖𝑖−𝑠𝑠−𝑜𝑜 = 𝑁𝑁𝑜𝑜𝑒𝑒𝑁𝑁𝑟𝑟𝑟𝑟 𝑜𝑜𝑟𝑟 ℎ𝑜𝑜𝑜𝑜𝑟𝑟 𝑠𝑠𝑜𝑜𝑠𝑠𝑜𝑜 (𝑟𝑟𝑜𝑜𝑟𝑟 𝑖𝑖𝑖𝑖𝑒𝑒𝑖𝑖𝑓𝑓𝑟𝑟𝑖𝑖𝑜𝑜 𝑤𝑤𝑖𝑖𝑜𝑜ℎ 𝑠𝑠𝑜𝑜𝑠𝑠𝑜𝑜 𝑜𝑜𝑖𝑖𝑒𝑒𝑟𝑟)𝑆𝑆𝑠𝑠𝑠𝑠𝑠𝑠𝑠𝑠𝑠𝑠,𝑃𝑃𝑛𝑛𝑛𝑛
(30)
With Nn-l-t: number of incident /GWh nw-l-t: number of hour lost h/GWh) Esolar,net: net solar energy delivered by the solar plant to the processes over the period.
These indicators should be compared with those from conventional plants.

39/45
Document:
D2.3. Key Performance Indicators to evaluate the integration of solar heating in industrial processes
Author:
CEA Version: 1 Reference: D2.3 SHIP2FAIR ID GA 792276 Date: 14/11/18
8. REGULATORY
8.1. INCENTIVIZATION
How SHIP is supported by regional, national and transnational regulation? This parameter can be evaluated by reduction of taxes paid before and after SHIP.
8.2. INVOLVEMENT OF PUBLIC AUTHORITIES
The impact can be positive or negative. It can be evaluated by the contribution to funding, facilitations to promote SHIP, communication (positive impact), requirements beyond regulation, special permits (negative impact). If possible, invested time and money related to these items are to be evaluated and compared to an equivalent extension based on fossil energy.
8.3. COMPARISON BETWEEN THE COMPANY RENEWABLE ENERGY INTEGRATION AND THE EUROPEAN ROADMAP (ENER-SHARE)
The European targets for 2030 are:
• 40% cut in greenhouse gas emissions compared to 1990 levels • at least 27% share of renewable energy consumption
Each company can compare these objectives with its own performances. On the one hand, reduction of greenhouse emission may be difficult to estimate, especially if no measurement equipment is available, the emissions have not been registered during the past or if the production characteristics have changed.
On the other hand, the share of renewable energy can be measured by terms of the following ratio:
ENER-SHARE = Fsav,ext / 27% (31)
This indicator can include solar and other sources of renewable energy. Reaching an ENER-SHARE greater than 1 in 2030, shows a strong involvement of the company in a more sustainable transition.

Document:
D2.3. Key Performance Indicators to evaluate the integration of solar heating Author:
CIRCE Version: 1 Reference: D2.3 SHIP2FAIR ID GA 792276 Date: 14/11/18
9. CONCLUSIONS This report gives a method to evaluate the benefit of SHIP integration into an industrial process. The main required inputs are listed and then indicators are proposed. They are named Key Performance Indicators (KPIs) because they are accurate to analyze all the aspects of the results, regarding not only technical considerations but also economic, environmental, social and regulatory.
KPIs can be used at different steps of a project. Their integration in a decision tool allows evaluating the opportunity of the project during design step. During operation of a solar plant, they allow making analysis (technical, economical and others). This KPIs are proposed to analyse the fruitful of SHIP and get quantified feedbacks which can be used as inputs for similar applications (solar resource and temperature level). They are also a good way to survey the aging of the installation and detect any abnormal behavior.
All the KPIs described during this document have been summarized in Table 9-1 below, which allows a global overview and classification of the inputs required for each KPI, along with the actors involved. This table is the main result and aims to be the reference to follow during project life.
Depending on site characteristics and objectives, a selection among these indicators may be necessary, as the list has been made as exhaustive as possible.

41/45
Document:
D2.3. Key Performance Indicators to evaluate the integration of solar heating in industrial processes
Author:
CEA Version: 1 Reference: D2.3 SHIP2FAIR ID GA 792276 Date: 14/11/18
Inputs
End-user Provider
KPI
End-user Provider
Tech
nica
l
Satisfaction of Required temperature level
Thermal power simultaneity
Thermal storage efficiency
Extended energy saving rate Total solar energy production
Real onsite solar resource
Thermal demand profile
Temperature demand profile
Additional power consumption
Space available
Interface with end-user
Solar plant
Thermal storage
Thermal storage efficacy
Additional specific energy consumption
Overall equipment effectiveness
Envi
ronm
enta
l
Fossil energy consumption
Fossil energy saving
CO2 Reduction
EROI
EPBT
Solar Overall efficiency
Soci
al
European roadmap
Social Impact
Jobs creation (FTE)
Local employment
Gender equity
Safety
Fossil Energy Consumption
Production unit reference
Econ
omic
CAPEX
OPEX
Financial parameter
LCoH
Impact on energy bill
Impact on process during building
Return On Investment
Payback Period
Cost of stored heat
Storage by solar surface ratio
Volumetric energy density
Table 9-1 Synthetized table

42/45
Document:
D2.3. Key Performance Indicators to evaluate the integration of solar heating in industrial processes
Author:
CEA Version: 1 Reference: D2.3 SHIP2FAIR ID GA 792276 Date: 14/11/18
REFERENCES Luisa F. Cabeza, Esther Galindo, Cristina Prietoc, Camila Barreneche, A. Inés Fernández, Key performance indicators in thermal energy storage: Survey and assessment, Renewable Energy, November 2015, p820-827
Eurostat. https://ec.europa.eu/eurostat
IEA, “Technology Roadmap Solar Heating and Cooling”, 2012
Meteonorm. https://www.meteonorm.com/

43/45
Document:
D2.3. Key Performance Indicators to evaluate the integration of solar heating in industrial processes
Author:
CEA Version: 1 Reference: D2.3 SHIP2FAIR ID GA 792276 Date: 14/11/18
ANNEXES In the following table, electricity, energy and gas prices by country, by consumption class and by year are given in €/kWh from free European database (Eurostat).
ANNEX I: Natural gas cost for European countries
Cost in €/kWh, for non-residential customers, all taxes included, less than 1000 GJ. Source: [Eurostat].
COUNTRY Mean cost (S1-2014 to S1-2018) CommentEuropean Union (present composition) 0.0594
Germany (ex FRG zone) 0.0545Ex Yugoslav Republic of Macedonia 0.0403
Austria 0.0643Belgium 0.0529
Bosnia Herzegovina 0.0531Bulgaria 0.0381Croatia 0.0490
Denmark 0.0841Spain 0.0549
Estonia 0.0402Finland 0.0777 Mean of partial dataFrance 0.0616
Georgia 0.0250 Mean of partial dataGreece 0.0450
Hungary 0.0446Irland 0.0587Italia 0.0687
Latvia 0.0434Liechtenstein - Not available
Lithuania 0.0449Luxemburg 0.0453
Moldavia 0.0299 Mean of partial dataNetherlands 0.0754 Mean of partial data
Poland 0.0477Portugal 0.0813
Czech republic 0.0461Romania 0.0393 Partially estimated
United Kingdom 0.0614Serbia 0.0386
Slovaquia 0.0537Slovenia 0.0590Sweden 0.1072Turkey 0.0307
Ukraine 0.0313 Mean of partial data

44/45
Document:
D2.3. Key Performance Indicators to evaluate the integration of solar heating in industrial processes
Author:
CEA Version: 1 Reference: D2.3 SHIP2FAIR ID GA 792276 Date: 14/11/18
ANNEX II: Energy cost for European countries
European Union Unit 2014 2015 2016 2017Cost incl. taxes constant power industry €15 €c15/kWh 12 11.6 10.9 n.a.Cost incl. taxes constant natural gas industry €15 PCS €c15/kWh 4 3.6 3.2 n.a.Cost incl. taxes constant bituminous coal industry €15 €15/t n.a. n.a. n.a. n.a.Cost incl. taxes constant coke coal industry €15 €15/t n.a. n.a. n.a. n.a.Cost incl. taxes constant heavy fuel €15 €15/t 562 378 312 n.a.Cost incl. taxes constant light fuel (w/o transp.) €15 €15/l n.a. n.a. n.a. n.a.
Germany Unit 2014 2015 2016 2017Cost incl. taxes constant power industry €15 €c15/kWh 13.2 13.1 12.7 12.4Cost incl. taxes constant natural gas industry €15 PCS €c15/kWh 3.4 3.1 2.6 2.3Cost incl. taxes constant bituminous coal industry €15 €15/t 107 105 100 111Cost incl. taxes constant coke coal industry €15 €15/t n.a. n.a. n.a. n.a.Cost incl. taxes constant heavy fuel €15 €15/t 453 278 230 n.a.Cost incl. taxes constant light fuel (w/o transp.) €15 €15/l 1.148 1 0.9 1
Austria Unit 2014 2015 2016 2017Cost incl. taxes constant power industry €15 €c15/kWh 10.8 10.4 10.1 9.4Cost incl. taxes constant natural gas industry €15 PCS €c15/kWh 4.8 4.5 1.2 3.9Cost incl. taxes constant bituminous coal industry €15 €15/t 156 153 149 151Cost incl. taxes constant coke coal industry €15 €15/t n.a. n.a. n.a. n.a.Cost incl. taxes constant heavy fuel €15 €15/t 545.3 353 304 379Cost incl. taxes constant light fuel (w/o transp.) €15 €15/l 0.9 0.8 0.7 0.8
Belgium Unit 2014 2015 2016 2017Cost incl. taxes constant power industry €15 €c15/kWh 11.5 11.3 11.6 11.9Cost incl. taxes constant natural gas industry €15 PCS €c15/kWh 3.1 2.9 2.5 2.3Cost incl. taxes constant bituminous coal industry €15 €15/t 50 43 40 n.a.Cost incl. taxes constant coke coal industry €15 €15/t 119 107 103 n.a.Cost incl. taxes constant heavy fuel €15 €15/t 484 290 243 317Cost incl. taxes constant light fuel (w/o transp.) €15 €15/l 1.2 1 0.9 1
Spain Unit 2014 2015 2016 2017Cost incl. taxes constant power industry €15 €c15/kWh 11.7 11.3 10.5 10.1Cost incl. taxes constant natural gas industry €15 PCS €c15/kWh 3.3 3 2.4 2.3Cost incl. taxes constant bituminous coal industry €15 €15/t n.a. n.a. n.a. n.a.Cost incl. taxes constant coke coal industry €15 €15/t n.a. n.a. n.a. n.a.Cost incl. taxes constant heavy fuel €15 €15/t 526 345 279 357Cost incl. taxes constant light fuel (w/o transp.) €15 €15/l 1.1 0.9 0.8 0.9
France Unit 2014 2015 2016 2017Cost incl. taxes constant power industry €15 €c15/kWh 9.6 9.9 9.3 9.4Cost incl. taxes constant natural gas industry €15 PCS €c15/kWh 3.9 3.8 3.3 3.2Cost incl. taxes constant bituminous coal industry €15 €15/t 96 n.a. n.a. n.a.Cost incl. taxes constant coke coal industry €15 €15/t n.a. n.a. n.a. n.a.Cost incl. taxes constant heavy fuel €15 €15/t 518 371 342 446Cost incl. taxes constant light fuel (w/o transp.) €15 €15/l 1.1 1 0.9 1
Italy Unit 2014 2015 2016 2017Cost incl. taxes constant power industry €15 €c15/kWh 17.8 17 16.7 15.9Cost incl. taxes constant natural gas industry €15 PCS €c15/kWh 3.8 3.7 3.3 2.9Cost incl. taxes constant bituminous coal industry €15 €15/t n.a. n.a. n.a. n.a.Cost incl. taxes constant coke coal industry €15 €15/t n.a. n.a. n.a. n.a.Cost incl. taxes constant heavy fuel €15 €15/t 538 386 315 377Cost incl. taxes constant light fuel (w/o transp.) €15 €15/l 1.3 1.2 1.1 1.1
Portugal Unit 2014 2015 2016 2017Cost incl. taxes constant power industry €15 €c15/kWh 11.8 11.5 11.2 11.2Cost incl. taxes constant natural gas industry €15 PCS €c15/kWh 4.4 4 3.1 2.7Cost incl. taxes constant bituminous coal industry €15 €15/t 137 98 197 n.a.Cost incl. taxes constant coke coal industry €15 €15/t 383 371 329 345Cost incl. taxes constant heavy fuel €15 €15/t 670 517 477 585Cost incl. taxes constant light fuel (w/o transp.) €15 €15/l 1.2 1.1 1 1.1
United-Kingdom Unit 2014 2015 2016 2017Cost incl. taxes constant power industry €15 €c15/kWh 12.9 13 12.7 12.7Cost incl. taxes constant natural gas industry €15 PCS €c15/kWh 3.3 3 2.5 2.6Cost incl. taxes constant bituminous coal industry €15 €15/t 139 120 102 109Cost incl. taxes constant coke coal industry €15 €15/t n.a. n.a. n.a. n.a.Cost incl. taxes constant heavy fuel €15 €15/t 609 420 354 397Cost incl. taxes constant light fuel (w/o transp.) €15 €15/l 1.5 1.3 1.2 1.3

45/45
Document:
D2.3. Key Performance Indicators to evaluate the integration of solar heating in industrial processes
Author:
CEA Version: 1 Reference: D2.3 SHIP2FAIR ID GA 792276 Date: 14/11/18
ANNEX III: Electricity cost for European countries
Cost in €/kWh, for non-residential customers, all taxes included, less than 20 MWh. Source: Eurostat.
COUNTRY Mean cost (S2-2014 to S1-2018) CommentEuropean Union (present composition) 0.2288
Germany (ex FRG zone) 0.2823Ex Yugoslav Republic of Macedonia 0.1544
Austria 0.1926Belgium 0.2346
Bosnia Herzegovina 0.1286Bulgaria 0.1258
Cyprus 0.2140Croatia 0.1516
Denmark 0.2911Spain 0.3131
Estonia 0.1313Finland 0.1119France 0.1718
Georgia 0.0695 Mean of partial dataGreece 0.2241
Hungary 0.1338Irland 0.2254Island 0.0999 Mean of partial dataItalia 0.2998
Kosovo (according to 1244/99 resolution of UN) 0.1733Latvia 0.2051
Liechtenstein - Not availableLithuania 0.1523
Luxemburg 0.1694Malta 0.2236
Moldavia 0.1063 Mean of partial dataMontenegro 0.1091
Norway 0.1010Netherlands 0.1977
Poland 0.1835Portugal 0.2427
Czech republic 0.1965Romania 0.1275
United Kingdom 0.1981Serbia 0.0920
Slovaquia 0.2385Slovenia 0.1710Sweden 0.1711Turkey 0.0883
Ukraine 0.0708 Mean of partial data