key performance indicators for destination marketing · portfolio analysis strategic key...
TRANSCRIPT
Key Performance Indicators for
Destination Marketing
Market volume and market growth analysis
“Portfolio analysis”

Portfolio Analysis
Objective: To find the right mix of target markets
Implications for budget allocation process (e.g.
where to invest ...) and strategic (long-term)
decisions (e.g. shall we enter/leave a market?)
Basic questions:
• What makes a market attractive?
• What are our chances in attracting visitors from a
particular (attractive) market?
Portfolio Analysis
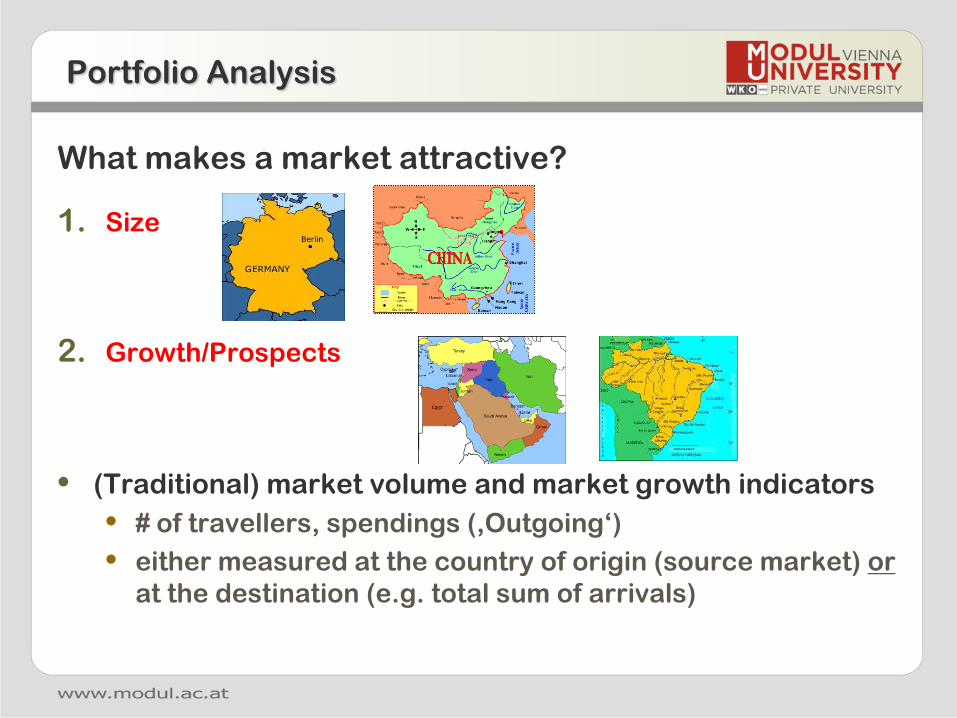
What makes a market attractive?
1. Size
2. Growth/Prospects
• (Traditional) market volume and market growth indicators
• # of travellers, spendings (‚Outgoing‘)
• either measured at the country of origin (source market) or
at the destination (e.g. total sum of arrivals)

Portfolio Analysis
What are our chances in attracting visitors from a
particular (attractive) market?
Market chance indicators
• Destination awareness
• Knowledge, preference and sympathy towards a destination
• Relative price level
• Comparison between prices of tourism goods and travel budget of travellers
• Level of distribution
• Availability of a destination within the generating country‘s distributional
system of tour operators and travel agents and online reservation systems
• Competitive pressure
• Advertising budget invested by all competitors in a market
• Travel distance
• Average financial input to cover travel distance
Portfolio Analysis
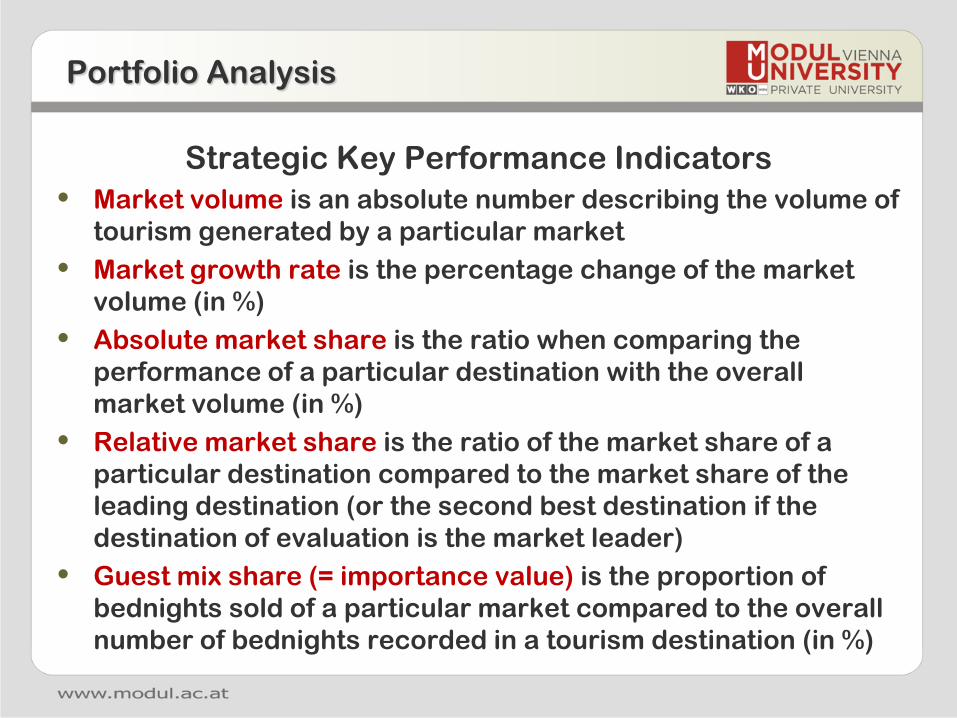
Strategic Key Performance Indicators
• Market volume is an absolute number describing the volume of
tourism generated by a particular market
• Market growth rate is the percentage change of the market
volume (in %)
• Absolute market share is the ratio when comparing the
performance of a particular destination with the overall
market volume (in %)
• Relative market share is the ratio of the market share of a
particular destination compared to the market share of the
leading destination (or the second best destination if the
destination of evaluation is the market leader)
• Guest mix share (= importance value) is the proportion of
bednights sold of a particular market compared to the overall
number of bednights recorded in a tourism destination (in %)

Market Growth-Share Matrix
Visualization
Portfolio Analysis
Examples on TourMIS „Market volumes and shares of selected destinations“
• Regional Level • Portfolio analysis of Austrian provinces
• City Level • Portfolio analysis of cities in Europe
• National Level • Portfolio analysis of countries in Europe

Discussion on possible future steps in
developing TourMIS

Forecasting tourism demand
Future steps
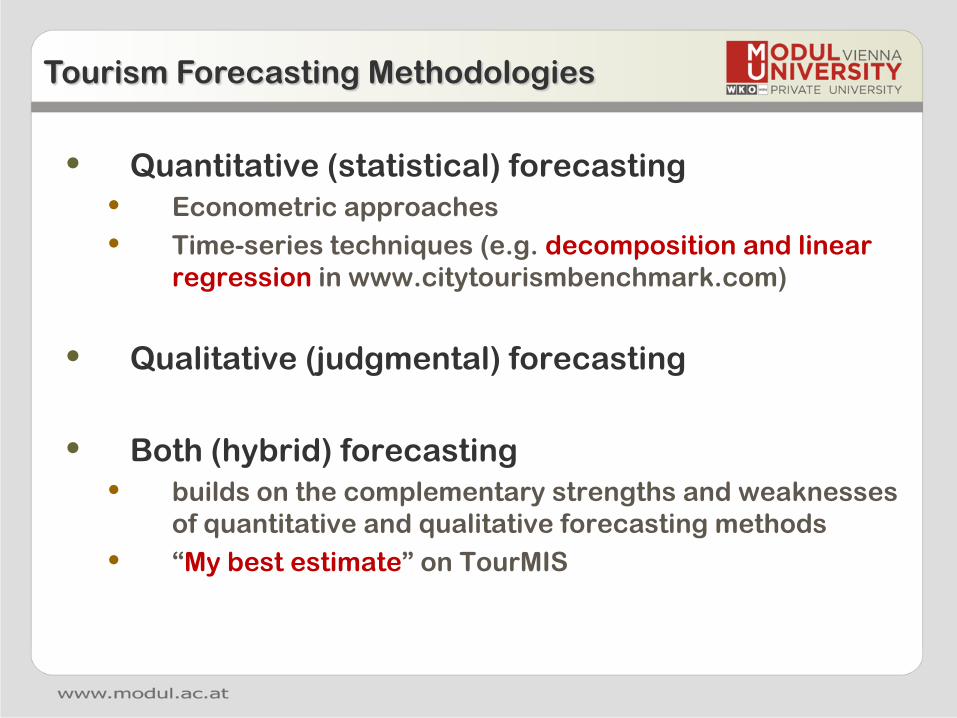
• Quantitative (statistical) forecasting
• Econometric approaches
• Time-series techniques (e.g. decomposition and linear
regression in www.citytourismbenchmark.com)
• Qualitative (judgmental) forecasting
• Both (hybrid) forecasting
• builds on the complementary strengths and weaknesses
of quantitative and qualitative forecasting methods
• “My best estimate” on TourMIS
Tourism Forecasting Methodologies
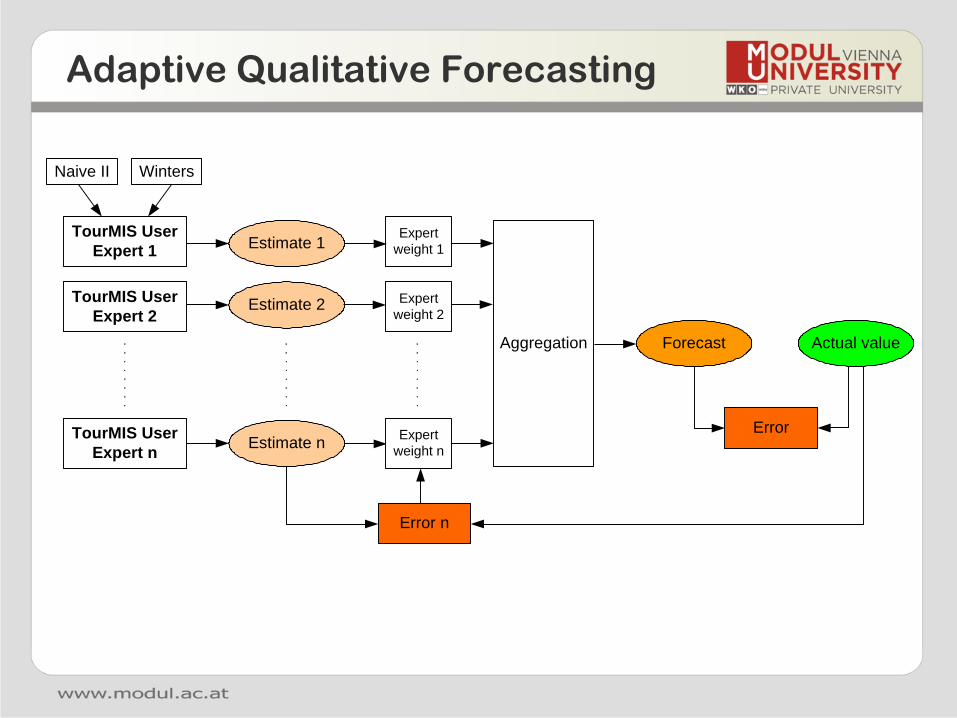
Adaptive Qualitative Forecasting
TourMIS User
Expert 1
TourMIS User
Expert 2
TourMIS User
Expert n
Estimate 1
Estimate 2
Estimate n
Aggregation
Expert
weight 1
WintersNaive II
Forecast Actual value
Expert
weight 2
Expert
weight n
Error n
Error

• Problem: Very little participation in „My best
estimates“
• System not user friendly enough?
• Too little confidence of TourMIS users making estimates?
• No need for forecasts??
• Possible solutions?
• Improve user interface?
• Reminding users to make estimates?
• Better presenting/visualizing the predictions?
• Replace hybrid with other quantitative forecasting
method(s)?
• Omit forecasting??
Adaptive Qualitative Forecasting

Economic indicators Evaluation of source market developments
Future steps

Economic indicators
Yahoo (finance.yahoo.com) via Finance::Quote (Perl)
• Stock market developments (9)
• ^GDAXI = Dax (Germany)
• ^DJI = Dow Jones Industrial Average (USA)
• ^FCHI = CAC40 (France)
• ^FTSE = FTSE 100 (UK)
• ^FTSEMIB.MI = (Italy)
• ^N225 = Nikkei 225 (Japan)
• ^IBEX = IBEX 35 (Spain)
• ^SSEC = SSE Composite Index (China)
• ^RTS.RS = Russian Trading System Index (Russia)
• Exchange rates (22)
• USD, CNY, JPY, GBP, RUB, DKK, SEK, CZK, HUF, CHF, HRK, NOK,
BGN, EEK, LVL, LTL, PLN, RON, SKK, TRY, ISK, UAH
• Monthly data since 2005, currently problems with
exchange rates (since 2/2012)
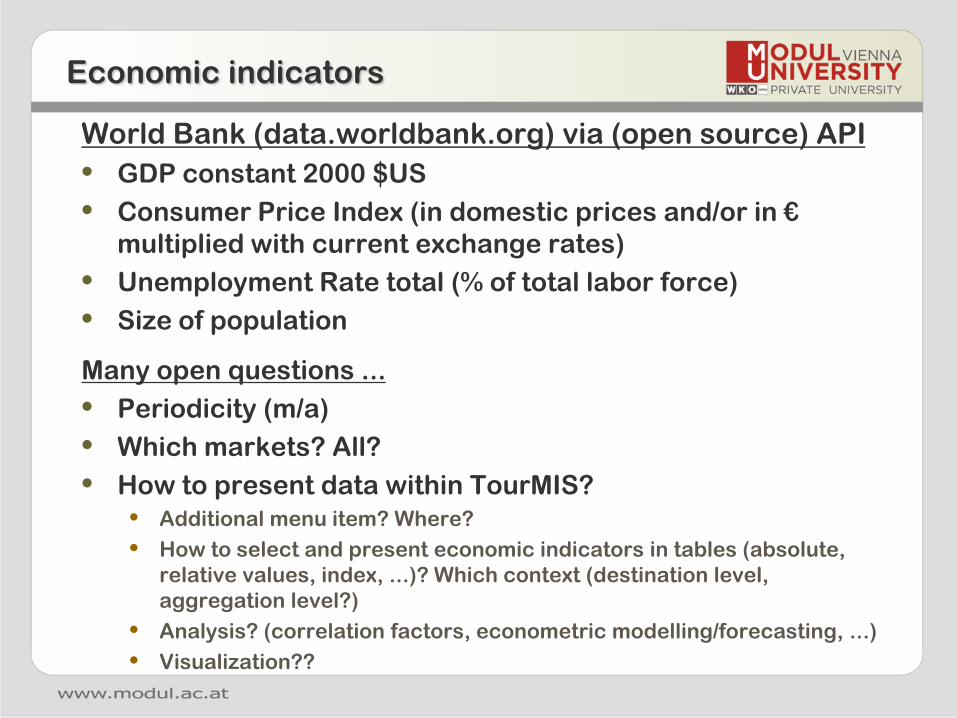
Economic indicators
World Bank (data.worldbank.org) via (open source) API
• GDP constant 2000 $US
• Consumer Price Index (in domestic prices and/or in €
multiplied with current exchange rates)
• Unemployment Rate total (% of total labor force)
• Size of population
Many open questions ...
• Periodicity (m/a)
• Which markets? All?
• How to present data within TourMIS?
• Additional menu item? Where?
• How to select and present economic indicators in tables (absolute,
relative values, index, ...)? Which context (destination level,
aggregation level?)
• Analysis? (correlation factors, econometric modelling/forecasting, ...)
• Visualization??

Possible New Tables & Graphs
Future steps

Opportunities for visualization
Google Chart Tools (API)
See https://developers.google.com/chart/interactive/docs/gallery
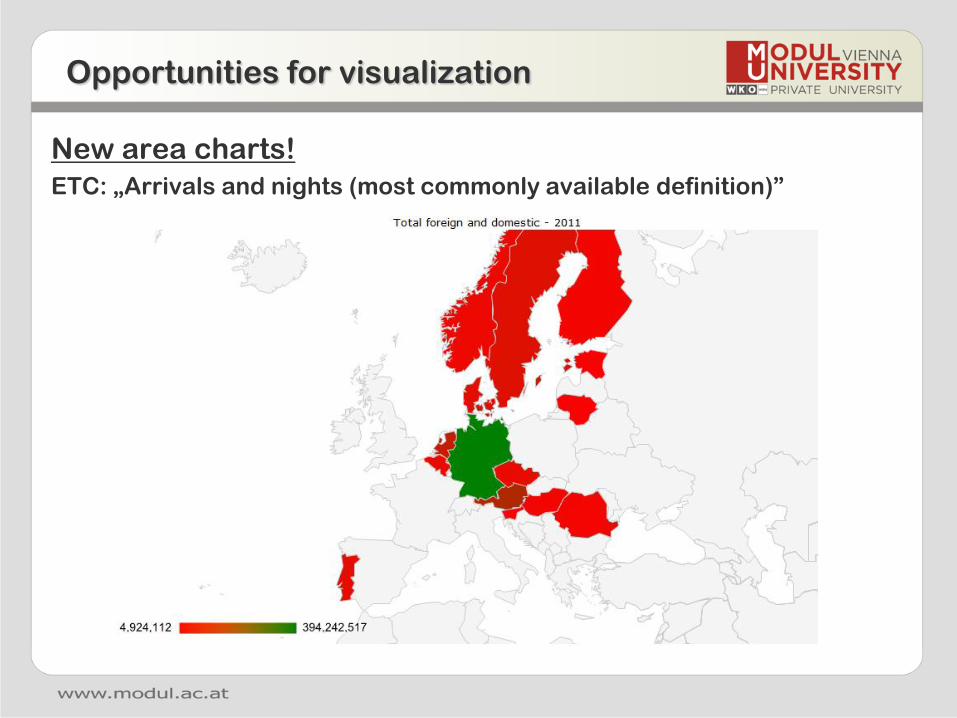
Opportunities for visualization
New area charts!
ETC: „Arrivals and nights (most commonly available definition)”

Opportunities for visualization
ECM: „Arrivals and nights (most commonly available definition)”
Opportunities for visualization
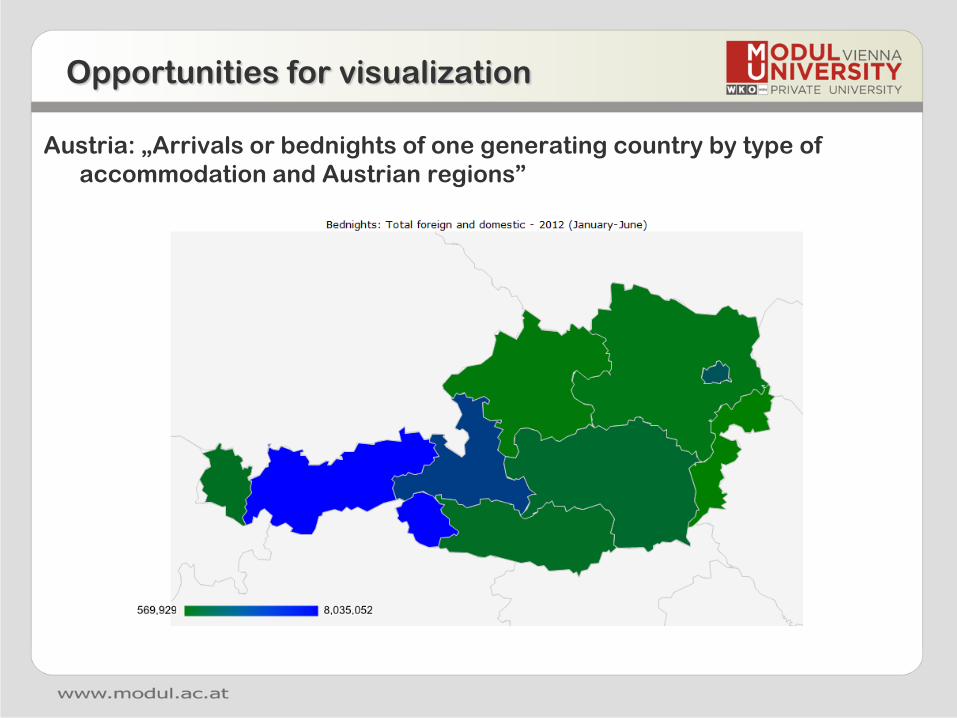
Austria: „Arrivals or bednights of one generating country by type of
accommodation and Austrian regions”

Opportunities for visualization
Other possible charts ...

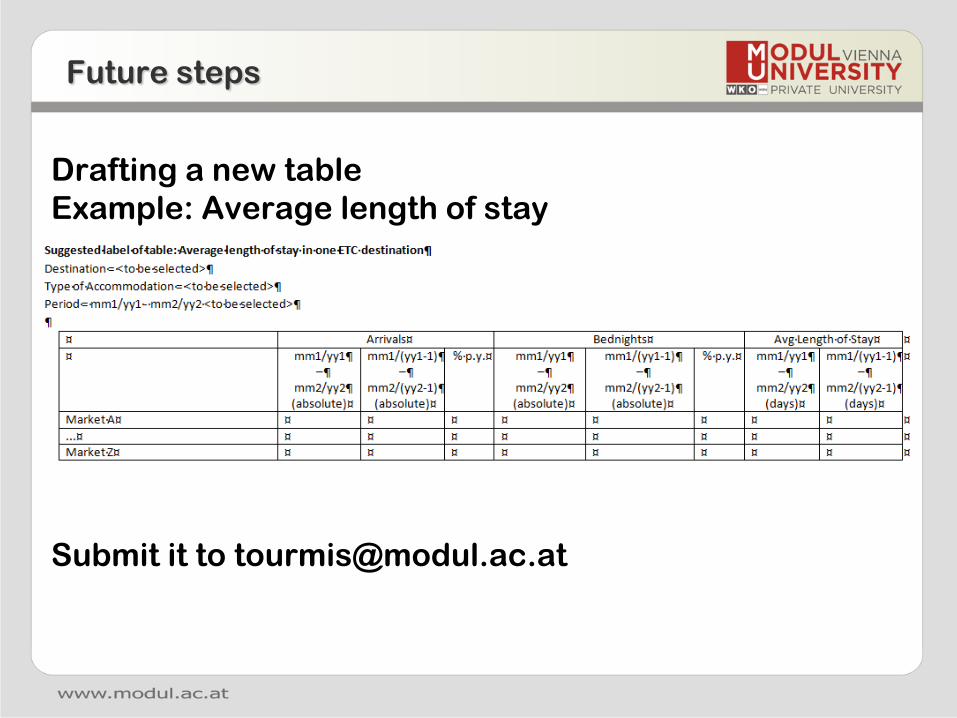
How to make suggestions for new
tables?
Future steps

Possible New Menu Structure
Future steps
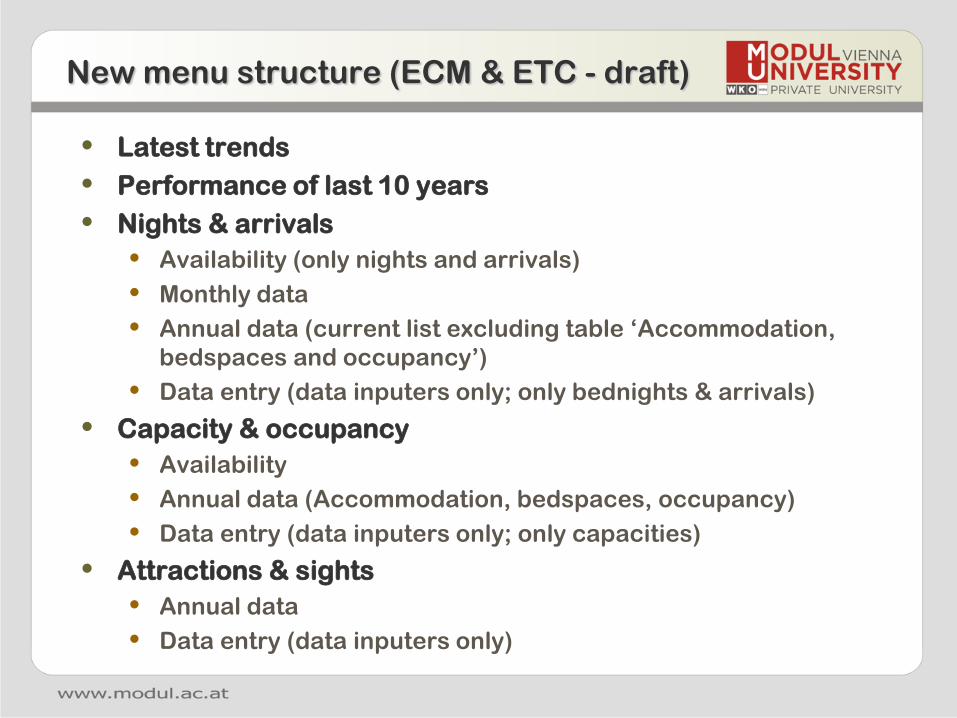
New menu structure (ECM & ETC - draft)
• Latest trends
• Performance of last 10 years
• Nights & arrivals
• Availability (only nights and arrivals)
• Monthly data
• Annual data (current list excluding table ‘Accommodation,
bedspaces and occupancy’)
• Data entry (data inputers only; only bednights & arrivals)
• Capacity & occupancy
• Availability
• Annual data (Accommodation, bedspaces, occupancy)
• Data entry (data inputers only; only capacities)
• Attractions & sights
• Annual data
• Data entry (data inputers only)

Summary of workshop findings and
feedback by participants