key concept weather forecasters use advanced … map to make the overall weather patterns easier to...
TRANSCRIPT
Sunshine StateSTANDARDSSC.D.3.3.6: The studentknows that no matterwho does science andmathematics or inventsthings, or when orwhere they do it, theknowledge and tech-nology that result caneventually becomeavailable to everyone. SC.H.1.3.3: The studentknows that science dis-ciplines differ fromone another in topic,techniques, and out-comes but that theyshare a common pur-pose, philosophy, andenterprise.SC.H.2.3.1: The studentrecognizes that pat-terns exist within andacross systems.
700 Unit 5: Earth’s Atmosphere
VOCABULARYmeteorologist p. 700isobar p. 703
BEFORE, you learned
• Weather changes when airmasses move
• High-pressure systems bringfair weather
• Fronts and low-pressure systems bring stormy weather
NOW, you will learn
• How weather data are collected• How weather data are displayed• How meteorologists forecast
the weather
KEY CONCEPT
Weather forecasters useadvanced technologies.
EXPLORE Weather Maps
What does a weather map show?
PROCEDURE
Look at the weather outside. Write downthe conditions you observe.
Use the map to check the weather conditions for your region.
WHAT DO YOU THINK?• What symbols on the map do you recognize?• How does the information on the weather map
compare with the weather you observed outside?
2
1
Weather data come from many sources.Looking at the weather outside in the morning can help you decidewhat to wear. Different things give you clues to the current weather.If you see plants swaying from side to side, you might infer that it iswindy. If you see a gray sky and wet, shiny streets, you might decide towear a raincoat.
You might also check a weather report to get more information.A weather report can show conditions in your area and also in theregion around you. You can look for weather nearby that might moveinto your area during the day. More detailed predictions of how theweather will move and change may be included in a weather report bya meteorologist. A (MEE-tee-uh-RAHL-uh-jihst) is ascientist who studies weather.
check your reading What information can a weather report show?
meteorologist
VOCABULARYMake a word triangle for meteorologist.
MATERIALSnewspaperweather map
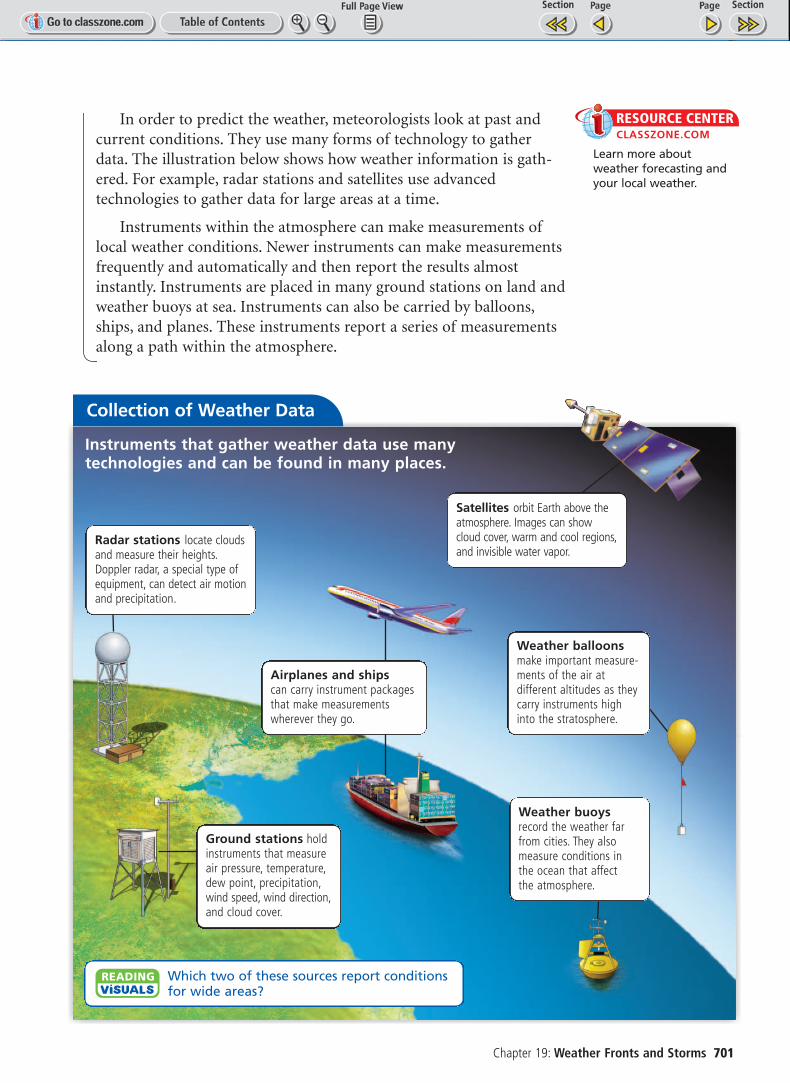
In order to predict the weather, meteorologists look at past andcurrent conditions. They use many forms of technology to gatherdata. The illustration below shows how weather information is gath-ered. For example, radar stations and satellites use advancedtechnologies to gather data for large areas at a time.
Instruments within the atmosphere can make measurements oflocal weather conditions. Newer instruments can make measurementsfrequently and automatically and then report the results almostinstantly. Instruments are placed in many ground stations on land andweather buoys at sea. Instruments can also be carried by balloons,ships, and planes. These instruments report a series of measurementsalong a path within the atmosphere.
RESOURCE CENTERCLASSZONE.COM
Learn more aboutweather forecasting andyour local weather.
Chapter 19: Weather Fronts and Storms 701
Instruments that gather weather data use manytechnologies and can be found in many places.
Collection of Weather Data
Which two of these sources report conditionsfor wide areas?
Ground stations holdinstruments that measureair pressure, temperature,dew point, precipitation,wind speed, wind direction,and cloud cover.
Satellites orbit Earth above theatmosphere. Images can showcloud cover, warm and cool regions,and invisible water vapor.
Weather buoysrecord the weather farfrom cities. They alsomeasure conditions in the ocean that affect the atmosphere.
Airplanes and ships can carry instrument packagesthat make measurementswherever they go.
Weather balloonsmake important measure-ments of the air atdifferent altitudes as theycarry instruments highinto the stratosphere.
Radar stations locate cloudsand measure their heights.Doppler radar, a special type ofequipment, can detect air motionand precipitation.
702 Unit 5: Earth’s Atmosphere
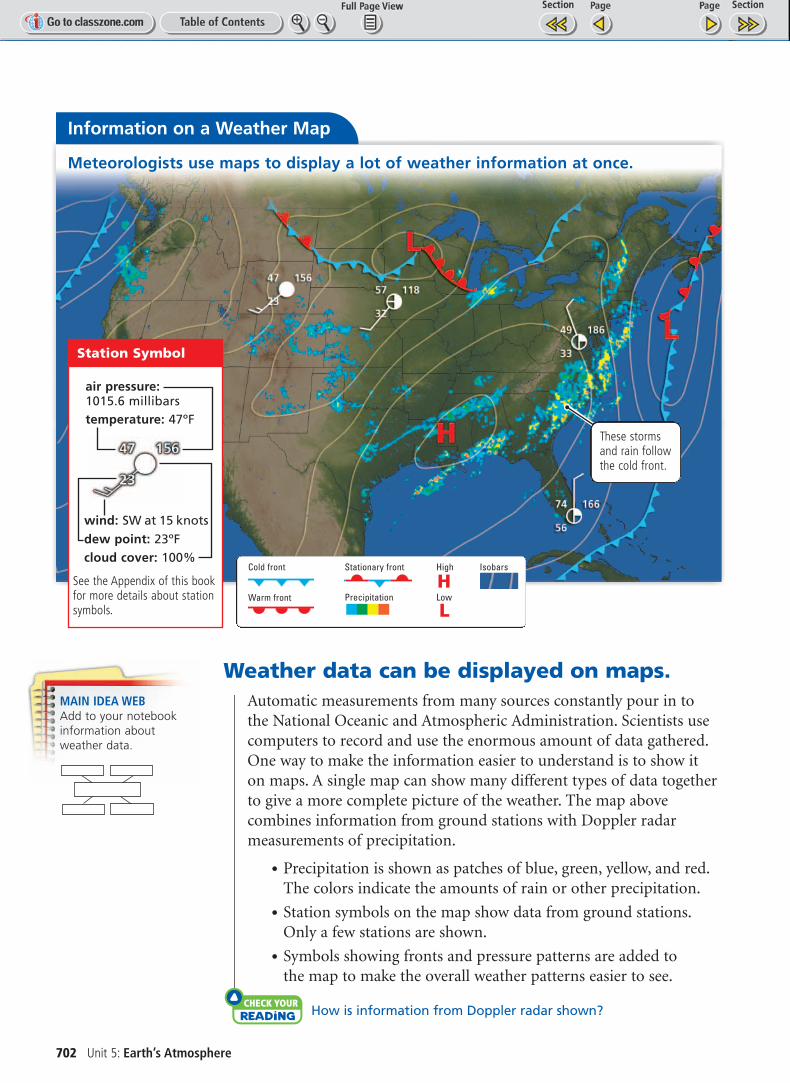
Weather data can be displayed on maps.Automatic measurements from many sources constantly pour in tothe National Oceanic and Atmospheric Administration. Scientists usecomputers to record and use the enormous amount of data gathered.One way to make the information easier to understand is to show iton maps. A single map can show many different types of data togetherto give a more complete picture of the weather. The map abovecombines information from ground stations with Doppler radarmeasurements of precipitation.
• Precipitation is shown as patches of blue, green, yellow, and red.The colors indicate the amounts of rain or other precipitation.
• Station symbols on the map show data from ground stations.Only a few stations are shown.
• Symbols showing fronts and pressure patterns are added to the map to make the overall weather patterns easier to see.
check your reading How is information from Doppler radar shown?
MAIN IDEA WEBAdd to your notebookinformation about weather data.
Information on a Weather Map
Station Symbol
cloud cover: 100%dew point: 23ºFwind: SW at 15 knots
air pressure: 1015.6 millibars temperature: 47ºF
Meteorologists use maps to display a lot of weather information at once.
Precipitation
High
Low
IsobarsCold front
Warm front
Stationary front
H
L
These stormsand rain followthe cold front.
See the Appendix of this bookfor more details about stationsymbols.
Chapter 19: Weather Fronts and Storms 703
Computer programs are used to combine information from manyground stations. The resulting calculations give the highs, lows, andfronts that are marked on the map. The cold front near the East Coasthas triangles to show that the front is moving eastward. This coldfront produced the heavy rain that is visible in the Doppler radar data.
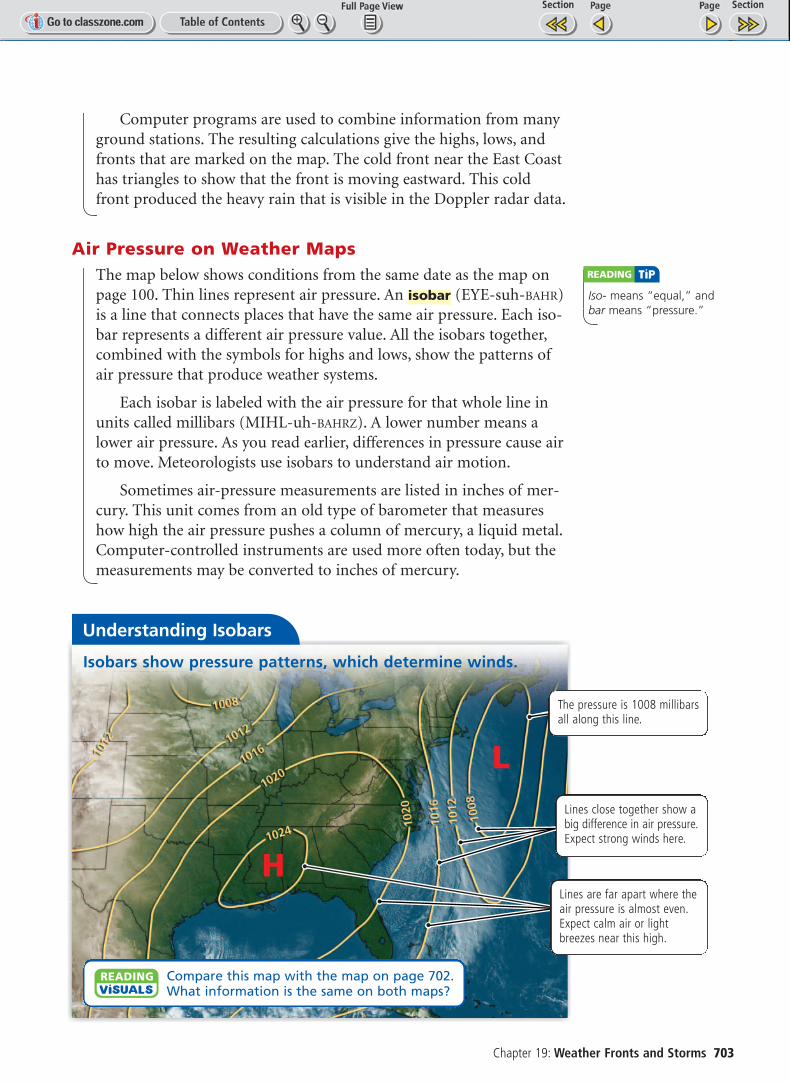
Air Pressure on Weather MapsThe map below shows conditions from the same date as the map onpage 100. Thin lines represent air pressure. An (EYE-suh-BAHR)is a line that connects places that have the same air pressure. Each iso-bar represents a different air pressure value. All the isobars together,combined with the symbols for highs and lows, show the patterns ofair pressure that produce weather systems.
Each isobar is labeled with the air pressure for that whole line inunits called millibars (MIHL-uh-BAHRZ). A lower number means alower air pressure. As you read earlier, differences in pressure cause airto move. Meteorologists use isobars to understand air motion.
Sometimes air-pressure measurements are listed in inches of mer-cury. This unit comes from an old type of barometer that measureshow high the air pressure pushes a column of mercury, a liquid metal.Computer-controlled instruments are used more often today, but themeasurements may be converted to inches of mercury.
isobar Iso- means “equal,” and bar means “pressure.”
Understanding Isobars
Isobars show pressure patterns, which determine winds.
H
LLines close together show abig difference in air pressure.Expect strong winds here.
Compare this map with the map on page 702.What information is the same on both maps?
The pressure is 1008 millibarsall along this line.
Lines are far apart where theair pressure is almost even.Expect calm air or lightbreezes near this high.
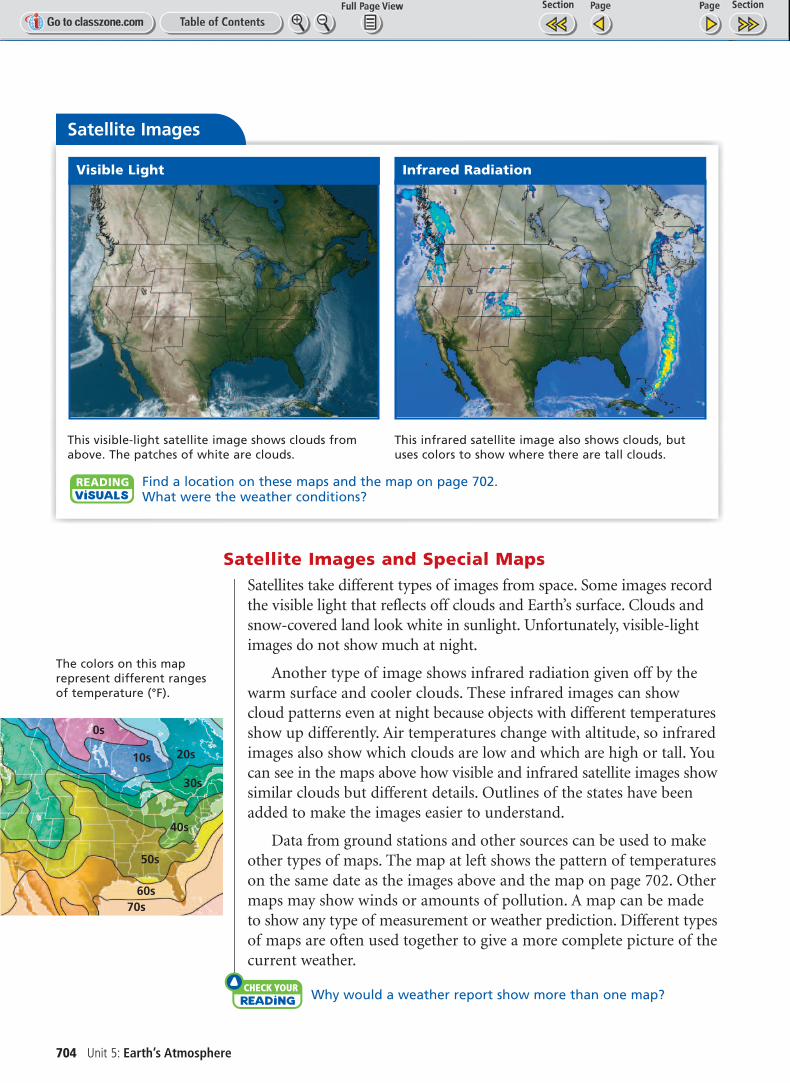
Satellite Images and Special MapsSatellites take different types of images from space. Some images recordthe visible light that reflects off clouds and Earth’s surface. Clouds andsnow-covered land look white in sunlight. Unfortunately, visible-lightimages do not show much at night.
Another type of image shows infrared radiation given off by thewarm surface and cooler clouds. These infrared images can showcloud patterns even at night because objects with different temperaturesshow up differently. Air temperatures change with altitude, so infraredimages also show which clouds are low and which are high or tall. Youcan see in the maps above how visible and infrared satellite images showsimilar clouds but different details. Outlines of the states have beenadded to make the images easier to understand.
Data from ground stations and other sources can be used to makeother types of maps. The map at left shows the pattern of temperatureson the same date as the images above and the map on page 702. Othermaps may show winds or amounts of pollution. A map can be madeto show any type of measurement or weather prediction. Different typesof maps are often used together to give a more complete picture of thecurrent weather.
check your reading Why would a weather report show more than one map?
704 Unit 5: Earth’s Atmosphere
The colors on this maprepresent different rangesof temperature (°F).
Satellite Images
Visible Light Infrared Radiation
This visible-light satellite image shows clouds fromabove. The patches of white are clouds.
This infrared satellite image also shows clouds, butuses colors to show where there are tall clouds.
Find a location on these maps and the map on page 702. What were the weather conditions?
10s 20s
30s
40s
50s
60s70s
0s
Chapter 19: Weather Fronts and Storms 705
KEY CONCEPTS1. List three of the sources of
weather data.
2. What does a map with isobarsshow?
3. How do meteorologists use computers?
CRITICAL THINKING4. Draw Conclusions Why do
meteorologists not combine alltheir weather information intoone map?
5. Analyze How is the informa-tion from radar and satellitesdifferent from the informationfrom ground stations?
CHALLENGE6. Apply Suppose you are plan-
ning an afternoon picnic aweek in advance. Fair weatheris forecast for that day, but astorm is expected that night.What will you do? Explain yourreasoning.
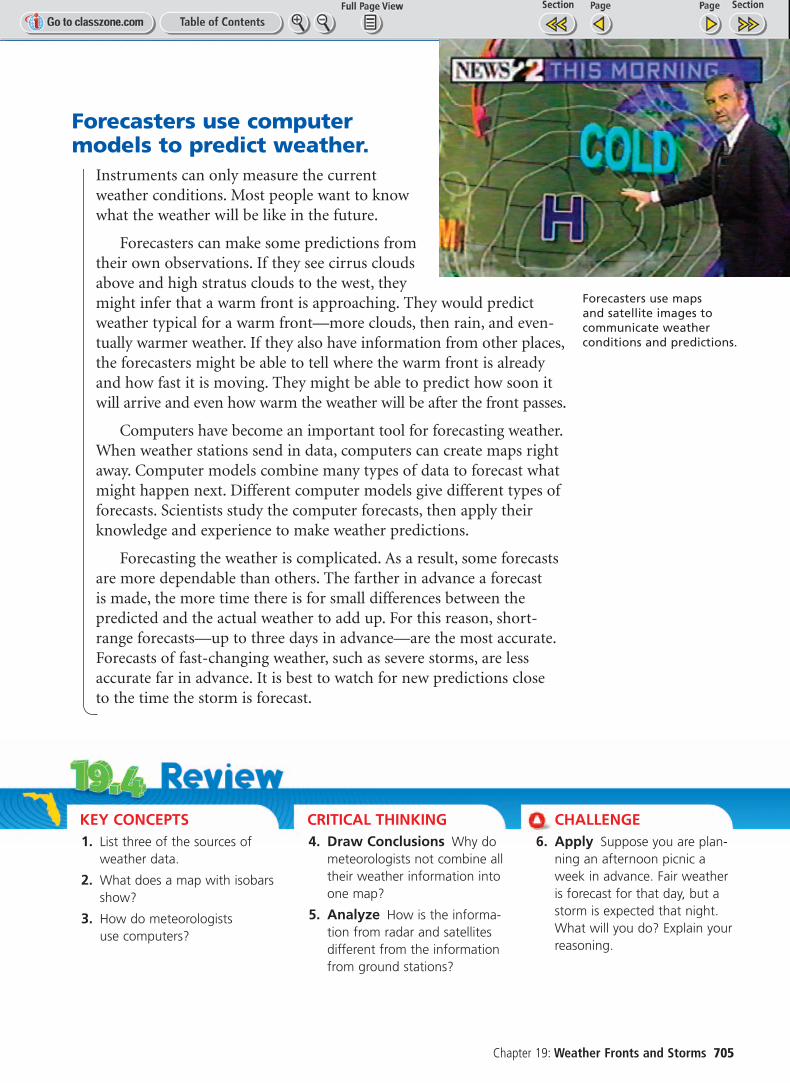
Forecasters use computermodels to predict weather.
Instruments can only measure the currentweather conditions. Most people want to knowwhat the weather will be like in the future.
Forecasters can make some predictions fromtheir own observations. If they see cirrus cloudsabove and high stratus clouds to the west, theymight infer that a warm front is approaching. They would predictweather typical for a warm front—more clouds, then rain, and even-tually warmer weather. If they also have information from other places,the forecasters might be able to tell where the warm front is alreadyand how fast it is moving. They might be able to predict how soon itwill arrive and even how warm the weather will be after the front passes.
Computers have become an important tool for forecasting weather.When weather stations send in data, computers can create maps rightaway. Computer models combine many types of data to forecast whatmight happen next. Different computer models give different types offorecasts. Scientists study the computer forecasts, then apply theirknowledge and experience to make weather predictions.
Forecasting the weather is complicated. As a result, some forecastsare more dependable than others. The farther in advance a forecast is made, the more time there is for small differences between thepredicted and the actual weather to add up. For this reason, short-range forecasts—up to three days in advance—are the most accurate.Forecasts of fast-changing weather, such as severe storms, are lessaccurate far in advance. It is best to watch for new predictions close to the time the storm is forecast.
Forecasters use maps and satellite images tocommunicate weatherconditions and predictions.