kent state of the environment 2015 · kent state of the environment 3 executive summary in 2011 the...
TRANSCRIPT

Kent state of theENVIRONMENT 2015A review of current and potential indicators within the Kent Environment Strategy
2Kent State of the Environment
Executive summary 3
Introduction 5
1.0 Overview of Kent 61.1 Land and habitat types 6
1.2 Kent Demographics 7
1.3 Employment and business demographics (any trends or projections) 10
1.4 Climate (trends in rainfall, temperature, and sea level) 12
2.0 Climate Change 132.1 Introduction 13
2.2 Vision for Kent 15
2.3 Indicators 15
2.4 Current state of play in Kent 15
2.5 Severe weather events 17
3.0 Air quality 193.1 Introduction 20
3.2 Vision for Kent 21
3.3 Indicators 22
3.4 Current state of play in Kent 22
4.0 Water quality 264.1 Introduction 26
4.2 Vision for Kent 26
4.3 Indicators 28
4.4 Current state of play in Kent 28
5.0 Flood Risk 305.1 Introduction 30
5.2 Vision for Kent 31
5.3 Indicators 31
5.4 Current state of play in Kent 31
6.0 Biodiversity 356.1 Introduction 35
6.2 Vision for Kent 36
6.3 Indicators 36
6.4 Current state of play in Kent 38
7.0 Water resources 397.1 Introduction 39
7.2 Vision for Kent 39
7.3 Indicators 39
7.4 Current state of play in Kent 40
8.0 Resources 448.1 Energy generation and consumption 44
8.2 Waste 46
9.0 Infrastructure – transport, housing and land 519.1 Introduction 51
9.2 Vision for Kent 52
9.3 Indicators 53
9.4 Current state of play 54
10.0 Economy 5710.1 Introduction 58
10.2 Vision 58
10.3 Indicators 58
10.4 Current state of play in Kent 58
11.0 Health and Wellbeing 6011.1 Introduction 60
11.2 Vision for Kent 60
11.3 Indicators 61
11.4 Current state of play in Kent 63
12.0 References 64
Contents

3Kent State of the Environment
Executive summaryIn 2011 the Kent Environment Strategy set out a series of priorities that aimed to address the county’s environmental challenges. In this report we evaluate the experience, understanding and results achieved, providing an evidence base to build on early successes and meet future challenges.
During the course of the four year programme, the Strategy has not only directed and informed actions that have led to environmental improvements within the county; it has also increased the depth of our understanding of the risks and opportunities faced. This report considered these in depth, looking at a broad range of environmental, social, economic and health topics that impact, and are impacted by, our environment. Above all, the report highlights the continued need for strong, evidence-based future strategies so we can ensure that we continue to deliver the right priorities for the county of Kent.
An essential baseline from which to assess and evolve future activities, the report identifies the rationale behind actions taken and the achievements made. For example, the county’s CO
2 emissions have been cut by 21% when
compared to the levels of 2005, with the 2.6% year-on-year reduction target achieved in most years. Despite these successes, the county has much more to do to meet an overall target of a 34% reduction in emissions by 2020.
A detailed analysis of carbon emissions identified exceptions in 2006, 2010 and 2012 and it’s these results that have highlighted where changes should be made. Evidence showed that the county’s commercial sector produces the highest level of emissions, closely followed by the transport sector; it also provides information on regional emissions variations, enabling future activities to be directed where needed.
A fuller understanding needs to be achieved across all reporting areas, to influence, inform, monitor and evaluate future strategies and policies. By further bridging the gaps in our knowledge we will be able to build the appropriate resources and capabilities and influence the behaviour
changes needed to address the environmental challenges that lie ahead. The complexity of these challenges cannot be underestimated; they are changing, escalating, and interconnected with the way that we live, work and behave.
It is impossible here, within a brief summary, to fully describe the scope of activities that are needed as the environmental pressures on Kent & Medway are manifold. The county’s proximity to London and role as a gateway to Europe continues to create specific pressures resulting from road, rail, sea and air links. In addition, population increase, housing development and industry all require increased space and resources. All of these factors have environmental impacts on air quality, biodiversity and health and wellbeing.
Recognising these pressures, the report demonstrates how, together with a wider partnership group, we are making the best use of our resources while at the same time seeking to minimise negative impacts.
For example, extreme weather events are recognised to be a key consequence of climate change. The report describes the lessons learned from extreme weather events through the Severe Weather Impacts Monitoring System (SWIMS). This has captured data about how the services provided by Kent partners are affected during severe weather events. It can now start to build a picture of the services’ vulnerability to these events, informing business cases to take appropriate action.
Similarly, evidence of increased renewable energy generation, energy and water efficiencies, and a reduction in waste sent to landfill achieved across the county are reported, and put into a national context. Kent’s total installed renewable electricity generation capacity exceeds 1GW and continues to grow, with a commitment to generate 10% of energy from renewables by 2020. Landfill is down to 18% and recycling has increased year on year. These are all achievements to be celebrated, evaluated and built on.

4Kent State of the Environment
Water management however continues to be a county-wide challenge. The county has many catchments where there is little or no water available for abstraction during dry periods. Pressures are particularly notable in Kent as it is one of the driest parts of England and Wales, coupled with high population density and household water use. This will be exacerbated by a rising population and associated development and climate change impacts. Almost three quarters of the county’s public water supply is taken from groundwater with the remainder pumped directly to customers from rivers or into storage reservoirs.
These supplies are finite; we are currently using most of that capacity and in places exceeding it. In response to this there is a commitment to reduce water consumption from 160 litres to 140 litres a person a day by 2016.
Sustainability is about more than resources and climate change. Sustainability also encompasses social and economic resilience. This report estimates that 19,600 people in Kent are currently employed in renewable and low carbon technology related industries, with 55,000 working in the wider Low Carbon and Environmental Goods and Services Sector. That’s 10% of the county’s working population. Kent Partners have agreed to a target increase of 10% in the number working within the Low Carbon and Environmental Goods and Services sector by 2020.
There is a clear interdependency between public health, social care and sustainability; access to green spaces, air quality, the impacts of climate change, housing, transport and community safety are just a few of the factors that can impact on health and wellbeing. Over the last four years we have been considering the overlaps between sustainability and health and wellbeing and have developed a number of recommendations as a result.
These, alongside all of the other facets that make up our environmental footprint, will be a part of Kent’s ongoing progress towards meeting our strategic vision where:
“The county of Kent is benefiting from a competitive, innovative and resilient economy, with our natural and historical assets enhanced and protected for their unique value and positive impact on our society, economy, health and wellbeing.”

5Kent State of the Environment
The aim of this report is to provide an overview of the priorities set out in the Kent Environment Strategy (KES) from 2011. Using relevant indicators it aims to provide an evidence base of what those priorities tell us about the state of our environment in terms of natural environment, resources, economy and health.
The report has provided a baseline for identifying emerging priorities and any gaps in the last five years of activity toward the KES and from any relevant socio-economic or environmental trends or challenges that have arisen locally or regionally over that period.
The report is divided into three parts as listed below:
1. Overview of Kent: looking at why our environment is important and what the key impacts are that affect it and our way of life; (section one).
2. Natural systems: focussing on the changes we see in the quality and status of our climate, water and biodiversity; (section two to six).
3. Built environment and people: focussing on the changes we see in our built environment and resource management, health and wellbeing; (Sections seven to 11).
Parts two and three are divided into a number of priority areas and indicators discussed under each part. Those indicators include a justification for their use, current or proposed targets that form Kent’s vision and current status of those indicators. The report has been used alongside feedback from the three stakeholder workshops held between December 2014 and February 2015 to inform a revised 2015 Kent Environment Strategy.
Introduction

6Kent State of the Environment
1.0 Overview of KentChanges in population, climate and land use can form both positive and negative pressures on our social, economic and environmental systems. This part of the report aims to highlight the current status of those three areas and any historical and forecasted trends.
1.1 LAND AND HABITAT TYPES
Kent is one of the largest counties in England by area, covering 391,823 hectares. It is also one the UK’s most wildlife-rich counties, a result of its varied geology, long coastline, landscape history, southerly location and proximity to mainland Europe. Its important wildlife habitats include estuaries, chalk cliffs, woodlands and chalk downland and it encompasses some of the South East’s most iconic landscapes such as the shingle headland of Dungeness and the White Cliffs of Dover.
Due to its proximity to mainland Europe, it has a temperate climate subject to continental weather influences, generally being drier than the UK average, with warm summers and cold spells in winter. As a result, the county can support many species uncommon elsewhere in Britain. Additionally, it has an ancient landscape history, with many of the semi-natural habitats being a product of historic land management practices, such as the grazed chalk downland of the North Downs and ancient coppice woodland that spreads across the South East (ARCH, 2012).
These habitats provide benefits through their visual, cultural and amenity value (ARCH, 2012).
1.1.1 CURRENT STATUS
As part of the 2012 ARCH Kent Habitat Survey a county-wide survey was completed to map all habitats in Kent and Medway. The largest single habitat class is arable and horticulture, covering 137,227 hectares (35%) of the county, followed by improved grassland with 116,319 hectares (30%), see Table 1-1 (ARCH, 2012).
Table 1-1 A summary of habitats across Kent (excluding Medway Unitary Authority) and the proportion of the landscape that they make up; data based on the results of the ARCH project.
Type Hectares
Arable and horticulture 137,227 35.02%
Improved (intensively managed) grassland 116,319 29.69%
Natural and semi-natural habitats 106,251 27.12%
Built and urban habitats 60,607 15.47%
Traditional orchards 1,676 0.43%
Heathland 74 0.02%
Total 422,154 108%
Kent - habitats to the mean low water mark (ha) 391,823
Note: that the administrative area of Kent is 379,111 hectares and the area of Kent’s habitats to the mean low water mark is 391,823 hectares.
There are increasing pressures on our landscape and natural heritage, as there is globally. Due to its proximity to London and as a gateway to Europe, there are some specific pressures in Kent resulting from road, rail, sea and air links. A range of factors including population increase, housing development, transport links and industry all require increased space and resources. In addition to these pressures on land use, there are some general trends which, historically, have had a negative effect on the natural diversity of Kent. Some of these factors have included (ARCH, 2012):
1 Assessing Regional Changes in Habitat (ARCH) funded through the European Interreg IV 2-Seas Project.

7Kent State of the Environment
• Direct loss of habitats: through increased development or other land uses, such as mineral extraction;
• Intensification of land management: such as use of chemical fertilisers and pesticides in farming, ploughing up of semi-natural grasslands, loss of traditional orchards;
• Lack of appropriate management: such as the loss of woodland management as the woodland resources become uneconomic to extract;
• Habitat fragmentation: species movement or migration is impaired and populations can become isolated, making them less able to survive or adapt to changing climate conditions;
• Invasion of non-native species: these can out-compete native species;
• Climate change: loss of land through sea-level rise, changes in temperature, weather and other environmental factors altering habitat composition and species movement and survival.
Some historical changes in habitat are recorded as (ARCH, 2012):
• Heathland: one of the county’s most rare and fragmented habitats. Around 74 hectares was recorded from a number of sites across the county, an increase on the 52 hectares recorded in 2003;
• Arable and grassland: the extent of land devoted to this type of use has declined very little, covering 60.4% of the county in 2008, a decline of less than 2% since 1990, and a gain of 1% from 1961;
• Orchards and hops: these have suffered the most dramatic decline, with more than two-thirds of the county’s resource from 1961 being lost by 2008;
• Development: land covered by development has increased from 10.7% in 1961 and 14.4% in 1990 to 17.3% in 2008, an increase of around 62% of the original source.
The county contains several nationally and internationally important habitats including:
• 105 Sites of Special Scientific Interest (SSSIs);
• 455 Local Wildlife Sites (LWS);
• 28 UK Biodiversity Action Plan (UKBAP) priority habitats;
• Biodiversity Opportunity Areas (BOAs) identified to enable appropriate land management and restoration.
In addition there are two Areas of Outstanding National Beauty (AONB), areas that are nationally significant and protected for their distinctive character and natural beauty, which is a result of the people, landscape, biodiversity and cultural heritage within those areas. Each AONB has a management plan through which the condition of those unique landscapes is monitored by specialist teams within the AONB units.
However AONBs are specific areas of landscape and there are on a broader and more cross-cutting level other landscape types. In 2007 the UK ratified the European Landscape Convention (ELC), which is sometimes referred to as the Florence Convention. Within it landscapes are defined as “an area as perceived by people whose character is the result of action and interaction of natural/or human factors”.
The ELC promotes the protection, management and planning of European landscapes and organises European co-operation on landscape issues in ways that recognise landscape diversity and the complex interplays of those cultural and natural factors that shape them.
In the UK landscapes are often understood through using a method called Landscape Character Assessment (LCA) which allows for the identification of key features that contribute to a particular character of any given landscape. In 2004 KCC carried out a LCA across Kent and Medway, the full results of which are presented in the KCC report “The Landscape Assessment of Kent (2004)”, a summary of conditions from that work is shown in Figure 1-1 (KCC, 2004). There have been subsequent LCA’s completed through individual districts and borough authorities but the picture is not complete for the whole of the county.
1.2 KENT DEMOGRAPHICS
Population has an impact on our natural and socio-economic environment through acting as a pressure on space and resources through requirements for housing, workspace and recreation, and on resources for food, water, health and associated infrastructure.
Aspects that are useful to consider are population density and future trends in population as these allow local and public authorities to plan for potential additional medium to long-term pressures on our environment and changes to services required.
1.0
Ove
rvie
w o
f Ken
t

8Kent State of the Environment
Figure 1-1 A summary map of landscape character conditions across Kent and Medway from a KCC county wide LCA.
1.0
Ove
rvie
w o
f Ken
t

9Kent State of the Environment
1.2.1 CURRENT STATE
Mid-year population estimates, based on Census data from the Office for National Statistics (ONS) show that Kent is the most populous County Council area in the Southeast region with 1,493,500 people (excluding Medway Unitary Authority). However, with a population density of 4.2 people per hectare, Kent is less densely populated that the regional average of 4.6 (KCC, 2014b).
Of the Kent local authority areas Maidstone has the largest population with 159,300 people and Dartford the smallest with 100,600 people (see Figure 1-2) but Dartford has the highest population density in Kent.
Figure 1-2 Population distribution across 12 local authority areas in Kent; population within the KCC area is 1,493,500 peoples.
1.2.2 POPULATION CHANGE ACROSS KENT
Between mid-2012 and mid-2013, Kent’s population grew by 13,300 (+0.9% increase). A key component of that change has been migration (people moving in or out of the area), and for 10 out of 12 local authority this was the main cause for increase in population. However, over the last seven years natural change, which is growth resulting from increased life expectancy and increase in number of births, has seen an increase (KCC, 2014b); see Figure 1-3.
Figure 1-3 Components of population change over the last twenty years across Kent.
1.0
Ove
rvie
w o
f Ken
t
10Kent State of the Environment
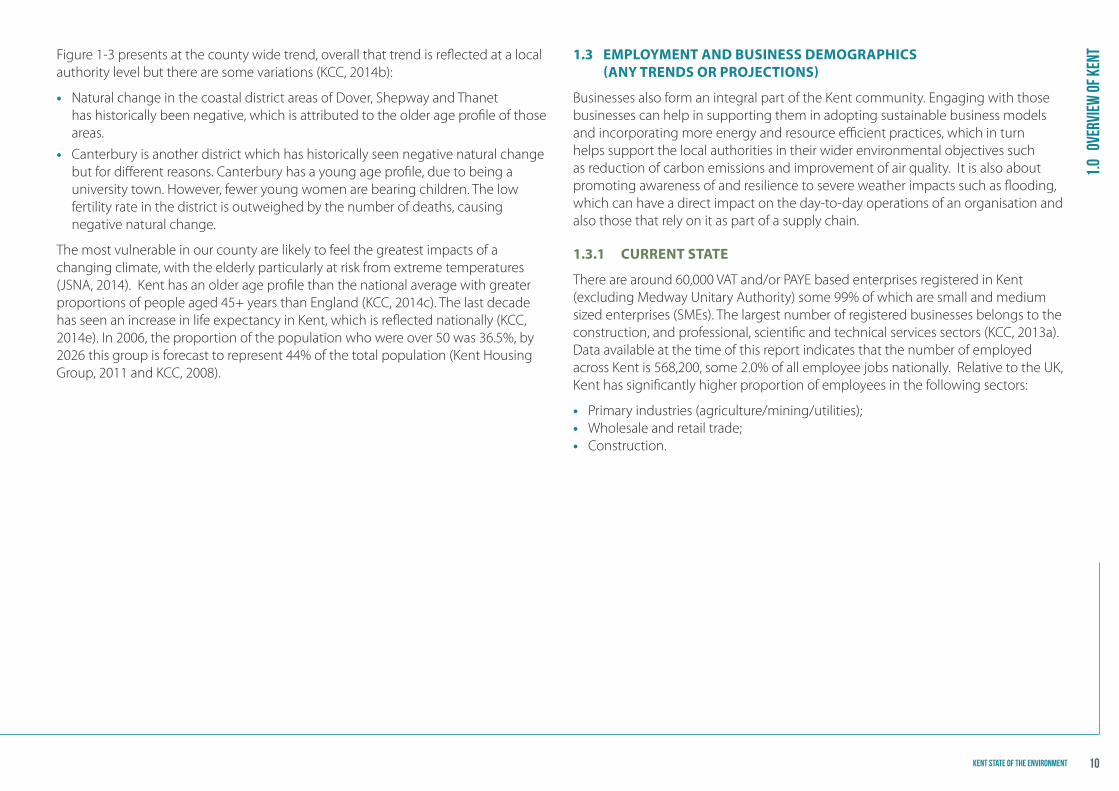
Figure 1-3 presents at the county wide trend, overall that trend is reflected at a local authority level but there are some variations (KCC, 2014b):
• Natural change in the coastal district areas of Dover, Shepway and Thanet has historically been negative, which is attributed to the older age profile of those areas.
• Canterbury is another district which has historically seen negative natural change but for different reasons. Canterbury has a young age profile, due to being a university town. However, fewer young women are bearing children. The low fertility rate in the district is outweighed by the number of deaths, causing negative natural change.
The most vulnerable in our county are likely to feel the greatest impacts of a changing climate, with the elderly particularly at risk from extreme temperatures (JSNA, 2014). Kent has an older age profile than the national average with greater proportions of people aged 45+ years than England (KCC, 2014c). The last decade has seen an increase in life expectancy in Kent, which is reflected nationally (KCC, 2014e). In 2006, the proportion of the population who were over 50 was 36.5%, by 2026 this group is forecast to represent 44% of the total population (Kent Housing Group, 2011 and KCC, 2008).
1.3 EMPLOYMENT AND BUSINESS DEMOGRAPHICS (ANY TRENDS OR PROJECTIONS)
Businesses also form an integral part of the Kent community. Engaging with those businesses can help in supporting them in adopting sustainable business models and incorporating more energy and resource efficient practices, which in turn helps support the local authorities in their wider environmental objectives such as reduction of carbon emissions and improvement of air quality. It is also about promoting awareness of and resilience to severe weather impacts such as flooding, which can have a direct impact on the day-to-day operations of an organisation and also those that rely on it as part of a supply chain.
1.3.1 CURRENT STATE
There are around 60,000 VAT and/or PAYE based enterprises registered in Kent (excluding Medway Unitary Authority) some 99% of which are small and medium sized enterprises (SMEs). The largest number of registered businesses belongs to the construction, and professional, scientific and technical services sectors (KCC, 2013a). Data available at the time of this report indicates that the number of employed across Kent is 568,200, some 2.0% of all employee jobs nationally. Relative to the UK, Kent has significantly higher proportion of employees in the following sectors:
• Primary industries (agriculture/mining/utilities);• Wholesale and retail trade;• Construction.
1.0
Ove
rvie
w o
f Ken
t

11Kent State of the Environment
Sectors where Kent has significantly lower proportions of employees compared to the rest of the UK are:
• Manufacturing;• Information and communication;• Financial and insurance activities;• Professional, scientific and technical activities.
Table 1-2 shows the change in number of employees across Kent between 2009 and 2013; there has been a decrease in employee numbers since 2010. The impact of job losses in Kent shows a similar pattern to that seen nationally, with job losses mainly in the construction (7,200), public administration and defence (6,600) and manufacturing (2,700) sectors. Sectors in Kent responsible for the majority of employee growth include: administrative and support service activities and wholesale and retail trade (KCC, 2014d), see Figure 1-4.
Table 1-2 Comparison of BRES1 data for Kent and other southeast groups
2009 2010 2011 2012 2013
Kent 565,000 574,500 573,800 561,200 568,200
Medway 83,400 83,700 80,800 85,900 84,000
Kent & Medway 648,300 658,200 654,600 647,100 652,300
South East LEP 1,481,300 1,478,300 1,476,500 1,474,200 1,485,600
South East (former GoSE region) 3,727,200 3,783,400 3,756,000 3,779,700 3,823,500
England 23,064,700 23,085,300 23,073,200 23,256,000 23,631,900
Great Britain 26,642,600 26,581,300 26,593,500 26,752,900 27,176,500
Figure 1-4 Percentage change across different UK SIC (2007) sectors for Kent based on BRES data.
1.0
Ove
rvie
w o
f Ken
t
2 Business Register and Employment Survey (BRES)

12Kent State of the Environment
1.4 CLIMATE (TRENDS IN RAINFALL, TEMPERATURE, AND SEA LEVEL)
By British standards the climate of Kent is continental, with warm, dry summers and cold winters. However, more recently, extreme weather events have become more frequent, with periods of very low temperatures, such as the winter of 2010/11, or extreme drought, such as that at the beginning of 2012, which resulted from two winters with below average rainfall. This drought was then followed by the wettest summer on record with 2012 as the second wettest year on record.
Although individual years do vary, the county as a whole is relatively dry, with an average annual rainfall of 600 to 850mm. The driest areas are along the north coast where the total may be less than 600mm, with the highest rainfall being associated with the ridges of the High Weald, Greensand and North Downs.
In certain areas water is very scarce, particularly in the summer months, with restrictions and licences to control abstractions from rivers and aquifers becoming increasingly necessary to protect wetlands and waterways such as the River Darent. In parts of Thanet, irrigation of crops is routinely carried out in dry periods, as surface and sub-surface aquifers are inadequate to sustain them. The opposite extreme is to be found in areas of the High Weald, where a combination of relatively high winter rains and impermeable soils increases the need for artificial drainage. At Bedgebury for example, in an average winter the difference between precipitation and the loss through evapo-transpiration is as high as 330mm.
The coastal areas of Kent are influenced by the maritime climate and rarely experience the hard frosts and extremes of heat and cold which occur inland. The highest shade temperature to be recorded for the county was 38.5°C at Faversham in 2003 and the lowest -20°C in Canterbury in 1947 (ARCH, 2012).
Table 1-3 Average climate conditions for Kent based on 1981-2010 data made available through the MetOffice and data from East Malling Climate Station.
Month Jan Feb Mar Apr May Jun Jul Aug Sep Oct Nov Dec
Mean high temp. (oC) 7.7 7.9 10.8 13.5 16.9 20 22.6 22.5 19.3 15.2 11 8.1
Mean low temp. (oC) 2.0 1.7 3.5 4.8 7.8 10.6 12.8 12.7 10.4 7.6 4.5 2.4
Mean rainfall (mm) 66.1 43.7 45.4 46.2 48.9 42.8 40.2 51.6 54.0 73.9 68.7 66.4
Mean number of rainfall days 12.1 9.1 9.8 9.3 9.2 7.8 7.3 7.1 8.0 10.6 11.1 11.0
Mean sunshine hours 59.6 76.1 113.9 170 205.4 207.2 217.8 211.3 148.8 116.9 72.9 51.0
1.0
Ove
rvie
w o
f Ken
t

13Kent State of the Environment
2.1 INTRODUCTION
Our climate is changing and evidence is increasing that there will be significant implications at global and local levels for our socio-economic and natural systems, as well as health and wellbeing of the population.
The Intergovernmental Panel on Climate Change (IPCC) latest report (IPPC, 2014) represents the most up to date and comprehensive assessment on climate change. Produced by hundreds of scientists, the report, published in 2014, carries a number of key messages that include:
• Human influence has been the dominant cause of observed warming since the mid-20th century (>95% confidence); natural variability and forcing have contributed little to that warming;
• The last 30 years have probably been the warmest over the last 1,400 years, and atmospheric concentrations of greenhouse gases (GHGs) such as carbon dioxide (CO
2), methane (CH
4) and nitrous oxide (N
2O) are the highest they have been for
the last 800,000 years;
• Without efforts to reduce our greenhouse (GHG) emissions, globally we can expect temperature increases of 3.7 to 4.8oC by the year 2100.
Consequently the globe is likely to see a number of changes to its climate and weather3 systems; the latest projections for the UK up to the year 2050 are summarised in Figure 2-1 based on the Meteorological Office’s UK Climate Projections 2009 (UKCP094).
Figure 2-1 Likely climatic changes the UK will experience up to the year 2050 based on the latest UK climate projections, UKCP09.
These changes, some of which we may experiencing already, will have impacts across many sections of our society, some of which are highlighted in Figure 2-25.
2.0 climate change
Win
ters
are
like
ly to
be
war
med
by
arou
nd
win
ter r
ainf
all i
s lik
ely
to
incr
ease
by
sum
mer
rain
fall
is li
kely
to
decr
ease
by:
sum
mer
s a
re li
kely
to b
e ho
tter
by
arou
nd
Sum
mer
nig
ht ti
me
tem
pera
ture
s ar
e lik
ely
to
incr
ease
by
The
hott
est s
umm
er d
ays
coul
d in
crea
se b
y up
to:
2.2oC
14%
24%
2.8oC 3.7oC3oC 2.0
clim
ate c
hang
e
3 Weather is what conditions of the atmosphere are over a short period of time, and climate is how the atmosphere "behaves" over relatively long periods of time,4 www.metoffice.gov.uk/services/climate-services/uk/ukcp5 Note: morbidity refers to the incidence of disease

14Kent State of the Environment
Environmental quality and conservation
• Air quality impacts• Water quality• Habitat loss• Altered breeding seasons, migration, species distribution
Agriculture, fisheries and forestry
• Crop production• Disease risk• Increases wood and bioenergy crop production• Decline in marine fish production
Health and social welfare
• Heat related mortality• Health and social care infrastructure• Mortality and morbidity impacts from flooding• Inequalities
Infrastructure • Flood risk (all types)• Insurance• Transport• Property
Figure 2-2 A summary of the sectors that will be affected by the projected climatic changes for the UK.
As part of its commitment to wider global and European efforts to reduce GHG emissions and prepare for change, such as the Kyoto Protocol and Europe 2020, the UK Government has passed or established a number key legislature and groups, see Table 2-1.
Table 2-1 Key UK legislature and groups established that are to deliver/support the delivery of GHG emissions reductions.
Legislation/organisation Comments
Climate Change Act (2008)
•• The Act legally binds the country to reduce its greenhouse gas emissions by 80% compared to 1990 levels by the year 2050; this will be implemented in a phased approach through interim targets of: 34% by 2020, 50% by 2025, 60% by 2030, and 80% by 2050.
•• As requirement of the Act has been to develop a Climate Change Risk Assessment, , the National Adaptation Programme has been developed to address climate change risks.
Local Adaptation Advisory Panel (LAAP)
•• Provide guidance and advice to central government on implementation of adaptation activity within local authorities. It also informs the National Adaptation Programme.
Carbon Reduction Commitment Energy Efficiency Scheme (CRC Scheme)
•• The CRC Energy Efficiency Scheme (CRC Scheme) is designed to improve energy efficiency and cut emissions in large public and private sector organisations.
•• Organisations that have half-hourly metered electricity consumption greater than 6,000 MWh per year are required to monitor their energy use, and report their energy supplies annually to the Department of Energy and Climate Change (DECC); this includes Kent County Council estates and operations.
2.0
clim
ate c
hang
e

15Kent State of the Environment
Through the UK’s National Greenhouse Gas inventory, local and regional carbon dioxide (CO
2) emissions estimates from 2005 are produced in order to provide a
nationally consistent evidence base for use in tracking carbon reduction policy. The estimates are available through DECC and can be used in identifying energy intensive sectors, monitor changes in CO
2 emissions and assist in designing carbon
strategies (DECC, 2014b).
The emissions data are estimates based on a four main sources:
• DECC sub-national gas and electricity consumption statistics;
• Point source emissions from large industrial installations;
• High resolution emissions distribution maps developed under the National Atmospheric E missions Inventory (NAEI) programme;
• Land use, land use change and forestry (LULUCF) regional data supplied by the Centre of Ecology and Hydrology.
The full methodology is available through the following report: Local and Regional Carbon Dioxide Emissions Estimates for 2005-2012 for the UK, Technical Report, Ricardo-AEA (DECC, 2014b).
2.2 VISION FOR KENT
The Kent Environment Strategy is supported by Climate Local Kent, a commitment signed by a number of partners across Kent. As part of that commitment partners have agreed to work towards cutting CO
2 emissions by 2.6% annually in Kent by
2020 which will see an overall reduction of 34% in those emissions.
2.3 INDICATORS
Table 2-2 The indicator relating to climate change currently within the KES and CLK commitment
Indicator Commentary Data collection Objective
Emissions of greenhouse gases (tonnes/year)
Anthropogenic CO2 is
a key driver for global temperature increases
We have a national and local commitment to reduce our CO
2 emissions
DECC statistics for industrial and commercial, domestic and transport sectors
34% reduction by 2020 (2.6% reduction per year) for the whole of Kent across all sectors
2.4 CURRENT STATE OF PLAY IN KENT
Estimates on emissions of carbon dioxide (CO2) across local authority areas are available from DECC for 2005 to 2012. Data at a local level are not consistent for years previous to 2005 and so are not provided by DECC; 2005 has been used as the baseline year for this report.
Across Kent, excluding the Medway Unitary Authority area, the largest portion of CO
2 emissions are attributable to the Industrial and Commercial sector (36%)
followed by Transport and Domestic sectors with 33% and 31% of estimated emissions respectively.
Overall, emissions have shown a reduction of 21% (2,831kt) since 2005, see Figure 2-3. With the exception of 2006, 2010 and 2012 year on year emissions has met our target reduction of 2.6%.
2.0
clim
ate c
hang
e

16Kent State of the Environment
Figure 2-3 CO2 emissions profile for Kent; these data are a combination of estimated emissions for
the industrial and commercial, transport and domestic sectors. Note: kt refers to Kilotons
Much of the reduction seen in Figure 2-4 comes from the Industrial and Commercial sector. Between 2008 and 2009 alone that sector saw a reduction of 1,159kt CO
2
compared to 312kt and 128kt for the Domestic and Transport sectors respectively. Dover and Swale authorities also saw relatively high reductions in CO2 during 2008-2009 of 201kt (52%) and 177kt (16%) respectively. During 2006 and 2009 some local authority areas, such as Gravesham and Dartford, saw old industrial sites/machinery removed, demolished or redeveloped which may explain the large reduction. (GBC, 2013 and KCC, 2011).
Figure 2-4 A Sectorial breakdown of CO2 emissions for Kent
All sectors have shown an overall reducing trend. However, there was an increase in emissions from 2009-2010 from both the Industrial and Commercial and Transport sectors.
The latest data from 2012 shows that CO2 emissions increased by <1% from 2011
levels, which is equivalent to 0.59kt of CO2. Looking at the sectorial breakdown it
would seem that the increases are coming from the domestic and transport sector. DECC report that across all local authorities in England and Wales domestic sector consumption of gas was higher in 2012 than 2011 which is attributed to 2012 being a colder year than 2011 and resulted in an increase use of coal for electricity generation.
2.0
clim
ate c
hang
e

17Kent State of the Environment
2.5 SEVERE WEATHER EVENTS
2.5.1 INTRODUCTION
A key consequence of a changing climate change is extreme weather events and their associated impacts; the UK including Kent is likely to experience an increased frequency and level of risk from the following severe weather events:
• More ‘very hot’ days – what are currently considered extreme will likely prove to be average in 30 years;
• More intense downpours of rain leading to increased flooding risk, particularly surface flooding;
• Increased risk of coastal flooding.
In 2009, Kent County Council (KCC) carried out a Local Climate Impacts Profile (LCLIP) to assess the vulnerability of Kent’s services (and community) to past severe weather events over a 14 year period. The study revealed severe weather has had a heavy impact on our services and community socially, economically and environmentally, with severe weather directly costing Kent services £35 million over the 14 year period and a further £428 million in additional costs (KCC, 2009).
The Severe Weather Impacts Monitoring System (SWIMS) was developed by KCC so that data about how the services provided by Kent Partners (including Kent County Council, Kent Police, district and borough councils and the Environment Agency) are affected during severe weather events could be captured.
Through use of the system Kent partners can build up a picture of their vulnerability to severe weather and develop business cases for taking appropriate action. The type of information and data recorded is listed below:
• Details about how a service and service users have been affected;• Information on how they have responded to an event, both in the immediate
aftermath of the event and any longer-term responses;• Generate a report to show how their organisation has been affected by severe
weather;
• Share data with other organisations to identify common barriers and areas of vulnerability;
• Share best practice, expertise and lessons learnt;
• Support business cases for resilience actions.
2.5.2 INDICATORS
Table 2-3 Key indicators relating to severe weather currently within the KES
Indicator Commentary How will we measure
Objective
Number of severe weather events
This data allows local and public authorities to understand the impact of these weather events and to manage and plan better for the future.
SWIMS tool There are no specific targets as this is a monitoring tool.Cost of impacts
2.5.3 CURRENT STATE OF PLAY
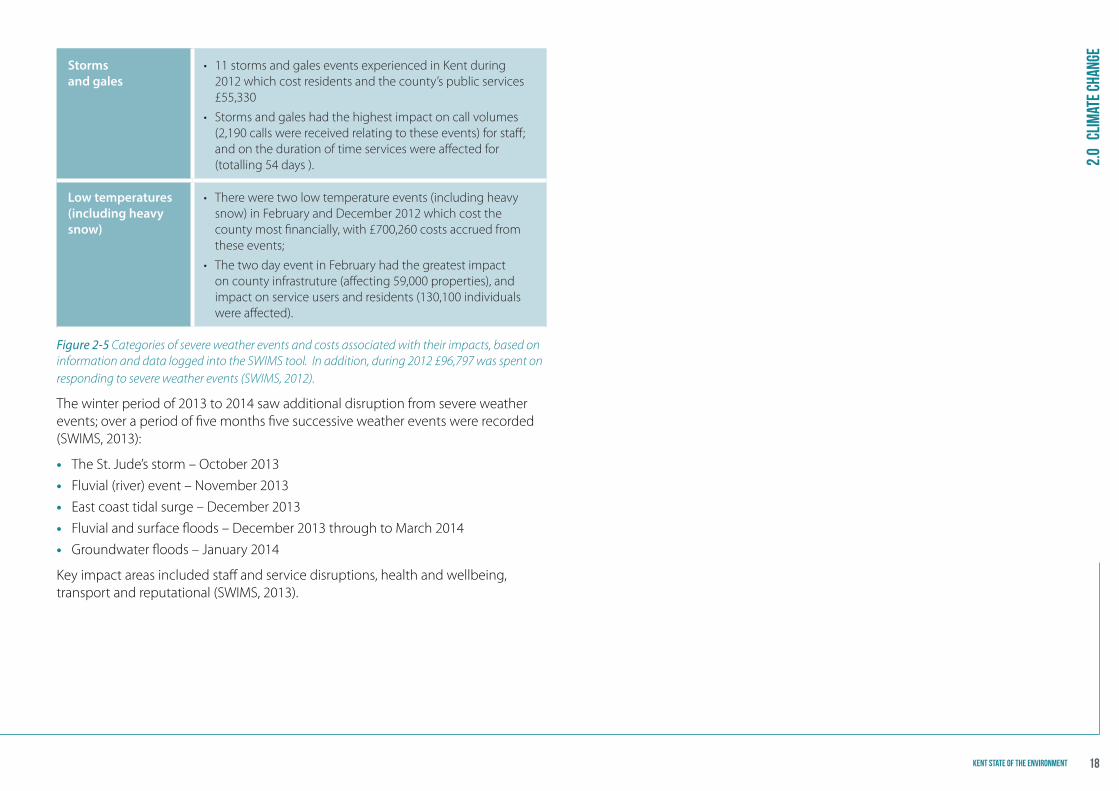
As of May 2014, 118 users were registered on SWIMS representing over 100 services and 35 organisations across Kent. During 2012, 14 severe weather events were logged and over 90 impacts and responses were captured. The direct financial impact from these events on county services and the wider Kent community totalled £852,387.95 with wider implications on staff time, service delivery, and reputation and in some cases the structural integrity of buildings and other infrastructure, see Figure 2-5 for a summary of those events (SWIMS, 2012).
2.0
clim
ate c
hang
e
18Kent State of the Environment
Storms and gales
• 11 storms and gales events experienced in Kent during 2012 which cost residents and the county’s public services £55,330
• Storms and gales had the highest impact on call volumes (2,190 calls were received relating to these events) for staff; and on the duration of time services were affected for (totalling 54 days ).
Low temperatures (including heavy snow)
• There were two low temperature events (including heavy snow) in February and December 2012 which cost the county most financially, with £700,260 costs accrued from these events;
• The two day event in February had the greatest impact on county infrastruture (affecting 59,000 properties), and impact on service users and residents (130,100 individuals were affected).
Figure 2-5 Categories of severe weather events and costs associated with their impacts, based on information and data logged into the SWIMS tool. In addition, during 2012 £96,797 was spent on responding to severe weather events (SWIMS, 2012).
The winter period of 2013 to 2014 saw additional disruption from severe weather events; over a period of five months five successive weather events were recorded (SWIMS, 2013):
• The St. Jude’s storm – October 2013
• Fluvial (river) event – November 2013
• East coast tidal surge – December 2013
• Fluvial and surface floods – December 2013 through to March 2014
• Groundwater floods – January 2014
Key impact areas included staff and service disruptions, health and wellbeing, transport and reputational (SWIMS, 2013).
2.0
clim
ate c
hang
e

19Kent State of the Environment
3.0 Air quality3.1 INTRODUCTION
Air pollution can cause both short and long term effects on health. Some air pollutants such as sulphur dioxide (SO
2), lead (Pb) and carbon monoxide (CO) are no
longer a major concern for the much of the UK. However, particulate matter (PM), oxides of nitrogen (NOx), and ozone (O
3) are, and are still a cause of negative health
effects.
It has been estimated that poor air quality causes up to 50,000 deaths per year and probably causes more mortality and morbidity than passive smoking, road traffic accidents or obesity. The financial burdens of the health impacts in the UK are considerable. In 2005, estimates for anthropogenic induced particulate pollution alone in the UK were £8.5-£20.2 billion a year (Defra Air Quality Strategy, 2007). This is likely to be an under-estimate as it ignores the impact on morbidity, costing only mortality.
There are also additional costs to the NHS from respiratory hospital admissions triggered by air pollution. For example, in 2007 to 2008, there were over 74,000 emergency admissions to hospital because of asthma. There are clear links between asthma and air quality; Asthma UK estimate the annual cost of asthma to society at £2.3 billion (EAC, March 2001).
Elimination of anthropogenic induced particulates has been estimated to show a gain in life expectancy of 7-8 months compared to only 1-3 months for the elimination of road traffic accidents or 2-3 months for passive smoking (Table 3-1: EPUK, 2011).
Table 3-1 Comparison of the benefits of reducing PM2.5
by 10µg/m3 (equivalent to eliminating anthropogenic PM
2.5 in 2005), the elimination of motor vehicle traffic accidents and the elimination
of exposure to passive smoking
Reduction in PM2.5
Elimination of road traffic accidents
Elimination of passive smoking
Expected gain in life expectancy 7-8 months 1-3 months 2-3 months
Estimated equivalent gain in life years in England and Wales from 2005-2110 for the whole population (including people born that time)
39,058,000 8,126,000 13,194,000
Studies (Defra, 2006 and Shaleen Sutaria 2010) show that in the UK the deprived communities are generally located in inner urban areas, where the air quality is generally poorer.
Local Authorities in the UK have a duty under the Local Air Quality Management (LAQM) legislation6 to review and assess air quality. Where levels exceed national objectives, measures should be put in place to reduce emissions and be reported in a local Air Quality Action Plan. Measures might include traffic management, encouraging uptake of cleaner vehicles and increasing use of public transport and promotion of sustainable travel options.
Kent’s position between London and the continent brings health challenges associated with its unique pollution profile. As a gateway to the continent Kent & Medway’s extensive transport network and carries a disproportionately large number of HGVs, with their associated carcinogenic diesel emissions. This cross channel traffic is continuing to increase. Around the Kent coast and ports shipping brings additional impacts from the use of marine diesel.
Even away from local urban and traffic sources, pollution impacts on the population. Easterly winds can bring pollution from continental sources, which affect the whole of Kent, raising levels of particulate and/or ozone. Winds from the opposite direction can bring London’s urban pollution plume drifting across western Kent (JSNA, 2014).
3.0
Air
qua
lity
6 Part IV of the Environment Act 1995

20Kent State of the Environment
In 2013 a new estimate of 1,050 early deaths as a result of just PM2.5
air pollution across Kent & Medway in 2011 was calculated by the KMAQP Health Sub Group. This was using the methods recommended in the statement (August 2012) ‘Estimating the mortality burden of particulate air pollution at the local level’ from the Committee on the Medical Effects of Air Pollutants (COMEAP), the Government’s official advisory panel.
0
2
4
6
8
10
12
0
20
40
60
80
100
120
140
PM2.5 ug/m
3
Deaths
Deaths Background Mean PM2.5
Figure 3-1 A chart showing early deaths from PM2.5
in 2011 in different districts and number of PM
2.5 which shows an approximate correlation.
It should be noted that Figure 3-1 shows the estimated number of deaths attributable to particulate matter but this is a combination of the impact of particulate pollution and population size. Figure 3-2 below accounts for the population size. The two representations of the same data require careful interpretation, if meaningful strategic and policy decisions are to be made.
0.00
2.00
4.00
6.00
8.00
10.00
12.00
0
10
20
30
40
50
60
70
80
90
100 PM
2.5 ug/m3
Deaths
Deaths Background Mean PM2.5
Figure 3-2 A chart showing of early deaths from PM2.5
in 2011 taking into account population levels (deaths per 100,000 population) in different districts and amounts of PM
2.5, an approximate
correlation is shown.
Additional deaths would have occurred from other pollutants as well but these calculations were not completed at the time of this report. The estimate is likely to be on the low side since it is based on background levels and does not take into account the higher population densities in urban areas where exposure to higher levels of pollution is experienced. The growing concern as to the impact of air pollution on the health of the population is reflected in the increasing estimates of attributed deaths as new evidence becomes available.
Despite the focus for most Local Authority work resting with oxides of nitrogen (under the direction of LAQM and prospective financial burden), the Public Health Outcomes Framework (PHOF) is the first government directed document indicating that our partnership working must look at the broader remit of air quality and public health, redirecting our focus to particulates.
3.0
Air
qua
lity

21Kent State of the Environment
3.2 VISION FOR KENT
The KMAQP is a network funded by the district and borough councils within the county, with an additional contribution from Kent County Council. The aims of the network are to promote the improvement of air quality within the region, help local authorities to meet their obligations under Environmental Regulations and maintain an accessible database of robust measurements for public reporting, research and development (Ricardo-AEA, 2013).
The 2010 Marmot Strategic Review of Health Inequalities in England – Fair Society Healthy Lives provided key information for the vision of Public Health England’s Public Health Observatory Framework (PHOF). The technical guidance for the PHOF consists of four domains measured by 66 factors. The two domains that overlap directly with the work of the KMAQP are: domains three Health Protection (specifically 3.01 Air Pollution using PM 2.5 as an indicator pollutant) and domain four Healthcare and Premature Mortality (specifically 4.03, 4.04 and 4.07) (Public Health England).
Table 3-2 The six key pollutants monitored by the KMAQP and their associated health and environmental impacts.
Pollutant Health effects Environmental effects Air quality objective
Particulate matter (PM
2.5,
PM10
and secondary PM)
Short and long term exposure can worsen respiratory and cardiovascular illness and increase mortality
Secondary PM includes sulphate, nitrate and ammonium, formed from SO2 and NOX and NH3, which are the main drivers for acidification and eutrophication7.
Black carbon, a potent short-lived climate forcing agent, is a key part of the particulate matter mix, resulting from combustion.
PM10
not to exceed 50µgm-3 more than 35 times a year.
Annual mean of 40µgm-3
PM2.5
average of 25µgm-3 by 2020.
Nitrogen oxides (NOx – made up of NO and NO
2)
Can cause inflammation of the airways, affect lung function and respiratory symptoms.
Involved in formation of PM and ozone. The effects of long term exposure are less certain than the effects of short term exposure.
Contribute to acidification and eutrophication of terrestrial and aquatic ecosystems, damaging habitats and leading to biodiversity loss.
NO2 not to exceed
200µgm-3 more than 18 times a year.
Annual mean of 40µgm-3
3.0
Air
qua
lity
7 Eutrophication: where a water body has received excess concentrations of nutrients (e.g. phosphates and nitrates) which has caused excessive algae growth and eventual depletion of the waters oxygen due to their decomposition and generation of organic matter.

22Kent State of the Environment
Pollutant Health effects Environmental effects Air quality objective
Ozone (O3) Can damage airways
and reduce lung function.
Increases incidence of respiratory symptoms and additional chronic obstructive pulmonary disease (COPD) related hospital admissions.
Can cause damage to plants, leading to yield loss and impact on biodiversity. Ozone is also a greenhouse gas.
Not to exceed 100µgm-3 more than 10 times a year
Sulphur dioxide (SO
2)
Not to exceed 266µgm-3 more than 35 times a year
Lead (pb) Not to exceed an annual mean of 0.25µgm-3
Carbon monoxide (CO)
Maximum daily running 8-hour mean of 10 mgm-3
3.3 INDICATORS
Table 3-3 Key indicators relating to air quality currently within the KES
Indicator Commentary How will we measure
Goal (target)
Concentration of pollutants
Local authorities have a legal duty to review and assess air quality on an ongoing basis against a set of health based objectives.
Local monitoring stations that exist across Kent through the Kent and Medway Air Quality Network. Levels reported by the KMAQP.
See Table 3-1
Number of days of moderate or higher air pollution
3.4 CURRENT STATE OF PLAY IN KENT
The KMAQP provides strategic direction and support across the county. The monitoring network was formed in 1992 to assist the partnership, and ensure a coordinated approach to air quality monitoring and reporting across the county.
All twelve Kent local district authorities and Medway Unitary Authority are required to review and assess air quality in their areas on an on-going basis. Where air pollutants concentrations are found to exceed the objectives set by the government, Air Quality Management Areas (AQMA’s) are declared. Districts then develop Air Quality Action Plans with their partners to work towards achieving those objectives. There are currently 40 air quality management areas across Kent, which are highlighted in Figure 3-3 (JSNA, 2014).
3.0
Air
qua
lity

23Kent State of the Environment
Figure 3-3 40 sites across Kent that have been assigned as air quality management areas
3.0
Air
qua
lity

24Kent State of the Environment
Figure 3-4 Locations of monitoring sites in operation across Kent in 2013. See Ricardo-AEA (2013) for a full list of monitoring stations 1 to 25
3.0
Air
qua
lity

25Kent State of the Environment
Overall, air quality targets for 2013 are reported to have been met. There are some exceptions with nitrogen dioxide (NO
2) and ozone (O
3) levels, which are summarised
in the Table 3-3 below. All sites met the carbon monoxide (CO) and sulphur dioxide (SO
2) objectives (Ricardo-AEA, 2013).
Table 3-4 Sites that failed against criteria described in section 3.2
Location Pollutants Reason for failure
Rochester Stoke O3
Daily maximum 8-hour running mean >100µgm-3 on more than 10 days
Maidstone Rural O3
Canterbury St Peter’s Place NO2
Annual mean of >40µgm-3
Dartford Bean Interchange Roadside NO2
Dartford St Clements Roadside NO2
Dartford Town Centre Roadside NO2
Maidstone A229 Kerbside NO2
Swale Canterbury Road NO2
Tonbridge Roadside 2 NO2
Tunbridge Wells A26 Roadside NO2
Table 3-5 A summary of the trends observed between 1997 and 2013 for levels of NO2, O
3, CO and
SO2; see Ricardo-AEA (2013) for list of station names.
Pollutant Comment
Carbon monoxide (CO)
Concentrations of CO have remained below the EU Air Quality Directive limit value for 15 years. A decreasing trend started in 1998, but was broken by an increase during 2011. Concentrations have decreased again since 2012.
Ozone (O3): Overall, O
3 remained relatively stable with increases seen at several
site whilst there were reductions at others. Increases were seen at four roadside sites and one background site.
Particulate matter, 10 micrometres (PM
10)
During 2013 rolling annual means for PM10
decreased at several sites, continuing the reduction seen in 2012. Concentrations of particulate matter were higher at roadside sites than at background sites because of the impacts of road traffic. Concentrations are also affected by trans-boundary transport of particulates and weather conditions; for example westerly winds often bring cleaner air (and often wet weather) from the west and are often associated with lower concentrations of particulate pollution.
Particulate matter, 2.5 micrometres (PM
2.5)
Levels of PM2.5
appear to have increased at the Rochester Stoke site and are now higher than at Chatham Centre Roadside. However, the dataset is fragmented and trends are therefore difficult to define.
In general, air quality is heavily influenced by prevailing meteorological conditions. Unless there are large changes in the sources then a long-term trend in pollution levels can be difficult to identify amongst short-term variation in pollutant concentrations. Settled conditions in winter, for instance, frequently lead to higher annual average NO
2 or PM
10 concentrations, whereas hot, sunny weather in summer
gives higher ozone concentrations.
3.0
Air
qua
lity

26Kent State of the Environment
4.0 Water quality
4.0
Wat
er q
ualit
y
4.1 INTRODUCTION
Water quality is important for public health and biodiversity. Much of the management and protection of our rivers, lakes and coastal waters is governed by the European Union’s Water Framework Directive (EU WFD) which states that each EU member:
• must reach “good water body status” by 2015, and
• cannot allow water body standards to decrease.
The Environment Agency is responsible for monitoring and reporting on the objectives of the Water Framework Directive (WFD) on behalf of Central Government. They work in collaboration with Central Government, Ofwat, local government, non-governmental organisations (NGOs) and a wide range of other stakeholders including local businesses, water companies, industry and farmers to manage water by monitoring and delivering on the WFD objectives.
The types of aspects that can impact water quality include pollution, river flow levels, negative effects of invasive species and physical modifications to the water-body. Physical modifications can affect the quantity and quality of water and the shape of water bodies. This affects their flows and physical form, altering habitats for wildlife and reducing habitat diversity. Through criteria established by the WFD, water bodies are assigned a status of High, Good, Moderate, Poor or Bad which takes into account their chemical and ecological state (which incorporates physio-chemical and biological condition, specific pollutants and hydromorphology).
Currently across England, only 27% of our water bodies meet a “good status” when measured against WFD criteria. The rivers that do pass water quality standards tend to be smaller tributaries with no waste water discharges and a good supply of base flow from groundwater. The poorer the quality of the water the more expensive it is to treat. In addition, it can have negative impacts on the biodiversity and business that rely on those water systems (DEFRA, 2013).
4.2 VISION FOR KENT
There are a number of directives that apply to water quality across England and Wales; discussed in this report and applicable to the Kent Environment Strategy (KES) are ones that have a direct impact on our natural environment.
Water Framework Directive (WFD): The Environment Agency have developed ten River Basin Management Plans (RBMPs) for England and Wales that establish the main issues that exist for the water systems in those areas and sets out measures required to address these. Kent and Medway come under the RBMP for the South East River Basin District and the Thames River Basin District. They include a number of actions that the Environment Agency, working with a number of sectors and organisations, shall deliver in order to improve the water environment.
Bathing Water Directive 2006/7/EC: DEFRA has overall responsibility for this Directive and the Environment Agency has administration responsibilities which include monitoring and working with organisations to identify and improve on any failures or issues. The main objective of the Directive is to protect public health and the environment from faecal pollution at bathing waters. Bathing waters themselves are classified as excellent, good, sufficient or poor. Under amendments for 2015/2016 to the Bathing Water Directive there will be a requirement for information about water quality to be available to the public. From 2016 the classification of the water quality will have to be displayed using standard signage set out in the Directive. This will be the responsibility of the local district/borough authority using information and data provided by the Environment Agency.
Shellfish Waters: This used to be a separate directive but is now incorporated within the WFD as shellfish protected areas. The objective is to support shellfish life and growth, therefore contributing to the quality of those waters.

27Kent State of the Environment
Figure 4-1 WFD ecological status of rivers, transitional waters and coastal areas for Kent and Medway- Environment Agency
4.0
Wat
er q
ualit
y

28Kent State of the Environment
4.3 INDICATORS
The following indicators have been selected as they have a direct impact on our natural environment.
Table 4-1 Key indicators relating to water quality that are currently monitored by DEFRA and the Environment Agency and proposed for inclusion in the KES (as indicators)
Indicator Commentary How will we measure
Objective
Water framework directive – status of water bodies
This applies to rivers, lakes, coastal waters and ground water.
Monitoring data through the Environment Agency
WFD “good” status for surface waters (rivers, lakes, estuaries and coastal waters), and groundwater by 2015
Bathing water quality
This is an important indicator as it not only indirectly lends information on water quality but can also have an impact on the local economy through tourism.
Monitoring data through the Environment Agency
Shellfish water quality
Plant and animal communities provide a key indicator in assessing water environments. This indicator can also be important for areas where shellfish are used for consumption.
Monitoring data through the Environment Agency
4.4 CURRENT STATE OF PLAY IN KENT
Figure 4-1shows the WFD ecological status for rivers and transitional waters8 in Kent and Medway. Most rivers are shown as “poor”, with two shown as “bad” which are for the Sarre Penn north-east of Canterbury, and the River Beult west of Ashford. Parts of the river Medway, near Tonbridge, and the Teise are shown as “good”. Coastal areas all come under a ‘moderate’ status.
The majority of failures of water bodies across Kent are attributable to physical modifications and pollution from waste water, with negative effects of invasive species being the least cause. The chart in Figure 4-2 shows the number of failures across all 131 Kent and Medway water bodies monitored by the Environment Agency.
Figure 4-2 Numbers and types of failures across all water bodies monitored by the Environment Agency for Kent and Medway (Source: personal communication with the Environment Agency, 2014).
Figure 4-3 highlights the areas that are mandatory and guideline sites for testing to the Bathing Water Directive across Kent. The guidelines for testing criteria are changing, and the Figure shows projected classifications based on 2011-2014 monitoring data. Twenty-nine sites are listed, most of which meet the “excellent criteria” but with one site at Walpole Bay in Thanet classified as “poor”. That particular
4.0
Wat
er q
ualit
y
8 Fjords, estuaries and can also include river mouths.

29Kent State of the Environment
site has in previous years met the required standards, but will not be able to do so for the coming ones.
Figure 4-3 also highlights areas designated as shellfish waters, which are in the north and east part of Kent, and the Outer Thames area. With regard to mandatory testing all eight areas meet the “pass” requirements for 2013. There are also guideline
standards relating to faecal coliform flesh standards, in which only three of those eight sites meet a “pass”. The areas that failed the extra guidelines are: Southend, Swale Central, Margate, Whitstable and Swale East. Those sites that passed are: Sheppey, Outer Thames and the Stour Estuary.
4.0
Wat
er q
ualit
y
Figure 4-3 Combined map showing projected Bathing Water Directive status for Kent and Medway, and status of those areas designated as Shellfish Waters through the WFD. (Source: personal communication with the Environment Agency, 2014).

30Kent State of the Environment
5.0 Flood Risk
5.0
Flo
od R
isk
5.1 INTRODUCTION
Flooding is an excess of water where it is not normally found, often caused by natural weather events such as heavy rainfall and thunderstorms, prolonged and extensive rainfall, and high tides combined with stormy conditions.
Kent is at risk from a range of flood types: coastal, river (fluvial), surface water, groundwater and sewer flooding. Climate change is likely to increase the frequency and severity of natural weather events, which may increase the risk of flooding. Other factors may also contribute to the risk of flooding, including maintenance of infrastructure such as sewer networks and inappropriate development in flood plains9.
Flood risk is managed through a number of flood management plans, these are listed below:
• Catchment Flood Management Plans (CFMPs): these consider all types of inland flooding from river, groundwater, surface water and tidal flooding and take into account the likely impacts of climate change, the effects of how we use and manage the land and how areas could be developed to meet our present day needs without compromising the ability of future generations to meet their own needs.
• Shoreline Management Plans (SMPs): considers coastal flooding and coastal erosion.
• Local Flood Risk Management Strategy: this sets out how local flood risks (flooding from surface water, groundwater and ordinary watercourses) will be managed in the county, who will deliver the strategy and how it will be funded.
The Environment Agency is also currently consulting on Flood Risk Management Plans (FRMPs), which set out the plans to manage all forms of flooding in a river basin. These will be published in 2015.
Table 5-1 risk management authorities10 who are responsible for flooding in Kent
Organisation Roles and functions Relevant strategy/policy
Environment Agency
•• The Environment Agency has a strategic overview role in flood and coastal erosion risk.
•• Its functions include bringing forward flood defence schemes, and it will work with lead local flood authorities and local communities to shape schemes which respond to local priorities.
Catchment Flood Management Plans (CFMP)11
Kent County Council
Lead local flood authorities have a strategic overview role for local flooding (surface water, groundwater and ordinary watercourses and a lead on community recovery) and some flood risk management powers and duties. These include:
•• Duty to investigate flooding;
•• Duty to maintain a register of significant structures and features; and
•• Powers to regulate ordinary watercourses.
Local Flood Risk Management Strategy for Kent
Internal Drainage Boards (IDBs)
IDBs manage ordinary watercourses and water levels within their district. They have powers to undertake works on ordinary watercourses and to enforce the management of ordinary watercourses on private land.
District and borough councils
They have powers to adopt and maintain ordinary watercourses within their district, and may also have responsibility for managing the risk of coastal erosion, if they have a coastline. As a coastal authority they would have a responsibility for planning coastal erosion risk management schemes, and contributing to shoreline management plans.
•• Planning local flood risk management and can carry out flood risk management works on minor watercourses, working with Lead Local Flood Authorities.
•• Development of shoreline management plans (SMPs).
9 www.environmentlaw.org.uk/rte.asp?id=9910 Other authorities include: internal drainage boards, water companies and highway authorities11 Kent and Medway come under two river basin districts, and consequently two CFMPs - the South East and Thames.

31Kent State of the Environment
5.2 VISION FOR KENT
The Local Flood Risk Strategy12 for Kent provides a framework for delivering local flood risk management, and Kent County Council (KCC) is the lead local authority responsible for this. Three key factors that the local strategy covers for Kent are:
• Knowing where flooding may occur and what circumstances may cause such flooding;
• Taking reasonable steps to reduce the likelihood of this flooding happening;
• Adapting to the risks and acting to reduce the risk to life, damage and disruption caused by flooding.
5.3 INDICATORS
Table 5-2 Key indicators relating to flooding in Kent, the number of properties are currently reported in the KES monitoring reports.
Indicator Commentary How will we measure
Objective
Number of properties at risk of flooding
This is for domestic and non-domestic properties. Flooding types are fluvial and tidal only.
Provided by the National Flood Risk Assessment (NaFRA)
This is currently to be confirmed, it is dependent on funding
Number of properties protected from new schemes
Environment Agency data
No information at the time of this report
Number of people signed up to Floodline Direct
Environment Agency data
No information at the time of this report
5.4 CURRENT STATE OF PLAY IN KENT
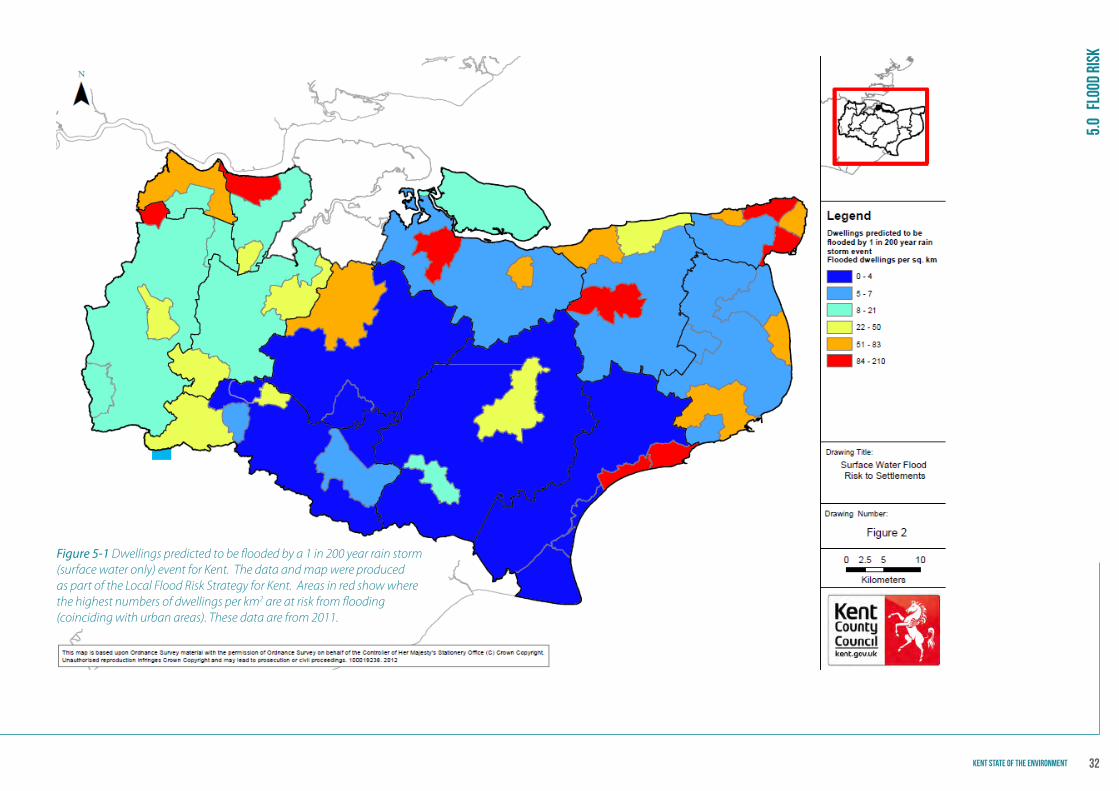
Kent has one of the highest surface water flood risks of any Lead Local Flood Authority (LLFA) in England. In 2011 Kent undertook a preliminary flood risk assessment that found that surface water flooding is estimated to affect approximately 76,000 properties, of which 60,000 are residential, estimated to include 140,000 people at risk. See Table 5-3 and Figure 5-1.
Table 5-3 Estimated number of properties at risk of surface water flooding highlighting that a particularly high number of properties are at risk in Kent.
LLFA Estimated number of properties at risk of surface water flooding
Kent 75,800
Essex 54,400
Hertfordshire 53,000
Devon 50,000
Hampshire 46,600
Notes:1: LLFA: Lead Local Flood Authority2: These estimates are for flooding to a depth of 0.3m from an event with a 1 in 200 annual chance of occurring.
Through the National Flood Risk Assessment (NaFRA) the numbers of properties at risk from tidal and fluvial flooding has been estimated to be 60,000 of which 38,000 are currently benefiting from flood defences. The map shown in Figure 5-2 highlights the risk of flooding in any given year in Kent and is based on probability bands of: high (1 in 30), Medium (1 in 100), Low (1 in 1000) and Very Low (less than 1 in 1000).
Residents and businesses across England and Wales are able to sign up to Floodline Warnings Direct13, which is a free service providing flood warnings by telephone, text message or email. Table 5-4 highlights the number of registrations to the system over the last three years. An increase in numbers is seen to have occurred between 2013 and 2014 which has been associated with the flooding that the County experienced during that period. During the period of 2012 to 2013, the Environment Agency updated their Flood Warning Areas to the latest modelling
5.0
Flo
od R
isk
12 www.kent.gov.uk/about-the-council/strategies-and-policies/environment-waste-and-planning-policies/flooding-and-drainage-policies/kent-flood-risk-management-plan13 https://fwd.environment-agency.gov.uk/app/olr/home
32Kent State of the Environment
5.0
Flo
od R
isk
Figure 5-1 Dwellings predicted to be flooded by a 1 in 200 year rain storm (surface water only) event for Kent. The data and map were produced as part of the Local Flood Risk Strategy for Kent. Areas in red show where the highest numbers of dwellings per km2 are at risk from flooding (coinciding with urban areas). These data are from 2011.

33Kent State of the Environment
data, which tends to reduce the number of properties shown as at risk. If any of those customers were registered to the flood warning services they may have been removed with the update, this then would show as a reduction in numbers registered.
Table 5-4 Numbers registered to Floodline Warnings Direct which is, updated annually on the first of December
Period Numbers of registrations(Kent and Medway)
1/12/2012 54,050
1/12/2013 52,117
1/12/2014 55,750
The NaFRA has also considered the types of infrastructure that are at risk of flooding, for Kent and Medway the most at risk are major roads, electricity infrastructure and police stations, see Figure 5-3. This data focuses on infrastructure, it does not take into types of service delivery and so it is important to consider that whilst ambulance stations, fire stations and community centres may be low in Figure 5-3, their service delivery may be impinged upon due to disruption to the infrastructure network – refer to Section 2.5 on severe weather.
Figure 5-3 Types of infrastructure that are at risk in those areas highlighted in Figure 5-2 (Nafra, 2009)
5.0
Flo
od R
isk

34Kent State of the Environment
Figure 5-2 Areas where properties are at risk from fluvial and tidal flooding based on NaFRA 2014 data Environment Agency
5.0
Flo
od R
isk

35Kent State of the Environment
6.0 Biodiversity 6.1 INTRODUCTION
Biodiversity includes all species of animals and plants, and the natural systems that support them. It is an important aspect of our natural and built environment, forming the foundation of our ecosystems. It also provides us with a wide range of goods and services that support our economic and social wellbeing. These include essentials such as food, fresh water and clean air, but also protection from natural disasters, regulation of our climate, and purification of our water or pollination of crops.
Some studies have applied an economic value to aspects of biodiversity and landscape. The UK National Ecosystem Assessment (UK NEA), for example, has demonstrated that our UK coastal wetlands can be valued at providing £1.5 billion annually in benefits through buffering the effects of storms and natural management of flooding (DEFRA, 2011).
Despite its importance the National Ecosystem Assessment (2011) found that around 30% of services in the UK are currently declining and many others are in a reduced or degraded state. In addition, the Lawton Report, “Making Space for Nature” found that nature in England is highly fragmented and unable to respond effectively to increasing pressures such as climate and demographic change. Kent has not been immune from changes to its biodiversity and landscape, resulting from a number of factors including changes in woodland management and urban development, (see Section 1.1).
The Kent Nature Partnership (KNP) identifies the priorities for the natural environment in Kent and Medway, co-ordinates, facilitates and supports work that contributes to the objectives of the Strategic Framework for the Natural Environment. As such, the KNP’s 2015-2025 Biodiversity Strategy aligns its vision with that outlined in the Biodiversity 2020 Strategy for England. There are four outcomes set out for 2020, which are described in Table 6-1.
Table 6-1 The four core outcomes set out in the KNPs 2015-2025 Biodiversity Strategy.
Outcome Description
Habitats and ecosystems on land (including freshwater environments)
By 2020 measures will be in place so that biodiversity is maintained and enhanced, further degradation has been halted and where possible restoration is underway, helping deliver more resilient and coherent ecological networks, healthy and well-functioning ecosystems, which deliver multiple benefits for wildlife and people.
Marine habitats, ecosystems and fisheries
By 2020 we will have put in place measures so that biodiversity is maintained, further degradation has been halted and where possible restoration is underway, helping deliver good environmental status and our vision of clean, healthy, safe productive and biologically diverse oceans and seas.
Species By 2020, we will see an overall improvement in the status of our wildlife and will have prevented further anthropo-genic induced extinctions of known threatened species.
People By 2020, significantly more people will be engaged in biodiversity issues, aware of its value and taking positive action
6.2 VISION FOR KENT
Targets linked to the KNP’s Kent Biodiversity 2020 strategy outcomes are currently under discussion by the KNP; however as part of Climate Local Kent (CLK), partners across Kent have agreed to work towards the following:
• We will ensure that 60% of our local wildlife sites are being positively managed;• We will work to ensure that 95% of Kent’s Sites of Special Scientific Interest (SSSI’s)
are in a favourable state or recovering;• We will encourage an increase in volunteering, with a target of 20% increase
in hours spent and a 20% increase in Kent residents taking part in organised activities.
These targets are likely to remain with possible amendments as they align to the first outcome described in Table 6-1 and the third with outcome four which is focussing on people.
6.0
Bio
dive
rsit
y

36Kent State of the Environment
6.3 INDICATORS
Table 6-2 Key indicators relating to biodiversity, all of these indicators are currently in a status of discussion amongst the KNP.
Indicator Commentary How will we measure Objective
% of wildlife sites in positive conservation management
The local wildlife site (LWS) indicator originates from the Indicator 197 of the Local Area Agreement set by the Government. This has been superseded by the Single Data List 160 which all local authorities must annually submit to the Secretary of State. The % figure was set by the Kent Biodiversity Partnership and it has been adopted by the KNP.
In terms of SSSIs, Natural England (NE) has an Annual Programme of Integrated Site Assessment (ISAs). SSSIs are the most important areas of natural heritage and each site (in the country) is designated as a representative example of the particular habitat(s). Monitoring & reporting on site condition is part of NE’s statutory responsibility
The Kent Wildlife Trust conducts an annual review of the LWS system on behalf of the KNP
Natural England produces an annual report on SSSIs for the Government and is published through MAGIC
• 60% of local wildlife sites will be in positive management by 2013
• 95% of Kent’s SSSI are in favourable or recovering conditions
Increase in overall extent of priority habitats by 10,260ha
There are national (England Biodiversity 2020) and local drivers (Kent Biodiversity 2020 Strategy) for improving priority habitats.
In progress: potentially will be through district planning authorities reporting on how much development occurs on priority habitat land
The Kent Biodiversity Strategy 2020 contains targets for all 35 priority habitats across Kent, but it is extremely difficult to annually measure progress. Consequently, the KNP is identifying whether a measure of gain and loss can be captured through the planning system.
6.0
Bio
dive
rsit
y

37Kent State of the Environment
Indicator Commentary How will we measure Objective
Status of bird species in Kent Bird populations provide a broad state of wildlife (habitats) and bird counts. In addition, they provide part of the evidence base to assess the effects of environmental management, such as agricultural practices on bird populations, and also to assess whether environmental interventions intended to address declines, such as agri-environment schemes targeted at farmland birds, are delivering.
A dataset is available from 1970 and annual reports are produced by the British Trust for Ornithology (BTO) and RSPB under contract to DEFRA.
DEFRA (via Kent BTO branch and RSPB) Local targets will have to be set in collaboration with BTO, RSPB and either Country Land and Business Association (CLA) or the National Farmers Union (NFU). The indicator will consist of 19 bird species.
Status of butterfly species in Kent
Butterflies can form a useful barometer on changes to environment and habitat – currently data exists for butterfly species from farmland habitats. A dataset is available from 1990.
DEFRA (via the Kent branch of Butterfly Conservation and the Centre for Ecology and Hydrology through the UK Butterfly Monitoring Scheme)
As above, targets will need to be developed in collaboration with the Butterfly Conservation organisation.
Number of people volunteering in natural and historic environment and hours spent
This forms part of initiatives to enable people to more readily access green space and the historic environment, which can benefit the health and wellbeing of Kent residents.
KCC, Kent Wildlife Trust and other environmental third sector organisations, Kent Countryside Management Partnerships
20% increase in hours spent and 20% increase in people taking part in organised outdoor activities.
6.0
Bio
dive
rsit
y

38Kent State of the Environment
6.4 CURRENT STATE OF PLAY IN KENT
Many of the indicators listed in Section 6.3 are under development or review. However, with regard to those already included as part of the Climate Local Kent commitment the following can be summarised. Also refer to Section 1.1 for the current status of a number of habitat types across Kent.
Table 6-3 Update on targets that relate to some of the KPIs listed in Table 6-2, these targets were agreed through Climate local Kent.
Target Status
We will ensure that 60% of our local wildlife sites are being positively managed
Currently 62% of 437 sites are in favourable condition
We will work to ensure that 95% of Kent’s Sites of Special Scientific Interest (SSSI’s) are in a favourable state or recovering
Currently 67% of SSSIs are in favourable condition
We will encourage an increase in volunteering, with a target of 20% increase in hours spent, and a 20% increase in Kent residents taking part in organised activities
•• Public rights of way: 1,951 hours recorded for 2013
•• Countryside access wardens: 2,532 hours recorded between March 2013 and 2014
•• Kent Wildlife Trust: 13,005 days recorded for 2013*
*If eight hour days are assumed this equates to over 100,000 hours.
In relation to volunteering there are a number of opportunities, these include:
• Country Parks Volunteers;• Sustrans Rangers;• Community Meeting Point (CMP) Volunteers;• Thanet Coast Wardens;• Medway Swale Estuary Wardens;• Heritage Wardens;• Kent Wildlife Trust.
6.0
Bio
dive
rsit
y

39Kent State of the Environment
7.0 Water resources7.1 INTRODUCTION
Water is essential for human life and to sustain a diverse and thriving natural environment. It is important to our economy as an essential requirement for industry, power generation, commerce and agriculture. In addition, it is essential in supporting our growing population and to maintain and improve our standard of living.
There are significant pressures on water resources which affect both the water environment and water supplies. In Kent there are many catchments where there is little or no water available for abstraction during dry periods. Pressures are particularly notable in Kent as it is one of the driest parts of England and Wales, coupled with high population density and household water use. Over the next few decades, there will be increasing pressures from the rising population and associated development. Looking further ahead, climate change could have a major impact on the water that will be available for consumption (Environment Agency, 2012).
The pressures on water resources and the water environment mean that careful planning is essential to ensure there will be enough water for people and the environment in the future. All water companies have a statutory duty to prepare and maintain a water resources management plan (WRMP) to show how the water company intends to maintain the balance between supply and demand for water over the next 25 years. All parties involved in these plans (Environment Agency, DEFRA and Ofwat) must ensure that they are sustainable and cost effective (Environment Agency, 2010).
Two key sources of water resources are rivers and groundwater. In Kent, 73% of public water supply is taken from groundwater, most notably from chalk aquifers. The remainder of water company supply is either pumped directly to customers from rivers or into storage reservoirs (Environment Agency, 2012). These supplies are finite resources and in Kent we are currently using most of that capacity and in places exceeding it.
7.2 VISION FOR KENT
The Kent Environment Strategy is supported by Climate Local Kent, a commitment signed by a number of partners across Kent. As part of that commitment partners have agreed to support activity to reduce water consumption in Kent from 160 litres to 140 litres per person per day by 2016.
7.3 INDICATORS
Table 7-1 Key indicators relating to water resources, currently household water is one of the Climate local Kent targets.
Indicator Commentary How will we measure Goal (target)
Household water use
This provides us with an indication as to how resource efficient Kent residents are being. This can provide useful information to feed into any supply and demand studies which may be taken up in 2015/2016.
Water companies Reduce water use from 160 litres to 140 litres per person per day
River flow and groundwater levels
Water for domestic, industrial and commercial sectors come from rivers and groundwater. Indications of their status are important for managing supply – river water availability is monitored through river flow levels.
River flow provides an insight into water availability. River flow can have an effect on river water quality.
Monitored by the Environment Agency (EA) and CAMS water availability data – note that these data are only available every six years
7.0
Wat
er r
esou
rces

40Kent State of the Environment
7.4 CURRENT STATE OF PLAY IN KENT
Average rainfall in Kent is around 700mm (Environment Agency - The State of Water in Kent 2012) per year with more rain falling over the higher ground which pushes the prevailing south westerly winds higher. As a result much of the wetter areas of Kent are on the North Downs Chalk, where many of the groundwater abstractions are sourced. The north Kent coast experiences less rainfall as it sits in a relative rain shadow from the North Downs.
Across Kent, precipitation adds up to 2,500 billion litres of water per year, however 89% of this volume is lost through evaporation, plant growth, river flow or aquifer seepage. Currently abstraction accounts for 11% of the rain for consumptive uses.
Climate change models predict higher temperatures throughout the year which could increase evapo-transporation losses further. Increasing evapo-transporation and changing weather patterns could impact the recharge period, so it is likely that Kent could become increasingly reliant on winter rainfall for water supply in the future. Added to this, the proportion of rainfall which reaches groundwater aquifers will vary according to land management, soil type and underlying geology.
Linked to this is the amount abstracted. Abstraction volumes are closely related to per capita consumption rates. In turn per capita consumption is strongly influenced by the weather as demand notably increases in dry years (Environment Agency, 2012). The figure below indicates that between 2007 and 2011 average per capita consumption has been around 160 litres. However, average consumption has fallen slightly and for 2013-2014 average household water use per person in Kent was 154 litres per person per day compared to an average of 141 for the rest of England. Over the last three years the average household water use has remained higher than the English average.
Figure 7-1 Kent average water consumption for the period 1999/2000 to 2013/2014 (Environment Agency, 2012)
Across the district authority areas Ashford, Canterbury and Shepway districts have the lowest water use. Gravesham, Medway UA and Thanet districts show the highest water use per capita, see Table 7-2.
Table 7-2 Household water consumption figures in litres per capita per day (l/h/d) across the Kent district/borough authorities, and Medway UA for 2013/14
District/borough authority Average litres (l/h/d)
Ashford 142.30
Canterbury 142.81
Shepway 146.00
Dover 150.13
Maidstone 152.09
Sevenoaks 153.78
Dartford 154.54
Tonbridge and Malling 156.39
Swale 157.24
7.0
Wat
er r
esou
rces

41Kent State of the Environment
District/borough authority Average litres (l/h/d)
Tunbridge Wells 157.61
Medway UA 163.49
Gravesham 163.60
Thanet 167.47
Water availability can be monitored through average flow rates of rivers and groundwater. How much water is available can impact on the natural environment, communities and businesses. Some 25% of water for agriculture, industry and water treatment comes through abstracting from rivers for example, but if river flows are too low then abstraction can’t be licenced. Similarly, low river flows can cause a concentration of pollutants in a river having an adverse effect on the river quality.
The two maps shown in Figure 7-2 highlight river and groundwater flow conditions for both an average year and in a very dry year (which happens every 1 in 20 years, but likely to increase with climate change). The areas shown in red indicate that flows are too low for any abstraction of water to occur.
7.0
Wat
er r
esou
rces

42Kent State of the Environment
Figure 7-2 The distribution of areas where abstraction from groundwater and rivers is not possible (red) during average flow and very low flow conditions. Environment Agency
7.0
Wat
er r
esou
rces

43Kent State of the Environment
7.0
Wat
er r
esou
rces

44Kent State of the Environment
8.0 ResourcesEurope has enjoyed many decades of growth based on an assumption that resources are abundant, easy to source and cheap to dispose of. The socio-economic and environmental impacts of this linear model, adopting a take, make and dispose approach, results in depletion of finite resources for products, an accumulation of waste and environmental degradation.
Through increasing our understanding of materials, resources and their potential wider use we can work toward conservation and re-use through introducing multiple product life-cycles and recycling of materials. This approach can not only help spur innovation but can also move our economy towards greater resilience through operating in a smart, low-carbon and resource efficient way.
This section of the report looks at household waste across Kent and energy generation from renewable resources.
8.1 ENERGY GENERATION AND CONSUMPTION
8.1.1 INTRODUCTION
Over the next decade, the UK will need to invest in new generation capacity to replace the older fossil fuel and nuclear power stations that are set to close by the early 2020s. This is needed to maintain energy security, whilst meeting the UK’s commitments to reduce carbon emissions and increase renewable electricity generation. The latter has seen the UK commit to source 15% of its total energy requirement from renewable sources by the year 2020.
In addition, under the UK’s Carbon Plan there is a vision through to 2050 with the following key steps (DECC, 2011b):
• Up to 2020: Continue to reduce emissions from electricity generation through increasing the use of gas instead of coal, and generate more from renewable sources.
• 2020s: Rapid decarbonisation of the energy sector through deploying large-scale low carbon technologies.
• Beyond 2030: Continue to increase low carbon generation capacity as the demand to fuel transport, buildings and power heating rises.
Kent partners have already helped enable significant opportunities for renewable energy to be deployed across public, private and voluntary sectors across the county. Installations range from large scale onshore and offshore wind farms to solar farms and biomass plants as well as smaller scale building-integrated technologies. Total installed renewable electricity generation capacity exceeds 1GW and continues to grow. The growth is good for the Kent economy and it has been estimated that 19,600 people in Kent are currently employed in renewable and low carbon technology related industries, with this sector expanding nationally at around 5% per year (REAP, 2013 and AECOM, 2012).
8.1.2 VISION FOR KENT
Through the Climate Local Kent (CLK) commitment, a number of Kent partners have committed to increasing electricity generation in Kent from renewables by 10% by 2020. Looking at areas of greatest opportunity, and how Kent partners can provide influence to support those, a Renewable Energy Action Plan 2013-2018 (REAP) has also been agreed. The plan forms a key priority within the Kent Environment Strategy (KES).
8.0
Res
ourc
es

45Kent State of the Environment
8.1.3 INDICATORS
Table 8-1 Key indicators for renewable electricity generation
Indicator Commentary How will we measure
Goal (target)
Renewable energy
•• Investing in renewables will support the wider UK commitment to increase renewable electricity generation, thus supporting a reduction in emissions and improving future energy security both nationally and locally.
•• It will also support the growth of the LCEGS14 market through stimulating investment in new jobs and business, with opportunities for innovation.
Ofgem figures:
•• Feed-in-Tariffs (FiTs) which cover small scale devices;
•• Renewable Obligation Certificates (ROCS) and the Renewable Heat Incentive (RHI) which cover larger scale devices.
•• DECC Renewable Energy Planning Database
•• 10% of electricity generated in Kent to be from renewables by 2020 (a baseline of 2012 has been assumed, which is the year of the AECOM 2012 study).
Kent: Average domestic energy consumption per consumer (kWh) 2013
•• Detailing the consumption of gas and electricity per capita (residential)
•• DECC data
8.1.4 CURRENT STATE WITHIN KENT
With the current datasets available from Ofgem and DECC it is possible to estimate the approximate amount of electricity generated from installed capacity and what proportion of electricity consumption that represents. However, it is not possible to measure how much of that electricity is actually used in Kent as the majority of it goes into the transmission grid and is traded around the UK.
Below are two tables showing estimated electricity generation in Kent as of October 2014; for small scale devices as reported through the Feed-in-Tariff (FiT) registrations and for larger scale devices as registered through the Renewable Obligation Certificates (ROCs).
Table 8-2 Total generating capacity for small scale renewable energy devices as recorded through FiTs
Renewable energy type Estimated generation per annum (MWh4)
Hydroelectric 12.30
Micro combined heat and power (CHP) 22.34
Solar photovoltaics 43,900.43
Wind 503.80
Total 44,438.86
8.0
Res
ourc
es
14 Low Carbon and Environmental Goods and Services (LCEGS)

46Kent State of the Environment
Table 8-3 Total generating capacity for larger scale renewable energy devices as recorded through ROCs
Renewable energy type Estimated generation per annum (MWh)15
Landfill gas 150,122
Sewage gas 10,759
Energy from waste 188,979
Solar photovoltaic 160,282
Onshore wind 163,038
Offshore wind 3,475,793
Total 4,148,973
The total energy consumption in Kent and Medway for 2012 was 35,149,700 MWh (industrial and commercial, domestic, transport). The estimated total electricity generated through FiT and ROC installations for 2014 was 4,193,412 MWh, which is nearly 12% of the total energy consumed. When measured against electricity consumption in Kent and Medway which was 7,111,500 MWh in 2012, electricity generated from renewable is equivalent to around 59% of that consumed. A high proportion of this is attributable to the three offshore wind farms linked to Kent and the onshore wind farm in the Romney Marsh area. Notwithstanding this, the growing number of freestanding solar farms, biomass and green waste to energy plants are making an increasing contribution. Given the predominance of electricity generation, the 10% commitment mentioned in Section 8.1.2 has been met and exceeded.
The high deployment of electricity generating technologies reflects the availability of Government fiscal support first introduced for large scale renewable energy projects through the Renewables Obligation in 2002. By comparison, the supply of renewable heat is under-developed at present despite Kent being one of the most wooded counties in England. The situation is changing and in future years the supply of renewable heat is likely to increase as the introduction of the Renewable Heat Incentive16 takes greater effect.
Total domestic energy consumption (gas and electricity together) in Kent during 2013 was 17,753 kWh per consumer unit 17,753 kWh per consumer unit. This is 1.8% lower than the previous year and 15.0% lower than 5 years ago. This is similar to the national reduction of 15.5% over the same period1.
All local authority districts across the county have seen reductions in the amount of gas energy used compared to the previous year. Over a five year period domestic users in Thanet district have reduced energy use by over 22%, whilst nationally the reduction is almost 20%. This supports both cost and energy efficiencies.
8.2 WASTE
8.2.1 INTRODUCTION
The amount of waste generated across England each year varies. For example in 2013 the amount of waste managed was 170 million tonnes (Environment Agency, 2013). Sending waste to landfill results in costs to businesses and households and has a negative impact on our environment. For example, the disposal of waste to landfill for example is the largest source of methane (CH
4) from the UK, followed by
agriculture and fugitive emissions from within the energy supply sector17 (DECC, 2011a). A summary of waste managed in 2013 is given in Table 8-4.
8.0
Res
ourc
es
15 To convert to GWh divide MWh by 100016 Non-domestic installations eligible from November 2011 and domestic installations from April 201417 Fugitive emissions refer to leaks or other intended or irregular releases of gas from industrial activities; with regard to the energy supply sector fugitive emissions can arise from a number of release points – DECC have considered those
emissions from coal mining, production of offshore oil and gas, and the distribution of gas (DECC, 2013).

47Kent State of the Environment
Table 8-4 Tonnes of waste managed across England in 2013 (Environment Agency, 2013)
Waste management method
Millions tonnes managed in 2013
Landfill 41.1
Transfer 42.2
Treatment 49.3
Metal recycling 13.6
Incineration 7.5
Use of waste 3.0
Land disposal 13.7
Total 170.4
UK Central Government sees that a more resource efficient, circular economy offers scope for innovation, sustainable growth and saving money as well as a way of helping to reduce our impact on the environment. A number of key activities are included within this thinking (DECC, 2013):
• Resource efficiency: using the Earth’s limited resources in a sustainable manner while minimising negative impacts on the environment.
• The circular economy: moving away from our current linear economy (take, make, use and dispose) towards one where our products, and the materials they contain, are valued differently; creating a more robust economy in the process.
• Waste prevention: focusses on actions taken before something becomes waste so to reduce:
• The quantity of waste produced, including through extension of product life through design, repair or reuse.
• The adverse impacts of waste produced on the environment and human health, or
• The content of harmful substances in materials and products.
There is a two-tiered system for municipal waste in the county. Kent County Council is responsible for the disposal of municipal waste with the District and Borough Councils responsible for municipal waste collection. Indeed the local authorities’ role in waste is a small part of the waste management picture in the county and so effective partnerships are crucial. Figure 8-1 details the tonnage of materials through household waste recycling centres over the last three years.
All District and Borough authorities along with KCC have developed and signed up to a Joint Municipal Waste Management Strategy (the Kent Waste Strategy) which focuses on how the Partnership will manage municipal solid waste arisings over the next 20 years18. The strategy was developed following a baseline study in 2005 which in part, identified current and historic trends in municipal waste.
8.2.2 VISION FOR KENT
TThrough the Kent Waste Strategy, the Kent Resource Partnership (KRP) has set three core objectives:
1. Deliver the best possible outcomes for materials handled by the KRP from household and other appropriate sources.
2. Deliver the best possible value for money to Kent taxpayers by taking account of whole-service costs paid through Council Tax.
3. Secure the best possible outcomes through effective partnership working among the 13 Kent councils, through the SE7 Project, with government, and across the supply chain.
Three overarching policies have been agreed that support the delivery of these objectives, along with a number of indicators that are described in Section 8.2.3. The policies cover materials security and resource efficiency, value for money for Kent taxpayers, and supporting Kent’s interests.
8.0
Res
ourc
es
18 http://www.kent.gov.uk/about-the-council/strategies-and-policies/environment-waste-and-planning-policies/waste-strategies

48Kent State of the Environment
8.2.3 INDICATORS
Table 8-5 Key indicators that form part of the Kent Waste Strategy, as implemented by the Kent Resource Partnership (KRP)19
Indicator Commentary How will we measure Objective
Household recycling Recycling is a major means of reducing the environmental impacts of mining, processing and transportation of virgin materials. It also helps to reduce waste to landfill.
Through the Defra Waste Data Flow which is a national tool to measure performance (inputted by Districts and accompanied with KCC recycling and disposal data). Supported by the Kent Resource Partnership
Recycle/compost at least 50% of household waste by 2020/21 (45% by 2015/16).
Landfill reduction Reduction of use of landfill is a major means of cutting methane emissions, CH4 (which are 21 times more harmful than carbon dioxide CO2, in terms of its atmospheric thermal effects).
Send no more than 5% waste to landfill by 2020/21.
Interim targets: 2015/16: target of 10% to landfill.
Municipal waste arisings and treatment
The state of the economy tends to have a major bearing on the tonnage of items discarded by households. Increase in tonnage can have significant environmental, financial and social consequences which require concerted efforts internationally, nationally and locally to combat.
Reduce household waste arisings by 5% by 2015/16 (based on 2010 baseline); and reduce by 10% by 2020/21 (again, based on 2010/11).
8.0
Res
ourc
es
19 Note that the KRP is a collective

49Kent State of the Environment
8.2.4 STATE OF PLAY IN KENT
There has been much improvement across Kent in reducing the waste sent to landfill; in 2005 75% of household waste ended up as landfill whereas 2013/14 it was 18%.
0
10,000
20,000
30,000
40,000
50,000
60,000
2012-‐13 2013-‐14 2014-‐15
Residual
Recycled
Composted
Soil and Rocks
Figure 8-1 Material (tonnes) through Kent County Council’s Household Waste Recycling Centres. Data taken from WasteDataFlow and KCC Waste Local Records.
0.22 0.18 0.10
0.36 0.37
0.43
0.26 0.29 0.27
0.16 0.17 0.20
2012/13 2013/14 2014/15
% Diversion of Waste
% Sent to Landfill % Used for Energy Recovery % Recycled % Composted
Figure 8-2 - Percentage diversion of waste. Data taken from WasteDataFlow and KCC Waste Local Records
The Kent Resource Partnership (KRP) has a target of reducing landfill to just 10% of total household waste by 2015/16 and to 5% by 2020/21. Current projections suggesting 11.4% for the 2014/15 period indicate the Partnership is on target, which will in turn support efforts to reduce the impacts of emissions from landfill, such as methane (CH
4).
Waste prevention and minimisation is the preferred solution before re-use and recycling; the waste hierarchy approach.
The KRP is also focusing on increasing recycling of household waste, with an initial target of 50% of all household waste to be recycled by 2020/21, which means that recycling is the Partnership’s preferred option for dealing with the household waste stream. The 13 council’s activities support the EU Waste Framework Directive 2008 as transposed into national law by the Waste Regulations (England and Wales) 2011, and the Waste Regulations (England and Wales) (Amendment) 2012. On a global level, recycling supports efforts to reduce the use of, and reliance on, virgin raw materials such as rare earth metals maximising the lifetime of our resources.
8.0
Res
ourc
es
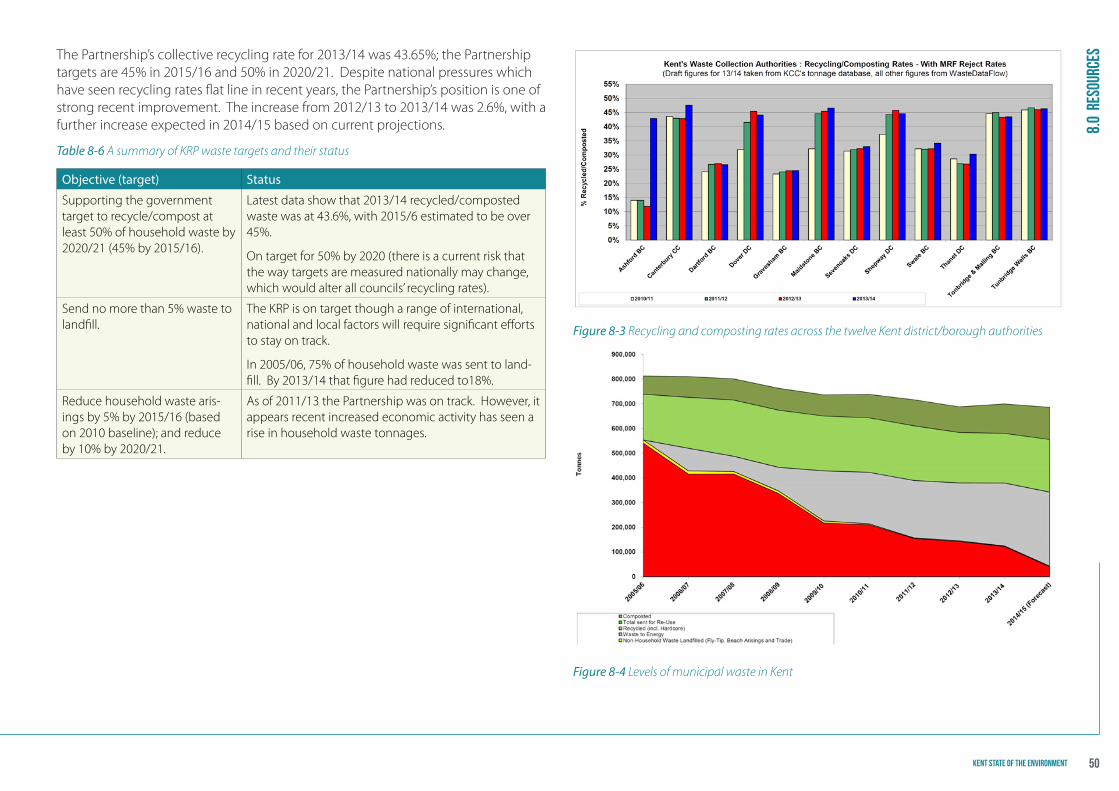
50Kent State of the Environment
The Partnership’s collective recycling rate for 2013/14 was 43.65%; the Partnership targets are 45% in 2015/16 and 50% in 2020/21. Despite national pressures which have seen recycling rates flat line in recent years, the Partnership’s position is one of strong recent improvement. The increase from 2012/13 to 2013/14 was 2.6%, with a further increase expected in 2014/15 based on current projections.
Table 8-6 A summary of KRP waste targets and their status
Objective (target) Status
Supporting the government target to recycle/compost at least 50% of household waste by 2020/21 (45% by 2015/16).
Latest data show that 2013/14 recycled/composted waste was at 43.6%, with 2015/6 estimated to be over 45%.
On target for 50% by 2020 (there is a current risk that the way targets are measured nationally may change, which would alter all councils’ recycling rates).
Send no more than 5% waste to landfill.
The KRP is on target though a range of international, national and local factors will require significant efforts to stay on track.
In 2005/06, 75% of household waste was sent to land-fill. By 2013/14 that figure had reduced to18%.
Reduce household waste aris-ings by 5% by 2015/16 (based on 2010 baseline); and reduce by 10% by 2020/21.
As of 2011/13 the Partnership was on track. However, it appears recent increased economic activity has seen a rise in household waste tonnages.
Figure 8-3 Recycling and composting rates across the twelve Kent district/borough authorities
Figure 8-4 Levels of municipal waste in Kent
8.0
Res
ourc
es
51Kent State of the Environment
9.0
Infr
astr
uctu
re –
tran
spor
t, ho
usin
g an
d la
nd
9.1 INTRODUCTION
Infrastructure enables our society to function and for us to go about our daily lives and business activities. Two aspects covered in this section are transport and housing, both having a key role in supporting efforts to move toward a low carbon, resource efficient and healthy society and economy (Aldersgate, 2014).
Domestic energy use in the UK accounts for between 25% and 30% of total CO2 emissions nationally, which is comparable to estimated emissions across Kent. Over three-quarters of that energy is for space and water heating; lighting and appliances account for a smaller percentage of domestic energy demand (DECC, 2011b).
It is estimated that up to £3 billion of that energy use is wasted through loss of heat from properties.
Being unable to afford to adequately heat a home increases the risk of ill health for families and children. It is also a likely cause of some excess winter deaths, particular amongst the elderly (JSNA, 2014). Under the latest UK Government amendments to the fuel poverty definition (the low income high cost calculation) a household is said to be in fuel poverty if:
• they have required fuel costs that are above average (the national median level)• they were to spend that amount, they would be left with residual income below
the official poverty line.
Under the previous 10% indicator, a household was considered to be fuel poor if it were required to spend more than 10% of income on fuel to maintain an adequate level of warmth (DECC, 2014).
Some 80% of the housing stock we will be using over the next 80 years has already been built and so retrofitting those homes with energy efficiency measures needs to be part of the solution. This approach can also support our national and wider global efforts to reduce our GHG emissions through reducing the energy demand from domestic properties.
However, infrastructure does not just relate to what would normally be considered physical structures. Our green infrastructure and how we manage our land to support and enhance it is vital to ensure the health and wellbeing of residents whilst providing vital resources and opportunities for our economy. As identified in the Growth and Infrastructure Framework for Kent and Medway, the county has 90 strategic parks and gardens, 45,000 hectares of broadleaf woodland and 116 sites of national and international importance for conservation. The Kent Downs and High Weald AONBs cover 32% of the county. Investment will be needed into the future to enhance existing green spaces and provide new multifunctional green infrastructure.
9.0 Infrastructure – transport, housing and land

52Kent State of the Environment
9.0
Infr
astr
uctu
re –
tran
spor
t, ho
usin
g an
d la
nd9.2 VISION FOR KENT
Through the Climate Local Kent (CLK) commitment Kent partners committed to support a programme to retrofit 1,200 homes by December 2014 and to bring in £12m to Kent through the Energy Company Obligation (ECO) programme by 2015.
Kent’s key strategic transport strategies support the development and delivery of sustainable transport solutions which provide multiple benefits; reducing congestion, supporting economic growth, promoting equality of opportunity and cutting carbon emissions. This has a direct impact on air quality with subsequent health impacts.
For example, Growth without Gridlock – A Transport Delivery Plan for Kent has a vision ‘to create a high quality integrated transport network which will create opportunities for real transport choice as well as enabling economic growth and regeneration. At the local level, planning authorities demonstrate transport priorities through local transport strategies.
The priorities of Growth Without Gridlock are to;
• Improve access to jobs and services by efficient means of public transport, walking and cycling
• To reduce and reverse the impact of transport on public health• To encourage and enable more physically active travel• To improve access by and integrate public transport, walking and cycling; • To reduce traffic levels; • To improve carbon efficiency of current forms of transport• To reduce the need to travel and minimise the distance of journeys taken• To encourage the use of more sustainable transport like public transport, walking
and cycling; • To reduce the number of people and dwellings exposed to high levels of noise• To reduce the level of pollution (noise, fumes, spillage, vibration etc) from traffic• To reduce and reverse the impact of new infrastructure on the natural
environment.
The Growth and Infrastructure Framework provides an understanding of the current situation in relation to our green infrastructure resources in the county with recommendations for additional requirements to address future growth challenges. This, and wider evidence identified throughout this report have been used to underpin a number of priorities within the Kent Environment Strategy.

53Kent State of the Environment
9.0
Infr
astr
uctu
re –
tran
spor
t, ho
usin
g an
d la
nd9.3 INDICATORS
Table 9-1 Key indicators for energy efficiency of domestic properties and sustainable transport
Indicator Commentary How will we measure Objective
Sustainable transport (School survey data)
The ‘Hands Up’ Surveys provides data on the modes of transport to school
Annual survey through the Jambusters Project - travel planning
Through Kent Connected 97% of schools have travel plans. The aim to ensure all are live and actively used documents
Business Surveys (Kent Connected)
Kent Connected is a scheme to promote and increase sustainable transport modes.
50 businesses
% increase in bus usage (Ariva)
The % bus user increase network is an indicator of the use of this public transport method. This indicator is also related to the Kent population changes.
Annual data 2012-2013: 0.03% increase
2013-2014: 0.10% increase
Smarter travel Challenge Survey
A Kent wide scheme to promote active travel through businesses and organisations. Surveys are undertaken before and after the Challenge to detail shift in behaviour and travel modes.
Survey data
Modal change in school transport options for Kent
Through Jambusters© schools submit annual review of their travel plans. The project can monitor the behavioural change in modes of transport (and prioritise initiatives)
Jambusters© Ensuring travel plans are live. Increase % of sustainable transport modes
Energy efficiency, quality and resilience of housing
Poorly insulated homes can have health impacts particularly on mobility of the elderly. It has an impact on affordability of heating, and can have an impact on air quality.
Energy Saving Trust, KMSEP, DECC (fuel poverty data)
ECO pilot: 1200 homes retrofitted by December 2014
Land covered by Countryside Stewardship Wildlife Packages
The Wild Pollinator and Farm Wildlife Package is a specific group of management options that benefit wild pollinators, farmland birds and other farm wildlife such as rare arable plants, great crested newts, bats and brown hare.
Land covered Determined once the scheme is established

54Kent State of the Environment
9.0
Infr
astr
uctu
re –
tran
spor
t, ho
usin
g an
d la
nd9.4 CURRENT STATE OF PLAY
Fuel poverty across Kent is decreasing. In 2010 13% of households were classified as being in fuel poverty based the 10% method calculation; in 2012 that percentage has reduced to 10%.
Driving the housing retrofitting agenda is the Kent and Medway Sustainable Energy Partnership (KMSEP), formally called the Kent and Medway Green Deal Partnership (KMGDP). It was established in February 2012 and is a partnership which includes Kent County Council (KCC), Medway Council, the district/borough authorities, registered housing providers and other key stakeholder groups.
Key drivers (and aims of KMSEP) to retrofitting are:
• Reducing household bills and tackling fuel poverty, making homes better insulated will mean they cost less to heat or are more comfortable in winter.
• Reducing carbon and making homes better insulated will mean they waste less energy and produce less CO
2.
• Supporting businesses to take advantage of the opportunities available in the retrofitting sector.
• Helping residents understand how making their home more energy efficient is of benefit to them and helping them understand where to access relevant grants etc.
KMSEP were successful in acquiring the DECC Green Deal Pioneers Fund, which was aimed primarily at promoting and testing the implementation of Green Deal and ECO schemes across Kent and Medway. Through the Fund five domestic open homes and, through additional KCC funding, three open community buildings have successfully been retrofitted. These buildings serve as retrofit demonstration properties. In addition, the funding was used to offer and complete 159 free Green Deal domestic assessments, two Energy Champion training courses, and through an online survey, it assessed the appetite from business for the Green Deal.
In May 2013 KCC, on behalf of KMSEP, procured an ECO funding provider and worked with them to deliver a programme of housing retrofit, the Warm Homes Scheme. The programme focused on reaching the most vulnerable Kent residents to offer free insulation measures and in addition, for residents on specific benefits, support towards boiler replacement and heating measures. Warm Homes also linked with the Public Health programme Winter Warmth to provide insulation
and heating to some of our most vulnerable elderly residents most at risk from cold weather. Through the schemes KMSEP have achieved the following retrofit numbers, see Table 9-2.
In addition to retrofitting measures the Warm Homes Scheme has seen the development of an Energy Saving Advice Pack and provided energy efficiency training to a range of trusted professionals, such as the Home Improvement Agencies and Citizen’s Advice Bureau.

55Kent State of the Environment
9.0
Infr
astr
uctu
re –
tran
spor
t, ho
usin
g an
d la
ndTable 9-2 Summary of the number and type of property that has received retrofitting measures through various funding scheme across Kent and Medway
DistrictProperties
Measures
CERO CSCO HHCRO Winter Warmth Total CERO CSCO HHCRO Winter
Warmth Total
Private total 135 141 70 85 431 135 171 70 85 461
Social Total 377 225 0 0 602 378 239 0 0 617
Overall Total 512 366 70 85 1033 513 410 70 85 1078
Notes:CERO: Carbon Energy Reduction Obligation fund. This is aimed at hard to treat properties covering cavity, solid wall and loft insulation, heating and glazing. CSCO: Carbon Saving Communities Obligation fund. This is aimed at low income households covering insulation, glazing and district heating.HHCRO: Home Heat Cost Reduction Obligation. This is intended to support low income and vulnerable households that struggle to heat their home to a satisfactory standard.
Sustainable transport outputs are difficult to quantify and demonstrate through measurable indicators. This is due in part to the multi-sector nature of the area, incorporating air quality, capital infrastructure, behavioural change and accessibility.
For example the Smarter Travel challenge is a Kent wide initiative bringing together local authorities, Public Health and businesses. This developed from the Thanet and Invicta Challenge (June 2014) which saw 1,341 active travel journeys completed by 136 staff members, a distance of 11,843 miles. Alongside 1,678 miles saved from virtual meetings,
The Kent Connected project funded by the Local Sustainable Transport Fund is an example of direct delivery in Kent. The aims are to promote and simplify access to sustainable travel information, overcome the barriers and engage with target groups to minimise peak congestion and improve health within Kent. It comprises the development of a new mobile compatible website providing a multi-modal
door-to-door journey planner, smart ticketing, car sharing forum, competitions and challenges for active/sustainable travel alongside a communication and engagement strategy.
Jambusters© was established to support modal shift in transport options for pupils getting to and from schools. There remains however significant variability across the county into modes of transport used.
For Maidstone schools, the data shows a significant increase in bus usage, reduction in cycling and walking with a small increase in the train usage. There is significant difference however across Districts demonstrated through comparison to Tunbridge Wells.

56Kent State of the Environment
9.0
Infr
astr
uctu
re –
tran
spor
t, ho
usin
g an
d la
ndTable 9-3 Reported modal share for Maidstone Schools
Mode 2005/06 2006/07 2007/08 2008/09 2012/13 2013/14
Bus 4.10% 24.40% 1.40% 23.00% 31.60% 16.90%
Car4.80% 4.10% 0.90% 3.70% 3.50% 5.90%
(shared)
Cycle 3.60% 2.90% 2.40% 0.50% 2.50% 1.40%
Walk 54.70% 32.20% 42.40% 28.40% 33.00% 39.80%
Other 1.10% 0.60% 6.60% 1.10% 0.40% 3.20%
Rail 1.10% 8.80% 0.20% 0.90% 4.40% 3.30%
Car30.60% 27.00% 46.20% 42.40% 24.60% 29.60%
(alone)
6 surveys 10 surveys 7 surveys 7 surveys 12 surveys 22 surveys
Table 9-4 - Reported modal share for schools in Tunbridge Wells
mode 2005/06 2006/07 2007/08 2008/09 2012/13 2013/14
bus 17.90% 0.90% 43.30% 0.30% 40.80% 20.70%
car6.40% 4.10% 2.20% 1.10% 2.80% 3.90%
(shared)
cycle 0.90% 0.40% 0.90% 0.30% 1.60% 2.20%
walk 40.70% 45.90% 28.30% 66.80% 32.80% 44.70%
other 0.80% 8.80% 0.40% 0.80% 0.80% 0.90%
rail 0.80% 0.10% 4.00% 0.00% 1.70% 0.70%
car32.60% 39.90% 20.90% 30.70% 19.50% 26.90%
(alone)
5 surveys 8 surveys 7 surveys 1 survey 11 surveys 14 surveys© copyright Jambusters 2014 all rights reserved
Input 2013/14 graph for all Districts
Train usage (footfall) and percentage increase in number for bus operators provides an indication of sustainable transport usage, from 2012-2014 Ariva saw a 0.07% increase in passenger numbers for example.
In regards to land management, the new Countryside Stewardship Scheme (recently launched in summer 2015) and specifically the wildlife packages will provide the baseline for future years.

57Kent State of the Environment
10.0
Eco
nom
y
10.1 INTRODUCTION
The low carbon and environmental goods and services (LCEGS) sector forms an important part of the transition to a low carbon economy (DECC, 2012). In 2012 Kent County Council commissioned a study into assessing the economic potential of that sector in Kent. At the time of the report it was estimated to be worth £100 billion in the UK and expected to grow by up to 5% per year over this current decade. A number of LCEGS activities were recognised as potential growth areas
10.0 Economy in Kent, these were: retrofitting, low carbon new build, offshore wind, and waste management and recycling (Regeneris, 2012).
It is however difficult to assess growth as low carbon activities are cross-sectoral and do not necessarily fit into one industry type code and accordingly are not consistently recorded in national or local employment statistics. Consequently, Kent County Council (KCC) has adopted a set of grouped UK standard industry codes that fall into the strategic drivers that underlay the LCEGS sector. Listed in Table 10-1, those drivers recognise primary and secondary businesses; primary where the business activities will be solely or mainly aimed at low carbon products/services, and secondary where a portion of the activities may be aimed at that market.
Table 10-1 A framework for defining the LCEGS sector across Kent and Medway, modified from Regeneris (2012).
Strategic Driver Sector Type and Breakdown
Primary Secondary Supply Chains
Decarbonising the energy sector
None identified • Electricity – fuel processing• Energy equipment – boilers, ovens, furnaces
and burners• Energy equipment – engines, turbines, electric motors
and generators• Electricity – distribution equipment, cables
and wires• Energy equipment – lighting, domestic appliances and
other electrical equipment• Energy equipment – pumps and compressors• Sustainable transport – manufacture• Electricity – production, transmission and distribution• Development and construction of buildings and civil
engineering projects• Plumbing, heating, electrical installation and insulation• Sustainable transport - operation
• Manufacturing – plastics• Manufacturing – glass• Manufacturing – bricks, cement, mortar, concrete• Manufacturing of other components and parts• Manufacturing of metals and metal products• Sustainable transport – manufacture• Installation of machinery and equipment• New buildings – supply chain• Plumbing, heating, electrical installation and insulation• Sustainable transport – sale, maintenance and repair• Sustainable transport – operation• Banking and insurance• Legal and accountancy services• Architects, surveyors and consulting• Renting and leasing of machinery and equipment
Improving resource efficiency
• Water supply and treatment• Waste management, reuse
and recycling
• None identified
Preserving and enhancing the natural environment
• Green infrastructure • Agriculture and fishing
Multi-disciplinary • Environmental consulting • Architects, surveyors and consulting• Engineering and technical testing• Research and development• Regulation of low carbon activities

58Kent State of the Environment
10.2 VISION
As part of the Climate Local Kent (CLK) commitment, Kent partners have agreed to support an increase in jobs within the Low Carbon and Environmental Goods and Services (LCEGS) sector by 10% by 2020.
However, whilst KCC and partners have an influence over some of this sector, the scale of potential job growth is uncertain and depends on a range of factors, including, for example: the rate of take-up of energy efficiency measures by households and the extent to which the UK is successful in penetrating global supply chains for renewable energy infrastructure (Regeneris, 2012).
10.3 INDICATORS
Table 10-2 Key indicator for economics relating to the growth of the LCEGS employment sector across Kent
Indicator Commentary How will we measure
How many people are employed in the Low Carbon Environmental Goods and Services sector (LCEGS)
The LCEGS sector is growing and contributes to the Kent economy. It forms part of the UK and wider EU aspirations to move toward a low carbon energy future.
Application of grouped UK Standard Industry Code (SIC) (2007) to annual employment figures sourced from the ONS Business Register Employment Survey (BRES) data.
10.4 CURRENT STATE OF PLAY IN KENT
Low Carbon Kent (LCK), operated by Kent County Council (KCC), was successfully launched in April 2013 with the aim of promoting and supporting growth in the LCEGS sector across Kent through stimulating supply and demand for this sector. This is being achieved by providing access to finance and reducing costs to business through, crucially, providing a platform for those businesses to make the right connections with national, regional and local stakeholders. Another fundamental aspect is research into identifying risks and opportunities for businesses in areas of renewables, housing retrofit, waste, resource efficiency and climate change, and leading on from that developing and delivering targeted support such as training, workshops and networking events. At the core of LCK is a network of over 1,500 SMEs across Kent and Medway who KCC and partners engage with in order to deliver this support.
10.0
Eco
nom
yOverall there are estimated to be over 55,000 people employed in the LCEGS sector across Kent, nearly 10% of the working population in the county. Over the last five years numbers of employed have varied and there have been some periods of decline. The largest occurred between 2010 and 2011 where there was a reduction of 7,600 employed. Much of that reduction came from secondary businesses associated with the first strategic driver, Decarbonising the Energy Sector and includes business related to, for example: energy equipment manufacture, construction of buildings and sustainable transport. However, between 2012 and 2013 an increase in employee numbers is seen and again much of that is associated with those secondary businesses.
Table 10-3 A summary of employees by key drivers that align with the LCEGS sector (KCC area only)
2009 2010 2011 2012 2013
Decarbonising the Energy Sector
Primary 0 0 0 0 0
Secondary 38,200 37,000 31,900 33,000 35,600
Improving Resource Efficiency
Primary 4,500 6,700 6,200 5,100 5,700
Secondary 0 0 0 0 0
Preserving and Enhancing the Natural Environment
Primary 2,600 4,300 2,300 2,000 2,200
Secondary 13,900 13,400 13,300 13,000 12,900
Multi-disciplinary SectorsPrimary 2,600 4,300 2,300 2,000 2,200
Secondary 13,900 13,400 13,300 13,000 12,900
All Low Carbon Sectors: Sub-Total All 58,200 60,500 52,900 52,000 55,600
Supply Chain Sectors All 61,400 61,700 61,000 63,600 61,100
Notes:1: Note that these sectors are not mutually exclusive, so should not be summed. 2: Source data: Business Register and Employment Survey (BRES) 2009-2012, NOMIS.
This table also includes estimates for Agricultural employees that are excluded from the BRES data below regional level. As a result, the sub-total is the sum of each unique sector included in all the categories above.
3: Prepared by: Research & Evaluation, Business Intelligence, Kent County Council.

59Kent State of the Environment
With regards to the objective of 10% employment growth, which was set against a baseline year of 2012 and an estimated 52,000 employed in the LCEGS sector, Kent is so far on track. The target growth for 2012/2013 was 52,650; the estimated figures are 55,600; in order to meet the 2020 10% target Kent needs to achieve a year-on-year increase of 413 jobs. See Figure 10-2 for current and historic estimates and projected estimate employment numbers.
40,0
00
45,0
00
50,0
00
55,0
00
60,0
00
65,0
00
2009 2010 2011 2012 2013 2014 2015 2016 2017 2018 2019 2020
Estim
ated
em
ploy
ee n
umbe
rs
All Low Carbon Sectors: Sub-Total
Actual data
Target forecast
Target forecast based on 10% growth from 2013 level, by 2020
Figure 10-2 estimated employment figures for the LCEGS sector in Kent, and forecasted requirements based on a 10% increase by 2020 from a 2012 baseline. These data and forecasts were prepared by Research & Evaluation, Business Intelligence, Kent County Council.

60Kent State of the Environment
11.0 Health and Wellbeing11.1 INTRODUCTION
There is a clear interdependency between public health, social care and sustainability and Health and Wellbeing Boards are required to consider wider social, environmental and economic factors that impact on health and wellbeing such as access to green space, the impact of climate change, air quality, housing, community safety, transport, economic circumstances and employment.
A sustainable health and care system requires an integrated approach, improving quality of life and meeting the needs of current and future generations, whilst simultaneously protecting and enhancing the natural environment. Through considering economic, social and environmental impacts in our decision making we can ensure that our approach to delivery of health and social care in Kent is sustainable, with outcomes benefitting our residents now and into the future.
11.2 VISION FOR KENT
There are different drivers operating for sustainability, climate change and public health, however there are also some significant overlaps in the actions required to address all three areas. As part of the Sustainability Assessment of the Joint Strategic Needs Assessment (JSNA, 2014) a number of recommendations have been detailed that cross-cut throughout the KES themes, which have been incorporated into the strategy and cover the following:
• Communications: ensuring that health and sustainability considerations are adequately reflected in key strategies;
• Planning: integration of health and sustainability into the planning system, and use of the JSNA, 2014 as an evidence base for local planning decisions.
• Housing and fuel poverty: health and wellbeing boards supporting the delivery of the ECO Warm Homes programme. Also, supporting/undertaking monitoring for indoor air quality to ensure properties are adequately ventilated.
• Transport: review barriers to uptake of travel management plans and provide policy support via the Health and Wellbeing Strategy for sustainable transport schemes.
• Natural Environment and Heritage: enabling and developing the positive health benefits of volunteering and accessing the historic and natural landscape.
• Climate resilience: incorporating health and wellbeing into local multi-agency flood plans, including psychological and mental health aspects of emergency preparedness.
• Air quality: raising awareness of the impacts of air quality, and investigating the significance/impact of the air quality management areas in Kent using the Kent and Medway Air Quality Monitoring Network.
• Workplace and supply chain: reviewing the environmental performance of the health and social care supply chain, identifying opportunities for improving and incorporating new business models. Also, looking at improving awareness and resilience to severe weather impacts.
11.0
Hea
lth
and
Wel
lbei
ng
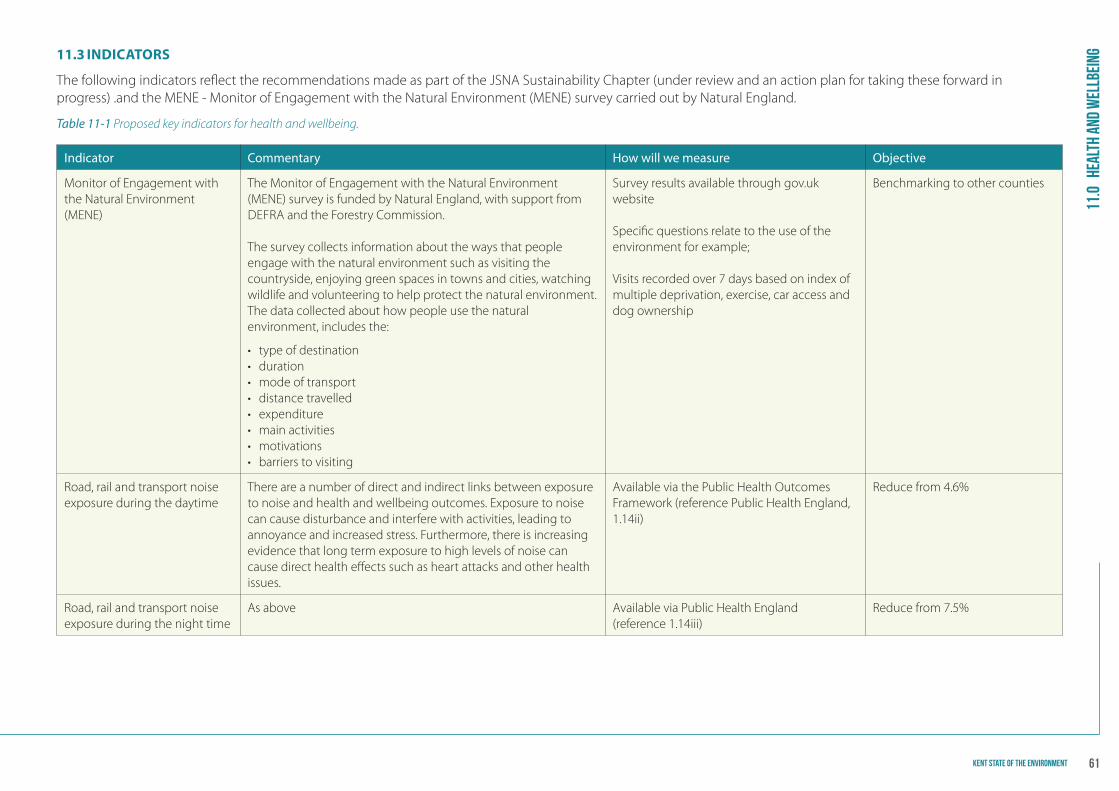
61Kent State of the Environment
11.3 INDICATORS
The following indicators reflect the recommendations made as part of the JSNA Sustainability Chapter (under review and an action plan for taking these forward in progress) .and the MENE - Monitor of Engagement with the Natural Environment (MENE) survey carried out by Natural England.
Table 11-1 Proposed key indicators for health and wellbeing.
Indicator Commentary How will we measure Objective
Monitor of Engagement with the Natural Environment (MENE)
The Monitor of Engagement with the Natural Environment (MENE) survey is funded by Natural England, with support from DEFRA and the Forestry Commission.
The survey collects information about the ways that people engage with the natural environment such as visiting the countryside, enjoying green spaces in towns and cities, watching wildlife and volunteering to help protect the natural environment. The data collected about how people use the natural environment, includes the:
• type of destination • duration • mode of transport • distance travelled • expenditure • main activities • motivations • barriers to visiting
Survey results available through gov.uk website
Specific questions relate to the use of the environment for example;
Visits recorded over 7 days based on index of multiple deprivation, exercise, car access and dog ownership
Benchmarking to other counties
Road, rail and transport noise exposure during the daytime
There are a number of direct and indirect links between exposure to noise and health and wellbeing outcomes. Exposure to noise can cause disturbance and interfere with activities, leading to annoyance and increased stress. Furthermore, there is increasing evidence that long term exposure to high levels of noise can cause direct health effects such as heart attacks and other health issues.
Available via the Public Health Outcomes Framework (reference Public Health England, 1.14ii)
Reduce from 4.6%
Road, rail and transport noise exposure during the night time
As above Available via Public Health England (reference 1.14iii)
Reduce from 7.5%
11.0
Hea
lth
and
Wel
lbei
ng

62Kent State of the Environment
Indicator Commentary How will we measure Objective
Utilisation of outdoor space for health reasons
Green spaces have a beneficial impact on physical and mental wellbeing and cognitive function through both physical access and usage. The indicator is in line with Commitment 55 of the Natural Environment White Paper : The natural Choice: Securing the value of nature
Available via Public Health England (reference 1.16)
Increase from 12.1%
Fuel Poverty (The percentage of households in an area that experience fuel poverty based on the "Low income, high cost" methodology)
There is compelling evidence that the drivers of fuel poverty (low income, poor energy efficiency and energy prices) are strongly linked to living at low temperatures (Wilkinson et al 2001) and the recent Marmot Review Team report showed that low temperatures are strongly linked to a range of negative health outcomes.
Available via Public Health England (reference 1.17)
Reduce from 8.5%
Social Isolation There is a link between loneliness and poor mental and physical health. A key element of the Government’s vision for social care is to tackle loneliness and social isolation, supporting people to remain connected to their communities and to develop and maintain connections to their friends and family. This measure will draw on self-reported levels of social contact as an indicator of social isolation for both users of social care and carers.
Air Pollution (Fraction of all-cause adult mortality attributable to anthropogenic particulate air pollution)
Poor air quality is a significant public health issue. The burden of particulate air pollution in the UK in 2008 was estimated to be equivalent to nearly 29,000 deaths at typical ages and an associated loss of population life of 340,000 life years lost.
Inclusion of this indicator in the Public Health Outcomes Framework will enable Directors of Public Health to prioritise action on air quality in their local area to help reduce the health burden from air pollution.
• Measured as fine particulate matter (PM2.5)• Available through via the Public Health
England (reference 3.01)
Reduce from 5%
Excess winter deaths All ages (3 years)
Available via Public Health England (reference 4.15iii)
Reduce from 16.3%
11.0
Hea
lth
and
Wel
lbei
ng

63Kent State of the Environment
11.4 CURRENT STATE OF PLAY IN KENT
In general the health of Kent’s residents is better than average for England and deprivation lower than average. However over 18%, some 49,700 children in the county live in poverty.
The role Kent’s environment plays in positive health and wellbeing is highlighted the Kent Joint Health and Wellbeing Strategy Outcomes for Kent which is underpinned by the JSNA. It identifies that a sustainable health and care system requires an integrated approach. It should consider the economic, social and environmental impacts of our decision making to ensure the delivery of health and social care in Kent is sustainable and equitable, with outcomes befitting residents now and into the future.
This means considering a range of factors that affect short and long term physical and mental health such as access to green space, climate change resilience, air quality, housing, transport, inequality and employment. This is achieved by Kent partners working collaboratively such as through the Health and Sustainability online planning toolkit http://healthsustainabilityplanning.co.uk/.
11.0
Hea
lth
and
Wel
lbei
ng

64Kent State of the Environment
12.0 ReferencesAldersgate (2014): An Economy that works, Aldersgate Group, 7th May 2014http://aneconomythatworks.org/content/uploads/2014/12/AETW-Report-LowRes.pdf
ARCH (2012): The Kent Habitat Survey 2012, undertaken as part of the European Interreg IV 2-Seas project Assessing Regional Changes in Habitat (ARCH) Project http://www.archnature.eu/
DECC (2014): Fuel Poverty Report: annual report on statistics 2014, the Department of Energy and Climate (DECC), UK Central Government, 12 June 2014 https://www.gov.uk/government/collections/fuel-poverty-statistics
DECC (2014b): Local authority carbon dioxide emissions estimates 2012, the Department of Energy and Climate (DECC), UK Central Government, 26 June 2014 https://www.gov.uk/government/statistics/local-authority-emissions-estimates
DECC (2013): Reducing and managing waste, the Department of Energy and Climate (DECC), UK Central Government https://www.gov.uk/government/policies/reducing-and-managing-waste
DECC (2012): Increasing the use of low-carbon technologies, the Department of Energy and Climate (DECC), UK Central Government https://www.gov.uk/government/policies/increasing-the-use-of-low-carbon-technologies
DECC (2011a): Methane GHG Inventory Summary Factsheet, The Department for Energy and Climate Change (DECC), UK Central Government, October 2011 https://www.gov.uk/government/uploads/system/uploads/attachment_data/file/48424/5556-methane-factsheet.pdf
DECC (2011b): The Carbon Plan - reducing greenhouse gas emissions, a Corporate Report, the Department of Energy and Climate (DECC), UK Central Government, Updated 29th April 2013 https://www.gov.uk/government/publications/the-carbon-plan-reducing-greenhouse-gas-emissions--2
DEFRA (2013): Improving water quality, Policy webpages, Department for Environment, Food and Rural Affairs (DEFRA), UK Central Government, Updated 20th January 2015https://www.gov.uk/government/policies/improving-water-quality
DEFRA (2011): Biodiversity 2020: A strategy for England’s wildlife and ecosystem services, The Department for Environment, Food and Rural Affairs (DEFRA), UK Central Government,
19 August, 2011 https://www.gov.uk/government/uploads/system/uploads/attachment_data/file/69446/pb13583-biodiversity-strategy-2020-111111.pdf
Environment Agency (2013): Waste Management 2013 in England: summary, The Environment Agency https://www.gov.uk/government/statistics/waste-management-for-england-2013
Environment Agency (2012): State of Water in Kent – Kent Water Summit, The Environment Agency, 21 August 2012 https://shareweb.kent.gov.uk/Documents/environment-and-planning/environment-and-climate-change/water%20summit/state-of-water.pdf
Environment Agency (2010): State of the Environment - South East England, The Environment Agency, February 2010 http://www.secouncils.gov.uk/wpcontent/uploads/pdfs/_publications/1_SoE_Feb_2010.pdf
European Commission (2010): Europe 2020 – Europe’s growth strategy - European Commission http://ec.europa.eu/europe2020/index_en.htm
European Commission (2014): What Is an SME? The European Commission – Enterprise and Industry http://ec.europa.eu/enterprise/policies/sme/facts-figures-analysis/sme-definition/index_en.htm
GBC (2013): Gravesham Borough Council (GBC) Home Energy Conservation Authority (HECA) Reporting 2013http://www.gravesham.gov.uk/services/housing/energy-efficiency
IPCC (2014): Climate Change 2014 Synthesis Report, Intergovernmental Panel on Climate Change (IPCC) http://www.ipcc.ch/report/ar5/syr/
KCC (2014a): 2013 Mid-Year Population Estimates: Total population of Kent authorities, Business Intelligence Statistical Bulletin, Research and Evaluation, Kent County Council, July 2014 http://www.kent.gov.uk/__data/assets/pdf_file/0018/14724/Mid-year-population-estimates-total-population-of-Kent-bulletin.pdf
KCC (2014b): What’s causing Kent’s population growth? Business Intelligence Statistical Bulletin, Research and Evaluation, Kent County Council, July 2014 http://www.kent.gov.uk/__data/assets/pdf_file/0004/8149/Whats-causing-Kents-

65Kent State of the Environment
population-growth.pdf
KCC (2014c): 2013 Mid-Year Population Estimates: Age and gender profile, Business Intelligence Statistical Bulletin, Research and Evaluation, Kent County Council, July 2014 http://www.kent.gov.uk/__data/assets/pdf_file/0019/14725/Mid-year-population-estimates-age-and-gender-profile-bulletin.pdf
KCC (2014d): Business Register & Employment Survey (BRES) results for 2013, Research and Evaluation, Kent County Council, November 2014 http://www.kent.gov.uk/__data/assets/pdf_file/0017/8180/Business-Register-and-Employment-Survey-BRES-2012.pdf
KCC (2014e): Life expectancy in Kent, Research and Evaluation, Kent County Council, December 2014 http://www.kent.gov.uk/__data/assets/pdf_file/0017/8180/Business-Register-and-Employment-Survey-BRES-2012.pdf
KCC (2013a): Business Demography 2011, Business Intelligence Statistical Bulletin, Research and Evaluation, Kent County Council, January 2013 http://www.kent.gov.uk/__data/assets/pdf_file/0007/8179/Business-demography.pdf
KCC (2011): Carbon dioxide (CO2) emissions in Kent (Known as the carbon footprint), Year ending
October 2009, Business Intelligence Statistical Bulletin, Research and Evaluation, Kent County Council, December 2011 http://www.kent.gov.uk/__data/assets/pdf_file/0010/8794/Carbon-dioxide-CO2-emissions-in-Kent.pdf
KCC (2009): A Local Climate Impacts Profile for Kent (LCLIP): A summary of impacts from past severe weather event 1996 – 2010, Kent County Council, Sustainable Business and Communities
KCC (2008): The Older People of Kent: Who we are, What we do, What we think, Kent County Council, November 2008 http://www.kent.gov.uk/__data/assets/pdf_file/0003/8571/Older-people-in-Kent.pdf
KCC (2004): The Landscape Assessment of Kent, prepared on behalf of Kent County Council by Jacob Babtie, October 2004 https://shareweb.kent.gov.uk/Documents/environment-and-planning/Wildlife%20and%20landscapes/Landscape%20Assessment%20of%20Kent%20October%202004.pdf
Kent Housing Group (2011): Better Homes: localism, aspiration and choice - A Housing Strategy
for Kent and Medway, Kent Housing Group, May 2011 http://www.kent.gov.uk/__data/assets/pdf_file/0003/6177/Better-homes-localism-aspiration-and-choice.pdf
Kent Property Guide (2013): 2013 Kent Property Market: The annual guide to investment & development in Kent, published by Kent County Council, Caxtons and Locate in Kent http://www.kentpropertymarket.com/wp-content/uploads/2013/10/brochure_2013.pdf
JSNA (2014): Kent Joint Strategic Needs Assessment (JSNA, 2014) Sustainability Chapter, Kent County Council (Public Health, Planning and Environment Division, Families and Social Care, NHS, the Kent and Medway Air Quality Partnership, the Local Nature Partnership and Kent Environment Strategy Executive Officers Group),6 January 2014 http://www.kmpho.nhs.uk/JSNA, 2014/sustainability/
Public Health England: Public Health Outcomes Framework, Public Health England (PHE), UK Central Government http://www.phoutcomes.info/public-health-outcomes-framework#gid/1000043/pat/6/ati/102/page/4/par/E12000008/are/E10000016
REAP (2013): Renewable Energy Action Plan (REAP) – An action plan for delivering opportunities 2013-2018, this is a multi-partner action plan with lead contact as Kent County Council http://www.kent.gov.uk/about-the-council/strategies-and-policies/environment-waste-and-planning-policies/environmental-policies/renewable-energy
Regeneris (2012): Low Carbon Kent: Developing an evidence base for opportunities in the low carbon economy, a report by Regeneris Consulting for Kent County Council, Sustainable Business and Communities, May 2012
Ricardo-AEA (2013): Kent and Medway Air Quality Monitoring Network Annual Report 2013, a report for Medway Council on behalf of the Kent and Medway Air Quality Monitoring Network http://www.kentair.org.uk/documents/KMAQMN_2013_Issue_1_2-7-14.pdf
SWIMS (2013): Monitoring the impacts of severe weather – SWIMS Event Summary Report for Kent & Medway Winter 2013 -14, Kent County Council, Sustainable Business and Communities http://www.kent.gov.uk/business/Business-and-the-environment/severe-weather-impacts-monitoring-system-swims
SWIMS (2012): Monitoring the impacts of severe weather – SWIMS event summary report, January to December 2012, Kent County Council, Sustainable Business and Communities http://www.kent.gov.uk/business/Business-and-the-environment/severe-weather-impacts-monitoring-system-swims

KentENVIRONMENTStrategy
This leaflet is available in alternative formats and can be explained in a range of languages. Please contact [email protected]