keeping businesses moving - bunzl/media/files/b/bunzl-plc/reports-and-presentations/... · keeping...
TRANSCRIPT

Annual Report 2014KEEPING BUSINESSES MOVING

We are a focused and successful international distribution and outsourcing group keeping businesses moving across the Americas, Europe and Australasia.
STRATEGIC REPORT01 Financial highlights02 Group at a glance04 Chairman’s statement08 Business model and strategy10 Organic growth11 Operating model efficiencies12 Acquisition growth14 Key performance indicators18 Chief Executive’s review30 Financial review34 Principal risks and uncertainties37 Corporate responsibility
DIRECTORS’ REPORT42 Board of directors43 Corporate governance report48 Audit Committee report 52 Directors’ remuneration report 73 Other statutory information
FINANCIAL STATEMENTS76 Consolidated income statement77 Consolidated statement of
comprehensive income78 Consolidated balance sheet79 Consolidated statement
of changes in equity80 Consolidated cash flow
statement81 Notes113 Company balance sheet114 Notes to the Company financial
statements120 Statement of directors’
responsibilities121 Independent auditors’ report
to the members of Bunzl plc127 Five year review128 Shareholder information
The Annual Report can be downloaded online. To find out more visit www.bunzl.com
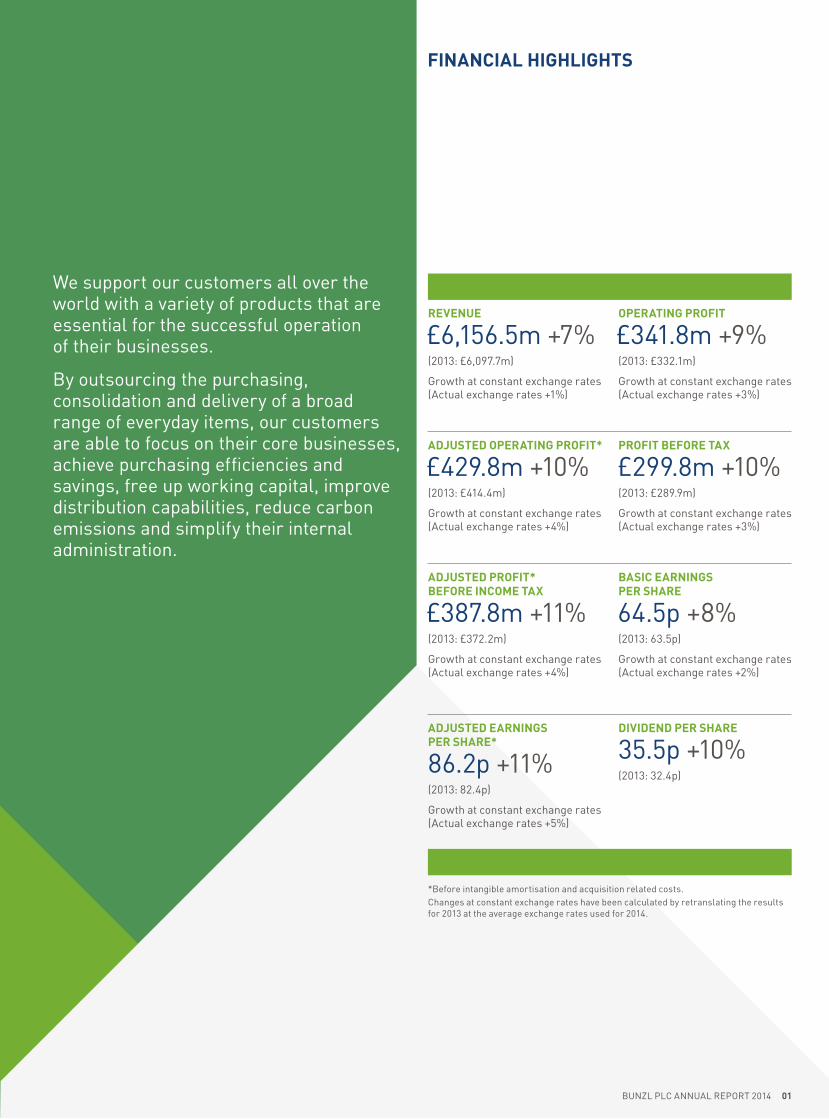
We support our customers all over the world with a variety of products that are essential for the successful operation of their businesses.
By outsourcing the purchasing, consolidation and delivery of a broad range of everyday items, our customers are able to focus on their core businesses, achieve purchasing efficiencies and savings, free up working capital, improve distribution capabilities, reduce carbon emissions and simplify their internal administration.
REVENUE
£6,156.5m +7%(2013: £6,097.7m)
Growth at constant exchange rates (Actual exchange rates +1%)
OPERATING PROFIT
£341.8m +9%(2013: £332.1m)
Growth at constant exchange rates (Actual exchange rates +3%)
ADJUSTED OPERATING PROFIT*
£429.8m +10%(2013: £414.4m)
Growth at constant exchange rates (Actual exchange rates +4%)
PROFIT BEFORE TAX
£299.8m +10%(2013: £289.9m)
Growth at constant exchange rates (Actual exchange rates +3%)
ADJUSTED PROFIT* BEFORE INCOME TAX
£387.8m +11%(2013: £372.2m)
Growth at constant exchange rates (Actual exchange rates +4%)
BASIC EARNINGS PER SHARE
64.5p +8%(2013: 63.5p)
Growth at constant exchange rates (Actual exchange rates +2%)
ADJUSTED EARNINGS PER SHARE*
86.2p +11%(2013: 82.4p)
Growth at constant exchange rates (Actual exchange rates +5%)
DIVIDEND PER SHARE
35.5p +10%(2013: 32.4p)
* Before intangible amortisation and acquisition related costs.Changes at constant exchange rates have been calculated by retranslating the results for 2013 at the average exchange rates used for 2014.
BUNZL PLC ANNUAL REPORT 2014 01
FINANCIAL HIGHLIGHTS

GROUP AT A GLANCE
We provide a one-stop-shop distribution and outsourcing service across 27 countries, supplying a broad range of internationally sourced non-food products to a variety of market sectors.
Where we operate
28% 13% 11% 12% 26%
FOODSERVICENon-food consumables, including food packaging, disposable tableware, guest amenities, catering equipment, cleaning products and safety items, to hotels, restaurants, contract caterers, food processors and the leisure sector.
GROCERY Goods not for resale (items which are used but not actually sold), including food packaging, films, labels and cleaning and hygiene supplies, to grocery stores, supermarkets and retail chains.
CLEANING & HYGIENECleaning and hygiene materials, including chemicals and hygiene paper, to cleaning and facilities management companies and industrial and healthcare customers.
RETAIL Goods not for resale, including packaging and other store supplies and a full range of cleaning and hygiene products, to department stores, boutiques, office supply companies, retail chains and home improvement chains.
SAFETYA complete range of personal protection equipment, including hard hats, gloves, boots, ear and eye protection and other workwear, to industrial and construction markets.
Our market sectors% OF 2014 REVENUE
NORTH AMERICA• Revenue increased 5%
at constant exchange rates.
• Adjusted operating profit* up 5% at constant exchange rates.
• Operating margin* unchanged at 6.3%.
• Return on operating capital down from 61.2% to 59.6%.
CONTINENTAL EUROPE• Revenue up 5% at constant
exchange rates.
• Adjusted operating profit* increased 12% at constant exchange rates.
• Improvement in operating margin* from 8.4% to 9.0%.
• Return on operating capital up from 47.5% to 52.3%.
Read more about North America on page 20 Read more about Continental Europe on page 22
REVENUE
£3,372.1mREVENUE
£1,146.3mADJUSTED OPERATING PROFIT*
£211.1m ADJUSTED OPERATING PROFIT*
£103.2m
*Before intangible amortisation and acquisition related costs.
55%of 2014 revenue
19%of 2014 revenue
02 BUNZL PLC ANNUAL REPORT 2014

3% 7%
HEALTHCAREDisposable healthcare consumables, including gloves, swabs, gowns and bandages, and other healthcare related equipment to hospitals, care homes and other facilities serving the healthcare sector.
Market environmentGROWTH DRIVERS• Increasing trend to
outsourcing.
• Global legislative trends for health & safety and the environment.
• Favourable demographics in healthcare.
• Underlying growth in key sectors including:
− Foodservice – away from home;
− Cleaning & hygiene – away from home;
− Safety – increased legislation;
− Healthcare – demographics.
COMPETITIVE ADVANTAGE• No one does what we do,
on our scale, across our international markets.
• Expertise in making successful acquisitions.
• Global sourcing capabilities.
• Bunzl’s national distribution networks.
CUSTOMERS• Strong national, regional
and local customer base.
• Working with national and international leading companies.
• Aligned with customer growth.
• Focus on customer service.
OTHERA variety of product ranges to other end user markets such as government and education establishments.
UK & IRELAND• Revenue increased 6% at
constant exchange rates.
• Adjusted operating profit* up 12% at constant exchange rates.
• Increase in operating margin* from 7.0% to 7.4%.
• Return on operating capital improved from 98.8% to 111.7%.
REST OF THE WORLD• Revenue up 21% at constant
exchange rates.
• Adjusted operating profit* increased 24% at constant exchange rates.
• Increase in operating margin* from 9.7% to 9.9%.
• Return on operating capital down from 47.1% to 41.8%.
Read more about UK & Ireland on page 24 Read more about Rest of the World on page 26
REVENUE
£1,078.5mREVENUE
£559.6mADJUSTED OPERATING PROFIT*
£80.1mADJUSTED OPERATING PROFIT*
£55.5m
17%of 2014 revenue
9%of 2014 revenue
BUNZL PLC ANNUAL REPORT 2014 03

RESULTSDespite mixed macroeconomic conditions persisting throughout the year in many of the countries where we operate and challenging market conditions continuing to affect some of our sectors, I am pleased to report another excellent set of results at constant exchange rates. Significant currency translation movements, principally in the US dollar and euro, reduced the constant exchange Group growth rates by between 6% and 7%.
Group revenue increased to £6,156.5 million (2013: £6,097.7 million), and adjusted operating profit before intangible amortisation and acquisition related costs was £429.8 million (2013: £414.4 million). Adjusted earnings per share before intangible amortisation and acquisition related costs were 86.2p (2013: 82.4p).
At constant exchange rates revenue increased by 7%, due to organic growth of 3% combined with the impact of acquisitions, and adjusted operating profit rose by 10% as the Group operating margin improved from 6.8% to 7.0%. Adjusted earnings per share were up 11%.
DIVIDENDThe Board is recommending a final dividend of 24.5p. This brings the total dividend for the year to 35.5p, up 10% compared to 2013. Shareholders will again have the opportunity to participate in our dividend reinvestment plan.
STRATEGYOur consistent and proven strategy of developing the business through organic growth, consolidating our markets through focused acquisitions and continuously improving the efficiency
of our operations has delivered another successful year of growth for the Group with all four business areas ahead of 2013 in both revenue and profits at constant exchange rates.
Organic growth is achieved by continually redefining and deepening our commitment to our customers. By enabling our customers to outsource to Bunzl the purchasing, consolidation and distribution of a broad range of goods not for resale, they are able to benefit by achieving purchasing efficiencies and savings while at the same time freeing up working capital, improving their distribution capabilities, reducing carbon emissions and simplifying their internal administration.
Acquisition activity continued at a good pace throughout 2014. Including Tillman, which we agreed to acquire in December 2014 and completed at the beginning of January 2015, we made 17 acquisitions with a total committed spend of £211 million, thereby adding annualised revenue of over £220 million. These acquisitions have helped to strengthen our position in many of the market sectors that we serve.
INVESTMENTOver time we have steadily invested in the business to support our growth strategy and to expand and enhance our asset base. During the year we have extended and improved our warehouses and opened new ones, both as a result of acquisitions and by consolidating our existing warehouse footprint. Our ability to serve our customers in the most efficient and appropriate manner is critical to our success and, as a result, we continuously upgrade our IT systems as we integrate new businesses into the Group and increase the functionality of our existing operations, thereby enhancing our customer offering.
1413121110090806 0705
2.93.3
3.64.2
4.6 4.85.1
5.4
6.1 6.2
1413121110090806 0705
203226
243281 296 307
336 352
414 430
04 BUNZL PLC ANNUAL REPORT 2014
CHAIRMAN’S STATEMENT
Revenue £bn05 continuing operations
£6.2bnAdjusted operating profit* £m05 continuing operations* Before amortisation and acquisition related costs.
£430m

CORPORATE RESPONSIBILITYSustainable business practice is important to Bunzl and refining our processes and operations to ensure improvements in this area is ongoing. Our ability to measure the improvement in our performance relies on the availability of high quality data for our key indicators and in this regard our environmental and accident data are now both subject to external assurance. We continue to engage with our suppliers to encourage them to adopt appropriate sustainable practices and ensure compliance with regulations. In this connection, our quality assurance/quality control team based in Shanghai regularly undertakes supplier audits to assist our suppliers in meeting our required standards.
EMPLOYEESAlthough we are a large group, we strive to preserve the advantages and style of a small business, maintaining a flat organisation structure with decentralised decision making and clear lines of responsibility. In this way we are able to provide a responsive and tailored service offering to our customers. Bunzl is a service business and accordingly our employees across the world are our ambassadors. We are therefore very grateful for the knowledge, experience and continued enthusiasm shown by our employees who have played an important part in our strong performance. Further, we have welcomed a number of new employees through acquisitions we have made. In our view, the retention of employees post acquisition is key to the successful integration of newly acquired businesses and to bring in new ideas and improved processes that can then be applied elsewhere in the Group.
BOARDPeter Johnson, who has served as a non-executive director since 2006, will be retiring after the Company’s Annual General Meeting in April 2015. During his time he has also served as Chairman of the Remuneration Committee and senior independent director. We thank Peter for his guidance and wise counsel over many years and he will leave the Board with our gratitude and best wishes for the future.
Vanda Murray was appointed as a non-executive director with effect from February 2015. Based in the UK, Vanda is presently a non-executive director of Exova Group plc, Manchester Airports Holdings Limited, Microgen plc, where she is Chair of the Remuneration Committee, and Fenner PLC, where she is the senior independent director. She was previously Chief Executive Officer of Blick plc from 2001 to 2004 and subsequently the UK Managing Director of Ultraframe PLC from 2004 to 2006. She was appointed OBE in 2002 for Services to Industry and to Export and has over 20 years of senior management experience across a range of industrial, manufacturing and support services sectors in Europe, the US and Asia which will be of great value to Bunzl as we continue to expand and develop. Upon Peter’s retirement in April, Vanda will become Chair of the Remuneration Committee and David Sleath, who was appointed as a non-executive director in September 2007 and is Chairman of the Audit Committee, will assume the role of senior independent director.
Philip RogersonChairman 23 February 2015
Read more about our key performance indicators on pages 14 and 15
1413121110090806 0705
38.2 41.1 44.451.8
55.459.7
67.6 70.6
82.486.2
1413121110090806 0705
643710 742 757
675777
884
1,167
1,450
1,820
443 578 627 542 482 616 676852
1,014
1,367
BUNZL PLC ANNUAL REPORT 2014 05
‘ As a focused organisation we have once again demonstrated the strength of our customer proposition and shown our ability to grow and develop across our international portfolio of businesses.’
Adjusted earnings per share p05–12 restated on adoption of IAS 19 (revised 2011)
86.2pShare price range p
1,367p – 1,820p

ADAPTING TO CHANGING MARKET CONDITIONS AND CUSTOMER NEEDS
06 BUNZL PLC ANNUAL REPORT 2014

We do business in multiple regions within varied market sectors which makes us adaptable enough to withstand shifts and changes in demand. Growing both organically and through acquisitions, we are a balanced and resilient business.
6+ SECTORSBALANCED PORTFOLIO
Read more about our acquisition growth on pages 12 and 13
ADAPTING TO CHANGING MARKET CONDITIONS AND CUSTOMER NEEDS
BUNZL PLC ANNUAL REPORT 2014 07

ONE-STOP-SHOP FOR NON-FOOD CONSUMABLES
CUSTOMER BENEFITS
SHAREHOLDER RETURNS
RELIABILITY
SHAREHOLDER RETURNS
RESOURCES
SHAREHOLDER RETURNS
RELIABILITY
RESOURCES
KNOW
LEDG
E
INVESTMENTS
EXPERTI
SEE
FFICIENCIES
SOUR
CECONSOLIDATE
DELI VER
08 BUNZL PLC ANNUAL REPORT 2014
BUSINESS MODEL AND STRATEGY
For many years we have followed a well established and successful business model and pursued a consistent and proven strategy. By doing so we have delivered strong growth across our selected international markets as we have looked to develop both in existing and new geographies.
WE SOURCEWe source and procure branded, own brand and unbranded products globally, working with both multinational and local suppliers, to ensure that our customers have access to the best and most suitable products to meet their needs.
WE CONSOLIDATEBy applying our resources and consolidating a broad range of products into our extensive warehousing infrastructure, we are able to offer our customers a one-stop-shop solution which reduces or eliminates many of the hidden costs of self-distribution.
WE DELIVERWe offer several delivery options, including direct store delivery, cross dock and warehouse replenishment programmes, on a local, regional, national and international basis, to ensure that our customers get their products when and where they are needed.
SHAREHOLDER RETURNSOur shareholders have enjoyed significant returns on their investment over time with sustained growth in Bunzl’s share price and year-on-year increases in dividends.
CUSTOMER BENEFITSOur customers benefit from a lower cost of doing business by reducing or eliminating many of the hidden costs of in-house procurement and distribution and reducing carbon emissions.
Our business model
BUNZL PLC ANNUAL REPORT 2014 09
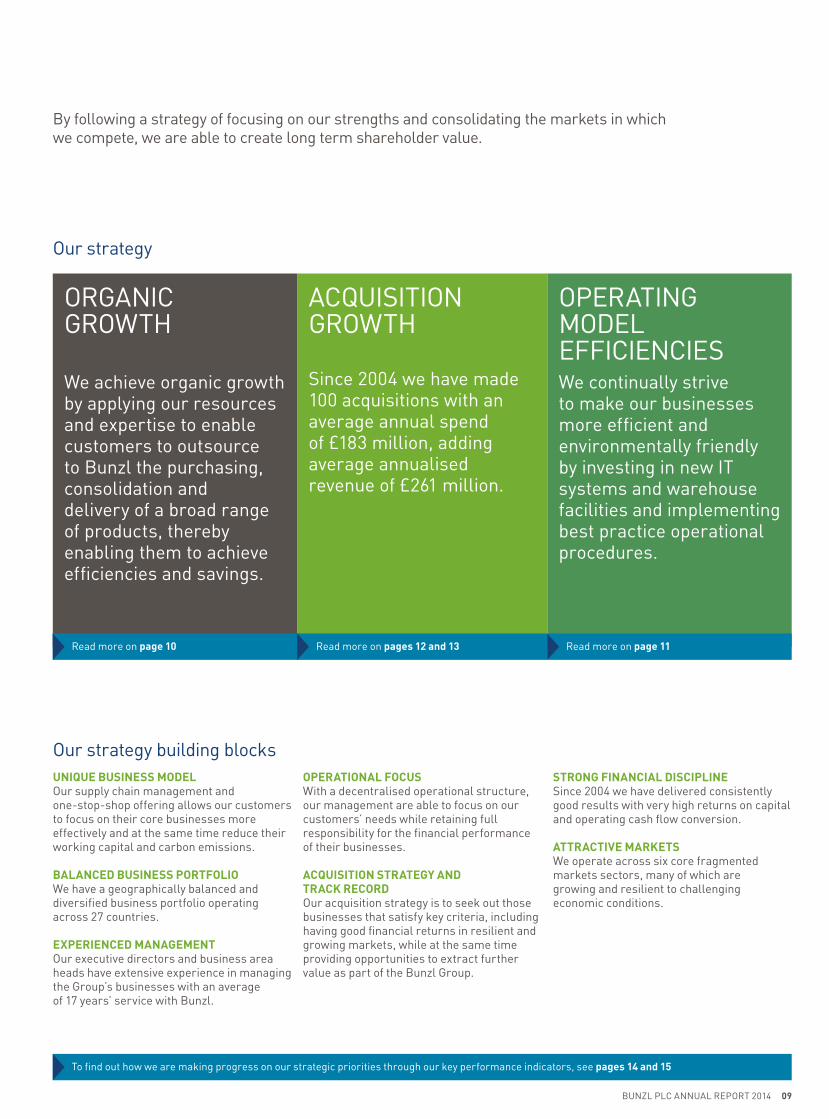
By following a strategy of focusing on our strengths and consolidating the markets in which we compete, we are able to create long term shareholder value.
Our strategy building blocks
Our strategy
UNIQUE BUSINESS MODELOur supply chain management and one-stop-shop offering allows our customers to focus on their core businesses more effectively and at the same time reduce their working capital and carbon emissions.
BALANCED BUSINESS PORTFOLIOWe have a geographically balanced and diversified business portfolio operating across 27 countries.
EXPERIENCED MANAGEMENT Our executive directors and business area heads have extensive experience in managing the Group’s businesses with an average of 17 years’ service with Bunzl.
OPERATIONAL FOCUS With a decentralised operational structure, our management are able to focus on our customers’ needs while retaining full responsibility for the financial performance of their businesses.
ACQUISITION STRATEGY AND TRACK RECORD Our acquisition strategy is to seek out those businesses that satisfy key criteria, including having good financial returns in resilient and growing markets, while at the same time providing opportunities to extract further value as part of the Bunzl Group.
STRONG FINANCIAL DISCIPLINESince 2004 we have delivered consistently good results with very high returns on capital and operating cash flow conversion.
ATTRACTIVE MARKETSWe operate across six core fragmented markets sectors, many of which are growing and resilient to challenging economic conditions.
ACQUISITION GROWTH
Since 2004 we have made 100 acquisitions with an average annual spend of £183 million, adding average annualised revenue of £261 million.
OPERATING MODEL EFFICIENCIESWe continually strive to make our businesses more efficient and environmentally friendly by investing in new IT systems and warehouse facilities and implementing best practice operational procedures.
ORGANIC GROWTH
We achieve organic growth by applying our resources and expertise to enable customers to outsource to Bunzl the purchasing, consolidation and delivery of a broad range of products, thereby enabling them to achieve efficiencies and savings.
Read more on page 10
To find out how we are making progress on our strategic priorities through our key performance indicators, see pages 14 and 15
Read more on pages 12 and 13 Read more on page 11

10 BUNZL PLC ANNUAL REPORT 2014
Case study – product development
Smart, simple, safe solutionsWHAT BUNZL DID TO GROW THE BUSINESS FoodHandler is a leading supplier of high quality disposable products to the foodservice sector in the US that was purchased by Bunzl in 2012. Through the use of patented and proprietary technology, over the last three years FoodHandler has increased its sales through the design and development of a variety of new, innovative products. These include hybrid technology gloves and a single glove dispensing system, that have improved food safety standards by cutting down on cross-contamination, and antimicrobial paper that extends the shelf life of fresh food by two to three days. These types of creative sales and marketing initiatives have enabled FoodHandler to grow and enhance its penetration in the key markets that it serves.
Case study – customer development
Supporting customers as they expandWHAT BUNZL DID TO GROW THE BUSINESS Bunzl began providing outsourcing solutions to a large facilities management company in the UK in 2002. During the first year of operation, annual revenue reached £5 million as we provided cleaning and hygiene supplies in support of their contract cleaning business. Over the last 12 years, as the customer has developed and grown its business, we have been able to extend our own business by expanding the product range supplied into catering and healthcare related products. By doing so, we have steadily increased our annual sales to over £18 million today, with in excess of 85,000 deliveries being made each year to more than 8,000 delivery points.
ORGANIC GROWTH
Growing Bunzl organically, either by expanding and developing our business with existing customers or by gaining new business with additional customers, is an integral part of our strategy to enhance shareholder value.
‘ We provide our customers with peace of mind by listening to their needs and understanding their requirements whilst providing dedicated account management and exceptional service.’
Paul Budge Managing Director UK & Ireland
ALIGNED WITH CUSTOMER GROWTH
BUILDING RELATIONSHIPSOne of the greatest opportunities for organic sales growth comes from building long term relationships with existing customers. By being both flexible and reliable and by providing excellent levels of service, we gain our customers’ trust and confidence to meet their future needs over a sustained period of time through a broad and effective product and service offering.
ACQUIRING NEW CUSTOMERSWe are constantly striving to expand and gain market share by winning business with new customers. Our well established business model allows us to show potential customers that we can apply our resources and expertise to reduce or eliminate many of the hidden costs of in-house procurement and distribution or satisfy their requirements more cost-effectively than their current suppliers.
EXPANDING OUR OFFERINGOnce we have established a good relationship with a particular customer and successfully demonstrated that we are able to improve their operational efficiency, we endeavour to increase our levels of business with that customer by extending the range of products and services we supply. This can be achieved by expanding our offering to other parts of their business, where we might not have previously been a recognised supplier, or by increasing the type and variety of products which are available to them, whether branded or own brand. We do this either by extending the range of products within a particular category or adding new categories of products to those already supplied, often by optimising cross-selling opportunities across other Bunzl businesses.
EXPANDING OUR PRODUCT RANGE

BUNZL PLC ANNUAL REPORT 2014 11
WAREHOUSE LIGHTINGRecent improvements in lighting technology have meant we are able to make significant savings in electricity costs by installing energy efficient and environmentally friendly lighting systems either by retrofitting existing warehouses or requiring landlords of new facilities to provide such lighting as part of the warehouse fit out.
ROUTING AND SAFETY SYSTEMSBy installing state-of-the-art routing and safety systems in our facilities and delivery vehicles, we are able to plan our delivery routes to minimise the distances travelled and encourage safe and efficient driving practices, thereby reducing fuel and other transport costs which represent a significant part of our operating expenses.
CONSOLIDATING WAREHOUSESAs warehouse lease terms come to an end, we are often able to consolidate our warehouse footprint in a particular area by closing a number of smaller and less efficient facilities and relocating our operations into a single, larger and more efficient building while at the same time improving the working conditions for our employees.
GLOBAL PURCHASINGWith the annual cost of the goods we sell exceeding £4.6 billion, our global scale provides substantial purchasing synergies with our international suppliers which many of our smaller competitors are unable to achieve and which we are able to share with our customers in the form of more competitive selling prices.
SHARING BEST PRACTICEAs we have continued to expand internationally, we are increasingly making use of our collective resources, experience and expertise to share best practice across the Group and collaborate between our different businesses in order to maximise our potential opportunities to grow and develop in the most cost-effective way.
IT SYSTEMSSystems are critical to our ability to serve our customers in the most cost-effective and efficient manner and accordingly we are continually improving and upgrading our IT systems in order to increase functionality and enhance customer service and thereby maintain our leadership position in the marketplace.
OPERATING MODEL EFFICIENCIES
We are continually looking to refine and develop our processes and procedures to make our operations more efficient. By doing so, we are able to gain a competitive advantage, by offering our customers more cost-effective solutions, while at the same time improve our profitability.
SAFETY SCALE INVESTMENT
SAVINGS EFFICIENCIES DEVELOPMENT

12 BUNZL PLC ANNUAL REPORT 2014
ACQUISITIONS
Case study – Latin America
Extending the operational footprintWHAT BUNZL DID TO GROW THE BUSINESS Prior to 2008 our only business in Latin America was a relatively small operation serving the grocery sector in Mexico. Having conducted a detailed market study of the potential to develop our business more widely in the region, we entered the safety market in Brazil through the purchase of Prot-Cap in 2008 and strengthened our position in this sector with the acquisition of AM Supply in 2010 and Danny in 2011. Over the next two years we expanded our business in Brazil into the cleaning & hygiene and healthcare sectors while at the same time entering the foodservice sector in Mexico and extending our safety business into Chile, Colombia, Peru, Argentina and Mexico through the acquisition of Vicsa Safety. By the end of 2014 we had made 12 acquisitions in the region and now operate in six countries across four market sectors.
FOOTPRINT
ACQUISITION GROWTH
Expanding and developing the Group through acquiring businesses is also a key component of our growth strategy. Historically, approximately two thirds of our year-on-year increase in earnings has been achieved through an ongoing programme of focused and targeted acquisitions in both new and existing geographies.
Acquisition growth track recordCOMMITTED ACQUISITION SPEND £M ANNUALISED ACQUISITION REVENUE £M
Acquisition growth year by year
‘ Our ability to find the right targets in the right markets at the right time has enabled us to build a substantial regional business over the last seven years and establish a strong platform for future growth.’
Rodrigo Mascarenhas Managing Director Latin America
CONTINUING OUR GEOGRAPHIC EXPANSION
FROM 1 TO 6 COUNTRIES12 ACQUISITIONS SINCE 2008
2008 2014
COUNTRIES
YEAR
302
129
162
197
123 126
185
277295
211
6
141312111009080504 06 07
430
270
386
225
151 154204
281
518
223
27
141312111009080504 06 07
2004 200620052003 2007
12
2
22
8
21
9
18
7
14
7

BUNZL PLC ANNUAL REPORT 2014 13
Case study – Spain
Developing in a new countryWHAT BUNZL DID TO GROW THE BUSINESS Although we had progressively expanded our business in Continental Europe since 1994, we did not enter the Spanish market until 2007 with the acquisition of Iberlim, a cleaning and hygiene distributor based near Barcelona. Between 2008 and 2011 our business in Spain grew rapidly with two further acquisitions in the cleaning & hygiene sector, an entry into the foodservice sector and the purchase of two businesses serving the safety sector. Including Quirumed, a healthcare business based in Valencia which was acquired in January 2015, we have made seven acquisitions in Spain over the last eight years and now operate in four market sectors.
SECTOR SPLIT 2014 (PRO FORMA) Cleaning & Hygiene Safety Foodservice Healthcare
SECTOR ENTRY
Acquisition strategyKEY ACQUISITION PARAMETERSIn considering potential acquisition opportunities, we only target those businesses which meet the specific parameters that fit our business model and growth strategy. These include businesses:• that sell business to business (‘B2B’);• with a consolidated ‘not-for-resale’ product offering;• in resilient and growing markets;• with a fragmented customer base;• which operate in markets with scope for consolidation
and synergies;• whose products represent a small % of total customer spend;• that have opportunities for ‘own label’ products; and• with attractive financial returns.
ACQUISITION TYPESThere are two different types of acquisition that we undertake depending on whether we are already present in the country or market sector in which the target business is operating:• Anchor
− new geographies; or − new market sectors.
• Bolt-on − existing geographies; or − existing market sectors.
Opportunity for growthGROWTH IN EXISTING COUNTRIES Unlike many industries which are characterised by a relatively small number of large businesses, the markets in which we compete are very fragmented. As a result, there are numerous opportunities for us to develop through acquisitions in those countries where we already have a presence. We do this either by extending our existing operations in a particular market sector or by acquiring a business in a sector in which we do not currently operate within that country.
GROWTH IN NEW COUNTRIESIn 1992, the business which now comprises the continuing operations of the Bunzl Group was only operational in the US and Australia. By 1997 the business had expanded through acquisitions into seven countries and grew further to cover 12 countries by 2003. The development of the Group since then is shown in the timeline below. We are now a truly international business with operations in 27 countries but there are a number of potentially attractive countries where we do not yet have a presence. In evaluating whether to enter a new country through acquisition, we consider a number of different criteria including a detailed analysis of our market sectors, the local macroeconomic indicators and the ease of doing business in, and the political risks and business practices associated with, the particular country under review.
‘ After an initial anchor acquisition in 2007, which has been followed by the successful integration of six further bolt-on acquisitions, we have developed a national business in Spain with annual revenue in excess of €100 million.’
Frank van Zanten Managing Director Continental Europe
ACQUIRED BUSINESSES CONTINUE TO FEEL ‘LOCAL’
FROM 0 TO 4 SECTORS7 ACQUISITIONS SINCE 2007
YEAR
17%
38%
25%
20%
2007 2008 2011 2015
2009 201120102008 2012 20142013
23
7
23
2
23
9
23
10
27
13
27
11
27
17

Organic growth
Organic revenue growth %
Increase in revenue for the year excluding the impact of currency translation, acquisitions during the first 12 months of ownership and disposal of business.
Organic operating margin %
Current year operating margin excluding the impact of acquisitions during the first 12 months of ownership compared to the prior year operating margin restated at constant exchange rates.
Acquisition growth
Acquisition spend £m
Consideration paid and payable, together with net debt assumed, in respect of businesses acquired or agreed to be acquired during the year.
Annualised revenue from acquisitions £m
Estimated revenue which would have been contributed by acquisitions made or agreed to be made during the year if such acquisitions had been completed at the beginning of the relevant year.
Operating model efficiencies
Operating margin %
Ratio of adjusted operating profit (being operating profit before intangible amortisation, acquisition related costs and disposal of business) to revenue.
Return on average operating capital %
Ratio of adjusted operating profit (being operating profit before intangible amortisation, acquisition related costs and disposal of business) to the average of the month end operating capital employed, being tangible fixed assets, inventories and trade and other receivables less trade and other payables.
1412 1311
4.0
2.6
2.0
2.7
1412 1311
185
277295
211
1412 1311
6.6 6.6 6.8 7.0
1413
6.8 6.8
1412 1311
204
518
281
223
1412 1311
57.4 56.5 56.9 57.7
14 BUNZL PLC ANNUAL REPORT 2014
KEY PERFORMANCE INDICATORS
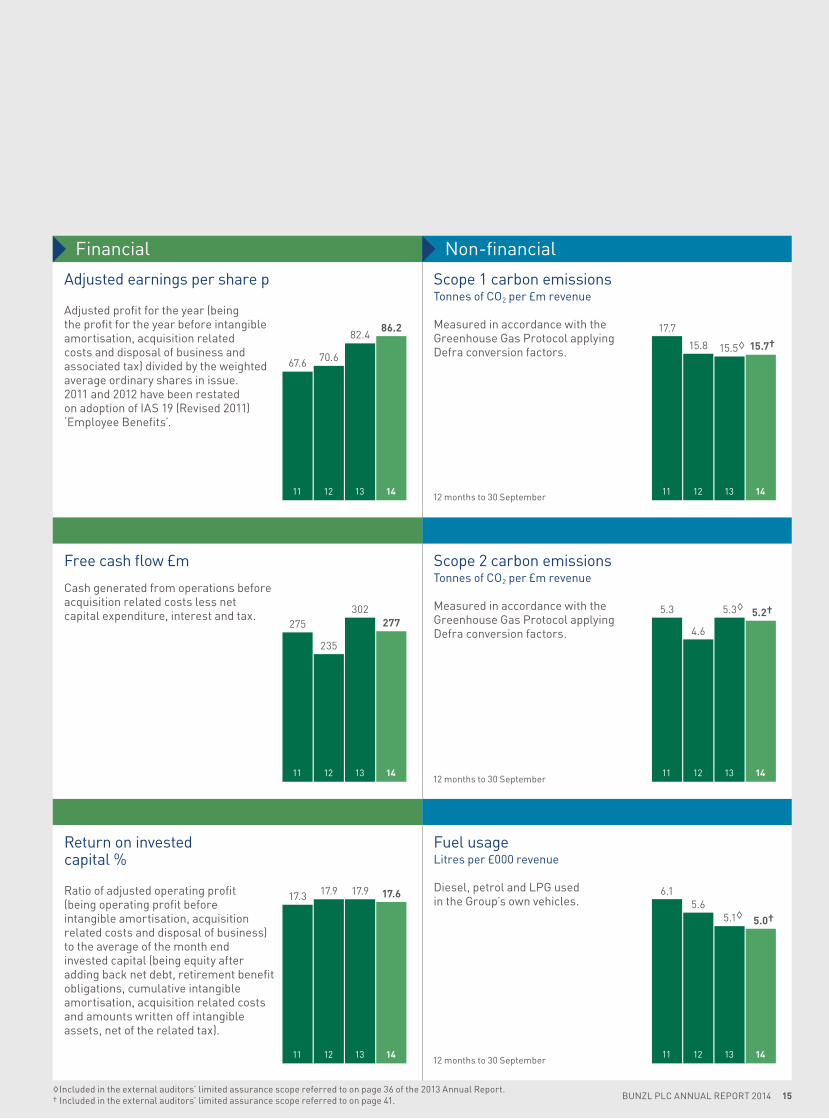
We use the following key performance indicators (‘KPIs’) to measure our progress in delivering the successful implementation of our strategy and to monitor and drive performance. These KPIs reflect our strategic priorities of developing the business through organic and acquisition led growth and improving the efficiency of our operations as well as other financial and environmental metrics.
Financial Non-financial
Adjusted earnings per share p
Adjusted profit for the year (being the profit for the year before intangible amortisation, acquisition related costs and disposal of business and associated tax) divided by the weighted average ordinary shares in issue. 2011 and 2012 have been restated on adoption of IAS 19 (Revised 2011) ‘Employee Benefits’.
Scope 1 carbon emissions Tonnes of CO2 per £m revenue
Measured in accordance with the Greenhouse Gas Protocol applying Defra conversion factors.
Free cash flow £m
Cash generated from operations before acquisition related costs less net capital expenditure, interest and tax.
Scope 2 carbon emissions Tonnes of CO2 per £m revenue
Measured in accordance with the Greenhouse Gas Protocol applying Defra conversion factors.
Return on invested capital %
Ratio of adjusted operating profit (being operating profit before intangible amortisation, acquisition related costs and disposal of business) to the average of the month end invested capital (being equity after adding back net debt, retirement benefit obligations, cumulative intangible amortisation, acquisition related costs and amounts written off intangible assets, net of the related tax).
Fuel usage Litres per £000 revenue
Diesel, petrol and LPG used in the Group’s own vehicles.
1412 1311
67.6 70.6
82.486.2
1412 1311
275
235
302277
1412 1311
17.3 17.9 17.9 17.6
1412 1311
17.7
15.8 15.5◊ 15.7†
1412 1311
5.3
4.6
5.3◊ 5.2†
1412 1311
6.15.6
5.1◊ 5.0†
12 months to 30 September
12 months to 30 September
12 months to 30 September
◊ Included in the external auditors’ limited assurance scope referred to on page 36 of the 2013 Annual Report.† Included in the external auditors’ limited assurance scope referred to on page 41. BUNZL PLC ANNUAL REPORT 2014 15

16 BUNZL PLC ANNUAL REPORT 2014
INCREASED EFFICIENCY THROUGH GLOBAL PURCHASING EXPERTISE

Read more about our operating model efficiencies on page 11
BUNZL PLC ANNUAL REPORT 2014 17
INCREASED EFFICIENCY THROUGH GLOBAL PURCHASING EXPERTISE
Our global network enables us to share expert knowledge for the benefit of all our businesses. Best practice increases efficiency across the Group, from achieving purchasing synergies to operating our warehouses in the most cost-effective way.
27 COUNTRIESSHARED KNOWLEDGE

18 BUNZL PLC ANNUAL REPORT 2014
CHIEF EXECUTIVE’S REVIEW
OPERATING PERFORMANCE2014 has proved to be another successful year for the Group due to a combination of good organic growth and the impact from acquisitions made in 2013 as well as those businesses purchased during the year.
The overall negative translation effect of currency movements has significantly decreased the reported Group growth rates of both revenue and profit. As in previous years, the operations, including the relevant growth rates, are reviewed below at constant exchange rates to remove the distorting impact of these currency movements. Changes in the level of revenue and profits at constant exchange rates have been calculated by retranslating the results for 2013 at the average rates used for 2014. Unless otherwise stated, all references in this review to operating profit are to adjusted operating profit (being operating profit before intangible amortisation and acquisition related costs).
Revenue increased 7% (1% at actual exchange rates) to £6,156.5 million and operating profit was £429.8 million, an increase of 10% (4% at actual exchange rates). The percentage growth in operating profit was greater than that of revenue due to the improvement in Group operating margin by 20 basis points to 7.0% as a result of increases in the operating margin in Continental Europe, UK & Ireland and Rest of the World.
In North America revenue rose 5% (down 1% at actual exchange rates) due to good organic revenue growth and the impact of acquisitions completed in both 2013 and 2014, while operating profit also increased 5% (down 1% at actual exchange rates). Revenue in Continental Europe rose 5% (unchanged at actual exchange rates) as a result of improved organic revenue growth and the impact of acquisitions, with operating profit up 12% (6% at actual exchange rates) as margins improved by 60 basis points to 9.0%. In UK & Ireland revenue was up 6% (6% at actual exchange rates) due to the impact of strong organic growth and acquisitions, but operating profit rose 12% at both constant and actual exchange rates as margins improved by a further 40 basis points during the year to 7.4%. In Rest of the World revenue increased 21% (6% at actual exchange rates) and operating profit was up 24% (8% at actual exchange rates), principally due to strong organic revenue growth and the substantial impact of acquisitions in Latin America.
Basic earnings per share were 8% higher (2% at actual exchange rates) at 64.5p. Adjusted earnings per share, after eliminating the effect of intangible amortisation and acquisition related costs, were 86.2p, an increase of 11% (5% at actual exchange rates). The return on average operating capital increased from 56.9% to 57.7% and return on invested capital was 17.6%, a slight decrease from 2013 as improved returns in the underlying business were offset by the adverse impact of recent acquisitions and exchange rates.
Our operating cash flow continued to be strong with the ratio of operating cash flow before acquisition related costs to operating profit at 95%. The net debt to EBITDA ratio increased marginally to 1.9 times compared to 1.8 times as at the previous year end.
Sustainable business practice is emphasised through our ongoing Corporate Responsibility (‘CR’) programmes. During the year we undertook a detailed employee survey and were pleased that over 70% of our employees responded and that 93% of respondents ‘enjoy working for Bunzl’. Our continued focus on operational excellence allows us to reduce our environmental impact by consolidating our warehouse footprint and, where necessary, introducing more sustainable practices to the businesses we acquire.
ACQUISITIONSAcquisitions are a key component of the Group’s growth strategy. Our committed spend in 2014 was £211 million as we made 17 transactions in total, including Tillman which we agreed to acquire in December 2014 and completed at the beginning of January 2015.
At the end of January 2014 we acquired Bäumer and its related company Protemo in Germany. The businesses had aggregated revenue of £10 million in 2014 and represent our first step into the cleaning and hygiene and healthcare sectors in Germany. Oskar Plast, which sells a variety of disposable packaging products to customers throughout the Czech Republic, including retail food chains, food processors and other distributors, was acquired in February and has expanded our operations in the Czech Republic. Revenue was £12 million in 2014.
In March we completed four acquisitions. Lamedid, a business principally engaged in the supply and distribution throughout Brazil of own label medical and healthcare consumable products to hospitals, clinics and laboratories as well as to distributors, had revenue in 2014 of £13 million. It has significantly increased the size of our healthcare business in Brazil, the Group having entered the healthcare sector there with the acquisition of Labor Import in 2013. Although relatively small, the purchase of Nelson Packaging, a business principally engaged in the distribution of packaging and cleaning and hygiene supplies to end users in the commercial and industrial market sectors, has provided additional scale to our business in New Zealand. Revenue was £3 million in 2014. Plast Techs, which is engaged in the sale of a variety of foodservice and cleaning and hygiene supplies to distributors throughout Southern California and had revenue of £14 million in 2014, complements our existing business in the region and has provided access to additional product lines. The purchase of Tecno Boga represents a significant expansion of our operations in Chile, being a country that we entered with the acquisition of Vicsa Safety at the end of 2012. The business is a leading supplier of own label protective footwear, principally to distributors, and had revenue of £23 million in 2014.
Allshoes, a distributor of both branded and own brand safety and work shoes to a variety of wholesalers as well as to retailers, principally in the Netherlands but also in Belgium, was acquired in May. It represents an important development for our safety business in the Netherlands as it extends our product range in the safety shoes sector and provides cross-selling opportunities with Majestic, our existing personal protection equipment business in the Benelux region which specialises in the supply of gloves and workwear.

BUNZL PLC ANNUAL REPORT 2014 19
Management teamManagers from across the Group meet regularly to review performance, discuss trends affecting our businesses and seek further opportunities for growth and competitive advantage.
Brian May Finance Director
Paul Hussey General Counsel & Company Secretary
Frank van Zanten Managing Director Continental Europe
Patrick Larmon President and CEO North America
Paul Budge Managing Director UK & Ireland
Rodrigo Mascarenhas Managing Director Latin America
Celia Baxter Director of Group Human Resources
Andrew Mooney Director of Corporate Development
Kim Hetherington Managing Director Australasia
Revenue in 2014 was £18 million. Also in May we acquired JPLUS, a Brazilian business with revenue of £12 million in 2014 principally engaged in the distribution of cleaning and hygiene supplies and disposable products to a variety of end user customers, particularly in the contract cleaning and healthcare sectors. This acquisition expands the geographical coverage of our cleaning and hygiene supplies business in Brazil.
365 Healthcare, which had revenue of £12 million in 2014, was acquired at the end of June. The business is engaged in the distribution of own brand healthcare products to a variety of customers in the UK and Ireland and has expanded our product offering of medical consumables to the healthcare sector. At the end of July we purchased Premiere Products, a cleaning and hygiene supplies distributor in the UK principally servicing customers in the facilities management and education sectors. The business has extended the breadth of our own brand product offering and has further strengthened our cleaning and hygiene supplies business in the UK. Revenue was £4 million in 2014. We acquired two safety businesses in the UK also at the end of July. Lee Brothers, which had revenue of £11 million in 2014, supplies a variety of personal protection equipment and workplace consumables to customers largely in the construction and engineering sectors. Guardsman, which had revenue of £9 million in 2014, is engaged in the sale of safety equipment and workwear to customers in various manufacturing industries as well as the construction and engineering sectors. Together these businesses have further extended our safety business in the UK.
At the end of September we completed the acquisition of De Ridder, a specialist distribution business based in the Netherlands and engaged in the supply of a wide range of products principally to prisons, police stations and other detention centres. Revenue in 2014 was £6 million. We acquired the business of Victoria Healthcare Products in November. Based near Melbourne, Australia, the business had revenue of £2 million in 2014 and supplies a variety of healthcare consumable products for people in the community and to residential care facilities.
In North America our operations in Canada were further expanded with the purchase of Acme Supplies, a cleaning and hygiene supplies business based in Vancouver Island, at the beginning of December. Revenue in 2014 was £9 million. Our marketing services business in the UK was expanded in December with the purchase of POS Direct. Based in Leicester and with revenue of £4 million in 2014, the business manages and supplies a variety of point of sale and marketing materials. At the end of December we entered into an agreement to acquire Tillman, which supplies a variety of personal protection equipment, principally gloves, to distributors throughout the US who supply customers operating in the welding and industrial sectors. The acquisition was completed at the beginning of January 2015. With revenue of £61 million in 2014, the purchase of Tillman represents another important development for the Group‘s safety business in the US.
Today we are announcing two more acquisitions. Quirumed, which had revenue of £15 million in 2014, represents our first move into the healthcare sector in Spain while Jan-Mar, based in Toronto with revenue of £6 million in 2014, has further extended our cleaning and hygiene supplies business in Canada.
PROSPECTSBunzl’s strong market position and the ongoing benefit from acquisitions is expected to lead to further growth at constant exchange rates in each of our business areas in 2015 despite variable macroeconomic conditions across the countries in which we operate.
In North America the impact of organic growth and recent acquisitions should result in a good performance. Even though the economic outlook remains challenging in Continental Europe, we expect to see continued growth this year. UK & Ireland should progress as a result of further organic growth and the contribution
from acquisitions made in 2014. Although Rest of the World is likely to experience more difficult trading conditions due to exchange rate volatility and the slowdown in the resource sectors, it should continue to grow.
The pipeline of potential acquisitions remains promising. Discussions are ongoing with various targets and we expect to complete further transactions as the year progresses.
The Board is confident that Bunzl’s well positioned businesses will develop further and that the prospects for the Group are positive.
Michael RoneyChief Executive 23 February 2015

20 BUNZL PLC ANNUAL REPORT 2014
CHIEF EXECUTIVE’S REVIEW CONTINUED
NORTH AMERICA
OVERVIEWGrowth %
£m 2014 2013 ReportedConstant exchange
Revenue 3,372.1 3,401.7 (1) 5Adjusted operating profit* 211.1 213.6 (1) 5Operating margin* 6.3% 6.3%Return on operating capital 59.6% 61.2%
*Before intangible amortisation and acquisition related costs.
In North America revenue increased by 5% to £3,372.1 million due to organic revenue growth with new and existing customers and additional sales provided by acquisitions made in both 2013 and 2014. Each of these acquisitions has allowed us to expand our product and service offerings through their unique capabilities and strong market presence. With the operating margin stable, the operating profit also increased 5% to £211.1 million.
Our largest business, which serves the grocery sector, was impacted by the severe winter weather which affected much of the US in the first quarter of the year but continued to experience sales growth in an environment of mergers and acquisitions, expansion and channel diversification amongst our customer base. During 2014 we renewed several supply agreements with national and regional grocery wholesalers and retailers. At the same time we maintained strong business relationships with many long term customers, including some of the largest supermarket chains and discount supercentres in the US and Canada, although margins came under pressure. To promote our capabilities within the grocery sector, we launched our ‘Think Big’ branding campaign targeting executive leadership. The campaign’s message emphasises our ability to help our customers’ decision makers decrease costs and reduce the levels of inventories while increasing revenues through better merchandising and category management.
Our business serving the retail sector continued to drive strong organic growth. We secured a substantial new agreement with a leading North American home improvement retailer and expanded business with existing customers. Our unique ability to deliver a combination of custom store supply programmes, branded packaging, display solutions and fixture consolidation services has allowed us to solidify our position as a preferred business partner for retailers seeking a one-stop-shop to serve all of their locations. Both our grocery and retail sector customers value the advantages we provide through our customised distribution platform, including our product and sourcing expertise, high fill rates and bespoke reporting capabilities as well as the reliable delivery service provided by our own large transport fleet which together give us a real competitive advantage.
Our redistribution business, which serves distributors in the foodservice, cleaning and hygiene and safety sectors, was also affected by the unfavourable weather conditions early in the year. In a competitive and challenging market, the business experienced a slight increase in revenue as a result of the impact of recent acquisitions. We are working to stimulate sales growth by increasing our marketing activities, expanding our category management initiatives and adding complementary businesses to extend our product range and market reach. With our ‘R3 Factor’ branding campaign, we engaged with our foodservice and cleaning and hygiene distribution customers about the advantages of using our coast-to-coast branch network as their ‘virtual warehouse’. This provides our customers with access to an unmatched range of products and supply chain services they can leverage to increase their sales and profitability while managing their working capital more efficiently. In addition, our expanded category management practice positions us well to use our distribution expertise to help customers rationalise their inventories, manage their warehouse space more effectively and gain a competitive advantage. The acquisition in March of Plast Techs, a supplier of foodservice and cleaning and hygiene products to distributors in Southern California, has augmented our redistribution business in the region while providing access to additional product lines.
SAS Safety, which we acquired in December 2013, and Tillman, which was purchased at the beginning of 2015, have significantly broadened our range of own brand personal protection equipment solutions and allowed us to expand into the industrial, automotive and welding distribution markets. FoodHandler expanded its food safety product line with several exclusive innovative products and has become a one-stop-shop for foodservice operators. Additionally, our expertise in creating and distributing imported and domestic own brand products allows us to provide our customers across all sectors with a range of value solutions that meet their particular specifications and budgets.
Our business supplying the food processor sector experienced revenue growth by increasing sales to existing customers and acquiring new customers. Our national accounts team provided greater focus on selling our value to key customers while offering centralised management for our customers’ extensive operations. We also introduced a range of technical packaging that helps food processors preserve product freshness and taste. We continue to serve all sectors of the food processing industry, including meat and home meal processors, bakeries, fresh produce providers and speciality food purveyors.
3 ACQUISITIONS+5% increase in adjusted operating profit at constant exchange ratesDRIVING INNOVATIONS

‘ Our extensive experience in making successful acquisitions has once again brought additional innovation and expertise which have helped to develop and expand our business further.’
Patrick Larmon President and CEO North America
BUNZL PLC ANNUAL REPORT 2014 21
In the agriculture sector, our business grew as a result of our ability to provide a wider range of products to produce growers, packers and shippers across North America. With our expertise in customised flexible and rigid packaging design and distribution, we are able to help our agriculture customers meet the rising demand from health-conscious consumers who are increasing their consumption of fresh produce.
In the convenience store sector, we experienced strong organic growth, primarily due to new programmes distributing consumable products through our largest convenience store wholesale customer.
In Canada the acquisition of Wesclean in 2013 has helped us to increase our sales in the cleaning and hygiene sector during the year and our acquisition of Acme Supplies in December 2014 has further increased our presence in this sector. In Mexico, ProEpta, which we also acquired in 2013, has expanded our reach in the hospitality sector and has increased revenue by providing products for prominent national and international customers.
3 ACQUISITIONS+5% increase in adjusted operating profit at constant exchange ratesDRIVING INNOVATIONS

4 ACQUISITIONS+12% increase in adjusted operating profit at constant exchange ratesREDUCING COSTS
22 BUNZL PLC ANNUAL REPORT 2014
CHIEF EXECUTIVE’S REVIEW CONTINUED
CONTINENTAL EUROPE
OVERVIEWGrowth %
£m 2014 2013 ReportedConstant exchange
Revenue 1,146.3 1,151.5 0 5Adjusted operating profit* 103.2 97.0 6 12Operating margin* 9.0% 8.4%Return on operating capital 52.3% 47.5%
*Before intangible amortisation and acquisition related costs.
Revenue in Continental Europe rose by 5% to £1,146.3 million and operating profit improved 12% to £103.2 million with the operating margin increasing from 8.4% to 9.0%. Organic revenue growth for the year was relatively low as macroeconomic conditions continued to be difficult throughout the region, but further improvements to gross margins and careful operating cost management contributed to a strong increase in underlying profitability. This has been supplemented by the full year impact of the acquisition in November 2013 of pka Klöcker and by the acquisitions in 2014 of Bäumer, Oskar Plast, Allshoes and De Ridder.
In France, our cleaning and hygiene business saw a slight decline in sales as good performances in the healthcare, food processor and industrial sectors were offset by lower sales to contract cleaners who continue to struggle in the difficult economic environment. However, a combination of an improvement in gross margins and a reduction in operating costs resulted in a significant improvement in operating profit. Our personal protection equipment business both increased sales and reduced costs such that it also delivered strong operating profit growth.
In the Netherlands, sales improved in the food processor, retail, healthcare and cleaning and hygiene sectors but sales declined in the grocery sector, due to customer consolidation, and in the hotel, restaurant and catering (‘horeca’) sector, which continues to be under pressure in the local market. Gross margins improved, operating costs were tightly managed and a further two businesses successfully migrated to our IT system. Sales continued to grow strongly at our safety products business as it gained new customers and market share and also benefited from growth with new products. Together with improved margins due to an increasing share of own brand products, this led to substantially higher operating profits. Both Allshoes and De Ridder, which were acquired during the year, have traded as expected and are integrating well into the Group.
In Belgium, sales grew well in the cleaning and hygiene sector due to growth with both existing and new customers, and also increased in the grocery sector despite our customers facing continued competition from a number of lower cost grocery chains. Although margins were under pressure, costs were stable and the sales growth therefore led to an improved level of overall profits.
In Germany, sales in our main business have grown significantly in the hotel sector and with smaller regional accounts leading to a healthy increase in operating profit and our workwear business, pka Klöcker, which was acquired in 2013, has traded well. A number of significant synergies have been realised in Bäumer, the cleaning and hygiene business that was purchased in January 2014.
In Switzerland, sales have increased with a good performance in particular in the retail sector. Gross margins were stable and costs were well controlled which resulted in operating profit being ahead of the previous year.
In Denmark, sales declined slightly as disappointing performances in the retail and redistribution sectors could not be completely offset by good sales growth of horeca products, personal protection equipment and packaging. Sales to the public sector were stable. However, gross margins improved and costs were further reduced such that operating profit increased.
In Spain, trading conditions continued to improve and we recorded good growth in our cleaning and hygiene business. Gross margins were stable and operating profit progressed well. We also generated excellent growth in our personal protection equipment businesses due to exports and better domestic sales. Gross margins were also slightly better and operating profit improved significantly.
In Central Europe, sales grew strongly, particularly in Hungary where both our retail and cleaning and hygiene/personal protection equipment businesses performed well. Gross margins were stable despite ongoing margin pressure and cost increases were kept to a minimum such that operating profit rose. Oskar Plast, which we acquired in February 2014, and our existing Czech retail business are in the process of being fully integrated which will lead to a number of synergies.
In Israel, both of our businesses saw lower sales and profits due to difficult market conditions, particularly in our business supplying the bakery sector. Our business supplying the horeca sector successfully relocated to a new purpose-built facility.

‘ The efficiency and profitability of the businesses we acquire are improved by retaining the key management and by Bunzl providing the necessary financial discipline, support and investment.’
Frank van Zanten Managing Director Continental Europe
BUNZL PLC ANNUAL REPORT 2014 23
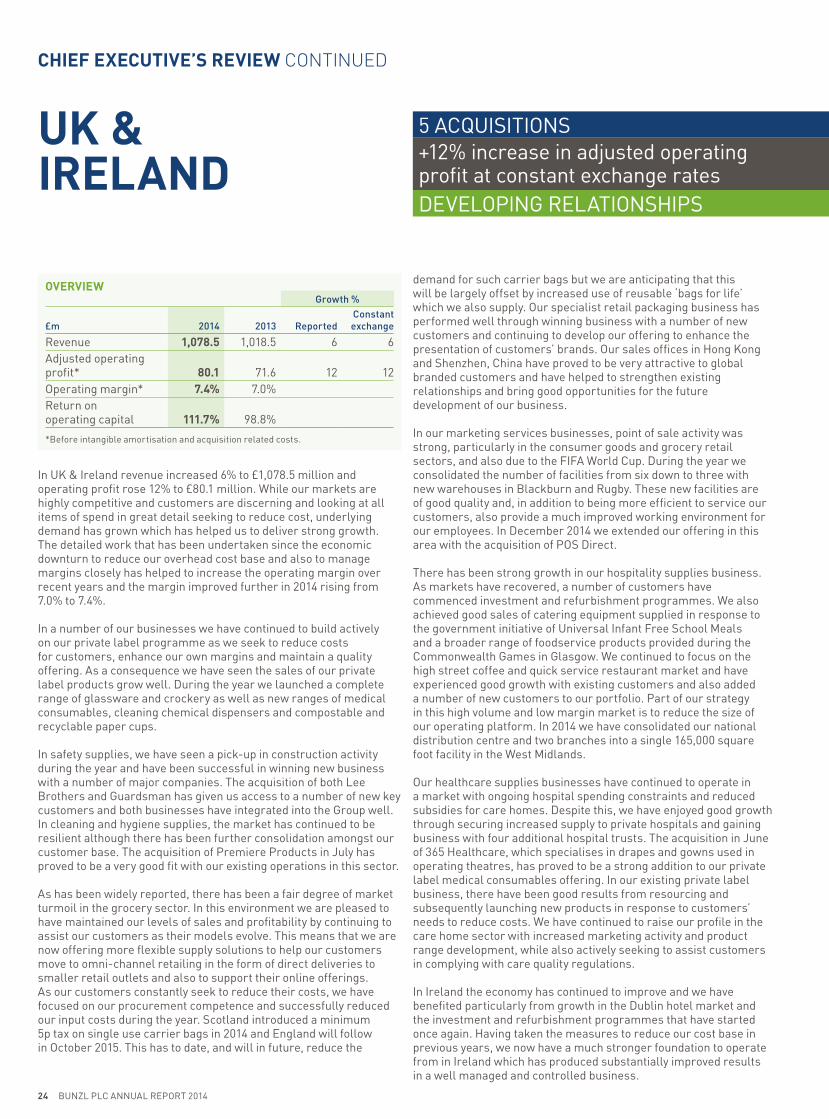
5 ACQUISITIONS+12% increase in adjusted operating profit at constant exchange ratesDEVELOPING RELATIONSHIPS
24 BUNZL PLC ANNUAL REPORT 2014
CHIEF EXECUTIVE’S REVIEW CONTINUED
UK & IRELAND
OVERVIEWGrowth %
£m 2014 2013 ReportedConstant exchange
Revenue 1,078.5 1,018.5 6 6Adjusted operating profit* 80.1 71.6 12 12Operating margin* 7.4% 7.0%Return on operating capital 111.7% 98.8%
*Before intangible amortisation and acquisition related costs.
In UK & Ireland revenue increased 6% to £1,078.5 million and operating profit rose 12% to £80.1 million. While our markets are highly competitive and customers are discerning and looking at all items of spend in great detail seeking to reduce cost, underlying demand has grown which has helped us to deliver strong growth. The detailed work that has been undertaken since the economic downturn to reduce our overhead cost base and also to manage margins closely has helped to increase the operating margin over recent years and the margin improved further in 2014 rising from 7.0% to 7.4%.
In a number of our businesses we have continued to build actively on our private label programme as we seek to reduce costs for customers, enhance our own margins and maintain a quality offering. As a consequence we have seen the sales of our private label products grow well. During the year we launched a complete range of glassware and crockery as well as new ranges of medical consumables, cleaning chemical dispensers and compostable and recyclable paper cups.
In safety supplies, we have seen a pick-up in construction activity during the year and have been successful in winning new business with a number of major companies. The acquisition of both Lee Brothers and Guardsman has given us access to a number of new key customers and both businesses have integrated into the Group well. In cleaning and hygiene supplies, the market has continued to be resilient although there has been further consolidation amongst our customer base. The acquisition of Premiere Products in July has proved to be a very good fit with our existing operations in this sector.
As has been widely reported, there has been a fair degree of market turmoil in the grocery sector. In this environment we are pleased to have maintained our levels of sales and profitability by continuing to assist our customers as their models evolve. This means that we are now offering more flexible supply solutions to help our customers move to omni-channel retailing in the form of direct deliveries to smaller retail outlets and also to support their online offerings. As our customers constantly seek to reduce their costs, we have focused on our procurement competence and successfully reduced our input costs during the year. Scotland introduced a minimum 5p tax on single use carrier bags in 2014 and England will follow in October 2015. This has to date, and will in future, reduce the
demand for such carrier bags but we are anticipating that this will be largely offset by increased use of reusable ‘bags for life’ which we also supply. Our specialist retail packaging business has performed well through winning business with a number of new customers and continuing to develop our offering to enhance the presentation of customers’ brands. Our sales offices in Hong Kong and Shenzhen, China have proved to be very attractive to global branded customers and have helped to strengthen existing relationships and bring good opportunities for the future development of our business.
In our marketing services businesses, point of sale activity was strong, particularly in the consumer goods and grocery retail sectors, and also due to the FIFA World Cup. During the year we consolidated the number of facilities from six down to three with new warehouses in Blackburn and Rugby. These new facilities are of good quality and, in addition to being more efficient to service our customers, also provide a much improved working environment for our employees. In December 2014 we extended our offering in this area with the acquisition of POS Direct.
There has been strong growth in our hospitality supplies business. As markets have recovered, a number of customers have commenced investment and refurbishment programmes. We also achieved good sales of catering equipment supplied in response to the government initiative of Universal Infant Free School Meals and a broader range of foodservice products provided during the Commonwealth Games in Glasgow. We continued to focus on the high street coffee and quick service restaurant market and have experienced good growth with existing customers and also added a number of new customers to our portfolio. Part of our strategy in this high volume and low margin market is to reduce the size of our operating platform. In 2014 we have consolidated our national distribution centre and two branches into a single 165,000 square foot facility in the West Midlands.
Our healthcare supplies businesses have continued to operate in a market with ongoing hospital spending constraints and reduced subsidies for care homes. Despite this, we have enjoyed good growth through securing increased supply to private hospitals and gaining business with four additional hospital trusts. The acquisition in June of 365 Healthcare, which specialises in drapes and gowns used in operating theatres, has proved to be a strong addition to our private label medical consumables offering. In our existing private label business, there have been good results from resourcing and subsequently launching new products in response to customers’ needs to reduce costs. We have continued to raise our profile in the care home sector with increased marketing activity and product range development, while also actively seeking to assist customers in complying with care quality regulations.
In Ireland the economy has continued to improve and we have benefited particularly from growth in the Dublin hotel market and the investment and refurbishment programmes that have started once again. Having taken the measures to reduce our cost base in previous years, we now have a much stronger foundation to operate from in Ireland which has produced substantially improved results in a well managed and controlled business.

‘ Through further development of customer relationships and by meeting and exceeding our customers’ needs, our organic revenue growth has returned to its highest level since 2007.’
Paul Budge Managing Director UK & Ireland
BUNZL PLC ANNUAL REPORT 2014 25

5 ACQUISITIONS+24% increase in adjusted operating profit at constant exchange ratesBUILDING ON SUCCESS
26 BUNZL PLC ANNUAL REPORT 2014
CHIEF EXECUTIVE’S REVIEW CONTINUED
REST OF THE WORLD
OVERVIEWGrowth %
£m 2014 2013 ReportedConstant exchange
Revenue 559.6 526.0 6 21Adjusted operating profit* 55.5 51.2 8 24Operating margin* 9.9% 9.7%Return on operating capital 41.8% 47.1%
*Before intangible amortisation and acquisition related costs.
In Rest of the World revenue increased 21% to £559.6 million and operating profit rose 24% to £55.5 million with the results being impacted significantly by the effect of recent acquisitions, particularly in Latin America.
Our operations in Latin America have performed well despite weaker macroeconomic conditions and considerable volatility in the foreign exchange markets in several countries which has caused some margin pressure within our businesses. All of our businesses have strong market positions focused on creating value-added solutions for our customers and we continue to be well positioned to expand our operations further, both organically and through acquisition.
In Brazil our safety businesses had another successful year. Our new state-of-the-art distribution centre for Protcap in the metropolitan area of São Paulo has started operating and will be a critical platform for our future growth for many years to come. Protcap experienced weaker demand from the end user sector during the last quarter of the year as many customers postponed investment decisions in anticipation of economic adjustments to be implemented following the recent Presidential elections in Brazil. Protcap’s new Manaus branch has opened as scheduled in an important location. Based in a free trade zone, the new branch is strategically placed for a number of local manufacturing customers in the region. Danny and Vicsa Brasil both had a very strong year with significant synergies achieved as a result of streamlining our portfolio of brands across both businesses.
In our cleaning and hygiene supplies business there was pressure on margins due to the highly competitive environment in this sector. However the acquisition of JPLUS in May has increased our market presence and enabled us to realise a number of synergies. The new business has integrated well and is performing above our initial expectations.
The businesses serving the healthcare sector in Brazil produced good results despite the uncertainty caused by the Presidential elections and new legislation which affected the import of certain product lines. Labor Import performed strongly and Lamedid, which we acquired in March, also had a very good year. The business is integrating as planned and is starting to develop synergies with Labor Import.
In the rest of Latin America, Vicsa Safety, our safety business with operations in Chile, Argentina, Colombia, Peru and Mexico, had an excellent year despite a very soft trading environment in its main market in Chile which put margins under pressure. New customers and continuous product development were key to the overall strong performance.
Our ability to service the safety sector in Chile was enhanced with the acquisition of Tecno Boga in March. The business is a market leader in the supply of safety shoes. Although faced with difficult market conditions as a result of a decline in the mining sector, the business performed well and has been successfully integrated into the Group.
In Mexico, our glove safety business Espomega, which we acquired in 2013, has also been able to maintain its margins despite much volatility in the local market and very soft demand in the short term caused by a slowdown in the construction sector. The business is however well placed for when the economy starts to recover.
In Australia, the economy continues to be adversely affected by the slowdown following the mining investment boom and the fall in global commodity prices. This resources slowdown has had a direct impact on a number of our major customers supplying into these sectors which in turn has reduced demand for the products we supply.
Our largest business, Outsourcing Services, which supplies the healthcare, cleaning, catering and retail sectors, while impacted by market conditions, performed well with an improvement in revenue and operating profit as it continued to develop its position as a consolidator and supplier of disposable consumables throughout Australia and New Zealand. Whilst facing challenging trading conditions, the business has been able to offset some of the effects of the downturn across its customer base with a number of large customer wins. The business has continued to develop a good position in the healthcare sector, in particular to the aged care and private hospital markets, where we supply a wide range of disposable and medical consumables. In November we acquired a small business, Victoria Healthcare Products, which is a niche supplier of medical consumables and wound care products into the community and residential care markets. This has created an opportunity for our business in a section of our existing market where we previously did not have a strong presence.
Our food processor business, which is a major national supplier into the Australian and New Zealand food industry, delivered another improved performance with higher revenue and operating profit. We made good progress expanding the business into non-meat and other food processors and have invested in additional specialist resources to help drive these opportunities. This has benefited the business which has won a number of major customers in this market. Our ongoing focus will be to continue to develop this strategy and further consolidate our position as a leading national supplier into this sector. In March, we acquired Nelson Packaging, a packaging and cleaning and hygiene supplies company based in the South Island of New Zealand. This business has a strong presence in the processor

‘ We are able to obtain an enhanced competitive advantage by optimising a variety of different synergies through sharing best practice across the Group and utilising our global purchasing scale.’
Kim Hetherington Managing Director Australasia
‘ Our well established business model, which allows the companies we acquire to operate on a decentralised basis, provides an attractive option for owners looking to sell their businesses.’
Rodrigo Mascarenhas Managing Director Latin America
5 ACQUISITIONS+24% increase in adjusted operating profit at constant exchange ratesBUILDING ON SUCCESS
BUNZL PLC ANNUAL REPORT 2014 27
and industrial markets in this region and has been a good addition to our business, providing further scale, expertise and distribution capabilities as we develop in the New Zealand market.
Our industrial and safety supplies business has been impacted the most by the slowdown in the mining and other resource sectors with its performance adversely affected as a result, leading to a lower level of operating profit at a reduced profit margin. To help offset this, we have taken a proactive approach to consolidate a number of facilities and made a number of structural changes to support the business performance in the current environment and reposition it for growth. We have also benefited from having access to and working with the wider Bunzl businesses. We have adopted a number of better purchasing, operational and technology initiatives, which are helping to improve our competitive position and efficiency. Although the market conditions have impacted volumes, the business has been successful in winning a number of major new customers. This has created potential to build on our strong product range offering and our market position as we continue to develop opportunities in the more resilient market sectors and regions.

28 BUNZL PLC ANNUAL REPORT 2014
BUILDING AND DEVELOPING LONG TERM RELATIONSHIPS

BUNZL PLC ANNUAL REPORT 2014 29
BUILDING AND DEVELOPING LONG TERM RELATIONSHIPS
REDUCING WASTECONSOLIDATING
EMPLOYEE ENGAGEMENT
By outsourcing the purchasing, consolidation and distribution of everyday items, our customers are able to focus on their core businesses, saving them time and money.

GROUP PERFORMANCERevenue increased to £6,156.5 million (2013: £6,097.7 million), up 7% at constant exchange rates and up 1% at actual exchange rates, reflecting organic growth of 2.7% and the benefit of acquisitions. Adjusted operating profit (being operating profit before intangible amortisation and acquisition related costs) increased to £429.8 million (2013: £414.4 million), an increase of 10% at constant exchange rates and 4% at actual exchange rates, as a result of the revenue growth and the adjusted operating profit margin increasing from 6.8% to 7.0% due to the impact of higher margin acquisitions. Currency translation had a negative impact of between 6% and 7% on the results for the year, principally due to the strengthening of sterling against all of our major currencies.
Intangible amortisation and acquisition related costs were up £5.7 million to £88.0 million due to a £3.6 million increase in intangible amortisation and a £2.1 million increase in acquisition related costs.
The net interest charge of £42.0 million was £0.2 million lower than 2013 at actual exchange rates but up £1.5 million at constant exchange rates due to higher average net debt from the funding of acquisitions, partly offset by a lower interest charge on the Group’s pension deficit.
Adjusted profit before income tax (being profit before income tax, intangible amortisation and acquisition related costs) was £387.8 million (2013: £372.2 million), up 11% at constant exchange rates and 4% at actual exchange rates, principally due to the growth in adjusted operating profit.
TAXA tax charge at a rate of 27.4% (2013: 27.9%) has been provided on the adjusted profit before income tax. Including the impact of intangible amortisation of £61.9 million, acquisition related costs of £26.1 million and the associated deferred and current tax of £17.1 million, the overall tax rate is 29.7% (2013: 28.7%). The underlying tax rate of 27.4% is higher than the nominal UK rate of 21.5% for 2014 principally because many of the Group’s operations are in countries with higher tax rates.
PROFIT FOR THE YEARProfit after tax of £210.7 million was up £3.9 million, primarily due to a £9.7 million increase in operating profit, partly offset by a £6.0 million increase in the tax charge.
EARNINGSThe weighted average number of shares increased to 326.6 million from 325.8 million due to employee share option exercises partly offset by shares being purchased from the market into the Group’s employee benefit trust. Earnings per share were 64.5p, up 8% on 2013 at constant exchange rates and 2% at actual exchange rates. After adjusting for intangible amortisation, acquisition related costs and the associated tax, adjusted earnings per share were 86.2p, an increase on 2013 of 11% at constant exchange rates and 5% at actual exchange rates.
Intangible amortisation, acquisition related costs and associated tax are items which are not taken into account by management when assessing the results of the business as they do not relate to the underlying operating performance. Accordingly, such charges are removed in calculating the adjusted earnings per share on which management assesses the performance of the Group.
DIVIDENDSAn analysis of dividends per share for the years to which they relate is shown below:
2014 2013 Growth
Interim dividend (p) 11.0 10.0 10%Final dividend (p) 24.5 22.4 9%Total dividend (p) 35.5 32.4 10%Dividend cover (times)* 2.4 2.5
*Based on adjusted earnings per share.
ACQUISITIONSThe acquisitions made or agreed to be made in 2014 were Bäumer and its related company Protemo, Oskar Plast, Lamedid, Nelson Packaging, Plast Techs, Tecno Boga, Allshoes, JPLUS, 365 Healthcare, Lee Brothers, Premiere Products, Guardsman, De Ridder, Victoria Healthcare Products, Acme Supplies, POS Direct and Tillman. The acquisition of Tillman was agreed on 30 December 2014 and completed on 2 January 2015. Annualised revenue and adjusted operating profit of the businesses acquired (excluding Tillman) were £162.7 million and £20.6 million respectively. The estimated annualised revenue including Tillman is £223.3 million. A summary of the effect of acquisitions is as follows:
£m
Fair value of assets acquired 76.9 Goodwill 36.2 Consideration 113.1Satisfied by:
cash consideration 107.1 deferred consideration 6.0
113.1 Contingent payments relating to the retention
of former owners 19.1 Net bank overdrafts acquired 8.9 Transaction costs and expenses 4.1 Total committed spend in respect of acquisitions
completed in the current year 145.2Spend on acquisition committed as at 31 December 2014 65.8Total committed spend in respect of acquisitions
agreed in the current year 211.0
30 BUNZL PLC ANNUAL REPORT 2014
FINANCIAL REVIEW

The net cash outflow in the year in respect of acquisitions comprised:
£m
Cash consideration 107.1Net bank overdrafts acquired 8.9Deferred consideration in respect of prior year
acquisitions 38.1Net cash outflow in respect of acquisitions 154.1Acquisition related costs* 14.0Total cash outflow in respect of acquisitions 168.1
* Cash flow on acquisition related costs relates to £3.5 million of transaction costs paid and £10.5 million from payments relating to the retention of former owners.
CASH FLOWCash generated from operations before acquisition related costs was £431.6 million, a £14.8 million decrease from 2013, primarily due to a working capital outflow in 2014 of £15.6 million compared to a £16.8 million inflow in 2013 partly offset by a £15.4 million increase in adjusted operating profit. The working capital outflow in 2014 is due to an increase in inventories offset by favourable movements in receivables and payables, with underlying working capital excluding acquisitions and exchange increasing by 3% in line with organic sales growth. The Group’s free cash flow of £276.5 million was down £25.3 million from 2013, primarily due to the £14.8 million decrease in cash generated from operations and a £9.5 million increase in the cash outflow relating to tax. After payment of dividends of £105.6 million in respect of 2013 (2013: £91.8 million in respect of 2012), an acquisition cash outflow of £168.1 million (2013: £279.9 million) and a £21.8 million outflow on employee share schemes (2013: £43.3 million), the net cash outflow was £19.0 million (2013: £113.2 million outflow). The summary cash flow for the year was as follows:
£m
Cash generated from operations* 431.6Net capital expenditure (23.9)Operating cash flow* 407.7
Operating cash flow* to adjusted operating profit† 95%
Net interest (41.4)Tax (89.8)Free cash flow 276.5Dividends (105.6)Acquisitions (168.1)Employee share schemes (21.8)Net cash outflow (19.0)
*Before acquisition related costs.† Before intangible amortisation and acquisition related costs.
BALANCE SHEETReturn on average operating capital increased to 57.7% from 56.9% in 2013, with the impact of the lower return on operating capital from acquisitions being more than offset by improvements in the return on operating capital in the rest of the Group. Return on invested capital of 17.6% was slightly down from 17.9% in 2013 as improved returns in the underlying business were offset by the lower return on recent acquisitions and exchange rate movements. Intangible assets increased by £21.9 million to £1,478.8 million, reflecting goodwill and customer relationships arising on acquisitions in the year of £112.2 million, partly offset by an amortisation charge of £61.9 million and a reduction of £28.4 million due to exchange. The Group’s pension deficit of £70.3 million at 31 December 2014 was £25.3 million higher than at 31 December 2013, largely due to an actuarial loss of £30.1 million. The actuarial loss arose as a result of the impact of a £61.4 million increase in the present value of scheme liabilities from changes in assumptions, principally lower discount rates, partly offset by the actual return on scheme assets being £31.3 million higher than expected.
The net debt to EBITDA ratio was 1.9 times (2013: 1.8 times). The movements in shareholders’ equity and net debt during the year were as follows:
Shareholders’ equity £m
At 1 January 2014 939.9Profit for the year 210.7Dividends (105.6)Currency (38.6)Actuarial loss on pension schemes (net of tax) (22.1)Share based payments 18.6Employee share options (19.0)At 31 December 2014 983.9
Net debt £m
At 1 January 2014 (849.5)Net cash outflow (19.0)Currency (8.9)At 31 December 2014 (877.4)
Net debt to EBITDA (times) 1.9
BUNZL PLC ANNUAL REPORT 2014 31
‘ Our long term track record of strong cash generation has enabled us to pay a growing dividend over the past 22 years and to support our growth strategy by making acquisitions and reinvesting in the underlying business.’
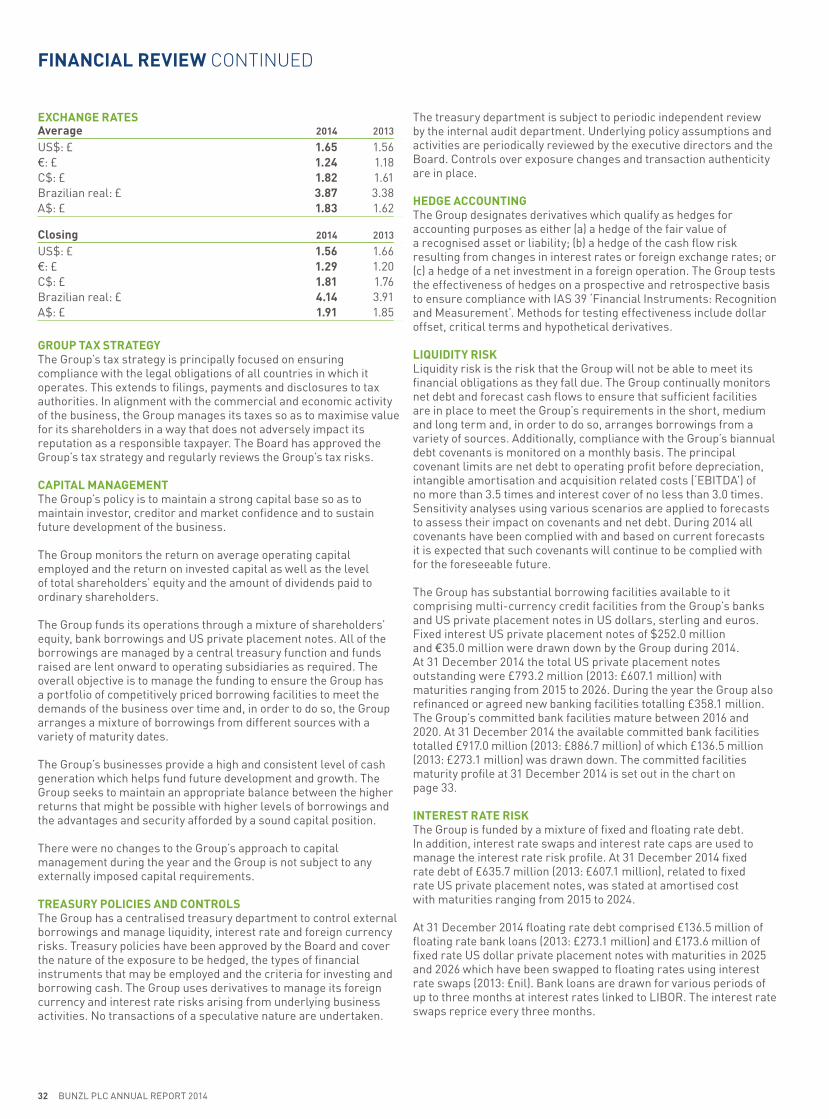
32 BUNZL PLC ANNUAL REPORT 2014
FINANCIAL REVIEW CONTINUED
EXCHANGE RATESAverage 2014 2013
US$: £ 1.65 1.56€: £ 1.24 1.18C$: £ 1.82 1.61Brazilian real: £ 3.87 3.38A$: £ 1.83 1.62
Closing 2014 2013
US$: £ 1.56 1.66€: £ 1.29 1.20C$: £ 1.81 1.76Brazilian real: £ 4.14 3.91A$: £ 1.91 1.85
GROUP TAX STRATEGYThe Group’s tax strategy is principally focused on ensuring compliance with the legal obligations of all countries in which it operates. This extends to filings, payments and disclosures to tax authorities. In alignment with the commercial and economic activity of the business, the Group manages its taxes so as to maximise value for its shareholders in a way that does not adversely impact its reputation as a responsible taxpayer. The Board has approved the Group’s tax strategy and regularly reviews the Group’s tax risks.
CAPITAL MANAGEMENTThe Group’s policy is to maintain a strong capital base so as to maintain investor, creditor and market confidence and to sustain future development of the business.
The Group monitors the return on average operating capital employed and the return on invested capital as well as the level of total shareholders’ equity and the amount of dividends paid to ordinary shareholders.
The Group funds its operations through a mixture of shareholders’ equity, bank borrowings and US private placement notes. All of the borrowings are managed by a central treasury function and funds raised are lent onward to operating subsidiaries as required. The overall objective is to manage the funding to ensure the Group has a portfolio of competitively priced borrowing facilities to meet the demands of the business over time and, in order to do so, the Group arranges a mixture of borrowings from different sources with a variety of maturity dates.
The Group’s businesses provide a high and consistent level of cash generation which helps fund future development and growth. The Group seeks to maintain an appropriate balance between the higher returns that might be possible with higher levels of borrowings and the advantages and security afforded by a sound capital position.
There were no changes to the Group’s approach to capital management during the year and the Group is not subject to any externally imposed capital requirements.
TREASURY POLICIES AND CONTROLSThe Group has a centralised treasury department to control external borrowings and manage liquidity, interest rate and foreign currency risks. Treasury policies have been approved by the Board and cover the nature of the exposure to be hedged, the types of financial instruments that may be employed and the criteria for investing and borrowing cash. The Group uses derivatives to manage its foreign currency and interest rate risks arising from underlying business activities. No transactions of a speculative nature are undertaken.
The treasury department is subject to periodic independent review by the internal audit department. Underlying policy assumptions and activities are periodically reviewed by the executive directors and the Board. Controls over exposure changes and transaction authenticity are in place.
HEDGE ACCOUNTINGThe Group designates derivatives which qualify as hedges for accounting purposes as either (a) a hedge of the fair value of a recognised asset or liability; (b) a hedge of the cash flow risk resulting from changes in interest rates or foreign exchange rates; or (c) a hedge of a net investment in a foreign operation. The Group tests the effectiveness of hedges on a prospective and retrospective basis to ensure compliance with IAS 39 ‘Financial Instruments: Recognition and Measurement’. Methods for testing effectiveness include dollar offset, critical terms and hypothetical derivatives.
LIQUIDITY RISKLiquidity risk is the risk that the Group will not be able to meet its financial obligations as they fall due. The Group continually monitors net debt and forecast cash flows to ensure that sufficient facilities are in place to meet the Group’s requirements in the short, medium and long term and, in order to do so, arranges borrowings from a variety of sources. Additionally, compliance with the Group’s biannual debt covenants is monitored on a monthly basis. The principal covenant limits are net debt to operating profit before depreciation, intangible amortisation and acquisition related costs (‘EBITDA’) of no more than 3.5 times and interest cover of no less than 3.0 times. Sensitivity analyses using various scenarios are applied to forecasts to assess their impact on covenants and net debt. During 2014 all covenants have been complied with and based on current forecasts it is expected that such covenants will continue to be complied with for the foreseeable future.
The Group has substantial borrowing facilities available to it comprising multi-currency credit facilities from the Group’s banks and US private placement notes in US dollars, sterling and euros. Fixed interest US private placement notes of $252.0 million and €35.0 million were drawn down by the Group during 2014. At 31 December 2014 the total US private placement notes outstanding were £793.2 million (2013: £607.1 million) with maturities ranging from 2015 to 2026. During the year the Group also refinanced or agreed new banking facilities totalling £358.1 million. The Group’s committed bank facilities mature between 2016 and 2020. At 31 December 2014 the available committed bank facilities totalled £917.0 million (2013: £886.7 million) of which £136.5 million (2013: £273.1 million) was drawn down. The committed facilities maturity profile at 31 December 2014 is set out in the chart on page 33.
INTEREST RATE RISKThe Group is funded by a mixture of fixed and floating rate debt. In addition, interest rate swaps and interest rate caps are used to manage the interest rate risk profile. At 31 December 2014 fixed rate debt of £635.7 million (2013: £607.1 million), related to fixed rate US private placement notes, was stated at amortised cost with maturities ranging from 2015 to 2024.
At 31 December 2014 floating rate debt comprised £136.5 million of floating rate bank loans (2013: £273.1 million) and £173.6 million of fixed rate US dollar private placement notes with maturities in 2025 and 2026 which have been swapped to floating rates using interest rate swaps (2013: £nil). Bank loans are drawn for various periods of up to three months at interest rates linked to LIBOR. The interest rate swaps reprice every three months.

Committed facilities maturity profile 2015–2026 £m
Bank facilities – undrawn Bank facilities – drawn US private placement notes denominated in US dollars, sterling and euros
23 262524222120191816 1715
71
65
61
55
32
150
69
50
87
90
108
34
420
6948
3361
106 101
BUNZL PLC ANNUAL REPORT 2014 33
The interest rate risk on the floating rate debt is managed using interest rate options. Borrowings with a notional principal of £45.5 million were capped at 31 December 2014 (2013: £60.0 million). Hedge accounting is not applied to the interest rate caps since the majority of their value is related to time value. The strike rates of these options are based on LIBOR repricing every three months.
FOREIGN CURRENCY RISKThe majority of the Group’s sales are made and income is earned in US dollars, euros and other foreign currencies. The Group does not hedge the impact of exchange rate movements arising on translation of earnings into sterling at average exchange rates. For the year ended 31 December 2014, a movement of one cent in the US dollar and euro average exchange rates would have changed profit before income tax by £0.9 million and £0.4 million respectively and adjusted profit before income tax by £1.0 million and £0.6 million respectively.
The majority of the Group’s transactions are carried out in the respective functional currencies of the Group’s operations and so transaction exposures are usually relatively limited. Where they do occur, the Group’s policy is to hedge significant exposures of firm commitments for a period of up to one year as soon as they are committed using forward foreign exchange contracts and these are designated as cash flow hedges. However, the economic impact of foreign exchange on the value of uncommitted future purchases and sales is not hedged. As a result, sudden and significant movements in foreign exchange rates can impact profit margins where there is a delay in passing on to customers the resulting price increases.
The majority of the Group’s borrowings are effectively denominated in sterling, US dollars and euros, aligning them to the respective functional currencies of the component parts of the Group’s EBITDA. This currency profile is achieved using short-term foreign exchange contracts, long term cross currency interest rate swaps and foreign currency debt. This currency composition minimises the impact of foreign exchange rates on the ratio of net debt to EBITDA.
CREDIT RISKCredit risk is the risk of loss in relation to a financial asset due to non-payment by the relevant counterparty. The Group’s objective is to reduce its exposure to counterparty default by restricting the type of counterparty it deals with and by employing an appropriate policy in relation to the collection of financial assets.
The Group’s principal financial assets are cash and deposits, derivative financial instruments and trade and other receivables which represent the Group’s maximum exposure to credit risk in relation to financial assets. The maximum exposure to credit risk for these financial assets is their carrying amount.
Dealings are restricted to those banks with the relevant combination of geographic presence and suitable credit rating. The Group continually monitors the credit ratings of its counterparties and the credit exposure to each counterparty.
For trade and other receivables, the amounts represented in the balance sheet are net of allowances for doubtful receivables, estimated by the Group’s management based on prior experience and their assessment of the current economic environment.
At the balance sheet date there were no significant concentrations of credit risk.
GOING CONCERNDetails of the Group’s activities, developments and performance are set out on pages 4 to 33 and the Principal risks and uncertainties are set out on pages 34 and 35. This Financial review summarises the Group’s financial performance, balance sheet and cash flows and provides information on its treasury policies, exposure to financial risks, debt profile and funding headroom. Note 13 to the consolidated financial statements provides further details of the Group’s debt profile, capital management policy, treasury policies and controls, hedging activities and financial instruments and its policies and exposures to liquidity, interest rate, foreign currency and credit risks.
The Group has significant financial resources, a well established and fragmented customer base, strong supplier relationships and a diverse geographic presence. As a consequence, the directors believe that the Group is well placed to manage its business risks successfully. Based on the expected future profit generation, cash conversion and current facilities’ headroom over the 12 months to March 2016, the directors have a reasonable expectation that the Group has adequate resources to continue in operational existence for the foreseeable future. For this reason the directors believe it is appropriate to continue to adopt the going concern basis in preparing the financial statements.
Brian MayFinance Director23 February 2015

34 BUNZL PLC ANNUAL REPORT 2014
PRINCIPAL RISKS AND UNCERTAINTIES
RISK OVERVIEWThe effective identification, management and mitigation of risks and uncertainties across the Group are an integral part of delivering the Group’s strategic objectives. The ‘Risk management and internal control’ section of the Corporate governance report on pages 46 and 47 includes further information on the specific procedures designed to identify, manage and mitigate business risk which could have a material impact on the Group’s business, financial condition or results of operations.
The Company’s risk management framework provides a consistent methodology by which every business and business area, the Executive Committee and ultimately the Board assess the risks that the Group faces against a defined set of probability and impact criteria. In assessing impact, the following criteria are considered: business continuity; health, safety and the environment; regulatory; reputational; and financial. The probability and impact of each risk is assessed on two bases. The first, defined as Gross Risk, is the probability and impact of a risk if none of the mitigating actions or internal controls designed to reduce either the probability or the impact of a risk occurring were in place. The second, defined as Net Risk, is the residual probability and impact of a risk assuming that the mitigating actions and internal controls operated as intended in an effective way.
Using this framework, every business documents their key risks in a consistent reporting format which specifically identifies the mitigating activities, relevant controls and related assurance activities for each significant risk. Management then consolidates the risk information at both a business area and Group level using the same reporting format, culminating in the Group risk assessment. The Executive Committee then reviews the Group risk assessment, the relevant controls and other steps taken to mitigate the risks identified and the assurance procedures in place over such controls with a view to determining any further actions required in order to reduce the levels of risk to acceptable levels. The risk assessment is then submitted for review and approval by the Board.
THE RISK PROFILEThe Group operates in many business environments and across a number of geographies in which risks and uncertainties exist, not all of which are necessarily within the Company’s control. The risks identified in the 2013 Annual Report remain those of most concern to the business at the end of 2014. The principal risks and uncertainties faced by the Group and the steps taken to mitigate such risks and uncertainties are detailed below. This summary is not intended to be exhaustive and is not presented in order of potential probability or impact.
Bunzl has an extensive risk management framework designed to identify and assess the likelihood and consequences of risks and to manage the actions necessary to mitigate their impact to acceptable levels. It also identifies the assurance activities relating to the relevant mitigating actions.
Market risks Mitigating factors
Competitive pressuresThe Group operates in highly competitive markets and faces competition from international companies as well as national, regional and local companies in the countries in which it operates. Increased competition and unanticipated actions by competitors or customers could lead to an adverse effect on results and hinder the Group’s growth potential. This could result from: customer pressure on sales volumes or margins; the loss of customers due to service or pricing issues; increased price competition; customers and suppliers dealing directly with one another; or unforeseen changes in the competitive landscape due to the introduction of disruptive technologies or changes in routes to market.
The Group seeks to remain competitive by maintaining high service levels and close contacts with its customers to ensure that their needs and demands are being met satisfactorily, developing a national presence in the markets in which the Group operates and maintaining strong relationships with a variety of different suppliers thereby enabling the Group to offer a broad range of products to its customers, including own brand products. The Group also regularly reviews the competitive environment in which it operates.
Product price changesThe purchase price of products distributed by the Group can fluctuate from time to time, thereby potentially affecting the results of operations. There could be significant increases in the cost of specific products leading to a diminution in margins if cost increases cannot be passed on in full to customers or substitute products sourced from elsewhere. Potential causes could include changes in the input costs of products purchased through commodity price inflation. In addition, a period of commodity price deflation may lead to reductions in the price and value of the Group’s products where sales prices are indexed or if competitors reduced their selling prices. If this was to occur, the Group’s revenue and, as a result, its profits, could be reduced and the value of inventory held in stock may not be fully recoverable.
The Group endeavours, whenever possible, to pass on price increases from its suppliers to its customers and to source its products from a number of different suppliers so that it is not dependent on any one source of supply for any particular product. Increased focus on the Group’s own import programmes and brands, together with the reinforcement of the Group’s service and product offering to customers, helps to minimise the impact of price deflation. The Group also mitigates against the risk of holding overvalued inventory in a deflationary environment by managing stock levels efficiently and ensuring they are kept to a minimum.
The Group uses its considerable experience in sourcing and selling products to manage prices during periods of both inflation and deflation in order to minimise the impact on operating margins.
Economic environmentThe Group’s business is partially dependent on general economic conditions in the US, the UK, France and other important markets. A significant deterioration in these conditions could have an adverse effect on the Group’s business and results of operations.
The Group’s operations and its customer base are diverse, with a variable and flexible cost base, and many of the sectors in which it competes are traditionally, by their nature, relatively resilient to economic downturns.

BUNZL PLC ANNUAL REPORT 2014 35
Financial risks Mitigating factors
Foreign exchangeThe majority of the Group’s sales are made and income is earned in US dollars, euros and other foreign currencies. The Group does not hedge the impact of exchange rate movements arising on translation of earnings into sterling at average exchange rates.
As a result, movements in exchange rates may have a material translation impact on the Group’s reported results.
The Group is also subject to transaction exposures where products are purchased in one currency and sold in another. As a result movements in exchange rates may adversely impact both operating margins and the value of the Group’s net assets.
The Group believes that the benefits of its geographical spread outweigh the associated risks.
The majority of the Group’s transactions are carried out in the functional currency of the Group’s operations. As a result, transaction exposures are usually limited and exchange rate fluctuations have minimal effect on the quality of earnings unless there is a sudden and significant adverse movement of a foreign currency in which products are purchased which may lead to a delay in passing on to customers the resulting price increases. The Group undertakes some forward purchasing of foreign currencies for identified exposures to reduce the impact of short term volatility.
The impact of changes in foreign exchange rates and related hedging activity is regularly monitored by senior management. The Group’s approach to managing foreign exchange risk is reviewed annually by the Board.
Financial liquidity and debt covenantsThe Group needs continuous access to funding in order to meet its trading obligations, to support investment in organic growth, to make acquisitions when appropriate opportunities arise, and to pay dividends to shareholders. There is a risk that the Group may be unable to obtain the necessary funds when required or that such funds will only be available on unfavourable terms.
The Group’s borrowing facilities include a requirement to comply with certain specified covenants in relation to the level of net debt and interest cover. A breach of these covenants could result from a significant and rapid deterioration in the business’s performance, foreign exchange rate fluctuations or the failure to manage working capital levels. Ultimately this could result in a significant proportion of the Group’s borrowings becoming repayable immediately.
The Group arranges a mixture of borrowings from different sources and continually monitors net debt and forecast cash flows to ensure that it will be able to meet its financial obligations as they fall due and that sufficient facilities are in place to meet the Group’s requirements in the short, medium and long term.
Compliance with the Group’s biannual debt covenants is monitored on a monthly basis based on the management accounts. Sensitivity analyses using various scenarios are applied to forecasts to assess their impact on covenants.
Operational risks Mitigating factors
Acquisitions A significant portion of the Group’s historical growth has been achieved through the acquisition of businesses and the Group’s growth strategy includes additional acquisitions. Although the Group operates in a number of fragmented markets which provide future acquisition opportunities, there can be no assurance that the Group will be able to make acquisitions in the future. There is also a risk that not all of the acquisitions made will be successful due to the loss of key people or customers after the acquisition, deterioration in the economic environment of the acquired business or the failure to perform adequate pre-acquisition due diligence or appropriately manage the post-acquisition integration of the business.
In the longer term, if an acquisition consistently underperforms compared to its original investment case, there is a risk that this will lead to a permanent impairment in the carrying value of the intangible assets attributed to that acquisition.
The Group’s acquisition strategy is to focus on those businesses which operate in sectors where it has or can develop competitive advantage and which have good growth opportunities. The Group continually reviews acquisition targets and has established processes and procedures with regard to detailed pre-acquisition due diligence and post-acquisition integration.
The Group endeavours to maximise the performance of an acquisition through the recruitment and retention of high quality and appropriately incentivised management combined with effective strategic planning, investment in resources and infrastructure and regular reviews of performance by both business area and Group management.
Business continuityThe Group would be adversely affected if any of its major distribution facilities was destroyed or damaged or there was a significant failure of its information systems resulting from either hardware failure or a cybersecurity breach.
The Group seeks to reduce the impact of destruction of, or damage to, facilities through the use of multi-site facilities with products stocked in more than one location. The impact of information systems’ failure is mitigated through regular renewal of hardware, layered security measures and disaster recovery plans which are periodically tested and which would be implemented in the event of any such failure.
Laws and regulationsThe international nature of the Group’s operations exposes it to potential claims as the Group is subject to a broad range of laws and regulations in each of the jurisdictions in which it operates.
In addition the Group faces potential claims from customers in relation to the supply of defective products or breaches of their contractual arrangements. The sourcing of products from lower cost countries increases the risk of the Group being unable to recover any potential losses relating thereto from the relevant supplier.
Although the Group does not operate in particularly litigious market sectors, it has in place processes to report, manage and mitigate against third party litigation using external advisers where necessary.
The use of reputable suppliers and internal quality assurance and quality control procedures reduce the risks associated with defective products.
The Financial review on pages 30 to 33 and Note 13 to the consolidated financial statements include information relating to the Group’s risk management policies so far as they relate to financial instruments.

COMMITTED TO SUSTAINABLE SUCCESS
SUSTAINABLE PRODUCTS
36 BUNZL PLC ANNUAL REPORT 2014
COMMUNITY SUPPORTHEALTH AND SAFETY

BUNZL PLC ANNUAL REPORT 2014 37
We encourage our suppliers to set similar corporate responsibility standards to ourselves while our consolidated delivery and product solutions assist our customers in meeting their sustainability goals.
CORPORATE RESPONSIBILITY
BUSINESS CONTEXTWe are a focused and successful international distribution and outsourcing group with operations across the Americas, Europe and Australasia. By outsourcing the purchasing, consolidation and delivery of a broad range of everyday items, our customers are able to focus on their core businesses, achieve purchasing efficiencies and savings, free up working capital, improve distribution capabilities, reduce carbon emissions and simplify their internal administration.
We do not manufacture any products but as part of our business strategy we source and procure branded, own brand and unbranded products globally. These products are then consolidated into our extensive global warehouse infrastructure, giving our customers a one-stop-shop solution to help reduce or eliminate the hidden costs of self-distribution and reduce their environmental impact. We also offer several delivery options to ensure our customers get their products when and where they are needed.
SourcingWe source everyday essential non-food items for a number of market sectors including grocery, foodservice, cleaning & hygiene, safety, retail and healthcare. We liaise closely with our suppliers so that we are able to offer a full range of items which satisfy our customers’ demands, including offering alternative products which reduce environmental impact and thereby climate change. Our quality assurance/quality control department based in Shanghai monitors and works with our key suppliers in Asia to ensure that appropriate corporate responsibility (‘CR’) standards are in place.
ConsolidationWe have an extensive footprint of warehouse facilities across four continents. As a result, our broad range of products are never far from where they need to be, allowing us to facilitate our customers’ needs quickly and easily, as well as reducing the number of deliveries to our customers, thereby cutting fuel usage, carbon emissions and administration.
DistributionWith our fleets of delivery vehicles and third party carriers, we are able to get products to our customers in a timely manner. Our flexible delivery service allows our customers to increase the efficiency and competitiveness of their operations.
As well as day-to-day operations, our business relies on developing strong and stable relationships with all of our stakeholders. We believe in managing our business with integrity, making sustainable, long term decisions.
STRATEGY, FRAMEWORK AND MATERIALITY We believe that positive actions with respect to CR are not only desirable in their own right but are also of potential economic and commercial benefit to the Group. A strong reputation for CR can provide business advantage and contribute to shareholder value. Conversely, perceived weakness in CR may damage our reputation and cause risks. Bunzl’s good practice in sustainability has been recognised by its FTSE4Good listing and Carbon Disclosure Project (‘CDP’) score. Details of our strategy and framework in relation to CR can be found on the Bunzl plc website in the Responsibility section at www.bunzl.com.
MaterialityUnderstanding our material issues is important to enable us to manage our CR related impacts and stakeholder relationships effectively. It also helps to focus our resources, engagement and reporting activities by addressing those issues most material to our business. Our current areas of focus are:
• business conduct/code of ethics: training to ensure everyone understands our standards;
• employees: engaging through clear communication using a variety of channels, as well as provision of training and development opportunities;
• health & safety: improving safety in the warehouses and on our vehicles and ensuring that everyone takes personal responsibility for this;
• environment: reducing our and our customers’ impacts on the environment by reducing carbon emissions and promoting the reduction of waste and providing innovative products to meet our customers’ needs, for example environmentally friendly packaging;
• community: providing support by encouraging employee fund raising, donating to charitable projects that benefit our employees and the communities we work in and by donating stock and cash to charitable organisations and good causes; and
• suppliers: responsible sourcing, working as partners with our suppliers to encourage high levels of CR and ethical trading initiatives.
These issues are governed by a policy framework, which is approved and monitored by the Board, with implementation at a business area level.
BUSINESS CONDUCT/CODE OF ETHICSThe Group’s business conduct/code of ethics policy is disseminated to every employee as a guide to how employees are expected to conduct themselves both from a corporate and individual perspective. The policy clearly states that employees should avoid conflicts of interest, provides guidance on the giving and receiving of gifts and entertainment, prohibits illegal payments as well as political donations and reinforces the need to comply with laws, rules and regulations, protect confidential information and company assets and maintain high standards in relationships with our customers and suppliers.
No material breaches of our business conduct/code of ethics policy were recorded in 2014. However, some minor incidents relating to employee conduct, such as theft or misuse of the Group’s property, did occur and were dealt with during the normal course of business using Group human resource (‘HR’) policies and procedures. Nine (2013: seven) calls/letters were received through our confidential whistle blowing process, ‘Speak Up’, none of which raised any issues of material concern.
Performance against 2014 objectives• Our CR policies, processes, controls and monitoring (‘CR Framework’)
were last updated in 2011. During 2014 we undertook a review of the CR Framework taking into account feedback provided by various bodies who report on Bunzl’s CR practices and performance. As a result, no fundamental changes were made to the CR Framework but a number of amendments were made to the CR policy and some of our controls and monitoring processes were refreshed and re-emphasised, particularly in areas related to our supply chain. For further details see the Suppliers section on page 40.

38 BUNZL PLC ANNUAL REPORT 2014
CORPORATE RESPONSIBILITY CONTINUED
• In light of the above review, we delayed the launch of our new e-learning module on competition law and refreshed the whole suite of nine tailored e-learning modules, including modules which provide an overview of the business conduct/code of ethics policy and anti-bribery issues such as facilitation payments and gifts and entertainment. In addition we have added a further module on cybersecurity. Finally we refreshed the posters which are displayed in all our facilities to advertise our whistle blowing facility – ‘Speak Up’.
2015 objectives• All directors, managers, sales representatives and purchasing
staff to undertake again all of the e-learning modules within the suite. Selective modules such as introduction to CR, environment, health & safety and cybersecurity to be viewed more widely.
• Continue to work with our supply chain to encourage our suppliers to maintain similar CR standards to those maintained by Bunzl.
EMPLOYEESBunzl currently operates in 27 countries worldwide. We are a service provider, not a manufacturer and, as such, our business relies heavily on the skills and experience of our employees. We pride ourselves on the fact that we run our businesses locally with local managers. We do not unfairly discriminate and we respect human rights. We seek to recruit the right people who are passionate about our business and to provide opportunities for people to progress within the organisation on the basis of their skills, experience and aptitude. We believe that to get the best from people we need to respect each other and encourage honest, straightforward communication. Our acquisition pipeline continues to be a valuable source of management talent for the Group and the completion of a number of acquisitions during the year has brought further highly skilled people into Bunzl. Details of the Group’s workforce diversity at 31 December 2014 are set out in the pie charts on page 39.
Human rightsBunzl adheres to the Universal Declaration of Human Rights (‘UDHR’) and upholds the Fundamental Principles and Rights at Work policies, defined by the International Labour Organization, as well as local laws. The majority of countries in which Bunzl operates have their own laws banning child labour and promoting human rights. We monitor the age of our workforce across the world to ensure compliance and identify any potential succession issues. In the US some of our operations, particularly in the north east, are represented by trade unions with which we have negotiated pay contracts. Bunzl does not restrict any of its employees in any of the countries in which it operates from joining a trade union if they wish to do so. We also work closely with our suppliers to ensure that they at least meet internationally recognised minimum requirements for workers’ welfare and conditions of employment, as defined by the International Labour Organization or the Ethical Trading Initiative.
Performance against 2014 objectives• The Group’s annual voluntary turnover (‘Turnover’), that is the
percentage of employees resigning from the Group, in 2014 was 10.5% (2013: 7.5%). Turnover levels have increased principally in both North America and UK & Ireland reflecting improved economic conditions rather than any intrinsic reasons related to the Group. As reported previously, considering the profile of our workforce, the 2013 Turnover was thought to be artificially low due to the prevailing economic conditions in many of the countries in which we operate. Sickness absence has remained relatively flat year on year. Sickness absence rates remain appreciably higher in Continental Europe than any other part of the Group. No underlying issues of concern have been identified and the higher levels are thought to be attributable to the social network rather than any intrinsic reasons relating to the Group.
• The average number of employees employed by the Group has risen in the year principally due to acquisitions. The number of females at senior management level has increased slightly to 10% (2013: 9%). In February 2015 another female non-executive director was appointed to the Board. From 1 May 2015 the Board will comprise seven males and two females. During the year we launched a women’s network and are currently considering piloting some further development and training exclusively for women.
• Our Group employee engagement survey, which we periodically carry out, was conducted in September 2014. We were pleased with our overall response rate of 72% and an engagement index score of 74% against a benchmark of 72%. Of those employees who responded, 93% reported that they ‘enjoyed working for Bunzl’.
2015 objectives• Continue to monitor key HR measures such as voluntary turnover,
sickness absence, training days, workforce gender and age mix and, as appropriate, take action to address any issues that may arise.
• Feed back the results of the employee engagement survey and develop action plans as appropriate.
HEALTH & SAFETYThe health and safety of our employees and other stakeholders is a priority. Although we try to minimise the risks which occur, particularly relating to the operation of our warehouses and vehicles, incidents relating to manual handling, slipping and tripping remain the highest causes of accidents. Regretfully in the 2014 reporting period there were two fatalities (2013: one) both resulting from road traffic accidents. In October 2013 a driver from UK & Ireland was killed when he was involved in a multi-vehicle collision and in May 2014 a third party died when their car collided head on with a Bunzl truck in North America. Bunzl has been advised that the drivers of other vehicles involved have been prosecuted in relation to both of these incidents. We continue to undertake a number of activities to improve the safety of our employees including extending the use of vehicle telematics to monitor driver performance, closure of older premises and other site improvements, purchase of new equipment and training programmes for managers and staff to raise awareness of safety issues. Our Safety Observations Programme, introduced initially in North America, seeks to ensure the implementation of safe working practices. As part of our 2014 employee survey we asked whether employees perceived that Bunzl took their health and safety seriously and 85% of respondents scored us positively in this area. We will be using the results of the survey to identify whether there are any particular areas on which we need to focus.
Performance against 2014 objectives• The 2014 target was to reduce the Group accident incidence rate
by 3% and the Group accident severity rate by 5% from the 2013 accident rates:
− for the year ended 30 September 2014 our accident incidence rate reduced by 19%; and
− for the same period our accident severity rate reduced by 3%.
The accident incidence rate improved in excess of the target in all business areas. North America and Latin America improved their severity rate in excess of the target but unfortunately performance in Continental Europe, UK & Ireland and Australasia deteriorated. The Bunzl Risk Management Committee reviews safety performance of the Group and reports quarterly to the Board. A number of actions have been instigated, including site visits, communication programmes, and in some areas the recruitment of additional technical health and safety professionals to focus further our programmes of improvement. Details of our performance from 2011 to 2014 are provided in the bar charts on page 39. The accident data provided is for the whole Group including acquisitions made during the relevant reporting period.
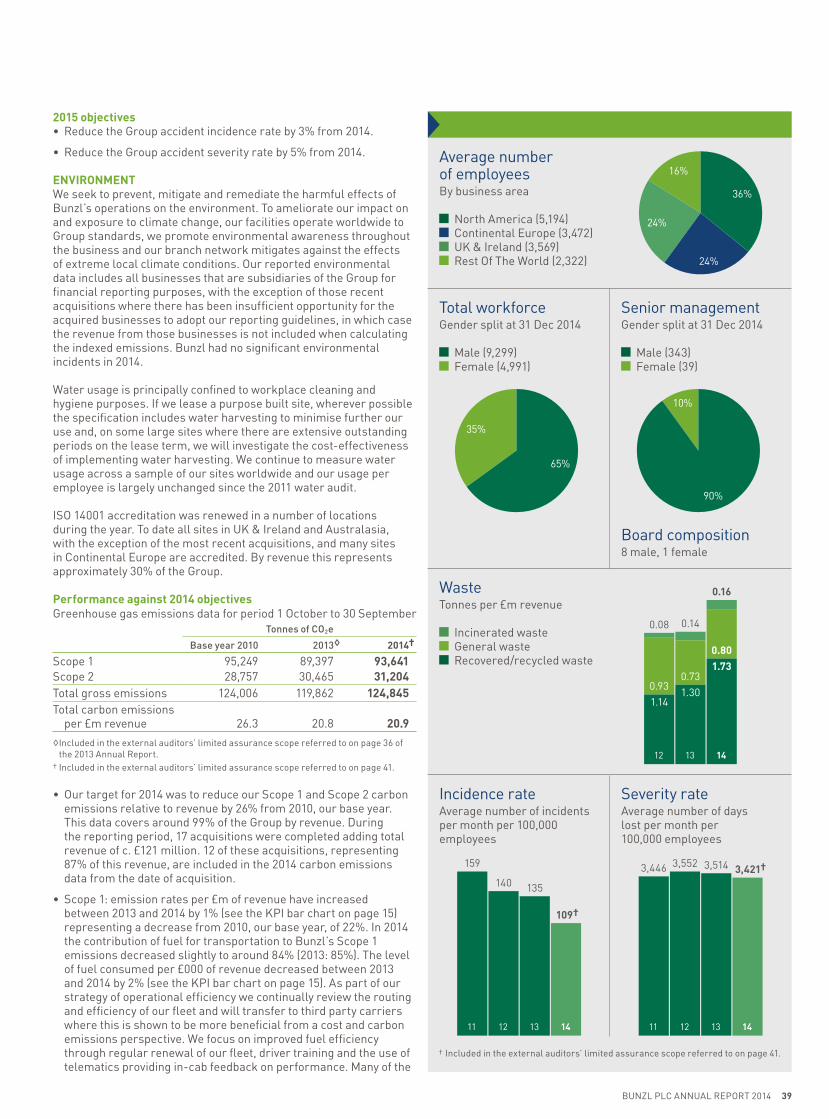
BUNZL PLC ANNUAL REPORT 2014 39
2015 objectives• Reduce the Group accident incidence rate by 3% from 2014.
• Reduce the Group accident severity rate by 5% from 2014.
ENVIRONMENTWe seek to prevent, mitigate and remediate the harmful effects of Bunzl’s operations on the environment. To ameliorate our impact on and exposure to climate change, our facilities operate worldwide to Group standards, we promote environmental awareness throughout the business and our branch network mitigates against the effects of extreme local climate conditions. Our reported environmental data includes all businesses that are subsidiaries of the Group for financial reporting purposes, with the exception of those recent acquisitions where there has been insufficient opportunity for the acquired businesses to adopt our reporting guidelines, in which case the revenue from those businesses is not included when calculating the indexed emissions. Bunzl had no significant environmental incidents in 2014.
Water usage is principally confined to workplace cleaning and hygiene purposes. If we lease a purpose built site, wherever possible the specification includes water harvesting to minimise further our use and, on some large sites where there are extensive outstanding periods on the lease term, we will investigate the cost-effectiveness of implementing water harvesting. We continue to measure water usage across a sample of our sites worldwide and our usage per employee is largely unchanged since the 2011 water audit.
ISO 14001 accreditation was renewed in a number of locations during the year. To date all sites in UK & Ireland and Australasia, with the exception of the most recent acquisitions, and many sites in Continental Europe are accredited. By revenue this represents approximately 30% of the Group.
Performance against 2014 objectivesGreenhouse gas emissions data for period 1 October to 30 September
Tonnes of CO2e
Base year 2010 2013◊ 2014†
Scope 1 95,249 89,397 93,641Scope 2 28,757 30,465 31,204Total gross emissions 124,006 119,862 124,845Total carbon emissions
per £m revenue 26.3 20.8 20.9
◊ Included in the external auditors’ limited assurance scope referred to on page 36 of the 2013 Annual Report.
† Included in the external auditors’ limited assurance scope referred to on page 41.
• Our target for 2014 was to reduce our Scope 1 and Scope 2 carbon emissions relative to revenue by 26% from 2010, our base year. This data covers around 99% of the Group by revenue. During the reporting period, 17 acquisitions were completed adding total revenue of c. £121 million. 12 of these acquisitions, representing 87% of this revenue, are included in the 2014 carbon emissions data from the date of acquisition.
• Scope 1: emission rates per £m of revenue have increased between 2013 and 2014 by 1% (see the KPI bar chart on page 15) representing a decrease from 2010, our base year, of 22%. In 2014 the contribution of fuel for transportation to Bunzl’s Scope 1 emissions decreased slightly to around 84% (2013: 85%). The level of fuel consumed per £000 of revenue decreased between 2013 and 2014 by 2% (see the KPI bar chart on page 15). As part of our strategy of operational efficiency we continually review the routing and efficiency of our fleet and will transfer to third party carriers where this is shown to be more beneficial from a cost and carbon emissions perspective. We focus on improved fuel efficiency through regular renewal of our fleet, driver training and the use of telematics providing in-cab feedback on performance. Many of the
Average number of employees By business area
North America (5,194) Continental Europe (3,472) UK & Ireland (3,569) Rest Of The World (2,322)
Total workforce Gender split at 31 Dec 2014
Male (9,299) Female (4,991)
Senior management Gender split at 31 Dec 2014
Male (343) Female (39)
Board composition 8 male, 1 female
Waste Tonnes per £m revenue
Incinerated waste General waste Recovered/recycled waste
Incidence rateAverage number of incidents per month per 100,000 employees
Severity rateAverage number of days lost per month per 100,000 employees
35%
65%
10%
90%
13 1412
0.08 0.14
0.16
1.140.93
1.300.73
1.730.80
16%
24%
36%
24%
159
140 135
109†
13 141211 13 141211
3,5523,446 3,514 3,421†
† Included in the external auditors’ limited assurance scope referred to on page 41.
40 BUNZL PLC ANNUAL REPORT 2014
CORPORATE RESPONSIBILITY CONTINUED
businesses acquired since 2010 do not operate their own transport fleets. Gas consumption has increased by around 18% against the previous year. North America consumes more than 80% of the gas used by the Group and in 2014 their consumption increased by 35%. The majority of this increase related to acquisitions, either reporting for the first time or due to the full year impact of acquisitions made in the previous year, as well as the very harsh winter weather conditions in North America in early 2014. The remainder was due to extensions in warehouse capacity to enable us to service the organic growth within our business. These increases far outweighed the substantial reductions in gas consumption made in Continental Europe and UK & Ireland due to milder weather compared with the previous year, as well as steps taken to improve energy efficiency. We continue to focus on improving energy consumption, taking measures which include replacement and maintenance of boilers and heating systems and thermostatically controlling individual radiators.
• Scope 2: emission rates per £m of revenue decreased between 2013 and 2014 by 2% (see the KPI bar chart on page 15) and from 2010, our base year, have decreased by 15%. Although there was an increase in units of electricity consumed as the result of acquisitions either reporting for the first time or due to the full year effect of acquisitions made in 2013, this was offset by our continued investment in energy improvement projects. In relation to such projects, as we lease most of our facilities we need to ensure that there is an appropriate level of payback on the capital expenditure required and in the time remaining on the lease. Where it has been shown to be cost-effective, we have installed energy efficient lighting, making use of the technical advancements available which reduce the cost of such programmes. In North America wherever possible we negotiate with our landlords to make such improvements a condition of lease renewal. Our new facility at Birch Coppice in the UK is designed to make maximum use of daylight and we are seeing substantial reductions in electricity as a result of this combined with its up-to-date lighting system. Other projects include installation of high frequency energy chargers, voltage optimisation and the purchase of more efficient chargers for our material handling equipment. In addition, we have run successful ‘Switch off’ campaigns where we have involved our staff in conserving electricity and this has resulted in savings being made even in those facilities where physical site improvements have not yet been implemented.
• Waste data covers around 95% (2013: 96%) of the Group by revenue. When calculating the index, the revenue has been amended to take account of those businesses in Latin America, Israel and Australasia that are not currently reporting. We continue to increase waste segregation facilities and staff are encouraged to work towards zero waste to landfill both in our warehouses and offices. We have reduced the amount of virgin packaging purchased by the Group by reusing transit packaging wherever possible. The accuracy of the waste to landfill data varies depending on the waste contractor and wherever possible we appoint contractors who are able to weigh waste at the point of collection.
• Scope 3: we have sought to develop our Scope 3 carbon emissions reporting in line with our CR reporting guidelines. While much progress has been made, we have found it difficult to obtain suitable and consistent data from our third party carriers. We have now identified a methodology which we will implement throughout the Group and are in the process of developing the 2014 footprint to form a baseline for future years.
2015 objectives• Using the 2010 data as the baseline, reduce the Scope 1 carbon
emissions by 25% (3% from 2014 to 2015) and the Scope 2 carbon emissions by 17% (2% from 2014 to 2015).
• Complete the development of a Scope 3 carbon emissions report in line with the Group’s reporting guidelines.
• Implement the requirement of the Energy Saving Opportunity Scheme (ESOS) as appropriate.
• More closely integrate the environmental reporting with our financial reporting processes.
COMMUNITYAlthough Bunzl’s operations are international, our strength is in the local nature of our businesses. In keeping with this ethos, we particularly support the fund raising activities championed by our employees locally. This is supplemented by donations made at Group level to charities predominantly in the fields of healthcare, disability and the environment as well as benevolent societies to support projects in communities where our operations are based. Where possible and appropriate, Bunzl also looks to donate stock free of charge (‘in-kind’). Group wide, Bunzl donated a total of £572,000 (2013: £580,000) to charities in 2014, up 3% at constant exchange rates. This does not include in-kind donations or employee fund raising.
SUPPLIERSPrice is only one factor in our purchasing decisions and matters such as quality, availability, our customers’ preferences and our policies are also taken into account. The vast majority of our products are sourced locally by our businesses but many products are sourced elsewhere if it is appropriate to do so. In 2014 less than 20% (2013: 18%) of our products were sourced from lower cost countries. Each business area is responsible for implementing appropriate processes to assess key suppliers’ compliance with the relevant CR standards and to monitor performance and improvements against such standards. Bunzl focuses on its key suppliers to ensure that they meet the same CR standards we have set for ourselves. We have written to those suppliers that provide us with 50% of our products by value to update them on our CR aspirations and to encourage them to adopt a similar approach.
To assist the business areas, we have our own quality assurance/quality control team based in Shanghai whose main aim is to perform regular audits of our suppliers in Asia to ensure that they meet international standards, as well as testing the factories’ production capabilities and their quality assurance and quality control systems. Employees’ terms and conditions of work, customer service, hygiene management systems and their policies and practices on environmental issues are also checked. Our policy is that all our suppliers meet internationally recognised minimum requirements for workers’ welfare and conditions of employment, as defined by the International Labour Organization or the Ethical Trading Initiative. During 2014 the team has continued to grow and has further refined its CR audit programme to categorise suppliers appropriately in relation to their standards and practices.
Suppliers who are unable to meet all the requirements after an initial assessment/audit are given the opportunity to comply fully within a period which is deemed appropriate for the circumstances. If a serious breach is identified following assessment, an action plan is documented and the supplier is expected to commit to addressing all the areas where discrepancies have been identified. The process of improvement via this method is principally reliant on the commitment of the supplier’s management team/owner/agent to ensure that all

BUNZL PLC ANNUAL REPORT 2014 41
areas are addressed. If we have reason to believe that the supplier is not making sufficient or committed progress, this could lead to a suspension in the relationship until such time that we are confident that all areas are being satisfactorily addressed. Bunzl companies reserve the right to cease a relationship with a supplier if it is found that unacceptable practices are being employed at any sites used for producing or sourcing Bunzl products. Such practices include use of child labour, forced or bonded labour as well as physical abuse or discipline and intimidation. To enhance the processes further, from 2015 any suppliers that are being monitored and assessed due to identification of a serious breach will also be reported to the Board and their progress tracked.
During 2014 we continued to liaise with suppliers and refined and introduced a process to ensure that any paper or wood based products are from sustainable sources in compliance with the relevant timber regulations.
For more information on all of Bunzl’s CR policies and activities please visit the Responsibility section of www.bunzl.com.
EXTERNAL ASSURANCEWe engaged PricewaterhouseCoopers LLP (‘PwC’) to undertake a limited assurance engagement, reporting to Bunzl plc only, using International Standard on Assurance Engagements (‘ISAE’) 3000: ‘Assurance Engagements Other Than Audits or Reviews of Historical Financial Information’ and ISAE 3410: ‘Assurance Engagements on Greenhouse Gas Statements’ over the three KPIs on page 15 and the data on page 39, in each case that has been highlighted with the symbol ‘†’. They have provided an unqualified opinion in relation to the relevant KPIs and data and their full assurance opinion is available in the Responsibility section of our website, www.bunzl.com.
A limited assurance engagement is substantially less in scope than a reasonable assurance engagement in relation to both the risk assessment procedures, including an understanding of internal control, and the procedures performed in response to the assessed risks. In order to reach their opinion, PwC performed a range of procedures including making enquiries of relevant Bunzl management, and evaluating the design of the key structures, systems, processes and controls for managing, recording and reporting the selected information. This included analysing and visiting three sites selected on the basis of their inherent risk and materiality to the Group, to understand the key processes and controls for reporting site performance data and to obtain supporting information. Finally PwC performed limited substantive testing on a selective basis of the selected information in relation to the three sites.
Non-financial performance information, including greenhouse gas quantification in particular, is subject to more inherent limitations than financial information. It is important to read the selected corporate responsibility information contained in this Annual Report in the context of PwC’s full limited assurance opinion and the Company’s Corporate Responsibility Performance Reporting Guidelines which are also available in the Responsibility section of our website.
RISKS The Principal risks and uncertainties section on pages 34 and 35 details the principal risks and uncertainties which could have a material impact on the Group’s business, financial condition or results of operations. Although many CR risks are not seen as principal risks to the Group, as part of the Group risk analysis a number of CR risks which could impact the Group’s business have been identified and these are set out below together with the steps taken by management to mitigate such risks:
Risk Mitigating factors
CR compliance failuresLack of adherence to the Group’s CR policies could result in a variety of issues including those relating to inappropriate business practices, accidents at work and increased levies due to levels of waste or carbon emissions.
The Group has comprehensive CR policies and procedures (including those relating to anti-bribery and corruption) in place throughout the business as well as an established reporting framework.
Loss of key employeesThe Group is not capital intensive but the business is based on strong customer and supplier relationships which are built up locally. Stability of key relationship roles amongst the Group’s employees is therefore important.
The Group seeks to secure key staff with appropriate incentive packages, development opportunities and career progression. Voluntary staff turnover is measured on a monthly basis, which enables any issues to be identified and resolved.
Loss of operating facilities/unavailability of staffClimate change may result in higher frequency of extreme weather conditions. This could result in some of the Group’s facilities being affected or employees being unable to attend for work.
The Group has multi-site facilities with products stocked in more than one location as a result of which the Group usually has the ability to distribute products from nearby facilities. Business continuity plans are in place to minimise the impact of any such issues.
Suppliers’ non-compliance with good CR practicesThe Group is not a manufacturer and has many international suppliers across the world. The failure of one of the Group’s key suppliers to adhere to recognised CR standards could affect the Group’s reputation.
The Group’s key suppliers are principally publicly owned multinational organisations with high standards of operations. Suppliers are monitored by the Group’s purchasing departments and the quality assurance/quality control department based in China audits many suppliers throughout Asia. Key suppliers are made aware of the Group’s CR aspirations.
These risks are seen to be outweighed by a variety of opportunities that arise as a consequence of CR and its impact on the business environment as previously outlined in this report.
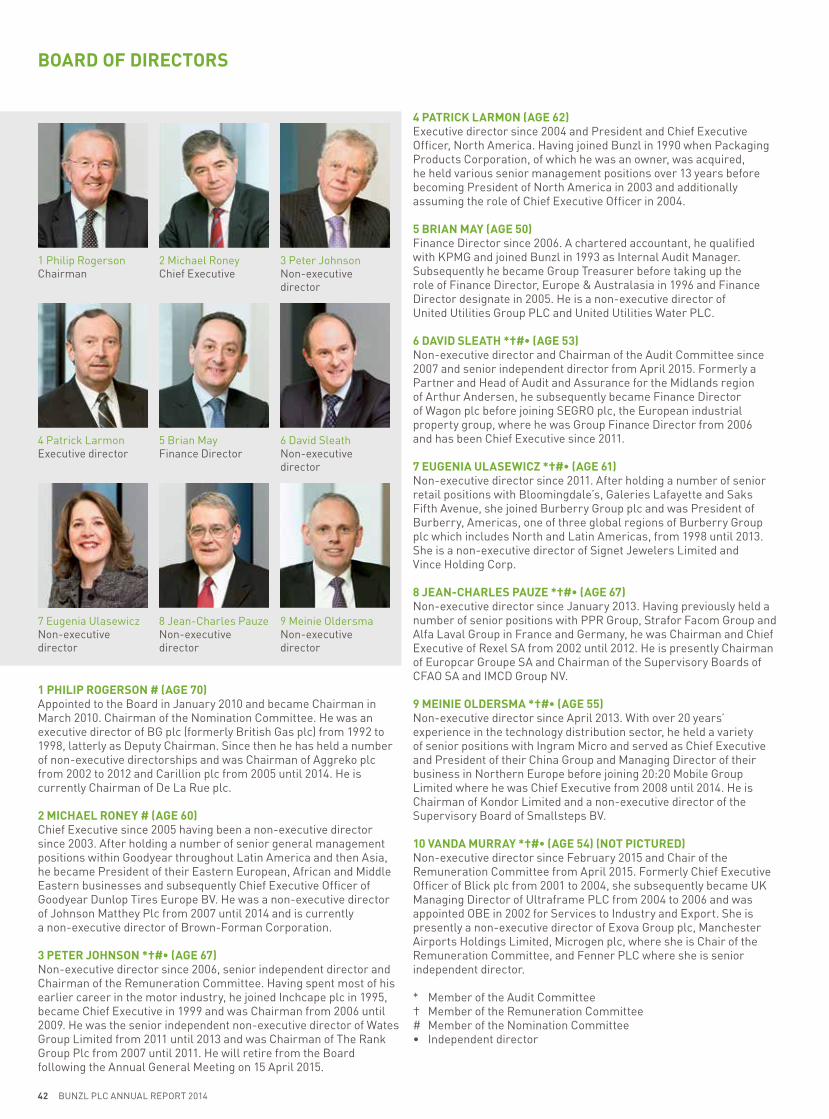
1 PHILIP ROGERSON # (AGE 70)Appointed to the Board in January 2010 and became Chairman in March 2010. Chairman of the Nomination Committee. He was an executive director of BG plc (formerly British Gas plc) from 1992 to 1998, latterly as Deputy Chairman. Since then he has held a number of non-executive directorships and was Chairman of Aggreko plc from 2002 to 2012 and Carillion plc from 2005 until 2014. He is currently Chairman of De La Rue plc.
2 MICHAEL RONEY # (AGE 60)Chief Executive since 2005 having been a non-executive director since 2003. After holding a number of senior general management positions within Goodyear throughout Latin America and then Asia, he became President of their Eastern European, African and Middle Eastern businesses and subsequently Chief Executive Officer of Goodyear Dunlop Tires Europe BV. He was a non-executive director of Johnson Matthey Plc from 2007 until 2014 and is currently a non-executive director of Brown-Forman Corporation.
3 PETER JOHNSON *†#• (AGE 67)Non-executive director since 2006, senior independent director and Chairman of the Remuneration Committee. Having spent most of his earlier career in the motor industry, he joined Inchcape plc in 1995, became Chief Executive in 1999 and was Chairman from 2006 until 2009. He was the senior independent non-executive director of Wates Group Limited from 2011 until 2013 and was Chairman of The Rank Group Plc from 2007 until 2011. He will retire from the Board following the Annual General Meeting on 15 April 2015.
4 PATRICK LARMON (AGE 62)Executive director since 2004 and President and Chief Executive Officer, North America. Having joined Bunzl in 1990 when Packaging Products Corporation, of which he was an owner, was acquired, he held various senior management positions over 13 years before becoming President of North America in 2003 and additionally assuming the role of Chief Executive Officer in 2004.
5 BRIAN MAY (AGE 50)Finance Director since 2006. A chartered accountant, he qualified with KPMG and joined Bunzl in 1993 as Internal Audit Manager. Subsequently he became Group Treasurer before taking up the role of Finance Director, Europe & Australasia in 1996 and Finance Director designate in 2005. He is a non-executive director of United Utilities Group PLC and United Utilities Water PLC.
6 DAVID SLEATH *†#• (AGE 53)Non-executive director and Chairman of the Audit Committee since 2007 and senior independent director from April 2015. Formerly a Partner and Head of Audit and Assurance for the Midlands region of Arthur Andersen, he subsequently became Finance Director of Wagon plc before joining SEGRO plc, the European industrial property group, where he was Group Finance Director from 2006 and has been Chief Executive since 2011.
7 EUGENIA ULASEWICZ *†#• (AGE 61)Non-executive director since 2011. After holding a number of senior retail positions with Bloomingdale’s, Galeries Lafayette and Saks Fifth Avenue, she joined Burberry Group plc and was President of Burberry, Americas, one of three global regions of Burberry Group plc which includes North and Latin Americas, from 1998 until 2013. She is a non-executive director of Signet Jewelers Limited and Vince Holding Corp.
8 JEAN-CHARLES PAUZE *†#• (AGE 67)Non-executive director since January 2013. Having previously held a number of senior positions with PPR Group, Strafor Facom Group and Alfa Laval Group in France and Germany, he was Chairman and Chief Executive of Rexel SA from 2002 until 2012. He is presently Chairman of Europcar Groupe SA and Chairman of the Supervisory Boards of CFAO SA and IMCD Group NV.
9 MEINIE OLDERSMA *†#• (AGE 55) Non-executive director since April 2013. With over 20 years’ experience in the technology distribution sector, he held a variety of senior positions with Ingram Micro and served as Chief Executive and President of their China Group and Managing Director of their business in Northern Europe before joining 20:20 Mobile Group Limited where he was Chief Executive from 2008 until 2014. He is Chairman of Kondor Limited and a non-executive director of the Supervisory Board of Smallsteps BV.
10 VANDA MURRAY *†#• (AGE 54) (NOT PICTURED)Non-executive director since February 2015 and Chair of the Remuneration Committee from April 2015. Formerly Chief Executive Officer of Blick plc from 2001 to 2004, she subsequently became UK Managing Director of Ultraframe PLC from 2004 to 2006 and was appointed OBE in 2002 for Services to Industry and Export. She is presently a non-executive director of Exova Group plc, Manchester Airports Holdings Limited, Microgen plc, where she is Chair of the Remuneration Committee, and Fenner PLC where she is senior independent director.
* Member of the Audit Committee† Member of the Remuneration Committee# Member of the Nomination Committee• Independent director
42 BUNZL PLC ANNUAL REPORT 2014
BOARD OF DIRECTORS
1 Philip Rogerson Chairman
4 Patrick Larmon Executive director
7 Eugenia Ulasewicz Non-executive director
2 Michael Roney Chief Executive
5 Brian May Finance Director
8 Jean-Charles Pauze Non-executive director
3 Peter Johnson Non-executive director
6 David Sleath Non-executive director
9 Meinie Oldersma Non-executive director

INTRODUCTIONBunzl’s corporate governance framework is designed to facilitate effective, entrepreneurial and prudent management that can safeguard shareholders’ interests and sustain the success of the Company over the longer term. In order to achieve this the Company is committed to high standards of corporate governance. In September 2012 the Financial Reporting Council published the 2012 edition of the UK Corporate Governance Code (‘the Code’), a copy of which is available at www.frc.org.uk. This contains broad principles together with more specific provisions which set out standards of good practice in relation to Board leadership and effectiveness, accountability, remuneration and relations with shareholders. This report describes how these principles have been applied by the Company during the year ended 31 December 2014. The Financial Reporting Council published a revised edition of the Code in September 2014 which will apply to the Company for the year ending 31 December 2015. The Company has sought to reflect the revisions to the Code in its practices and will aim to comply fully with the revised Code in 2015. However all references to the Code in this report relate to the 2012 edition of the Code.
COMPLIANCE STATEMENTIt is the Board’s view that for the year ended 31 December 2014 the Company has been fully compliant with all of the relevant provisions set out in the Code applicable to this reporting period. The Company’s auditors, PricewaterhouseCoopers LLP, are required to review whether this statement reflects the Company’s compliance with those provisions of the Code specified for their review by the Listing Rules of the UK Listing Authority and to report if it does not reflect such compliance. No such report has been made.
BOARD COMPOSITIONAs at 31 December 2014, the Board was made up of nine members comprising a Chairman, a Chief Executive, two other executive directors and five non-executive directors. As at the date of this report the Board was made up of 10 members following the appointment of Vanda Murray as a non-executive director with effect from 1 February 2015. Peter Johnson, who has been a non-executive director since 2006, will retire from the Board following the Company’s Annual General Meeting on 15 April 2015. Brief biographical details of the directors are given on page 42. None of the Company’s non-executive directors had any previous connection with the Company or its executive directors on appointment to the Board and all of them are considered by both the Board and the criteria set out in the Code to be independent. The Chairman and each of the non-executive directors have a breadth of strategic, management and financial experience gained in each of their own fields in a range of multinational businesses. In accordance with the terms of the Code each of the directors, with the exception of Peter Johnson who retires at the conclusion of the Annual General Meeting, will be subject to re-election at the forthcoming Annual General Meeting.
THE ROLE OF THE BOARDTo ensure directors maintain overall control over strategic, financial and operational and compliance issues, the Board meets regularly throughout the year and has formally adopted a schedule of matters which are required to be brought to it for decision. Key aspects of the Board’s role include:
• setting the Group’s strategic aims and ensuring that the Company has the necessary capabilities to deliver the Group’s strategy;
• reviewing the Group’s operating performance and approving the Group’s financial results;
• reviewing and approving larger capital expenditure and acquisition/divestment proposals and material increases to borrowing and loan facilities; and
• overseeing the Group’s risk management and internal controls processes and procedures.
There is a clear division of responsibilities between the Chairman and the Chief Executive which is set out in writing and has been agreed by the Board and encompasses the following parameters:
• the primary job of the Chairman is to be responsible for the leadership of the Board and ensuring its effectiveness in all aspects of its role while the Chief Executive is responsible for the leadership and the operational and performance management of the Company within the strategy agreed by the Board.
• the Chairman is viewed by investors as the ultimate steward of the business and the guardian of the interests of all the shareholders.
• the Chairman:
− takes overall responsibility for the composition and capability of the Board and its Committees;
− consults regularly with the Chief Executive and is available on a flexible basis to provide advice, counsel and support to the Chief Executive; and
− ensures corporate governance is conducted in accordance with current best practice, as appropriate to the Group.
• the Chief Executive:
− manages the executive directors and the Group’s management and day-to-day activities;
− prepares and presents to the Board the strategy for growth in shareholder value;
− sets the operating plans and budgets required to deliver the agreed strategy;
− ensures that the Group has in place appropriate risk management and control mechanisms; and
− communicates with the Company’s shareholders and analysts on a day-to-day basis as necessary (subject to an overview of such matters by the Chairman).
The Chief Executive is also the designated member of the Board responsible for environmental, social and governance matters and reports to the Board in relation to such matters.
Peter Johnson is currently the senior independent director and is available to shareholders if they have concerns which contact through the normal channels of Chairman, Chief Executive or Finance Director has failed to resolve or for which such contact is inappropriate. He is also available to the other directors should they have any concerns which are not appropriate to raise with the Chairman or which have not been satisfactorily resolved by the Chairman. Upon Peter Johnson’s retirement in April 2015, David Sleath, who was appointed as a non-executive director in September 2007 and is Chairman of the Audit Committee, will assume the role of senior independent director.
The non-executive directors play a key role in corporate governance and accountability through both their attendance at Board meetings and their membership of the various Board Committees. The non-executive directors bring a broad and diverse range of business and financial expertise and experience to the Board which complements and supplements the experience of the executive directors. This enables them to evaluate information provided and constructively challenge management’s viewpoints, assumptions and performance.
BUNZL PLC ANNUAL REPORT 2014 43
CORPORATE GOVERNANCE REPORT
The Board has appointed Audit, Remuneration and Nomination Committees, all of which comply with the provisions of the Code and play an important governance role through the detailed work they carry out to fulfil the responsibilities delegated to them. Briefing papers are prepared and circulated to Committee members in advance of each meeting and, in respect of the Audit Committee, made available to the other directors. Further information relating to the Board Committees is set out below.
INFORMATION AND SUPPORTBoard agendas are set by the Chairman in consultation with the Chief Executive and with the assistance of the Company Secretary, who maintains a rolling programme of items for discussion by the Board to ensure that all matters reserved for the Board and other key issues are considered at the appropriate time. The Board is supplied with full and timely information, including detailed financial information, to enable the directors to discharge their responsibilities. To enable informed decision making, briefing papers are prepared and circulated to directors approximately one week before the scheduled Board meeting. All directors have access to the advice and services of the Company Secretary who is tasked with ensuring that Board procedures are complied with and the Board is fully briefed on relevant legislative, regulatory and corporate governance developments. Directors may also take independent professional advice at the Company’s expense where they judge this to be necessary in the furtherance of their duties to discharge their responsibilities as directors.
The Board meets formally at least seven times a year and the Board calendar is planned to ensure that the directors discuss a wide range of topics throughout the year. Normally at least two Board meetings a year are held at or near Group locations in the UK and overseas where the directors have the opportunity to meet and interact with senior executives from different businesses within the Group’s portfolio as well as observe the operations in situ. During 2014 a number of the Group’s senior executives made presentations to the Board about a variety of different and diverse topics including reviews of potential acquisition opportunities, the post-acquisition performance of businesses acquired in prior years, the Group’s financing facilities and treasury policies and health and safety performance metrics.
In addition to regular Board meetings, the directors meet annually to review and discuss the Group’s overall strategy. As part of this process, presentations are made by the Chief Executive and the heads of each of the business areas together with the Director of Corporate Development.
All new directors receive a tailored induction on joining the Board, including meetings with senior management and visits to some of the Group’s locations. They also receive a detailed information pack which includes details of directors’ duties and responsibilities, procedures for dealing in Bunzl’s shares and a number of other governance related issues. Directors are continually updated on the Group’s businesses and their markets and the changes to the competitive and regulatory environments in which they operate.
Training and development needs of the Board are kept under review and directors attend external courses where it is considered appropriate for them to do so.
CONFLICTS OF INTERESTThe directors are required to avoid situations where they have, or could have, a direct or indirect interest that conflicts, or possibly may conflict, with the Company’s interests. In accordance with the Companies Act 2006, the Company’s Articles of Association allow the Board to authorise potential conflicts of interest that may arise and to impose such limits or conditions as it thinks fit.
Directors are required to give notice of any potential situational and/or transactional conflicts which are then considered by the Board and, if considered appropriate, authorised accordingly. A director is not however permitted to participate in such considerations or to vote in relation to their own conflicts.
The Board has considered and authorised a number of potential situational conflicts all of which relate to the holding of external directorships and have been entered on the Company’s conflicts register. No actual conflicts have been identified during the year. The Board considers that these procedures operate effectively.
AUDIT COMMITTEEThe Audit Committee comprises all of the independent non-executive directors and is chaired by David Sleath who, as Chief Executive and formerly Group Finance Director of SEGRO plc and as a fellow of the ICAEW, is considered by the Board to have recent and relevant financial experience as required by the Code. While the other directors are not members of the Committee, they normally attend meetings of the Committee by invitation together with the Head of Internal Audit and representatives from the external auditors. The Secretary to the Committee is Paul Hussey, Company Secretary. Further details about the Audit Committee and the work undertaken by it during the year and prior to the publication of the Group’s results for 2014 are set out in the Audit Committee report on pages 48 to 51. Members’ attendance at the Committee meetings held during the year is set out in the table on page 45. The terms of reference of the Committee, which were reviewed and revised by the Board during the year following a recommendation made by the Committee, are available on the Company’s website, www.bunzl.com.
REMUNERATION COMMITTEEThe Remuneration Committee comprises all of the independent non-executive directors and is currently chaired by the senior independent director, Peter Johnson. Upon Peter Johnson’s retirement in April 2015, Vanda Murray, who was appointed as a non-executive director in February 2015, will assume the role of Chair of the Remuneration Committee. While neither the Chairman of the Company nor the Chief Executive are members of the Committee, they normally attend meetings by invitation except when the Committee is considering matters concerning themselves. The Secretary to the Committee is Celia Baxter, Director of Group Human Resources. Further details of the Remuneration Committee, the Company’s remuneration policy and how it is applied are set out in the Directors’ remuneration report on pages 52 to 72. Members’ attendance at the Committee meetings held during the year is set out in the table on page 45. The terms of reference of the Committee, which were reviewed during the year, are available on the Company’s website.
NOMINATION COMMITTEECompositionThe Nomination Committee comprises the Chairman of the Company, who chairs the Committee (unless the Committee is dealing with the matter of succession of the Chairman of the Company), the Chief Executive and all of the non-executive directors. In accordance with the provisions of the Code, the majority of the members are independent non-executive directors. The Secretary to the Committee is Paul Hussey, Company Secretary.
RoleThe Committee’s principal role is to consider, and make recommendations to the Board concerning, the composition of the Board and its Committees including proposed appointees to the Board, whether to fill any vacancies that may arise or to change the number of Board members. It is the Committee’s role to ensure that the Board and its Committees maintain the appropriate balance of skills, knowledge, experience and diversity to ensure their continued effectiveness.
44 BUNZL PLC ANNUAL REPORT 2014
CORPORATE GOVERNANCE REPORT CONTINUED
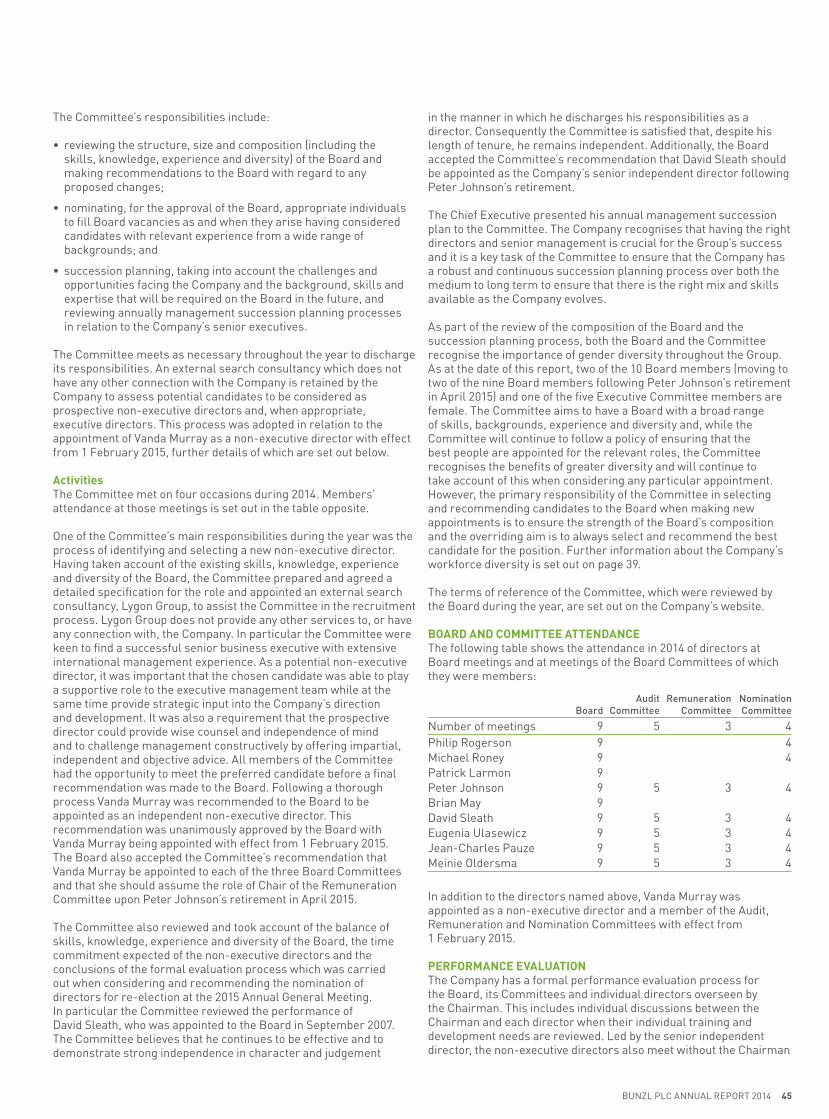
The Committee’s responsibilities include:
• reviewing the structure, size and composition (including the skills, knowledge, experience and diversity) of the Board and making recommendations to the Board with regard to any proposed changes;
• nominating, for the approval of the Board, appropriate individuals to fill Board vacancies as and when they arise having considered candidates with relevant experience from a wide range of backgrounds; and
• succession planning, taking into account the challenges and opportunities facing the Company and the background, skills and expertise that will be required on the Board in the future, and reviewing annually management succession planning processes in relation to the Company’s senior executives.
The Committee meets as necessary throughout the year to discharge its responsibilities. An external search consultancy which does not have any other connection with the Company is retained by the Company to assess potential candidates to be considered as prospective non-executive directors and, when appropriate, executive directors. This process was adopted in relation to the appointment of Vanda Murray as a non-executive director with effect from 1 February 2015, further details of which are set out below.
ActivitiesThe Committee met on four occasions during 2014. Members’ attendance at those meetings is set out in the table opposite.
One of the Committee’s main responsibilities during the year was the process of identifying and selecting a new non-executive director. Having taken account of the existing skills, knowledge, experience and diversity of the Board, the Committee prepared and agreed a detailed specification for the role and appointed an external search consultancy, Lygon Group, to assist the Committee in the recruitment process. Lygon Group does not provide any other services to, or have any connection with, the Company. In particular the Committee were keen to find a successful senior business executive with extensive international management experience. As a potential non-executive director, it was important that the chosen candidate was able to play a supportive role to the executive management team while at the same time provide strategic input into the Company’s direction and development. It was also a requirement that the prospective director could provide wise counsel and independence of mind and to challenge management constructively by offering impartial, independent and objective advice. All members of the Committee had the opportunity to meet the preferred candidate before a final recommendation was made to the Board. Following a thorough process Vanda Murray was recommended to the Board to be appointed as an independent non-executive director. This recommendation was unanimously approved by the Board with Vanda Murray being appointed with effect from 1 February 2015. The Board also accepted the Committee’s recommendation that Vanda Murray be appointed to each of the three Board Committees and that she should assume the role of Chair of the Remuneration Committee upon Peter Johnson’s retirement in April 2015.
The Committee also reviewed and took account of the balance of skills, knowledge, experience and diversity of the Board, the time commitment expected of the non-executive directors and the conclusions of the formal evaluation process which was carried out when considering and recommending the nomination of directors for re-election at the 2015 Annual General Meeting. In particular the Committee reviewed the performance of David Sleath, who was appointed to the Board in September 2007. The Committee believes that he continues to be effective and to demonstrate strong independence in character and judgement
in the manner in which he discharges his responsibilities as a director. Consequently the Committee is satisfied that, despite his length of tenure, he remains independent. Additionally, the Board accepted the Committee’s recommendation that David Sleath should be appointed as the Company’s senior independent director following Peter Johnson’s retirement.
The Chief Executive presented his annual management succession plan to the Committee. The Company recognises that having the right directors and senior management is crucial for the Group’s success and it is a key task of the Committee to ensure that the Company has a robust and continuous succession planning process over both the medium to long term to ensure that there is the right mix and skills available as the Company evolves.
As part of the review of the composition of the Board and the succession planning process, both the Board and the Committee recognise the importance of gender diversity throughout the Group. As at the date of this report, two of the 10 Board members (moving to two of the nine Board members following Peter Johnson’s retirement in April 2015) and one of the five Executive Committee members are female. The Committee aims to have a Board with a broad range of skills, backgrounds, experience and diversity and, while the Committee will continue to follow a policy of ensuring that the best people are appointed for the relevant roles, the Committee recognises the benefits of greater diversity and will continue to take account of this when considering any particular appointment. However, the primary responsibility of the Committee in selecting and recommending candidates to the Board when making new appointments is to ensure the strength of the Board’s composition and the overriding aim is to always select and recommend the best candidate for the position. Further information about the Company’s workforce diversity is set out on page 39.
The terms of reference of the Committee, which were reviewed by the Board during the year, are set out on the Company’s website.
BOARD AND COMMITTEE ATTENDANCEThe following table shows the attendance in 2014 of directors at Board meetings and at meetings of the Board Committees of which they were members:
BoardAudit
CommitteeRemuneration
CommitteeNominationCommittee
Number of meetings 9 5 3 4Philip Rogerson 9 4Michael Roney 9 4Patrick Larmon 9Peter Johnson 9 5 3 4Brian May 9David Sleath 9 5 3 4Eugenia Ulasewicz 9 5 3 4Jean-Charles Pauze 9 5 3 4Meinie Oldersma 9 5 3 4
In addition to the directors named above, Vanda Murray was appointed as a non-executive director and a member of the Audit, Remuneration and Nomination Committees with effect from 1 February 2015.
PERFORMANCE EVALUATIONThe Company has a formal performance evaluation process for the Board, its Committees and individual directors overseen by the Chairman. This includes individual discussions between the Chairman and each director when their individual training and development needs are reviewed. Led by the senior independent director, the non-executive directors also meet without the Chairman
BUNZL PLC ANNUAL REPORT 2014 45
present at least annually to appraise the Chairman’s performance including a review of his other commitments to ensure that he is able to allocate sufficient time to the Company to discharge his responsibilities effectively. The Chairman also periodically holds meetings with the non-executive directors without the executive directors present. All of these processes were carried out satisfactorily during the year.
In accordance with the requirements of the Code an external performance evaluation was carried out in 2012 and the results were subsequently presented to the Board. The facilitator of the external evaluation, Lintstock, does not provide any other services to, or have any other connection with, the Company. Although the Code only requires that the evaluation of the Board and its Committees should be externally facilitated at least every three years, the Board has decided to appoint Lintstock to carry out a performance evaluation each year and accordingly external evaluations were completed in both 2013 and 2014. By doing so, the Board is able to ensure that there is consistency and continuity in the evaluation process and the presentation of the results from one year to the next. Following the evaluation which was carried out in 2014, the Board identified a number of key priorities in order to improve the Board’s performance, including:
• allowing more time for discussion on the key strategic issues facing the Group both as part of the Board’s annual strategy review and at other times of the year as appropriate;
• continuing the focus of the Nomination Committee on the management succession plans for the Group, including in particular maintaining the Board’s exposure to the Group’s senior management below Board level;
• increasing the focus on both the opportunities and threats presented by future developments in technology and digital marketing activities and how these might best be developed in order to maintain the continuing success of the Group; and
• arranging for more external speakers to present to the Board from time to time on specific topics of interest.
As a result of the overall performance evaluation process carried out in 2014, the Board concluded that both it and its Committees are operating effectively.
FINANCIAL AND BUSINESS REPORTINGThe responsibilities of the directors in respect of the preparation of the Group and parent company financial statements are set out on page 120 and the auditors’ report on pages 121 to 126 includes a statement by the external auditors about their reporting responsibilities. As set out on page 33, the directors are of the opinion that it is appropriate to continue to adopt the going concern basis in preparing the financial statements.
The process of preparing the Annual Report has included the following:
• comprehensive reviews undertaken at different levels in the Group in order to ensure the accuracy, consistency and overall balance of the Annual Report; and
• verification procedures, both internally and by the external auditors, to deal with the factual content of the Annual Report.
From the information and assurance provided by the ongoing work of the internal audit department, the reviews conducted by the external auditors in relation to both the half year and full year results, the Board’s understanding of the Group’s business and the information provided by the senior executive management team, the Board considers that the Annual Report, taken as a whole, is fair, balanced and understandable and provides the information necessary for shareholders to assess the Company’s performance, business model and strategy.
RISK MANAGEMENT AND INTERNAL CONTROLThe directors acknowledge that they have overall responsibility for identifying and managing the risks faced by the Group and for the Group’s system of internal control relating to those risks. However, such a system is designed to manage rather than eliminate the risk of failure to achieve business objectives and can only provide reasonable and not absolute assurance against material misstatement or loss. In accordance with Principle C.2 of the Code and the related guidance, the Company has established the procedures necessary to ensure that there is an ongoing process for identifying, evaluating, managing and mitigating significant risks to the Group and for determining the nature and extent of the significant risks it is willing to take to achieve its strategic objectives. The directors confirm that such procedures have been in place for the year ended 31 December 2014 and up to the date of approval of these financial statements and have been reviewed during the year.
Further information relating to how the directors maintain overall control over all significant strategic, financial, operational and compliance issues is set out in the ‘Role of the Board’ section on page 43.
In addition, the Board has delegated to an Executive Committee, consisting of the Chief Executive, Finance Director and other functional managers, the responsibility for identifying, evaluating and monitoring the risks facing the Group and for deciding how these are managed and to establish a system of internal control appropriate to the business environments in which the Group operates. The principal features of this system include:
• a procedure for monitoring the effectiveness of the internal control system through a tiered management structure with clearly defined lines of responsibility and delegation of authority;
• clearly defined authorisation procedures for capital investment and acquisitions;
• strategic plans and comprehensive budgets which are prepared annually by the business areas and approved by the Board;
• formal standards of business conduct (including a code of ethics and whistle blowing procedure) based on honesty, integrity, fair dealing and compliance with the local laws and regulations of the countries in which the Group operates;
• a well established consolidation and reporting system for the statutory accounts and monthly management accounts;
• continual investment in IT systems to ensure the production of timely and accurate management information relating to the operation of the Group’s businesses; and
• detailed manuals covering Group accounting policies and policies and procedures for the Group’s treasury operations supplemented by internal control procedures at a business area level.
46 BUNZL PLC ANNUAL REPORT 2014
CORPORATE GOVERNANCE REPORT CONTINUED

Some of the procedures carried out in order to monitor the effectiveness of the internal control system and to identify, manage and mitigate business risk are listed below:
• central management holds regular meetings with business area management to discuss strategic, operational and financial issues including a review of the significant risks affecting each of the business areas and the policies and procedures by which these risks are managed;
• the Executive Committee meets twice per month and also reviews the outcome of the discussions held at business area meetings on internal control and risk management issues;
• the Board in turn reviews the outcome of the Executive Committee discussions on internal control and risk management issues which ensures a documented and auditable trail of accountability;
• each business area, the Executive Committee and the Board carry out an annual fraud risk assessment;
• actual results are reviewed monthly against budget, forecasts and the previous year and explanations obtained for all significant variances;
• all treasury activities, including in relation to the management of foreign exchange exposures and Group borrowings, are reported and reviewed monthly;
• the Group’s bank balances around the world are monitored on a weekly basis and significant movements are reviewed centrally;
• the internal audit department periodically reviews individual businesses and procedures, makes recommendations to improve controls and follows up to ensure that management implements the recommendations made. The internal audit department’s work is determined on a risk assessment basis and their findings are reported to Group and business area management as well as to the Audit Committee and the external auditors;
• an annual self-assessment of the status of internal controls measured against a prescribed list of minimum standards is performed by every business and action plans are agreed where remedial action is required;
• the Audit Committee, which comprises all of the independent non-executive directors of the Company, meets regularly throughout the year. Further details of the work of the Committee, which includes a review of the effectiveness of the Company’s internal financial controls and the assurance procedures relating to the Company’s risk management system, are set out in the Audit Committee report on pages 48 to 51;
• regular meetings are held with insurance and risk advisers to assess the risks throughout the Group;
• a management committee, which oversees issues relating principally to environment, health & safety, insurance and business continuity planning matters, sets relevant policies and practices and monitors their implementation;
• risk assessments, safety audits and a regular review of progress against objectives established by each business area are periodically carried out; and
• developments in tax, treasury and accounting are continually monitored by Group management in association with external advisers.
The directors confirm that they have reviewed the effectiveness of the system of internal control and risk management in operation during 2014.
The external auditors are engaged to express an opinion on the financial statements. The audit includes the review and evaluation of the system of internal financial control and the data contained in the financial statements to the extent necessary for expressing an audit opinion on the truth and fairness of the financial statements.
RELATIONS WITH SHAREHOLDERSThe Company reports formally to shareholders twice a year with the half year results announced normally at the end of August and the annual results announced normally at the end of February. In addition the Company has historically published two interim management statements a year as required by the Disclosure and Transparency Rules (‘the DTRs’). Although with effect from 7 November 2014 the DTRs no longer require interim management statements to be published by listed companies, it is the Board’s current intention to continue to issue interim management statements on a voluntary basis in order to keep the Company’s shareholders and the financial markets periodically updated on the Company’s trading performance outside of the regulatory announcements made in relation to the half year and annual results.
The Chief Executive and Finance Director have regular meetings with representatives of institutional shareholders and report to the Board the views of major shareholders. Additional forms of communication include presentations of the half year and annual results. The Chairman and the senior independent director and the other non-executive directors are available to meet with major shareholders on request. The Board also periodically reviews and discusses analysts’ and brokers’ reports and surveys of shareholder opinions conducted by the Company’s own brokers.
Notice of the Annual General Meeting is sent to shareholders at least 20 working days before the meeting. All shareholders are encouraged to participate in the Annual General Meeting, are invited to ask questions at the meeting and are given the opportunity to meet all of the directors informally. Shareholders unable to attend are encouraged to vote using the proxy card mailed to them or electronically as detailed in the Notice of Meeting. Shareholders are given the option to withhold their vote on the proxy form. As in previous years, at the forthcoming Annual General Meeting each of the resolutions put to the meeting will be taken on a poll rather than on a show of hands as directors believe that a poll is more representative of shareholders’ voting intentions because shareholder votes are counted according to the number of shares held and all votes tendered are taken into account. The results of the poll will be publicly announced and made available on the Company’s website as soon as practicable following the Annual General Meeting.
On behalf of the Board
Paul HusseySecretary23 February 2015
BUNZL PLC ANNUAL REPORT 2014 47
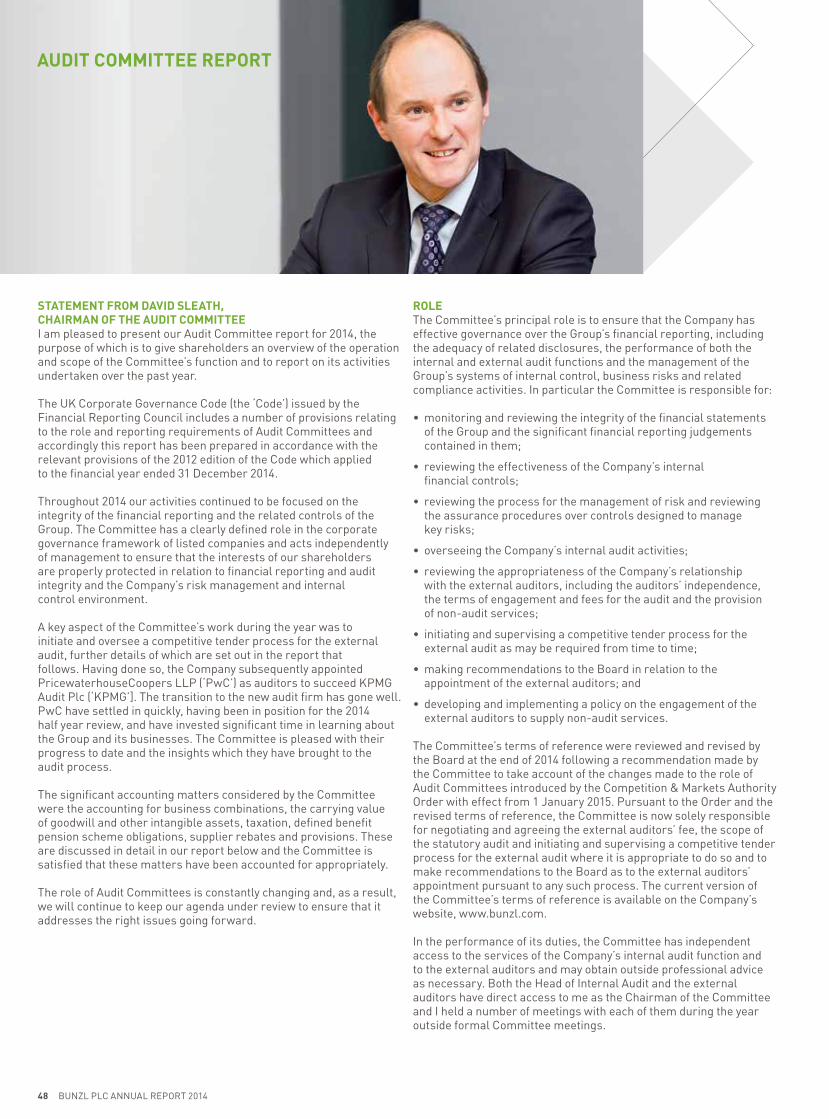
STATEMENT FROM DAVID SLEATH, CHAIRMAN OF THE AUDIT COMMITTEEI am pleased to present our Audit Committee report for 2014, the purpose of which is to give shareholders an overview of the operation and scope of the Committee’s function and to report on its activities undertaken over the past year.
The UK Corporate Governance Code (the ‘Code’) issued by the Financial Reporting Council includes a number of provisions relating to the role and reporting requirements of Audit Committees and accordingly this report has been prepared in accordance with the relevant provisions of the 2012 edition of the Code which applied to the financial year ended 31 December 2014.
Throughout 2014 our activities continued to be focused on the integrity of the financial reporting and the related controls of the Group. The Committee has a clearly defined role in the corporate governance framework of listed companies and acts independently of management to ensure that the interests of our shareholders are properly protected in relation to financial reporting and audit integrity and the Company’s risk management and internal control environment.
A key aspect of the Committee’s work during the year was to initiate and oversee a competitive tender process for the external audit, further details of which are set out in the report that follows. Having done so, the Company subsequently appointed PricewaterhouseCoopers LLP (‘PwC’) as auditors to succeed KPMG Audit Plc (‘KPMG’]. The transition to the new audit firm has gone well. PwC have settled in quickly, having been in position for the 2014 half year review, and have invested significant time in learning about the Group and its businesses. The Committee is pleased with their progress to date and the insights which they have brought to the audit process.
The significant accounting matters considered by the Committee were the accounting for business combinations, the carrying value of goodwill and other intangible assets, taxation, defined benefit pension scheme obligations, supplier rebates and provisions. These are discussed in detail in our report below and the Committee is satisfied that these matters have been accounted for appropriately.
The role of Audit Committees is constantly changing and, as a result, we will continue to keep our agenda under review to ensure that it addresses the right issues going forward.
ROLEThe Committee’s principal role is to ensure that the Company has effective governance over the Group’s financial reporting, including the adequacy of related disclosures, the performance of both the internal and external audit functions and the management of the Group’s systems of internal control, business risks and related compliance activities. In particular the Committee is responsible for:
• monitoring and reviewing the integrity of the financial statements of the Group and the significant financial reporting judgements contained in them;
• reviewing the effectiveness of the Company’s internal financial controls;
• reviewing the process for the management of risk and reviewing the assurance procedures over controls designed to manage key risks;
• overseeing the Company’s internal audit activities;
• reviewing the appropriateness of the Company’s relationship with the external auditors, including the auditors’ independence, the terms of engagement and fees for the audit and the provision of non-audit services;
• initiating and supervising a competitive tender process for the external audit as may be required from time to time;
• making recommendations to the Board in relation to the appointment of the external auditors; and
• developing and implementing a policy on the engagement of the external auditors to supply non-audit services.
The Committee’s terms of reference were reviewed and revised by the Board at the end of 2014 following a recommendation made by the Committee to take account of the changes made to the role of Audit Committees introduced by the Competition & Markets Authority Order with effect from 1 January 2015. Pursuant to the Order and the revised terms of reference, the Committee is now solely responsible for negotiating and agreeing the external auditors’ fee, the scope of the statutory audit and initiating and supervising a competitive tender process for the external audit where it is appropriate to do so and to make recommendations to the Board as to the external auditors’ appointment pursuant to any such process. The current version of the Committee’s terms of reference is available on the Company’s website, www.bunzl.com.
In the performance of its duties, the Committee has independent access to the services of the Company’s internal audit function and to the external auditors and may obtain outside professional advice as necessary. Both the Head of Internal Audit and the external auditors have direct access to me as the Chairman of the Committee and I held a number of meetings with each of them during the year outside formal Committee meetings.
48 BUNZL PLC ANNUAL REPORT 2014
AUDIT COMMITTEE REPORT

ACTIVITIESAs Chairman of the Committee, I hold preparatory discussions with the Company’s senior management, the Head of Internal Audit and the external auditors prior to Committee meetings to discuss the items to be considered at the Committee meetings. In addition, separate discussions are held between the Committee and the Head of Internal Audit and the external auditors without management present. I also attend the Annual General Meeting to respond to any shareholder questions that might be raised on the Committee’s activities. The Committee met on five occasions during the year and members’ attendance at those meetings is set out in the table on page 45.
The Committee’s activities included:
• overseeing a competitive tender process for the position of the Company’s external auditors;
• following completion of the competitive tender process, making recommendations to the Board concerning the appointment of the external auditors and approving the remuneration and terms of engagement of the auditors including the audit strategy and planning process for the current financial year;
• receiving and considering reports from management and the external auditors in relation to the half yearly financial report and the annual financial statements;
• reviewing the half yearly financial report and the annual financial statements and the formal announcements relating thereto;
• receiving and considering reports from the Head of Internal Audit in relation to the work undertaken by the internal audit function and reviewing and approving the internal audit work programme for the year;
• reviewing the effectiveness of the Company’s internal financial controls and the assurance procedures relating to the Company’s risk management systems;
• reviewing the arrangements by which staff may, in confidence, raise concerns about possible improprieties in matters of financial reporting or other matters and receiving periodic reports relating to the matters raised through such arrangements;
• reviewing, and making a recommendation to the Board to change, the Committee’s terms of reference;
• reviewing the Committee’s effectiveness following an externally facilitated performance evaluation;
• reviewing the effectiveness of both the external auditors and the internal audit function following completion of detailed questionnaires by both the Board and senior management within the Company;
• reviewing and approving the level and nature of non-audit work which the external auditors performed during the year, including the fees paid for such work;
• reviewing the principal tax risks applicable to the Company and the steps taken to manage such risks; and
• as part of an ongoing programme to review specific areas relating to financial reporting matters within the Group’s businesses, receiving and considering a presentation about the finance function and control environment within the Group’s operations in Brazil.
Following each Committee meeting, I report any significant findings to the Board and copies of the minutes of the Committee meetings are circulated to all of the directors and to the external auditors.
EXTERNAL AUDIT TENDER AND APPOINTMENT OF AUDITORSIn considering whether to recommend to the Board the appointment or re-appointment of the external auditors, the Committee takes into account the tenure of the auditors in addition to the results of its review of the effectiveness of the external auditors and considers whether there should be a full tender process either as a result of that review or as may be required by the relevant regulations. There are no contractual obligations restricting the Committee’s choice of external auditors.
KPMG (or its predecessor firms) had been the Company’s external auditors since 1986 and was responsible for the audit of the Company’s financial statements for the year ended 31 December 2013.
In line with the new provision introduced in the 2012 edition of the Code and the report of the UK Competition Commission which required listed companies to tender the external audit at least once every 10 years, during the early part of 2014 the Board accepted a recommendation from the Committee that the Company should carry out such a tender during 2014 with a view to the successful firm performing the external audit for the year ending 31 December 2014. In order to comply with good governance practice and given KPMG’s length of tenure as the Company’s auditors and the then current regulatory environment which was expected to impose an obligation on listed companies to rotate their auditors periodically (such obligation having subsequently been made a mandatory requirement), following a recommendation from the Committee the Board decided that it intended to appoint a new audit firm as the Company’s external auditors following the tender process. As a result KPMG was not invited to participate in the process. Following the agreement of a detailed timetable and step plan, a formal Invitation to Tender document was issued to those audit firms determined by the Committee to have the appropriate international expertise and resources to carry out effectively the external audit of the Company and its subsidiaries.
BUNZL PLC ANNUAL REPORT 2014 49
‘ The Committee will remain focused on the audit, assurance and risk processes within the business, as well as financial reporting itself, and will continue to evolve its activities in line with the regulatory framework and market practice for Audit Committees.’

50 BUNZL PLC ANNUAL REPORT 2014
The detailed responses to the Invitation to Tender were then assessed and reviewed against agreed criteria and each of the audit firms made presentations in May 2014. The Committee subsequently recommended to the Board that PwC be appointed as the external auditors in succession to KPMG. Following approval by the Board, the appointment was duly notified to shareholders and to the Financial Reporting Council and became effective on 19 May 2014. PwC’s fees for the audit for the year ending 31 December 2014 were considered and agreed by the Committee as part of the tender process.
Having been appointed during the year, PwC have expressed their willingness to continue as auditors of the Company and the Committee has therefore recommended to the Board that a resolution proposing the re-appointment of PwC as external auditors be put to shareholders at the forthcoming Annual General Meeting.
FINANCIAL STATEMENTS AND SIGNIFICANT ACCOUNTING MATTERSDuring the year and prior to the publication of the Group’s results for 2014, the Audit Committee reviewed the 2014 half yearly financial report, the 2014 Annual Report (including the financial statements), the 2014 annual results news release and the reports from the external auditors, PwC, on the outcomes of their half year review and audit relating to 2014.
As part of its work, the Committee considered the following significant accounting issues, matters and judgements in relation to the Group’s financial statements:
Accounting for business combinationsFor business combinations, the Group has a long-standing process for the identification of the fair values of the assets acquired and liabilities assumed including separate identification of intangible assets using external valuation specialists where required. The Committee reviewed this process and discussed with management and the external auditors the methodology and assumptions used to value the assets and liabilities of the significant acquisitions completed in 2014. The Committee concluded that it was satisfied with management’s valuations of these assets and liabilities, including the degree to which such valuations are supported by professional advice from external advisers.
The carrying value of goodwill and other intangible assetsGoodwill is allocated to cash generating units (‘CGUs’) and is tested annually for impairment. The Committee critically reviewed and discussed management’s report on the impairment testing of the carrying value of goodwill and other intangible assets of each CGU and considered the external auditors’ testing thereof including the sensitivity of the outcome of impairment testing to the use of different discount rates. After due challenge and debate, the Committee concluded that it was satisfied with the assumptions and judgements applied in relation to such testing and agreed that there was no impairment to goodwill or other intangible assets. Details of the key assumptions and judgements used are set out in Note 9 to the financial statements.
Taxation The Committee reviewed a report and received a presentation from the Head of Tax highlighting the principal tax risks that the Group faces, the tax strategy and a detailed risk assessment relating to the tax risks identified including the judgements underpinning the provisions for potential tax liabilities. The Committee also reviewed the results of the external auditors’ assessment of provisions for income taxes and, having done so, was satisfied with the key judgements made by management.
Defined benefit pension scheme obligationsThe Committee considered reports from management and the external auditors in relation to the valuation of the defined benefit pension schemes and reviewed the key actuarial assumptions used in calculating the defined benefit pension liabilities, especially in relation to discount rates, inflation rates and mortality/life expectancy. The Committee discussed the reasons for the increase in the net pension deficit and was satisfied that the assumptions used were appropriate and were supported by independent actuarial specialists. Details of the key assumptions used are set out in Note 20 to the financial statements.
Supplier rebatesThe Group has various rebate arrangements with a number of suppliers. Some of these arrangements are based on the volume of products purchased and others are based on the volume of products sold. The recognition of supplier rebate income from these arrangements may involve the requirement for some estimates to be made about whether certain conditions related to such rebate income have been, or will be, met. In reviewing the consolidated financial statements, the Committee considered a report from management in relation to the key financial controls over supplier rebates, the accounting treatment for each type of rebate, the value of the different types of rebates in the income statement for the year and the value of supplier rebate income receivables at the year end. The Committee discussed the findings of the external auditors in this area and discussed with management the supplier rebate accounting process. Having done so, the Committee concluded that it was satisfied with the Group’s supplier rebate accounting process for the year and with the value of rebate income recognised.
ProvisionsThe Group holds a number of provisions relating to properties (including liabilities for onerous lease commitments, repairs and dilapidations) and actual and anticipated legal, environmental and other claims. The Committee reviewed reports from management and the external auditors concerning the significant provisions held for such matters including any provisions with notable movements and those provisions requiring a greater degree of judgement. The Committee considered the background to such provisions and discussed with management the judgements applied in determining the value of provisions required. The Committee enquired of management and the external auditors as to the existence of other matters potentially requiring a provision to be made. The Committee concluded that it was satisfied with the value of provisions carried.
EXTERNAL AUDITORS’ INDEPENDENCE AND EFFECTIVENESSThe Committee ensures that the external auditors remain independent of the Company and receives written confirmation from the external auditors as to whether they consider themselves independent within the meaning of their own internal and the relevant regulatory and professional requirements. Key members of the audit team rotate off the Company’s audit after a specific period of time.
In order to ensure that the objectivity and independence of the external auditors is not compromised, the Committee has also pre-approved the non-audit service categories that can be provided by the external auditors and agreed monetary amounts for each service category that can be provided by them, subject to a maximum individual engagement value. Certain categories of services are prohibited under the ethical standards of the Accounting Practices Board. A permitted service requires specific authorisation from the Committee or myself as the Committee Chairman where it does not fall within the pre-approved categories or where its value exceeds the maximum pre-approved individual engagement value.
AUDIT COMMITTEE REPORT CONTINUED

BUNZL PLC ANNUAL REPORT 2014 51
Such non-audit service categories which are pre-approved principally comprise tax services and further assurance services relating to pre-acquisition due diligence and other duties carried out in respect of acquisitions and disposals of businesses. It is the Company’s policy to assess the services required on a case by case basis to ensure that the most appropriate adviser is retained. As a result the Committee believes that it is sometimes appropriate for this additional work to be carried out by the Company’s auditors. However other firms are also used by the Company to provide non-audit services if such other firms are thought to be best placed to undertake the work involved. Details of the fees paid to the external auditors in 2014 in respect of the audit and for non-audit services are set out in Note 4 to the financial statements.
During 2014 the Committee carried out a review of the effectiveness of the external audit process carried out in relation to the audit of the financial statements for the year ended 31 December 2013. As part of this review, the Committee considered feedback on the audit gathered through a detailed survey which was completed by each of the directors and members of the Company’s senior management team at both Group and business area levels. The survey covered a total of 27 different aspects of the audit process grouped under four separate headings; the robustness of the audit process, the quality of delivery, the quality of reporting and the quality of people and service. Each respondent was asked to award a rating on a scale of 1 to 5 for each aspect reviewed and to provide any additional comments they wished to make in relation to the questions raised. The Committee discussed the findings of the survey and their overall assessment of the work of the auditors. The Committee will carry out a similar effectiveness review in 2015 in relation to the audit of the financial statements for the year ended 31 December 2014.
INTERNAL CONTROL AND RISK MANAGEMENTAs mentioned above, the Committee is responsible for reviewing on behalf of the Board the effectiveness of the Company’s internal financial controls and the assurance procedures relating to the Company’s risk management system. These controls and procedures are designed to manage, but not eliminate, the risk of failure of the Company to meet its business objectives and, as such, provide reasonable, but not absolute, assurance against material misstatement or loss. During the year, the Committee monitors the effectiveness of the internal financial controls framework through reports from the Finance Director, the Head of Internal Audit and the external auditors. In particular the Committee considered the scope and results of work of the internal audit function, the findings of the external auditors in relation to the year end audit, the assessment of fraud risk carried out by management, the controls over the Company’s financial consolidation and reporting system, the treasury controls, the tax risks and the processes for setting strategic plans and budgets and for monitoring the ongoing performance of the Company.
In relation to the risk management system, the Committee reviewed the process by which significant risks had been identified by management and the Board, the key controls and other processes designed to manage and mitigate such risks and the assurance provided by the internal audit function, the external auditors and other oversight from management and the Board.
INTERNAL AUDITThe Company has an internal audit department which comprises eight in-house auditors, including the Head of Internal Audit who reports jointly to me, in my capacity as Chairman of the Audit Committee, and the Finance Director. The scope of work of the internal audit function covers all systems and activities of the Group. Work is prioritised according to the Company’s risk profile with the annual audit plan being approved by the Committee each year. Internal audit reports are regularly provided to the Committee which include details of the audit findings, and the relevant management actions required in order to address any issues arising therefrom, as well as updates on the progress made by management in addressing any outstanding recommendations from previously reported findings. In addition, the internal audit function reports on any significant issues relating to the processes for controlling the activities of the Group and the adequacy and effectiveness of such processes. Together the work of the internal audit function provides the Committee with a further means of monitoring the processes and actions to manage and mitigate those risks identified as posing the greatest threat to the Company.
A review by the Committee of the effectiveness of the internal audit function was carried out during the year. The Committee considered the results of a detailed questionnaire completed by each of the directors and those members of the senior management team who interact with the internal audit department and discussed generally the work of the internal audit department, the adequacy of resources and the skills and capabilities of the internal audit team.
David SleathChairman of the Audit Committee23 February 2015

52 BUNZL PLC ANNUAL REPORT 2014
DIRECTORS’ REMUNERATION REPORT
This report has been prepared on behalf of and has been approved by the Board. It complies with Schedule 8 to the Large and Medium-sized Companies and Groups (Accounts and Reports) Regulations 2008 (as amended) (the ‘Regulations’), the UK Corporate Governance Code and the Financial Conduct Authority Listing Rules and takes into account the accompanying Directors’ Remuneration Reporting Guidance and the relevant policies of shareholder representative bodies. This report is presented in three main sections: an annual statement from the Chairman of the Committee; the Directors’ remuneration policy report as approved by shareholders at the 2014 Annual General Meeting (‘AGM’); and the Annual report on remuneration for 2014. The report also contains information relating to the directors’ remuneration for 2015 and additional information on directors’ share interests.
STATEMENT FROM PETER JOHNSON, CHAIRMAN OF THE REMUNERATION COMMITTEEOur strategic focus places great importance on continuing to grow organically and by acquisition in support of one of Bunzl’s main objectives, which is to build shareholder value, and this has once again been demonstrated in 2014. The remuneration framework is designed to reinforce the link between pay and performance and reward senior executives for delivering superior shareholder returns. The Committee considers that the current remuneration arrangements are simple and transparent for both employees and shareholders and that performance is assessed against measures and targets that are relevant to Bunzl’s business and are stretching, while providing maximum clarity.
A significant amount of Bunzl’s success can be attributed to the strong leadership of the management team. Bunzl is an international business providing outsourcing solutions and value-added distribution across the Americas, Europe and Australasia. It is important that key individuals are retained and that we can attract new talent into the business by recruitment or acquisition. The competitiveness of the remuneration package we offer is therefore key. The remuneration framework is structured in a way that allows us to compete for talent across multiple geographies while also complying with UK corporate governance good practice.
During 2013 we reviewed the remuneration structure which had served the business well over many years. Having done so, we made a number of changes to ensure the remuneration framework continued to support the strategic direction of the business and further comply with good practice, while addressing various matters previously raised by shareholder representative bodies. The principal change related to the introduction of a revised Long Term Incentive Plan (‘LTIP’) to be known as the 2014 LTIP. The policy report that describes the individual elements of remuneration was approved at the 2014 AGM for a period of three years until April 2017. No changes to the policy are being proposed for 2015. However for ease of reference we have included the policy report once again in the 2014 Annual Report although, in accordance with the 2013 regulations, we will only be inviting shareholders to approve the Annual report on remuneration for 2014 at the 2015 AGM.
The 2014 LTIP was also approved by shareholders at the 2014 AGM for a 10 year period. Executive share options and performance shares were awarded using this plan in August and October respectively. The 2014 LTIP provides a clawback facility under which part or the full amount of a vested award may be recovered in certain circumstances. A clawback provision is already in place for the annual bonus in relation to unvested shares under the Deferred Annual Share Bonus Scheme (‘DASBS’).
During the year the Committee reviewed the appropriateness of the performance conditions relating to the options and awards to be granted under the 2014 LTIP. Taking due consideration of the prevailing economic and market conditions, the Committee decided that the performance conditions as published in the Annual report on remuneration for 2013 were still suitably stretching for the 2014 grant of options and performance share awards. Further the Committee reviewed the key performance indicators (‘KPIs’) for the 2014 annual bonus and it was agreed that adjusted earnings per share and return on average operating capital performance for the year relative to a target level of return were still appropriate and that the target levels were stretching without encouraging inappropriate levels of risk.
The Committee considers that the out-turn of our incentive plans, appropriately reflects Bunzl’s performance in 2014. For example, for the Chief Executive the annual bonus was 85% of the maximum opportunity, which equated to 98% of his annual salary and 100% of executive share options and 89% of performance shares vested. During 2014, Bunzl’s total shareholder return (‘TSR’) performance continued to rise against a flat performance by the FTSE Support Services sector and the share price reached an all-time high.
The Committee has not exercised any discretion to adjust performance targets as a result of events that have taken place during the year.
Peter JohnsonChairman of the Remuneration Committee23 February 2015

BUNZL PLC ANNUAL REPORT 2014 53
‘ The out-turn of our incentive plans in 2014 appropriately reflects our performance while the targets set are sufficiently stretching without encouraging inappropriate levels of risk.’
DIRECTORS’ REMUNERATION POLICY REPORTBunzl continues to pursue its well defined strategy of developing the business through organic growth, consolidating the markets in which we compete through focused acquisitions in both existing and new geographies and continuously improving the efficiency of our operations. Bunzl’s business model relies on excellent customer and supplier relationships and the skills, knowledge and experience of its directors and employees. The Company’s remuneration policy supports this strategy by ensuring that the overall remuneration package is set at a competitive level while ensuring that additional reward is paid for high performance over a sustained period. This policy is designed to ensure the recruitment, retention and motivation of the executive directors and other senior executives over the long term.
The performance related elements of the remuneration package are designed to incentivise executives to meet key performance metrics which align their interests and remuneration with those of shareholders, for example targets relating to earnings per share and TSR. In setting such targets the Committee takes due account of the potential effect such targets could have on the attitude and behaviour of executives to risk within the business. In addition the Committee has the discretion to take into account performance on environmental, social and governance matters.
The following table summarises the policy for the remuneration of executive directors approved at and effective from the 2014 AGM which is binding until the AGM to be held in 2017.
Salary
Purpose • recognise knowledge, skills and experience as well as reflect the scope and size of the role
• reward individual performance without encouraging undue risk
• promote the importance of environmental, social and governance issues
Operation • paid in 12 equal monthly instalments during the year
• reviewed annually, normally in December (with any changes usually effective from January)
• taking into consideration individual and Group performance, salary increases across the Group are benchmarked for appropriate salary levels using a comparator group of similarly sized companies with a large international presence
• pensionable
Maximum potential value
• salary increases are normally considered in relation to the salary increases of other employees in the Group and performance of the individual unless there has been a major change in role or responsibility or major market movement. The annual salaries for the executive directors for 2014 and 2015 are on pages 63 and 69 respectively
Performance metrics
• individual performance in the role, as well as the performance of the Group and achievements related to environmental, social and governance issues, are all taken into consideration

54 BUNZL PLC ANNUAL REPORT 2014
DIRECTORS’ REMUNERATION REPORT CONTINUED
Annual bonus
Purpose • incentivise the attainment of annual corporate targets
• retain high performing employees
• align with shareholders’ interests
Operation • annual award based on financial targets set by the Committee at the beginning of the year
• at the end of the performance period, which is the Group’s financial year from 1 January until 31 December, the Committee assesses the extent to which the performance measures have been achieved. The level of bonus for each measure is determined by reference to the actual performance relative to that measure’s performance targets, on a pro rata basis
• any bonus is paid as 50% in cash and 50% in shares (with the shares normally deferred for three years under the DASBS)
• a clawback facility is in operation by which part or the full deferred bonus award may be reduced or cancelled to the extent that the value of the bonus originally awarded is subsequently found to have been overstated as a result of a material misstatement of the financial accounts by which the bonus was originally determined
• non-pensionable
Maximum potential value
• the annual on target bonus opportunity for Michael Roney and Brian May is 70% of salary with a threshold award of 49% of salary and a maximum award of 115% of salary and for Patrick Larmon is 65% of salary with a threshold award of 31% of salary and a maximum award of 110% of salary
Performance metrics
• the principal measure for performance is the growth at constant exchange rates in the Company’s earnings per share adjusted to exclude items which do not reflect the Company’s underlying financial performance (‘eps’) against the relevant target
• the bonus derived from constant exchange rate eps performance will be increased or decreased according to the Company’s performance against the target return on average operating capital (‘RAOC’), referred to as the RAOC modifier
• the use of eps and RAOC measures are seen as appropriate as they are two of Bunzl’s KPIs. The use of eps growth aligns the executive directors’ interests with those of the shareholders and the RAOC modifier ensures the continued focus on working capital management together with profit growth
• bonus awards are at the Committee’s discretion and may take into account performance on environmental, social and governance matters as appropriate
• Patrick Larmon has additional measures based on the profit before interest and tax (‘pbit’) and working capital employed in the business area for which he has direct responsibility (North America). The additional measures relating to pbit and working capital are relevant for Patrick Larmon as these are both KPIs of the business area he is responsible for running and these measures, together with other performance measures, are used to incentivise the management group in North America
• the performance metrics and targets are reviewed annually to ensure they remain appropriate. The Committee retains the discretion to set alternative metrics as appropriate
• the current relevant performance metrics are: threshold (which must be exceeded to attract any payment of bonus); target; and maximum amount (the level at which the bonus is capped). These performance metrics are determined at the start of the year by reference to the Group’s annual budget. No elements of the bonus are guaranteed. As in previous years, the specific targets will not be disclosed while still commercially sensitive

BUNZL PLC ANNUAL REPORT 2014 55
Long term incentives
Purpose • incentivise growth in longer term eps and TSR
• align with shareholders’ interests
• recruit and retain senior employees
Operation • discretionary biannual grants of executive share option awards and performance share awards which vest subject to performance conditions measured over three years and subject to continuous Company service. There is no opportunity to retest
• a clawback facility is in operation under which part or the full amount of a vested award may be recovered, by reduction in the amount of any future bonus, subsisting award, the vesting of any subsisting award or future share awards and/or a requirement to make a cash payment, to the extent that the value of a vested award is subsequently found to have been overstated as a result of a material misstatement of the financial accounts by which the vesting was determined
• all awards are subject to the discretions contained in the relevant plan rules
Maximum potential value
Executive share options• maximum annual award of 250% of salary
• normal grant levels for executive directors are expected to be between 167% and 200% of salary and the Committee would not grant above this level to incumbent executive directors without further consultation with shareholders
Performance shares• maximum annual award of 150% of salary
• normal grant levels for executive directors are expected to be between 94% and 112.5% of salary and the Committee would not grant above this level to incumbent executive directors without further consultation with shareholders
Performance metrics
Performance and service conditions must be met over a three year performance period
Executive share options• eps performance measure relates to the absolute growth in the Company’s eps against the targets set for the
performance period
• the vesting is scaled as follows:
− no vesting for performance below the threshold target
− 25% of an award will vest for achieving the threshold target
− 100% of an award will vest for achieving or exceeding the maximum target
− for performance between these targets, the level of vesting will vary on a straight line sliding scale
• the Committee annually reviews the performance conditions outlined above and, in line with the rules of the 2014 LTIP, reserves the right to set different targets for forthcoming annual grants provided it is deemed that the relevant performance conditions remain appropriately challenging in the prevailing economic environment
• the targets set out in the Remuneration report on page 66 relate to the previously approved 2004 LTIP. The targets set for the 2014 LTIP are shown on page 67
Performance shares• TSR performance measure (50% of the total award) compares a combination of both the Company’s share price and
dividend performance during the performance period against a comparator group of the constituents of the FTSE 50 – 150 with significant international operations, excluding companies in the financial services, oil & gas and natural resources sectors
• the other 50% of the award is subject to an eps performance measure which relates to the absolute growth in the Company’s eps against the targets set for the performance period
• the vesting for both performance measures is scaled as follows:
− no vesting for performance below median performance (TSR) or the threshold target (eps)
− 25% of an award will vest for achieving median performance (TSR) or the threshold target (eps)
− 100% of an award will vest for achieving or exceeding upper quartile performance (TSR) or the maximum target (eps)
− for performance between these targets, the level of vesting will vary on a straight line sliding scale
• the Committee annually reviews the performance conditions outlined above and, in line with the rules of the 2014 LTIP, reserves the right to set different targets for forthcoming annual grants provided it is deemed that the relevant performance conditions remain appropriately challenging in the prevailing economic environment
• the targets set out in the Remuneration report on page 66 relate to the previously approved 2004 LTIP. The targets set for the 2014 LTIP are shown on page 67

56 BUNZL PLC ANNUAL REPORT 2014
DIRECTORS’ REMUNERATION REPORT CONTINUED
All employee share plans
Purpose • encourage employees including the executive directors to build a shareholding through the operation of all employee share plans such as the HM Revenue & Customs (‘HMRC’) tax advantaged Sharesave Scheme in the UK and the Internal Revenue Service (‘IRS’) approved Employee Stock Purchase Plan (US) (‘ESPP’) in the US
Operation • the Sharesave Scheme has standard terms under which participants can normally enter a savings contract, over a period of either three or five years, in return for which they are granted options to acquire shares at a discount of up to 20% of the market price prevailing on the day immediately preceding the date of invitation to apply for the option. Options are normally exercisable either three or five years after they have been granted
• the ESPP provides an opportunity for employees in the US to purchase the Company’s shares in the market at a 15% discount to the market price. The purchase of the shares is funded by after tax payroll deductions from the employee with the employing company contributing the 15% discount
• rules of both of the above plans were approved by shareholders at the 2011 AGM
Maximum potential value
• in the UK, the Sharesave Scheme is linked to a contract for monthly savings within the HMRC limits over a period of either three or five years (currently £250 per month and rising to £500 per month for invitations to be made in 2015 and thereafter)
• in the US, the ESPP allows the purchase in the market of shares within IRS limits (currently up to an annual maximum of 10% of remuneration or US$25,000 worth of shares, whichever is lower)
Performance metrics
• service conditions apply
Retirement benefits
Purpose • provision of competitive retirement benefits
• retain executive directors
Operation • all defined benefit pension plans in the Group have been closed to new entrants since 2003 with any new recruits being offered defined contribution retirement arrangements and/or a pension allowance
• legacy arrangements exist for one UK based executive director and the US based executive director as disclosed previously
• pension contributions and allowances are normally paid monthly
Maximum potential value
• company pension contributions to defined contribution retirement arrangements or cash allowances are capped at 30% of annual salary
• benefits under the legacy UK defined benefit pension plan accrue at a rate of 2.4% on salary up to the notional pensionable salary cap (from 6 April 2015 £149,400 per annum)
Performance metrics
Not applicable

BUNZL PLC ANNUAL REPORT 2014 57
Other benefits
Purpose • provision of competitive benefits which helps to recruit and retain executive directors
Operation • benefits may include a car allowance or a car which may be fully expensed, various insurances such as life, disability and medical and in some jurisdictions club expenses and other benefits provided from time to time
• some benefits may only be provided in the case of relocation, such as removal expenses, and in the case of an international relocation might also include fees for children’s schooling, home leave, tax equalisation and professional advice etc
Maximum potential value
• the value of benefits is based on the cost to the Company and varies according to individual circumstances. For example the cost of medical insurance varies according to family circumstances and the jurisdiction in which the family is based
Performance metrics
Not applicable
Shareholding requirement
Purpose • strengthen the alignment between the interests of the executive directors and those of shareholders
Operation • executives will be normally expected to retain shares through the exercise of awards under the DASBS and the LTIP until they attain the required holding. Three years is allowed for executives who are promoted from within the Company to achieve the required shareholding. It is recognised that a longer time period may be required for externally recruited executives to achieve the required shareholding
Maximum potential value
• retain shareholdings worth equal to at least 200% of annual salary. This does not include any holdings of deferred shares or vested but unexercised share options or performance shares
Performance metrics
Not applicable
Performance measures and targetsThe key measures used by the Committee for incentivising the executive directors are: eps modified by RAOC for the annual bonus and eps and relative TSR for the 2014 LTIP. The Committee considers that all of these measures are appropriate for incentive purposes.
• Eps is one of Bunzl’s KPIs. The use of eps aligns the executive directors’ interests with those of shareholders. In addition, one of the executive directors, Patrick Larmon, President and Chief Executive Officer of North America, also has part of his annual bonus determined by additional measures relating to pbit and working capital which are relevant as these are two of the KPIs of the business area he is responsible for running.
• RAOC is another of Bunzl’s KPIs. The RAOC modifier ensures continued focus on working capital and profit growth by rewarding efficient profit generation, taking into account acquisitions once they are established, and uses average capital employed rather than only capital at the end of the period.
• Relative TSR provides an external assessment of the Company’s performance against similar sized companies listed in the UK. It also aligns the rewards received by executives with the returns received by shareholders.
This combination of performance measures provides an important balance relevant to the Group’s business and market conditions as well as providing a common goal for the executive directors, senior management and shareholders. The Committee does not feel that the introduction of non-financial measures for the executive directors is appropriate at this time.
The Committee reviews performance targets on an annual basis taking into account the Company’s annual budgeting process, the economic environment in the jurisdictions in which the Company operates and external expectations.
Changes to the remuneration policyA number of changes to the Company’s remuneration policy were implemented following the 2014 AGM in accordance with the remuneration policy approved by shareholders to bring the arrangements in line with best practice. No changes to this remuneration policy are proposed for 2015.
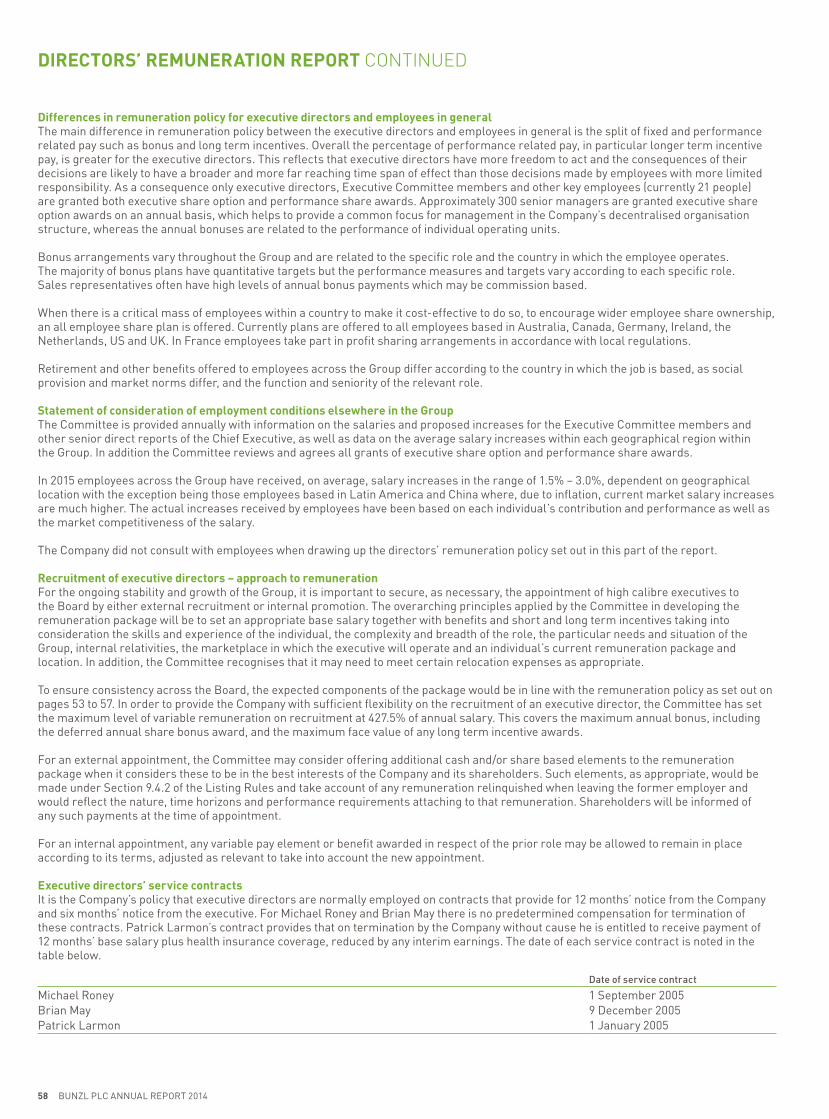
58 BUNZL PLC ANNUAL REPORT 2014
DIRECTORS’ REMUNERATION REPORT CONTINUED
Differences in remuneration policy for executive directors and employees in generalThe main difference in remuneration policy between the executive directors and employees in general is the split of fixed and performance related pay such as bonus and long term incentives. Overall the percentage of performance related pay, in particular longer term incentive pay, is greater for the executive directors. This reflects that executive directors have more freedom to act and the consequences of their decisions are likely to have a broader and more far reaching time span of effect than those decisions made by employees with more limited responsibility. As a consequence only executive directors, Executive Committee members and other key employees (currently 21 people) are granted both executive share option and performance share awards. Approximately 300 senior managers are granted executive share option awards on an annual basis, which helps to provide a common focus for management in the Company’s decentralised organisation structure, whereas the annual bonuses are related to the performance of individual operating units.
Bonus arrangements vary throughout the Group and are related to the specific role and the country in which the employee operates. The majority of bonus plans have quantitative targets but the performance measures and targets vary according to each specific role. Sales representatives often have high levels of annual bonus payments which may be commission based.
When there is a critical mass of employees within a country to make it cost-effective to do so, to encourage wider employee share ownership, an all employee share plan is offered. Currently plans are offered to all employees based in Australia, Canada, Germany, Ireland, the Netherlands, US and UK. In France employees take part in profit sharing arrangements in accordance with local regulations.
Retirement and other benefits offered to employees across the Group differ according to the country in which the job is based, as social provision and market norms differ, and the function and seniority of the relevant role.
Statement of consideration of employment conditions elsewhere in the GroupThe Committee is provided annually with information on the salaries and proposed increases for the Executive Committee members and other senior direct reports of the Chief Executive, as well as data on the average salary increases within each geographical region within the Group. In addition the Committee reviews and agrees all grants of executive share option and performance share awards.
In 2015 employees across the Group have received, on average, salary increases in the range of 1.5% – 3.0%, dependent on geographical location with the exception being those employees based in Latin America and China where, due to inflation, current market salary increases are much higher. The actual increases received by employees have been based on each individual’s contribution and performance as well as the market competitiveness of the salary.
The Company did not consult with employees when drawing up the directors’ remuneration policy set out in this part of the report.
Recruitment of executive directors – approach to remunerationFor the ongoing stability and growth of the Group, it is important to secure, as necessary, the appointment of high calibre executives to the Board by either external recruitment or internal promotion. The overarching principles applied by the Committee in developing the remuneration package will be to set an appropriate base salary together with benefits and short and long term incentives taking into consideration the skills and experience of the individual, the complexity and breadth of the role, the particular needs and situation of the Group, internal relativities, the marketplace in which the executive will operate and an individual’s current remuneration package and location. In addition, the Committee recognises that it may need to meet certain relocation expenses as appropriate.
To ensure consistency across the Board, the expected components of the package would be in line with the remuneration policy as set out on pages 53 to 57. In order to provide the Company with sufficient flexibility on the recruitment of an executive director, the Committee has set the maximum level of variable remuneration on recruitment at 427.5% of annual salary. This covers the maximum annual bonus, including the deferred annual share bonus award, and the maximum face value of any long term incentive awards.
For an external appointment, the Committee may consider offering additional cash and/or share based elements to the remuneration package when it considers these to be in the best interests of the Company and its shareholders. Such elements, as appropriate, would be made under Section 9.4.2 of the Listing Rules and take account of any remuneration relinquished when leaving the former employer and would reflect the nature, time horizons and performance requirements attaching to that remuneration. Shareholders will be informed of any such payments at the time of appointment.
For an internal appointment, any variable pay element or benefit awarded in respect of the prior role may be allowed to remain in place according to its terms, adjusted as relevant to take into account the new appointment.
Executive directors’ service contractsIt is the Company’s policy that executive directors are normally employed on contracts that provide for 12 months’ notice from the Company and six months’ notice from the executive. For Michael Roney and Brian May there is no predetermined compensation for termination of these contracts. Patrick Larmon’s contract provides that on termination by the Company without cause he is entitled to receive payment of 12 months’ base salary plus health insurance coverage, reduced by any interim earnings. The date of each service contract is noted in the table below.
Date of service contract
Michael Roney 1 September 2005Brian May 9 December 2005Patrick Larmon 1 January 2005

BUNZL PLC ANNUAL REPORT 2014 59
Policy on payment for departure from officeOn termination of an executive director’s service contract, the Committee will take into account the departing director’s duty to mitigate his loss when determining the amount of compensation. The Committee’s policy in respect of the treatment of executive directors leaving the Group is described below and is designed to support a smooth transition from the Company taking into account the interests of shareholders:
Component of pay
Voluntary resignation or termination for cause
Death, ill health, disability(excluding redundancy)
Departure onagreed terms
Base salary, pension and benefits
Paid for the proportion of the notice period worked and any untaken holidays pro rated to the leaving date
Paid up to the date of death or leaving, including any untaken holidays pro rated to such date. In the case of ill health, a payment in lieu of notice may be made and, according to the circumstances, may be subject to mitigation. In such circumstances some benefits such as company car or medical insurance may be retained until the end of the notice period
Treatment will normally fall between the two treatments described in the previous columns, subject to the discretion of the Committee and the terms of any termination agreement
Annual bonus cash
Cessation of employment during a bonus year will normally result in no cash bonus being paid
Cessation of employment during a bonus year or after the year end but prior to the normal bonus payment date will result in cash and deferred bonus being paid and pro rated for the relevant portion of the financial year worked and performance achieved
Annual bonus deferred shares
Unvested deferred shares will lapse
In the case of the death of an executive, all deferred shares will be transferred to the estate as soon as possible after death. In all other cases, subject to the discretion of the Committee, unvested deferred shares will be transferred to the individual on a date determined by the Committee
Executive share options
Unvested executive share options will lapse
Tax advantaged options will vest in full on the cessation of employment and be exercisable for the following 12 months after which any unexercised options will lapse
Subject to the discretion of the Committee, unvested non-tax advantaged share options will normally be retained by the individual for the remainder of the vesting period and remain subject to the relevant performance conditions. However in the case of the death of an executive, the Committee will determine the extent of vesting within 12 months of the date of death
Performance shares
Unvested performance shares will lapse
Subject to the discretion of the Committee, unvested performance shares will normally be retained by the individual for the remainder of the vesting period and remain subject to the relevant performance conditions. However in the case of the death of an executive, the Committee will determine the extent of vesting within 12 months of the date of death
Options under Sharesave
As per HMRC regulations As per HMRC regulations
Other None Disbursements such as legal costs and outplacement fees
Notes a) For share options granted under Part A of the 2004 LTIP, any unvested executive share options which are subject to the discretion of the Committee may vest in full on
the termination date and be exercisable for the following 12 months following which any unexercised options will lapse.b) The Committee will have the authority to settle any legal claims against the Company, e.g. for unfair dismissal etc, that might arise on termination.
Discretions retained by the Committee in operating the incentive plansThe Committee operates the Group’s various incentive plans according to their respective rules and in accordance with HMRC and IRS rules where relevant. To ensure the efficient administration of these plans, the Committee may apply certain operational discretions. These include the following:
• selecting the participants in the plans;
• determining the timing of grants and/or payments;
• determining the quantum of grants and/or payments (within the limits set out in the policy table above);

60 BUNZL PLC ANNUAL REPORT 2014
DIRECTORS’ REMUNERATION REPORT CONTINUED
• adjusting the constituents of the TSR comparator group;
• determining the extent of vesting based on the assessment of performance;
• determining ‘good leaver’ status and the extent of vesting in the case of the share based plans;
• determining the extent of vesting of awards under share based plans in the event of a change of control;
• making the appropriate adjustments required in certain circumstances (e.g. rights issues, corporate restructuring events, variation of capital and special dividends); and
• under the annual review of weighting of performance measures, setting targets for the annual bonus plan and 2014 LTIP from year to year.
The Committee may vary the performance conditions applying to share based awards if an event occurs which causes the Committee to consider that it would be appropriate to amend the performance conditions, provided the Committee considers the varied conditions are fair and reasonable and not materially less challenging than the original conditions would have been but for the event in question.
Remuneration overviewThe remuneration package comprises both core fixed elements (base salary, pension and other benefits) and performance based variable elements (cash bonus, the DASBS and the LTIP). The Committee has set a guideline that for on target performance approximately half of the remuneration package should be performance related. The structure of the remuneration packages for on target and stretch performance for each of the executive directors is illustrated in the bar charts below.
76% 24%
38% 24%26%12%
25% 39%28%8%Stretch performance (Total £2,129,992)
Target performance (Total £1,407,705)
Brian MayThreshold performance (Total £703,442)
98% 2%
42% 28%29%1%
27% 43%29%1%Stretch performance (Total £2,365,822)
Target performance (Total £1,516,616)
Patrick LarmonThreshold performance (Total £657,992)
78% 22%
37% 26%26%11%
24% 41%28%7%Stretch performance (Total £3,858,077)
Target performance (Total £2,509,652)
Michael RoneyThreshold performance (Total £1,207,327)
Salary and benefits Pension Bonus (Cash/DASBS) LTIP
Notesa) Salary represents annual salary for 2015. Patrick Larmon’s salary is paid in US dollars but has been translated at the exchange rate of £1: US$1.65. Benefits such as a car
or car allowance and private medical insurance are as shown on page 63.b) Pension represents the cost of pension accrued in 2014 in the Defined Benefit Section of the Bunzl Pension Plan for Brian May, the value of the annual pension allowance for
Michael Roney and Brian May, the contributions to the Defined Contribution Section of the Bunzl Pension Plan for Michael Roney and the total of Company contributions to Patrick Larmon’s 401K Plan and Retirement Savings Benefit (the ‘RSB’). No further contributions were made through the Defined Contribution Senior Executive Retirement Agreement (‘SERA’), further details of which are shown on page 65. Although there has been no change to the remuneration policy related to Patrick Larmon, the effect of the cessation of payments to the SERA has been to alter the relevant percentages of his remuneration package shown above.
c) Below threshold performance comprises salary, benefits and pension only with no bonus awarded and no LTIP awards vested.d) Target performance comprises annual bonus awarded at target level (i.e. 70% of base salary comprised of 50% cash and 50% deferred shares under the DASBS) and, for
the LTIP, an assumption that 50% of performance shares will vest and that 50% of the share options will vest and deliver 30% of their face value in gain to the executives.e) Stretch performance comprises annual bonus awarded at maximum level (i.e. 115% of base salary for Michael Roney and Brian May and 110% of base salary for Patrick Larmon
comprised of 50% cash and 50% deferred shares under the DASBS) and, for the LTIP, an assumption that 100% of performance shares will vest delivering 100% of their face value in gain to the executive directors and 100% of share options will vest which will deliver 30% of their face value in gain to the executives.

BUNZL PLC ANNUAL REPORT 2014 61
Legacy arrangementsThe Remuneration policy report was approved by shareholders at the 2014 AGM and, by doing so, authority was given to the Company to honour any commitments entered into with current or former directors (that have been disclosed to shareholders in previous remuneration reports) or internally promoted future directors (in each case, such as the payment of a pension or the unwind of legacy share plans). Details of any payments to former directors will be set out in the Remuneration report as they arise.
Policy of executive directors’ external appointmentsWith the specific approval of the Board in each case, executive directors may accept external appointments as non-executive directors of other companies and retain any related fees paid to them.
Non-executive directors’ terms of appointmentOn appointment of a new Chairman of the Board or non-executive director, the fees will be set taking into account the experience and calibre of the individual and the prevailing fee rates of the other non-executive directors at that time.
The non-executive directors do not have service contracts with the Company but instead have letters of appointment. The date of appointment and the most recent re-appointment and the length of service for each non-executive director are shown in the table below.
Date of appointment
Date of last re-appointment
at AGM
Length of service as at
2015 AGM
Philip Rogerson 1 January 2010 16 April 2014 5 years 3 monthsPeter Johnson 1 January 2006 16 April 2014 9 years 3 monthsDavid Sleath 1 September 2007 16 April 2014 7 years 7 monthsEugenia Ulasewicz 1 April 2011 16 April 2014 4 yearsJean-Charles Pauze 1 January 2013 16 April 2014 2 years 3 monthsMeinie Oldersma 1 April 2013 16 April 2014 2 years
Notesa) Peter Johnson will retire from the Board at the conclusion of the 2015 AGM.b) Vanda Murray was appointed as a non-executive director with effect from 1 February 2015.
On termination, at any time, a non-executive director is entitled to any accrued but unpaid director’s fees but not to any other compensation.
Fees policy for Chairman and non-executive directors (the ‘NEDs’)
Purpose • provision of a competitive fee to attract NEDs who have a broad range of experience and skills to oversee the implementation of the Company’s strategy
Operation • determined in light of market practice and with reference to time commitment and responsibilities associated with the roles
• annual fees are paid in 12 equal monthly instalments during the year
• the senior independent director and Chairman of the Audit and Remuneration Committees are paid an extra fee to reflect their additional responsibilities
• the NEDs and the Chairman are not eligible to receive benefits and do not participate in pension or incentive plans. Expenses incurred in respect of their duties as directors of the Company are reimbursed
• the NEDs’ fees are reviewed annually in January each year and the Chairman’s fee is reviewed biennially, the last date being February 2014
• the Board as a whole considers the policy and structure for the NEDs’ fees on the recommendation of the Chairman and the Chief Executive. The NEDs do not participate in discussions on their specific levels of remuneration; the Chairman’s fees are set by the Committee
Maximum potential value
• determined within the overall aggregate annual limit of £1,000,000 authorised by shareholders with reference to the Company’s Articles of Association
Performance metrics
• not eligible to participate in any performance related elements of remuneration
Statement of consideration of shareholder viewsThe Committee considers shareholder feedback received in relation to the AGM each year and guidance from shareholder representative bodies more generally. In addition the Committee consults proactively with its major shareholders prior to making significant changes to its policy. In 2013 consultation was conducted with 19 major shareholders and two shareholder representative bodies with regard to the proposed changes to the remuneration policy and the introduction of a new long term incentive plan. This policy and the 2014 LTIP were approved at the 2014 AGM.

62 BUNZL PLC ANNUAL REPORT 2014
DIRECTORS’ REMUNERATION REPORT CONTINUED
ANNUAL REPORT ON REMUNERATION FOR 2014
Committee remit and membershipThe following independent non-executive directors were members of the Committee during 2014:
Date of appointment to the Committee
Meetings eligible
to attendMeetings
attendance
Peter Johnson 18 January 2006 3 3David Sleath 5 December 2007 3 3Eugenia Ulasewicz 20 April 2011 3 3Jean-Charles Pauze 1 January 2013 3 3Meinie Oldersma 1 April 2013 3 3
Notesa) Peter Johnson will retire from the Board at the conclusion of the 2015 AGM.b) Vanda Murray was appointed as a non-executive director of the Company and as a member of the Committee with effect from 1 February 2015 and will assume the role of Chair
of the Committee upon Peter Johnson’s retirement.
The Secretary to the Committee is Celia Baxter, Director of Group Human Resources. No director plays any part in determining his or her remuneration. During the year ended 31 December 2014, both the Chief Executive and the Chairman were consulted and invited to attend meetings of the Committee, but were not present during any part of the meeting when their own remuneration was under consideration.
The terms of reference of the Committee have been formally adopted by the Board and are available for inspection in the Investor Centre section of the Company’s website, www.bunzl.com. The key responsibilities of the Committee include:
• ensuring that executive directors and senior executives are properly incentivised to attract, retain and fairly reward them for their individual contribution to the Company and having due regard to the policies and practices applied to the rest of the employees within the Group;
• determining the framework or broad policy for the remuneration of the Chairman and the executive directors of the Board including setting their individual remuneration packages as well as their level of remuneration and overseeing all the Company’s long term incentive plans;
• ensuring that remuneration is aligned with and supports the Company’s strategy and performance, having due regard to the shareholders and to the financial and commercial health of the Company, while at the same time not encouraging undue risk taking; and
• communicating and discussing any remuneration issues with the Company’s stakeholders as and when appropriate.
Advisers to the Remuneration CommitteeIn carrying out these responsibilities, the Committee seeks external remuneration advice as necessary. During the year the Committee received advice from PwC and New Bridge Street. PwC provided external survey data on directors’ remuneration and benefit levels. New Bridge Street drafted the rules of the 2014 LTIP and provided information to determine whether, and if so to what extent, the performance conditions attached to existing share option and performance share awards under the 2004 LTIP had been satisfied. The fees payable to each adviser, based on hourly rates, were: £13,500 (PwC) and £9,750 (New Bridge Street) for such work undertaken in 2014. In addition to the work undertaken on behalf of the Committee, PwC, who were appointed from May 2014 as the Company’s external auditors, also provide the Company with some tax related and pre-acquisition due diligence services and New Bridge Street may from time to time also provide services to the Company on remuneration and benefit related matters that are not subject to review by the Committee. The Committee remains satisfied that the provision of these other services does not in any way compromise the independence of their advisers.
Statement of voting at the 2014 AGMLast year the remuneration policy received a 97.79% shareholder vote in favour, the remuneration report received a 97.81% shareholder vote in favour and the 2014 LTIP received a 96.30% shareholder vote in favour as set out below:
Votes cast Votes For % of shares voted Votes Against % of shares voted Votes Withheld
Remuneration policy 264,349,297 258,510,901 97.79 5,838,396 2.21 600,455Remuneration report 264,348,918 258,552,082 97.81 5,796,836 2.19 600,8342014 LTIP 264,349,875 254,558,125 96.30 9,791,750 3.70 593,655
Notesa) The votes ‘For’ include votes given at the Company Chairman’s discretion.b) A vote ‘Withheld’ is not a vote in law and is not counted in the calculation of the votes ‘For’ or ‘Against’ the resolution. Votes ‘For’ and ‘Against’ are expressed as a percentage
of the votes cast.
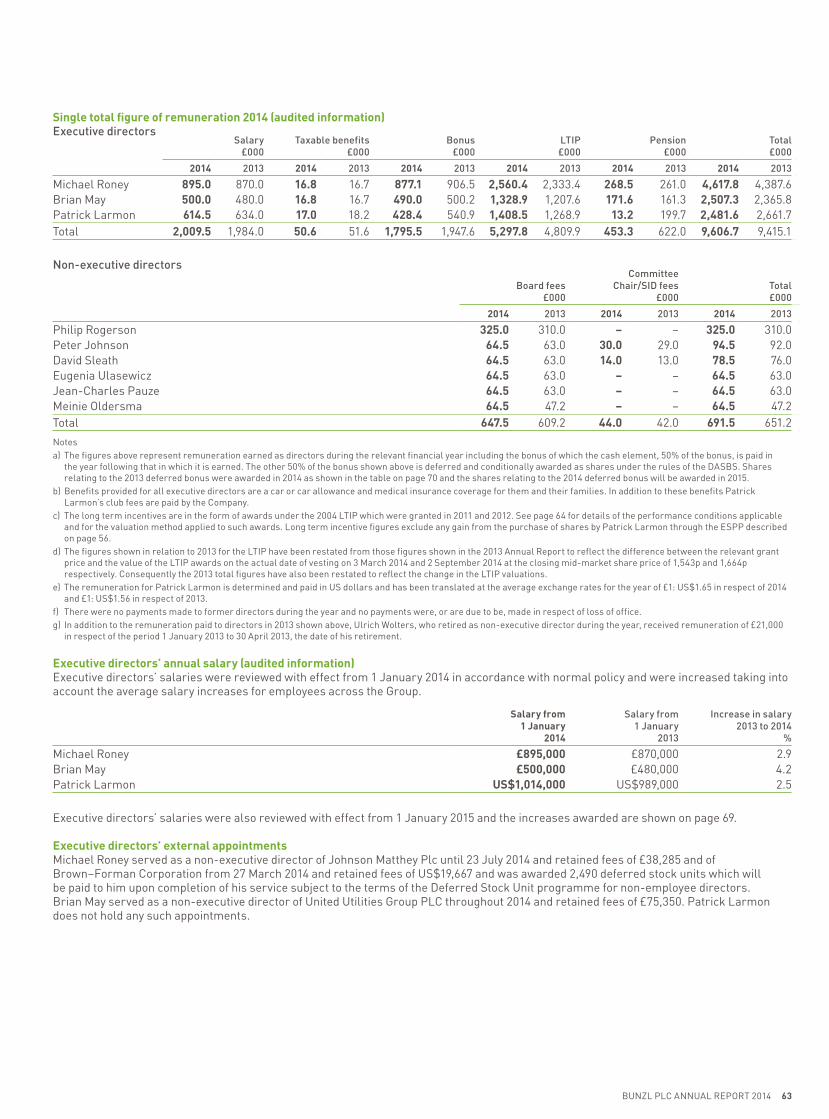
BUNZL PLC ANNUAL REPORT 2014 63
Single total figure of remuneration 2014 (audited information)Executive directors
Salary£000
Taxable benefits£000
Bonus£000
LTIP£000
Pension£000
Total£000
2014 2013 2014 2013 2014 2013 2014 2013 2014 2013 2014 2013
Michael Roney 895.0 870.0 16.8 16.7 877.1 906.5 2,560.4 2,333.4 268.5 261.0 4,617.8 4,387.6Brian May 500.0 480.0 16.8 16.7 490.0 500.2 1,328.9 1,207.6 171.6 161.3 2,507.3 2,365.8Patrick Larmon 614.5 634.0 17.0 18.2 428.4 540.9 1,408.5 1,268.9 13.2 199.7 2,481.6 2,661.7Total 2,009.5 1,984.0 50.6 51.6 1,795.5 1,947.6 5,297.8 4,809.9 453.3 622.0 9,606.7 9,415.1
Non-executive directors
Board fees£000
CommitteeChair/SID fees
£000Total£000
2014 2013 2014 2013 2014 2013
Philip Rogerson 325.0 310.0 – – 325.0 310.0Peter Johnson 64.5 63.0 30.0 29.0 94.5 92.0David Sleath 64.5 63.0 14.0 13.0 78.5 76.0Eugenia Ulasewicz 64.5 63.0 – – 64.5 63.0Jean-Charles Pauze 64.5 63.0 – – 64.5 63.0Meinie Oldersma 64.5 47.2 – – 64.5 47.2Total 647.5 609.2 44.0 42.0 691.5 651.2
Notesa) The figures above represent remuneration earned as directors during the relevant financial year including the bonus of which the cash element, 50% of the bonus, is paid in
the year following that in which it is earned. The other 50% of the bonus shown above is deferred and conditionally awarded as shares under the rules of the DASBS. Shares relating to the 2013 deferred bonus were awarded in 2014 as shown in the table on page 70 and the shares relating to the 2014 deferred bonus will be awarded in 2015.
b) Benefits provided for all executive directors are a car or car allowance and medical insurance coverage for them and their families. In addition to these benefits Patrick Larmon’s club fees are paid by the Company.
c) The long term incentives are in the form of awards under the 2004 LTIP which were granted in 2011 and 2012. See page 64 for details of the performance conditions applicable and for the valuation method applied to such awards. Long term incentive figures exclude any gain from the purchase of shares by Patrick Larmon through the ESPP described on page 56.
d) The figures shown in relation to 2013 for the LTIP have been restated from those figures shown in the 2013 Annual Report to reflect the difference between the relevant grant price and the value of the LTIP awards on the actual date of vesting on 3 March 2014 and 2 September 2014 at the closing mid-market share price of 1,543p and 1,664p respectively. Consequently the 2013 total figures have also been restated to reflect the change in the LTIP valuations.
e) The remuneration for Patrick Larmon is determined and paid in US dollars and has been translated at the average exchange rates for the year of £1: US$1.65 in respect of 2014 and £1: US$1.56 in respect of 2013.
f) There were no payments made to former directors during the year and no payments were, or are due to be, made in respect of loss of office.g) In addition to the remuneration paid to directors in 2013 shown above, Ulrich Wolters, who retired as non-executive director during the year, received remuneration of £21,000
in respect of the period 1 January 2013 to 30 April 2013, the date of his retirement.
Executive directors’ annual salary (audited information)Executive directors’ salaries were reviewed with effect from 1 January 2014 in accordance with normal policy and were increased taking into account the average salary increases for employees across the Group.
Salary from1 January
2014
Salary from 1 January
2013
Increase in salary2013 to 2014
%
Michael Roney £895,000 £870,000 2.9Brian May £500,000 £480,000 4.2Patrick Larmon US$1,014,000 US$989,000 2.5
Executive directors’ salaries were also reviewed with effect from 1 January 2015 and the increases awarded are shown on page 69.
Executive directors’ external appointmentsMichael Roney served as a non-executive director of Johnson Matthey Plc until 23 July 2014 and retained fees of £38,285 and of Brown–Forman Corporation from 27 March 2014 and retained fees of US$19,667 and was awarded 2,490 deferred stock units which will be paid to him upon completion of his service subject to the terms of the Deferred Stock Unit programme for non-employee directors. Brian May served as a non-executive director of United Utilities Group PLC throughout 2014 and retained fees of £75,350. Patrick Larmon does not hold any such appointments.

64 BUNZL PLC ANNUAL REPORT 2014
DIRECTORS’ REMUNERATION REPORT CONTINUED
Non-executive directors’ fees (audited information)The Chairman’s fee is reviewed every two years and the last review was in 2014. The fees for the non-executive directors were reviewed with effect from 1 January 2014 in accordance with normal policy.
With effect from January 2014
£
Fees paidin 2013
£
Increase in fees2013 to 2014
%
Chairman’s fee 325,000 310,000 4.8Non-executive director fee 64,500 63,000 2.4Supplements: Senior independent director 16,000 16,000 –Audit Committee Chairman 14,000 13,000 7.7Remuneration Committee Chairman 14,000 13,000 7.7
The non-executive directors’ fees were reviewed with effect from 1 January 2015 and the increases awarded are shown on page 70.
Performance against annual bonus targets (audited information) The annual bonus plan and DASBS operate as set out in the policy section on page 54. All of Michael Roney’s and Brian May’s and 25% of Patrick Larmon’s bonus potential in 2014 related to the growth in the Company’s constant exchange rate eps relative to budget which was modified by the achievement of the Group’s RAOC relative to budget. This resulted in a bonus payment between the target and maximum bonus opportunity. Eps performance was 5% above target and RAOC was 3% above target. For Patrick Larmon, a further 75% of his bonus potential related to the pbit performance of North America which was modified by the achievement of North America’s return on average operating capital relative to the target set. Pbit performance for North America resulted in a bonus payment 1.6% below target and the return on average operating capital slightly exceeded target as a result of which the bonus related to North America’s performance was increased by 1.1%. Accordingly the total payments under the annual bonus plan were:
Total bonus payment (cash and deferred shares) as a % of salary
2014 %
2013 %
2012 %
2011 %
2010 %
Michael Roney 98.0 104.2 77.0 114.0 81.6Brian May 98.0 104.2 77.0 114.0 81.6Patrick Larmon 69.7 85.3 85.9 110.0 76.7
The monetary values of the bonus payments for 2014 and 2013 are included in the table on page 63.
LTIP grants/awards with performance periods ending in 2014 (audited information)Executive share options – LTIP Part AExecutive share option awards, granted three years previously, are due to vest on 1 March 2015 and 31 August 2015. The Committee assessed the relevant performance of the Company against the performance conditions. Eps (restated on adoption of IAS 19 (revised 2011)) growth was 27.52% for the three years ended 31 December 2014 which compared to an increase in RPI of 7.56% over the same period. Since the performance condition would have been satisfied if eps had grown by at least 16.83% over the period, all of the options will vest. Included in the single total figure of remuneration table on page 63 is the estimated value of these awards based on the difference between the grant price and the average of the Company’s closing mid-market share price for the three month period ended 31 December 2014 (1,702p).
Performance shares – LTIP Part BAwards of performance shares were made to the executive directors on 8 April 2011 and 11 October 2011 with the three year performance periods being completed on 31 March 2014 and 30 September 2014 respectively. The Committee subsequently assessed the performance of the Company against the relevant performance conditions. The extent to which half of the awards would vest was subject to a performance condition based on eps growth relative to RPI. Eps growth was 38.02% for the three years ended 31 December 2013 compared to an increase in RPI of 10.95% over the same period. A quarter of the award would have been exercisable if eps had grown by at least 23.44% over the period and the whole award would have been exercisable if eps had grown by at least 44.05%. As a result of the Company’s actual growth in eps over the period, 78.07% of this part of the awards vested (39.04% of the full awards).
The extent to which the other half of the awards vested was based on the Company’s TSR performance against the relevant comparator group. For the April 2011 award, the Company ranked first out of the remaining 36 companies in the comparator group of companies, as a result of which 100% of this part of the award vested (50% of the full award) for performance above the upper quartile. For the October 2011 award, the Company ranked seventh out of the remaining 34 companies in the comparator group of companies, as a result of which 100% of this part of the award vested (50% of the full award) for performance above upper quartile.
Accordingly 89.04% of the total performance shares awarded in April and October 2011 vested in April and October 2014 respectively. Included in the single total figure of remuneration table on page 63 is the value of these vested awards at the closing mid-market share price on the dates of vesting, 8 April 2014 and 13 October 2014, which were 1,612p and 1,546p respectively.

BUNZL PLC ANNUAL REPORT 2014 65
Total pension entitlements (audited information)Defined benefit pension (DB) entitlements
Pensionplan’s
normalretirement
age
Additionalvalue
of pension on early
retirement£
Pension value in the
year from DB scheme
£
Value of cashallowance including
any company DCand/or 401k
contributionsin 2014
£
Totalpension
2014£
Michael Roney – – – 268,500 268,500Brian May 60 – 64,995 106,620 171,615Patrick Larmon 65 – – 13,152 13,152
Notesa) Michael Roney receives a pension allowance of 30% of base salary. He has chosen to join the Defined Contribution Section of the Bunzl Pension Plan (‘BPP’) and his contribution
of 5% of base salary, up to the pensionable salary cap (notionally £145,800 for tax year 2014/2015 and £141,000 for tax year 2013/2014) is matched by the Company. During 2014 such contributions amounted to £7,230 (2013: £7,005) and this amount was deducted from his pension allowance.
b) Brian May, who joined the Group in the UK prior to the closure of the defined benefit sections of the BPP, is a member of the Bunzl Senior Pension Section of the BPP. His pension accrues at the rate of 2.4% per annum up to two thirds of the pensionable salary cap, as described above. The employee contribution rate is currently 9% of pensionable salary.
c) In addition to benefits from the BPP, Brian May receives a pension allowance of 30% of base salary above the pensionable salary cap which permits him to make provision, of his own choice, in respect of that part of his salary which exceeds the cap.
d) Patrick Larmon originally joined the US Plan, subject to IRS limits, which accrued at a rate of 1.67% per annum up to 50% of the five year average pensionable salary less the primary social security benefit, with a normal retirement age of 65 years. Pensionable salary in the US Plan is capped at US$140,000. On closure of the US Plan, Patrick Larmon chose to freeze his benefit and no further benefits have accrued. Patrick Larmon is currently a member of a defined contribution plan, the Retirement Saving Benefit (‘RSB’). Contributions to the RSB are fully funded by the employer on a sliding scale that is age related. The contributions are a percentage of base salary (maximum 5%) which is capped at US$200,000 per annum. The Company made contributions in respect of Patrick Larmon in 2014 of £6,061 (2013: £6,410).
e) In addition, Patrick Larmon receives a supplementary pension through a defined benefit Senior Executive Retirement Agreement (‘SERA’). Patrick Larmon’s SERA, which became fully accrued in 2012, provides for a lifetime pension of US$100,000 per annum, payable upon retirement. In 2013 the Company paid all necessary expenses, due to changes in assumptions and other factors outside of the Company’s control such as change in market conditions, on actuarial advice, to the SERA which amounted to £47,268 (2013: £47,490). In 2007, this SERA arrangement was closed to new entrants and existing members’ benefits were frozen. A new defined contribution SERA (‘DC SERA’) was put in place for Patrick Larmon and the final contribution of £185,897 was paid to the DC SERA in 2013.
f) Patrick Larmon also participates in the Bunzl USA, Inc Deferred Savings (401k) Plan. The Company makes matching contributions to this Plan. During 2014 contributions for Patrick Larmon amounted to £7,091 (2013: £7,356).
LTIP grant policy Conditional awards of executive share options and performance shares are granted twice a year to executive directors and other senior executives. Executive share option awards are normally granted in February or March and August or September dependent on the date of announcement of the Company’s results. Performance share awards are normally granted in April and October each year. In 2014 executive share options were granted in February and performance share awards were granted in April under the 2004 LTIP in accordance with the previous grant policy and performance conditions as detailed on pages 57 and 66 respectively. Executive share options were also granted in August and performance share awards were granted in October under the 2014 LTIP in accordance with the policy and performance conditions as approved at the 2014 AGM as detailed on pages 57 and 67 respectively.
LTIP interests awarded during the financial year (audited information)
Plan Date of grant Basis of awardFace value
£000
% vesting at threshold
performanceNumber
of sharesPerformance
period end date
Michael Roney 2004 LTIP Part A 27.02.14 75% of salary 673.4 100% 43,000 31.12.162004 LTIP Part B 04.04.14 56.25% of salary 505.9 25% 31,500 31.03.172014 LTIP Part A 29.08.14 100% of salary 895.9 100% 54,600 31.12.162014 LTIP Part B 06.10.14 56.25% of salary 504.6 25% 31,600 30.09.17
Brian May 2004 LTIP Part A 27.02.14 70% of salary 352.4 100% 22,500 31.12.162004 LTIP Part B 04.04.14 52.5% of salary 265.0 25% 16,500 31.03.172014 LTIP Part A 29.08.14 95% of salary 475.9 100% 29,000 31.12.162014 LTIP Part B 06.10.14 52.5% of salary 263.5 25% 16,500 30.09.17
Patrick Larmon 2004 LTIP Part A 27.02.14 62.5% of salary 399.3 100% 25,500 31.12.162004 LTIP Part B 04.04.14 47% of salary 297.1 25% 18,500 31.03.172014 LTIP Part A 29.08.14 95% of salary 582.6 100% 35,500 31.12.162014 LTIP Part B 06.10.14 52.5% of salary 333.8 25% 20,900 30.09.17
NoteThe face value of the awards is calculated using the closing mid-market share price on the day prior to the grant of the award. Options were awarded under the 2004 LTIP Part A on 27 February 2014 and the 2014 LTIP Part A on 29 August 2014 at a value of 1,566p and 1,641p per share respectively. Performance shares were awarded under the 2014 LTIP Part B on 4 April 2014 and the 2014 LTIP on 6 October 2014 at a value of 1,606p and 1,597p per share respectively.
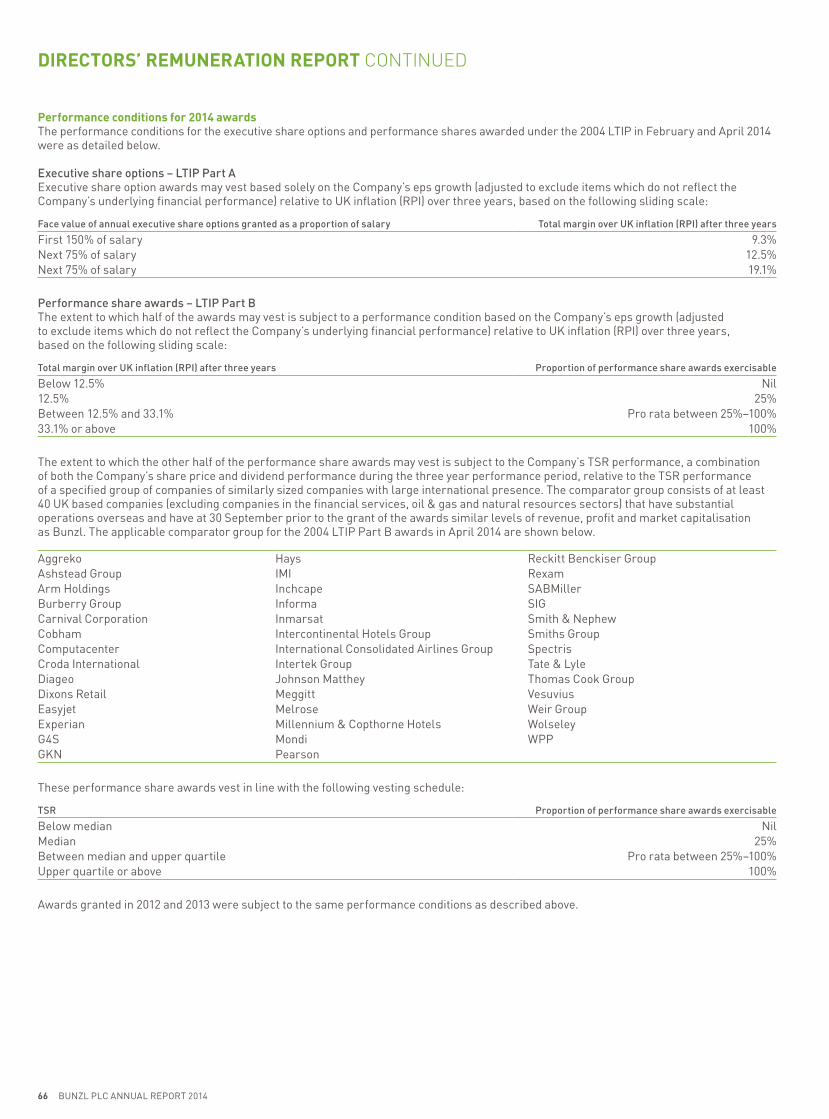
66 BUNZL PLC ANNUAL REPORT 2014
DIRECTORS’ REMUNERATION REPORT CONTINUED
Performance conditions for 2014 awardsThe performance conditions for the executive share options and performance shares awarded under the 2004 LTIP in February and April 2014 were as detailed below.
Executive share options – LTIP Part AExecutive share option awards may vest based solely on the Company’s eps growth (adjusted to exclude items which do not reflect the Company’s underlying financial performance) relative to UK inflation (RPI) over three years, based on the following sliding scale:
Face value of annual executive share options granted as a proportion of salary Total margin over UK inflation (RPI) after three years
First 150% of salary 9.3%Next 75% of salary 12.5%Next 75% of salary 19.1%
Performance share awards – LTIP Part BThe extent to which half of the awards may vest is subject to a performance condition based on the Company’s eps growth (adjusted to exclude items which do not reflect the Company’s underlying financial performance) relative to UK inflation (RPI) over three years, based on the following sliding scale:
Total margin over UK inflation (RPI) after three years Proportion of performance share awards exercisable
Below 12.5% Nil12.5% 25%Between 12.5% and 33.1% Pro rata between 25%–100%33.1% or above 100%
The extent to which the other half of the performance share awards may vest is subject to the Company’s TSR performance, a combination of both the Company’s share price and dividend performance during the three year performance period, relative to the TSR performance of a specified group of companies of similarly sized companies with large international presence. The comparator group consists of at least 40 UK based companies (excluding companies in the financial services, oil & gas and natural resources sectors) that have substantial operations overseas and have at 30 September prior to the grant of the awards similar levels of revenue, profit and market capitalisation as Bunzl. The applicable comparator group for the 2004 LTIP Part B awards in April 2014 are shown below.
Aggreko Hays Reckitt Benckiser GroupAshstead Group IMI RexamArm Holdings Inchcape SABMillerBurberry Group Informa SIGCarnival Corporation Inmarsat Smith & NephewCobham Intercontinental Hotels Group Smiths GroupComputacenter International Consolidated Airlines Group SpectrisCroda International Intertek Group Tate & LyleDiageo Johnson Matthey Thomas Cook GroupDixons Retail Meggitt VesuviusEasyjet Melrose Weir GroupExperian Millennium & Copthorne Hotels WolseleyG4S Mondi WPPGKN Pearson
These performance share awards vest in line with the following vesting schedule:
TSR Proportion of performance share awards exercisable
Below median NilMedian 25%Between median and upper quartile Pro rata between 25%–100%Upper quartile or above 100%
Awards granted in 2012 and 2013 were subject to the same performance conditions as described above.

BUNZL PLC ANNUAL REPORT 2014 67
The performance conditions for the executive share options and performance shares awarded under the 2014 LTIP to the Company’s executive directors, Executive Committee members and selected key employees in August and October 2014 were as detailed below.
Executive options – LTIP Part AExecutive share options may vest based solely on the Company’s eps growth (adjusted to exclude items which do not reflect the Company’s underlying financial performance) over three years, based on the following sliding scale:
Absolute annual growth in the Company’s eps over a three year period Proportion of share option awards exercisable
Below 5% Nil5% 25%Between 5% and 8% Pro rata between 25%–100%8% or above 100%
Performance share awards – LTIP Part BThe extent to which half of the awards may vest is subject to a performance condition based on the Company’s eps growth (adjusted to exclude items which do not reflect the Company’s underlying financial performance) over three years, based on the following sliding scale:
Absolute annual growth in the Company’s eps over a three year period Proportion of performance share awards exercisable
Below 6% Nil6% 25%Between 6% and 12% Pro rata between 25%–100%12% or above 100%
The extent to which the other half of the performance share awards may vest is subject to the Company’s TSR performance, a combination of both the Company’s share price and dividend performance during the three year performance period, relative to the TSR performance of a specified comparator group of similarly sized companies with large international presence. These performance share awards may vest based on the following sliding scale:
TSR Proportion of performance share awards exercisable
Below median NilMedian 25%Between median and upper quartile Pro rata between 25%–100%Upper quartile or above 100%
The applicable comparator group for the October 2014 awards were those companies in the FTSE 50 – 150 with significant international operations, excluding companies in the financial services, oil & gas and natural resources sectors.
Shareholder dilutionIn accordance with The Investment Association Principles of Remuneration, the Company can satisfy awards to employees under all its share plans with new issue shares or shares issued from treasury up to a maximum of 10% of its issued share capital (adjusted for share issuance and cancellation) in a rolling 10 year period. Within this 10% limit, the Company can only issue (as newly issued shares or from treasury), 5% of its issued share capital (adjusted for share issuance and cancellation) to satisfy awards under executive (discretionary) plans.
As well as the LTIP, the Company operates various all employee share schemes as described on page 56. Newly issued shares are currently used to satisfy the exercise of options under the Sharesave Scheme and International Sharesave Scheme. Awards under the LTIP of executive options and performance shares are principally satisfied by shares delivered from the Employee Benefit Trust which buys shares on the market, unless security laws in relevant jurisdictions prevent this.
Limit on awards
Cumulative options and performance shares granted as a percentage of issued share capital
as at 31 December 2014(including those held in treasury)
10% in any rolling 10 year period 2.0%5% in any rolling 10 year period (executive (discretionary) plans) 1.2%

68 BUNZL PLC ANNUAL REPORT 2014
DIRECTORS’ REMUNERATION REPORT CONTINUED
Statement of directors’ shareholding and share interests (audited information)As at 31 December 2014, all executive directors and their connected persons owned shares outright at a level exceeding their required shareholding of 200% of their annual salary.
Actual share ownership as a percentageof salary at 31 December 2014
at the closing mid-market price(1,764p)
Michael Roney 615%Brian May 371%Patrick Larmon 348%
Interests in shares and share optionsThe interests of the directors, and their connected persons, in the Company’s ordinary shares and share options at 31 December 2014 were:
Shares Options (LTIP Part A and Sharesave)Total
interests held
Ownedoutright
Unvestedand subject
to holdingperiod
(DASBS)
Unvestedand subject to performance
conditions(LTIP Part B)
Unvestedand subject toperformance
conditions
Unvestedsubject tocontinued
employment
Vestedbut not
exercised
Michael Roney 312,263 103,272 228,600 321,100 1,948 162,000 1,129,183Brian May 105,240 57,081 119,500 167,500 1,197 – 450,518Patrick Larmon 121,216 70,397 135,900 191,000 – 132,000 650,513Philip Rogerson 10,000 – – – – – 10,000Peter Johnson 6,630 – – – – – 6,630David Sleath 4,000 – – – – – 4,000Eugenia Ulasewicz 4,000 – – – – – 4,000Jean-Charles Pauze 2,500 – – – – – 2,500Meinie Oldersma 2,500 – – – – – 2,500
Performance graph and tableSchedule 8 to the Large and Medium-sized Companies and Groups (Accounts and Reports) Regulations 2008 requires that the Company must provide a graph comparing the TSR performance of a hypothetical holding of shares in the Company with a broad equity market index over a six year period. The Company’s TSR performance against the FTSE 350 Support Services Sector over a six year period commencing on 1 January 2009 is shown to the right.
Chief Executive’s pay in last six years (audited information)The table below summarises the Chief Executive’s single total figure of remuneration, as shown on page 63, annual bonus and long term incentive payout as a percentage of maximum opportunity for 2014 and the previous five years.
Year 2009 2010 2011 2012 2013 2014
Single total figure of remuneration £000 1,943.2 2,314.2 3,394.1 3,502.9 4,387.6 4,617.8
Annual variable element award rates against maximum opportunity 45% 71% 99% 67% 91% 85%
Long term incentive vesting rates against maximum opportunity
LTIP Part A (options) 100% 100% 100% 100% 100% 100%LTIP Part B (performance shares) 84% 65% 29% 45% 62% 89%
NoteThe single total figure of remuneration in relation to 2013 has been restated from the figure shown in the 2013 Annual Report to reflect the difference between the grant price and the value of the relevant LTIP awards on the actual date of vesting as detailed in Note d) to the table of the single total figure of remuneration 2014 on page 63.
100
150
200
250
300
350
400
Source: Thomson Reuters datastream
2009 2010 2011 2012 2013 2014
BunzlFTSE 350 support services

BUNZL PLC ANNUAL REPORT 2014 69
Percentage change in Chief Executive’s remunerationThe table below sets out the increase in the salary, benefits and bonus of the Chief Executive and that of a Bunzl UK and US management population. This population has been selected for this comparison because it is considered to be the most relevant as these countries have the Group’s largest concentration of employees with a similarly structured remuneration package. Employees from businesses acquired by Bunzl in 2014 and leavers and joiners in either year have been removed from the data to prevent distortion.
Chief ExecutiveUK and US
management populationPercentage change
(2014 vs 2013)Percentage change
(2014 vs 2013)
Salary 3% 4%Benefits 1% 6%Bonus (3)% (3)%
Notesa) US and UK management population includes any promotional increases that occurred during either year.b) Bonus relates to the performance targets of the companies for which the relevant individuals work.
Relative importance of spend on payThe table below shows a comparison between the overall expenditure on pay and dividends paid to shareholders for 2014 and 2013 (as stated in Note 21 and Note 17 to the financial statements on pages 107 and 102 respectively).
£ million unless otherwise stated 2014 2013 Percentage change
Overall expenditure on pay 534.0 509.4 5%Dividend paid in the year 105.6 91.8 15%
Notesa) Overall expenditure on pay excludes employer’s social security costs.b) Dividends paid in the year relate to the previous financial year’s interim and final dividends.
2015 REMUNERATION (AUDITED INFORMATION)The remuneration policy was implemented with effect from the 2014 AGM and continues to apply in 2015 as follows:
SalaryThe salary increases for the executive directors for 2015, which are in line with increases that have been implemented for other employees in the Group as discussed on page 58, are as follows:
Salary from1 January 2015
Salary from1 January 2014
Increase in salary2014 to 2015
%
Michael Roney £922,000 £895,000 3.0Brian May £515,000 £500,000 3.0Patrick Larmon US$1,036,000 US$1,014,000 2.2
2015 bonus targetsThe structure for Michael Roney’s, Brian May’s and 25% of Patrick Larmon’s annual bonus for 2015 is described on page 54. The threshold for bonus payments on growth in constant exchange rate eps has been set above the actual result achieved in 2014 on a constant exchange rate basis. For Patrick Larmon the other 75% of his bonus will relate to the attainment of pbit performance of North America relative to budget which will be modified, positively or negatively, by the achievement of North America’s return on average operating capital relative to the target set. The relevant performance points are: threshold (which must be exceeded to attract any payment of bonus); target; and maximum amount (the level at which the bonus for that measure is capped). These performance points are determined at the start of the year by reference to the Group’s annual budget. No elements of the bonus are guaranteed. As in previous years, the specific performance points will not be disclosed while still commercially sensitive.
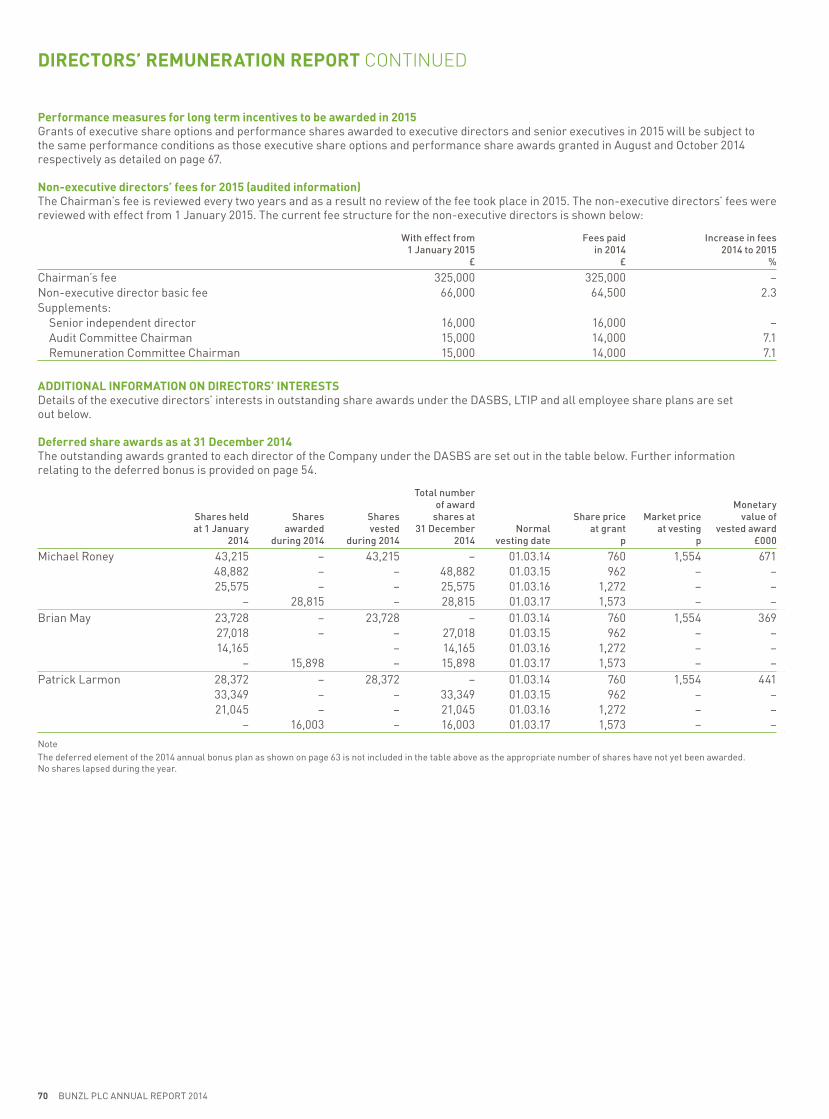
70 BUNZL PLC ANNUAL REPORT 2014
DIRECTORS’ REMUNERATION REPORT CONTINUED
Performance measures for long term incentives to be awarded in 2015Grants of executive share options and performance shares awarded to executive directors and senior executives in 2015 will be subject to the same performance conditions as those executive share options and performance share awards granted in August and October 2014 respectively as detailed on page 67.
Non-executive directors’ fees for 2015 (audited information)The Chairman’s fee is reviewed every two years and as a result no review of the fee took place in 2015. The non-executive directors’ fees were reviewed with effect from 1 January 2015. The current fee structure for the non-executive directors is shown below:
With effect from1 January 2015
£
Fees paidin 2014
£
Increase in fees2014 to 2015
%
Chairman’s fee 325,000 325,000 –Non-executive director basic fee 66,000 64,500 2.3Supplements:
Senior independent director 16,000 16,000 –Audit Committee Chairman 15,000 14,000 7.1Remuneration Committee Chairman 15,000 14,000 7.1
ADDITIONAL INFORMATION ON DIRECTORS’ INTERESTS Details of the executive directors’ interests in outstanding share awards under the DASBS, LTIP and all employee share plans are set out below.
Deferred share awards as at 31 December 2014The outstanding awards granted to each director of the Company under the DASBS are set out in the table below. Further information relating to the deferred bonus is provided on page 54.
Shares heldat 1 January
2014
Sharesawarded
during 2014
Sharesvested
during 2014
Total numberof award
shares at31 December
2014Normal
vesting date
Share priceat grant
p
Market priceat vesting
p
Monetaryvalue of
vested award£000
Michael Roney 43,215 – 43,215 – 01.03.14 760 1,554 67148,882 – – 48,882 01.03.15 962 – –25,575 – – 25,575 01.03.16 1,272 – –
– 28,815 – 28,815 01.03.17 1,573 – –Brian May 23,728 – 23,728 – 01.03.14 760 1,554 369
27,018 – – 27,018 01.03.15 962 – –14,165 – 14,165 01.03.16 1,272 – –
– 15,898 – 15,898 01.03.17 1,573 – –Patrick Larmon 28,372 – 28,372 – 01.03.14 760 1,554 441
33,349 – – 33,349 01.03.15 962 – –21,045 – – 21,045 01.03.16 1,272 – –
– 16,003 – 16,003 01.03.17 1,573 – –
NoteThe deferred element of the 2014 annual bonus plan as shown on page 63 is not included in the table above as the appropriate number of shares have not yet been awarded. No shares lapsed during the year.
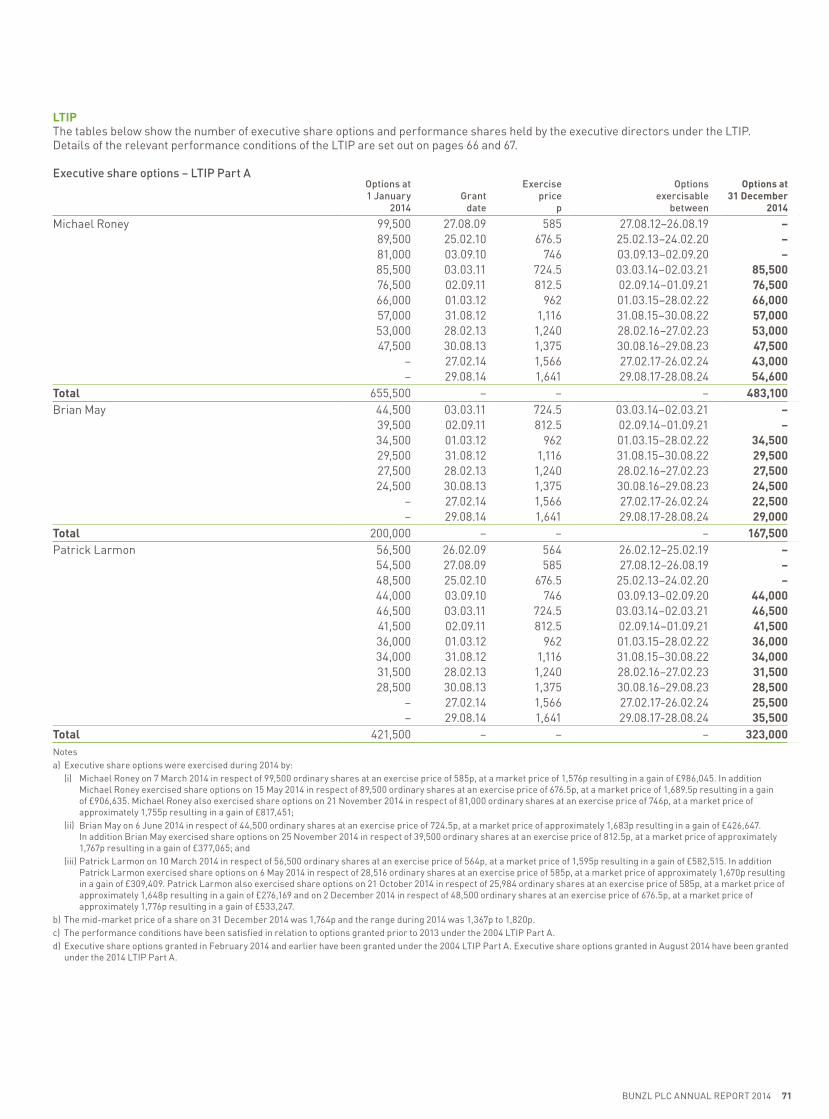
BUNZL PLC ANNUAL REPORT 2014 71
LTIPThe tables below show the number of executive share options and performance shares held by the executive directors under the LTIP. Details of the relevant performance conditions of the LTIP are set out on pages 66 and 67.
Executive share options – LTIP Part AOptions at1 January
2014Grant
date
Exerciseprice
p
Optionsexercisable
between
Options at31 December
2014
Michael Roney 99,500 27.08.09 585 27.08.12–26.08.19 –89,500 25.02.10 676.5 25.02.13–24.02.20 –81,000 03.09.10 746 03.09.13–02.09.20 –85,500 03.03.11 724.5 03.03.14–02.03.21 85,50076,500 02.09.11 812.5 02.09.14–01.09.21 76,50066,000 01.03.12 962 01.03.15–28.02.22 66,00057,000 31.08.12 1,116 31.08.15–30.08.22 57,00053,000 28.02.13 1,240 28.02.16–27.02.23 53,00047,500 30.08.13 1,375 30.08.16–29.08.23 47,500
– 27.02.14 1,566 27.02.17-26.02.24 43,000– 29.08.14 1,641 29.08.17-28.08.24 54,600
Total 655,500 – – – 483,100Brian May 44,500 03.03.11 724.5 03.03.14–02.03.21 –
39,500 02.09.11 812.5 02.09.14–01.09.21 –34,500 01.03.12 962 01.03.15–28.02.22 34,50029,500 31.08.12 1,116 31.08.15–30.08.22 29,50027,500 28.02.13 1,240 28.02.16–27.02.23 27,50024,500 30.08.13 1,375 30.08.16–29.08.23 24,500
– 27.02.14 1,566 27.02.17-26.02.24 22,500– 29.08.14 1,641 29.08.17-28.08.24 29,000
Total 200,000 – – – 167,500Patrick Larmon 56,500 26.02.09 564 26.02.12–25.02.19 –
54,500 27.08.09 585 27.08.12–26.08.19 –48,500 25.02.10 676.5 25.02.13–24.02.20 –44,000 03.09.10 746 03.09.13–02.09.20 44,00046,500 03.03.11 724.5 03.03.14–02.03.21 46,50041,500 02.09.11 812.5 02.09.14–01.09.21 41,50036,000 01.03.12 962 01.03.15–28.02.22 36,00034,000 31.08.12 1,116 31.08.15–30.08.22 34,00031,500 28.02.13 1,240 28.02.16–27.02.23 31,50028,500 30.08.13 1,375 30.08.16–29.08.23 28,500
– 27.02.14 1,566 27.02.17-26.02.24 25,500– 29.08.14 1,641 29.08.17-28.08.24 35,500
Total 421,500 – – – 323,000Notesa) Executive share options were exercised during 2014 by: (i) Michael Roney on 7 March 2014 in respect of 99,500 ordinary shares at an exercise price of 585p, at a market price of 1,576p resulting in a gain of £986,045. In addition
Michael Roney exercised share options on 15 May 2014 in respect of 89,500 ordinary shares at an exercise price of 676.5p, at a market price of 1,689.5p resulting in a gain of £906,635. Michael Roney also exercised share options on 21 November 2014 in respect of 81,000 ordinary shares at an exercise price of 746p, at a market price of approximately 1,755p resulting in a gain of £817,451;
(ii) Brian May on 6 June 2014 in respect of 44,500 ordinary shares at an exercise price of 724.5p, at a market price of approximately 1,683p resulting in a gain of £426,647. In addition Brian May exercised share options on 25 November 2014 in respect of 39,500 ordinary shares at an exercise price of 812.5p, at a market price of approximately 1,767p resulting in a gain of £377,065; and
(iii) Patrick Larmon on 10 March 2014 in respect of 56,500 ordinary shares at an exercise price of 564p, at a market price of 1,595p resulting in a gain of £582,515. In addition Patrick Larmon exercised share options on 6 May 2014 in respect of 28,516 ordinary shares at an exercise price of 585p, at a market price of approximately 1,670p resulting in a gain of £309,409. Patrick Larmon also exercised share options on 21 October 2014 in respect of 25,984 ordinary shares at an exercise price of 585p, at a market price of approximately 1,648p resulting in a gain of £276,169 and on 2 December 2014 in respect of 48,500 ordinary shares at an exercise price of 676.5p, at a market price of approximately 1,776p resulting in a gain of £533,247.
b) The mid-market price of a share on 31 December 2014 was 1,764p and the range during 2014 was 1,367p to 1,820p.c) The performance conditions have been satisfied in relation to options granted prior to 2013 under the 2004 LTIP Part A.d) Executive share options granted in February 2014 and earlier have been granted under the 2004 LTIP Part A. Executive share options granted in August 2014 have been granted
under the 2014 LTIP Part A.
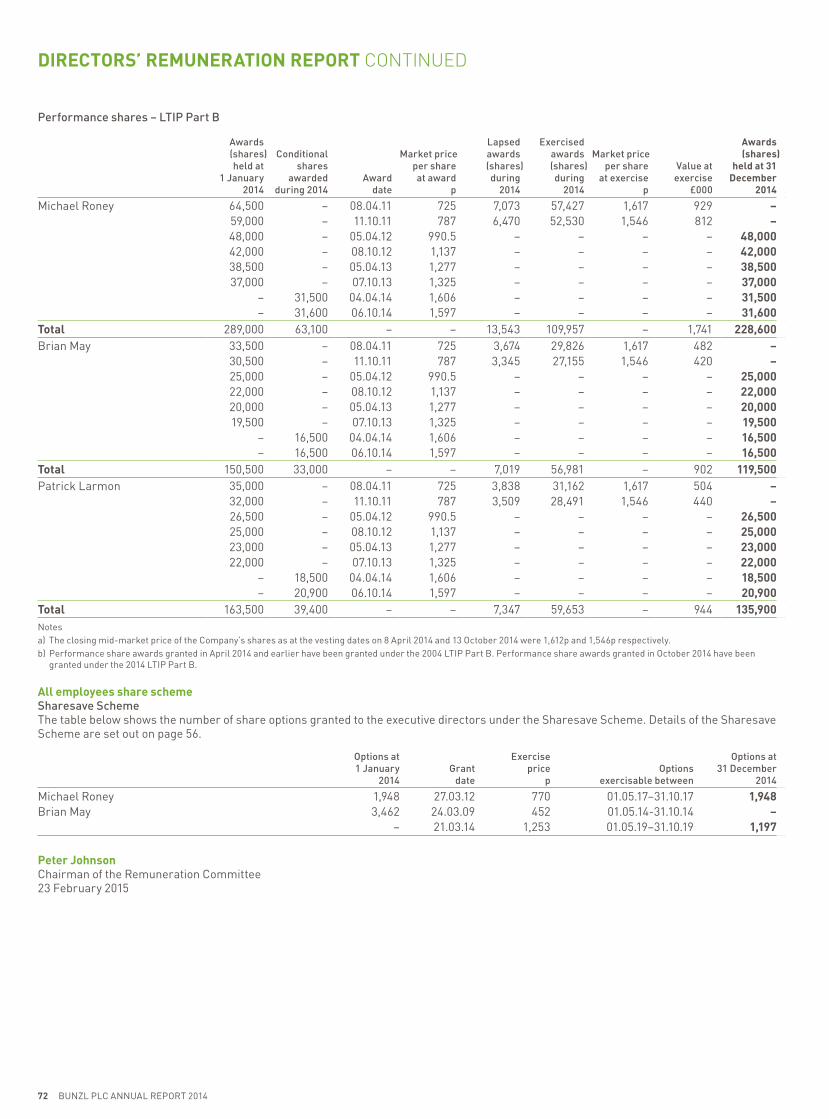
72 BUNZL PLC ANNUAL REPORT 2014
DIRECTORS’ REMUNERATION REPORT CONTINUED
Performance shares – LTIP Part B
Awards(shares)held at
1 January2014
Conditionalshares
awardedduring 2014
Awarddate
Market priceper shareat award
p
Lapsedawards(shares)during
2014
Exercisedawards(shares)during
2014
Market priceper share
at exercisep
Value atexercise
£000
Awards(shares)
held at 31December
2014
Michael Roney 64,500 – 08.04.11 725 7,073 57,427 1,617 929 –59,000 – 11.10.11 787 6,470 52,530 1,546 812 –48,000 – 05.04.12 990.5 – – – – 48,00042,000 – 08.10.12 1,137 – – – – 42,00038,500 – 05.04.13 1,277 – – – – 38,50037,000 – 07.10.13 1,325 – – – – 37,000
– 31,500 04.04.14 1,606 – – – – 31,500– 31,600 06.10.14 1,597 – – – – 31,600
Total 289,000 63,100 – – 13,543 109,957 – 1,741 228,600Brian May 33,500 – 08.04.11 725 3,674 29,826 1,617 482 –
30,500 – 11.10.11 787 3,345 27,155 1,546 420 –25,000 – 05.04.12 990.5 – – – – 25,00022,000 – 08.10.12 1,137 – – – – 22,00020,000 – 05.04.13 1,277 – – – – 20,00019,500 – 07.10.13 1,325 – – – – 19,500
– 16,500 04.04.14 1,606 – – – – 16,500– 16,500 06.10.14 1,597 – – – – 16,500
Total 150,500 33,000 – – 7,019 56,981 – 902 119,500Patrick Larmon 35,000 – 08.04.11 725 3,838 31,162 1,617 504 –
32,000 – 11.10.11 787 3,509 28,491 1,546 440 –26,500 – 05.04.12 990.5 – – – – 26,50025,000 – 08.10.12 1,137 – – – – 25,00023,000 – 05.04.13 1,277 – – – – 23,00022,000 – 07.10.13 1,325 – – – – 22,000
– 18,500 04.04.14 1,606 – – – – 18,500– 20,900 06.10.14 1,597 – – – – 20,900
Total 163,500 39,400 – – 7,347 59,653 – 944 135,900Notesa) The closing mid-market price of the Company’s shares as at the vesting dates on 8 April 2014 and 13 October 2014 were 1,612p and 1,546p respectively.b) Performance share awards granted in April 2014 and earlier have been granted under the 2004 LTIP Part B. Performance share awards granted in October 2014 have been
granted under the 2014 LTIP Part B.
All employees share schemeSharesave SchemeThe table below shows the number of share options granted to the executive directors under the Sharesave Scheme. Details of the Sharesave Scheme are set out on page 56.
Options at1 January
2014Grant
date
Exerciseprice
pOptions
exercisable between
Options at31 December
2014
Michael Roney 1,948 27.03.12 770 01.05.17–31.10.17 1,948Brian May 3,462 24.03.09 452 01.05.14-31.10.14 –
– 21.03.14 1,253 01.05.19–31.10.19 1,197
Peter JohnsonChairman of the Remuneration Committee23 February 2015
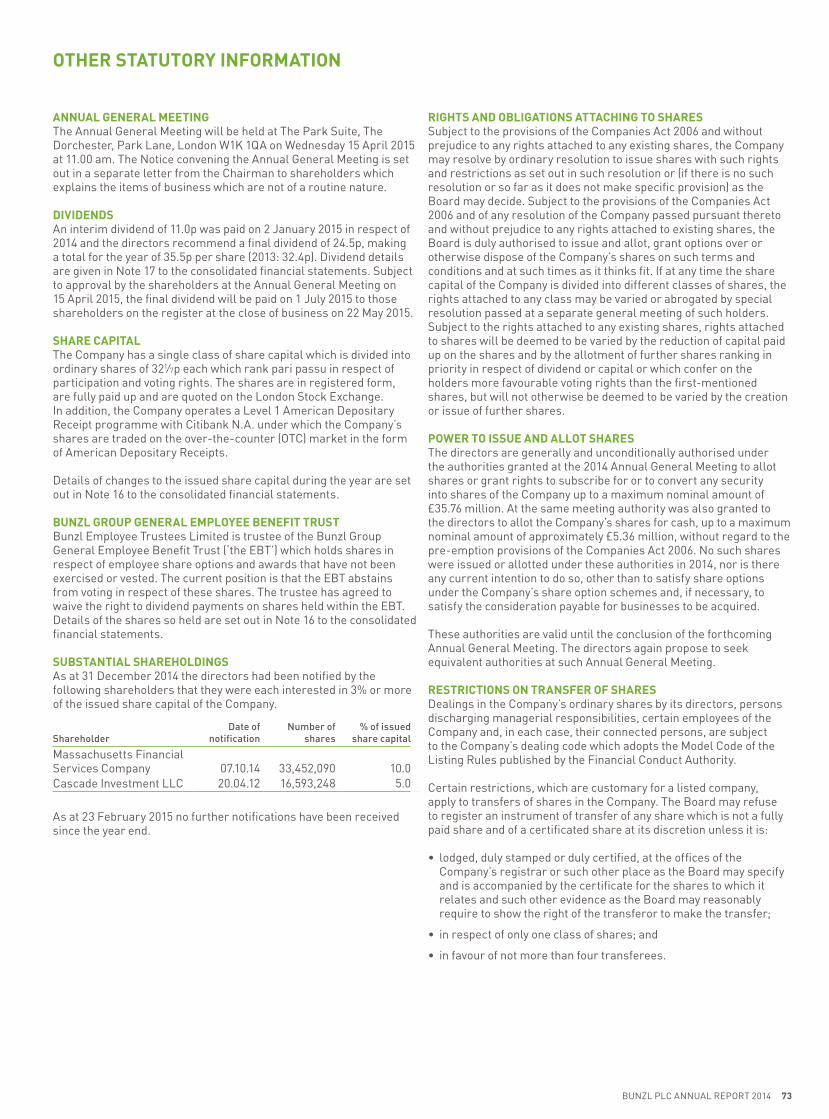
BUNZL PLC ANNUAL REPORT 2014 73
OTHER STATUTORY INFORMATION
ANNUAL GENERAL MEETINGThe Annual General Meeting will be held at The Park Suite, The Dorchester, Park Lane, London W1K 1QA on Wednesday 15 April 2015 at 11.00 am. The Notice convening the Annual General Meeting is set out in a separate letter from the Chairman to shareholders which explains the items of business which are not of a routine nature.
DIVIDENDSAn interim dividend of 11.0p was paid on 2 January 2015 in respect of 2014 and the directors recommend a final dividend of 24.5p, making a total for the year of 35.5p per share (2013: 32.4p). Dividend details are given in Note 17 to the consolidated financial statements. Subject to approval by the shareholders at the Annual General Meeting on 15 April 2015, the final dividend will be paid on 1 July 2015 to those shareholders on the register at the close of business on 22 May 2015.
SHARE CAPITALThe Company has a single class of share capital which is divided into ordinary shares of 321⁄7p each which rank pari passu in respect of participation and voting rights. The shares are in registered form, are fully paid up and are quoted on the London Stock Exchange. In addition, the Company operates a Level 1 American Depositary Receipt programme with Citibank N.A. under which the Company’s shares are traded on the over-the-counter (OTC) market in the form of American Depositary Receipts.
Details of changes to the issued share capital during the year are set out in Note 16 to the consolidated financial statements.
BUNZL GROUP GENERAL EMPLOYEE BENEFIT TRUSTBunzl Employee Trustees Limited is trustee of the Bunzl Group General Employee Benefit Trust (‘the EBT’) which holds shares in respect of employee share options and awards that have not been exercised or vested. The current position is that the EBT abstains from voting in respect of these shares. The trustee has agreed to waive the right to dividend payments on shares held within the EBT. Details of the shares so held are set out in Note 16 to the consolidated financial statements.
SUBSTANTIAL SHAREHOLDINGSAs at 31 December 2014 the directors had been notified by the following shareholders that they were each interested in 3% or more of the issued share capital of the Company.
ShareholderDate of
notificationNumber of
shares% of issued
share capital
Massachusetts Financial Services Company 07.10.14 33,452,090 10.0Cascade Investment LLC 20.04.12 16,593,248 5.0
As at 23 February 2015 no further notifications have been received since the year end.
RIGHTS AND OBLIGATIONS ATTACHING TO SHARESSubject to the provisions of the Companies Act 2006 and without prejudice to any rights attached to any existing shares, the Company may resolve by ordinary resolution to issue shares with such rights and restrictions as set out in such resolution or (if there is no such resolution or so far as it does not make specific provision) as the Board may decide. Subject to the provisions of the Companies Act 2006 and of any resolution of the Company passed pursuant thereto and without prejudice to any rights attached to existing shares, the Board is duly authorised to issue and allot, grant options over or otherwise dispose of the Company’s shares on such terms and conditions and at such times as it thinks fit. If at any time the share capital of the Company is divided into different classes of shares, the rights attached to any class may be varied or abrogated by special resolution passed at a separate general meeting of such holders. Subject to the rights attached to any existing shares, rights attached to shares will be deemed to be varied by the reduction of capital paid up on the shares and by the allotment of further shares ranking in priority in respect of dividend or capital or which confer on the holders more favourable voting rights than the first-mentioned shares, but will not otherwise be deemed to be varied by the creation or issue of further shares.
POWER TO ISSUE AND ALLOT SHARESThe directors are generally and unconditionally authorised under the authorities granted at the 2014 Annual General Meeting to allot shares or grant rights to subscribe for or to convert any security into shares of the Company up to a maximum nominal amount of £35.76 million. At the same meeting authority was also granted to the directors to allot the Company’s shares for cash, up to a maximum nominal amount of approximately £5.36 million, without regard to the pre-emption provisions of the Companies Act 2006. No such shares were issued or allotted under these authorities in 2014, nor is there any current intention to do so, other than to satisfy share options under the Company’s share option schemes and, if necessary, to satisfy the consideration payable for businesses to be acquired.
These authorities are valid until the conclusion of the forthcoming Annual General Meeting. The directors again propose to seek equivalent authorities at such Annual General Meeting.
RESTRICTIONS ON TRANSFER OF SHARESDealings in the Company’s ordinary shares by its directors, persons discharging managerial responsibilities, certain employees of the Company and, in each case, their connected persons, are subject to the Company’s dealing code which adopts the Model Code of the Listing Rules published by the Financial Conduct Authority.
Certain restrictions, which are customary for a listed company, apply to transfers of shares in the Company. The Board may refuse to register an instrument of transfer of any share which is not a fully paid share and of a certificated share at its discretion unless it is:
• lodged, duly stamped or duly certified, at the offices of the Company’s registrar or such other place as the Board may specify and is accompanied by the certificate for the shares to which it relates and such other evidence as the Board may reasonably require to show the right of the transferor to make the transfer;
• in respect of only one class of shares; and
• in favour of not more than four transferees.

74 BUNZL PLC ANNUAL REPORT 2014
OTHER STATUTORY INFORMATION CONTINUED
Registration of a transfer of an uncertificated share may be refused in the circumstances set out in the uncertificated securities rules, and where, in the case of a transfer to joint holders, the number of joint holders to whom the uncertificated share is to be transferred exceeds four.
In addition, no instrument of transfer for certificated shares shall be registered if the transferor has been served with a restriction notice (as defined in the Company’s Articles of Association (the ‘Articles’)) after failure to provide the Company with information concerning certain interests in the Company’s shares required to be provided under the Companies Act 2006, unless the transfer is shown to the Board to be pursuant to an arm’s length sale. The Board has the power to procure that uncertificated shares are converted into certificated shares and kept in certificated form for as long as the Board requires.
The Company is not aware of any agreements between shareholders that may result in any restriction of the transfer of shares or voting rights.
RESTRICTIONS ON VOTING RIGHTSA member shall not be entitled to vote, unless the Board otherwise decides, at any general meeting or class meeting in respect of any shares held by them if any call or other sums payable remain unpaid. Currently, all issued shares are fully paid. In addition, no member shall be entitled to vote if he has been served with a restriction notice after failure to provide the Company with information concerning certain interests in the Company’s shares required to be provided under the Companies Act 2006. Votes may be exercised in person or by proxy. The Articles currently provide a deadline for submission of proxy forms of 48 hours before the relevant meeting, 24 hours before a poll is taken if such poll is taken more than 48 hours after it was demanded or during the meeting at which the poll was demanded if the poll is not taken straight away but is taken not more than 48 hours after it was demanded.
PURCHASE OF OWN SHARESAt the 2014 Annual General Meeting, shareholders gave the Company authority to purchase a maximum of 33,375,000 ordinary shares. During the year ended 31 December 2014 the Company did not purchase any of its own shares pursuant to this authority or the authority granted at the 2013 Annual General Meeting and no shares have been purchased between 31 December 2014 and 23 February 2015. The Company is therefore currently authorised to buy back 33,375,000 of its own shares pursuant to the existing shareholders’ authority which is due to expire at the conclusion of the forthcoming Annual General Meeting. The directors again propose to seek the equivalent authority at such Annual General Meeting.
DIRECTORSDirectors may be elected by ordinary resolution at a duly convened general meeting or appointed by the Board. Under the Articles, the minimum number of directors shall be two and the maximum shall be 15. In accordance with the Articles, each director is required to retire at the Annual General Meeting held in the third calendar year after which he or she was appointed or last appointed and any director who has held office with the Company, other than employment or executive office, for a continuous period of nine years or more at the date of the Annual General Meeting is subject to annual re-appointment. The Board may also appoint a person willing to act as a director during the year either to fill a vacancy or as an additional director but so that the total number of directors shall not at any time exceed 15. However such appointee shall only hold office until the next Annual General Meeting of the Company.
In addition to any power to remove a director from office conferred by company law, the Company may also by special resolution remove a director from office before the expiration of his or her period of office under the Articles.
The office of a director shall also be vacated pursuant to the Articles if the director:
• resigns by giving notice to the Company or is asked to resign by all of the other directors who are not less than three in number; or
• is or has been suffering from mental or physical ill health and the Board resolves that his or her office be vacated; or
• is absent without permission from Board meetings for six consecutive months and the Board resolves that his or her office be vacated; or
• becomes bankrupt or compounds with his or her creditors generally; or
• is prohibited by law from being a director; or
• ceases to be a director by virtue of any provisions of company law or is removed from office pursuant to the Articles.
Biographical details of the directors are set out on page 42. Vanda Murray was appointed to the Board with effect from 1 February 2015 but all of the other directors served throughout the year. Notwithstanding the retirement by rotation provisions in the Articles, each of the directors will retire and offer themselves for re-election at the forthcoming Annual General Meeting in accordance with the UK Corporate Governance Code apart from Peter Johnson who retires at the conclusion of the Annual General Meeting.
Directors’ interests in ordinary shares are shown in Note 19 to the consolidated financial statements. None of the directors was materially interested in any contract of significance with the Company or any of its subsidiary undertakings during or at the end of 2014. Information relating to the directors’ service agreements and their remuneration for the year and details of the directors’ share options under the Company’s share option schemes and awards under the Long Term Incentive Plan and Deferred Annual Share Bonus Scheme are set out in the Directors’ remuneration report on pages 52 to 72.
POWERS OF THE DIRECTORSSubject to the Articles, the Companies Act 2006 and any directions given by the Company by special resolution, the business of the Company is managed by the Board who may exercise all powers of the Company. The Board may, by power of attorney or otherwise, appoint any person or persons to be the agent or agents of the Company for such purposes and on such conditions as the Board determines.
DIRECTORS’ INDEMNITIESIndemnities were in force throughout 2014 and remain in force as at the date of this report under which the Company has agreed to indemnify the directors and the Company Secretary, in addition to other senior executives who are directors of subsidiaries of the Company, to the extent permitted by law and the Articles in respect of all losses arising out of, or in connection with, the execution of their powers, duties and responsibilities as a director or officer of the Company or any of its subsidiaries.
AMENDMENT OF ARTICLESAny amendments to the Articles may be made in accordance with the provisions of the Companies Act 2006 by way of special resolution of the Company’s shareholders.

BUNZL PLC ANNUAL REPORT 2014 75
ENVIRONMENTAL AND SOCIAL RESPONSIBILITYThe directors recognise that the Company is part of a wider community and that it has a responsibility to act in a way that respects the environment and social and community issues. Further information relating to the Company’s approach to these matters is set out in the Corporate responsibility report on pages 37 to 41.
EMPLOYMENT POLICIESThe employment policies of the Group have been developed to meet the needs of its different business areas and the locations in which they operate worldwide, embodying the principles of equal opportunity. The Group has standards of business conduct with which it expects all its employees to comply. Bunzl encourages involvement of its employees in the performance of the business in which they are employed and aims to achieve a sense of shared commitment. In addition to a regular magazine and the Company’s intranet, which provide a variety of information on activities and developments within the Group and incorporate half year and annual financial reports, announcements are periodically circulated to give details of corporate and staff matters together with a number of subsidiary or business area publications dealing with activities in specific parts of the Group.
It is the Group’s policy that disabled applicants should be considered for employment and career development on the basis of their aptitudes and abilities. Employees who become disabled during their working life will be retained in employment wherever possible and given help with rehabilitation and training.
SIGNIFICANT AGREEMENTSThe Company’s wholly owned subsidiary, Bunzl Finance plc, has a number of bilateral loan facilities with a range of different counterparties, all of which are guaranteed by the Company, are in substantially the same form and are prepayable at the option of the lender in the event of a change of control of the Company. Similar change of control provisions in relation to the Company are included in the US dollar, sterling and euro US private placement notes which have been entered into by Bunzl Finance plc and the Company and are also guaranteed by the Company.
POLITICAL DONATIONSDuring 2014 no contributions were made for political purposes.
DISCLOSURES REQUIRED UNDER UK LISTING RULE 9.8.4Apart from the dividend waiver which has been issued in respect of shares held by the Bunzl Group General Employee Benefit Trust referred to in Note 16 on page 101, there are no disclosures required to be made under UK Listing Rule 9.8.4.
EXTERNAL AUDITORSEach of the directors at the date of approval of this report confirms that:
• so far as the director is aware, there is no relevant audit information of which the Company’s auditors are unaware; and
• the director has taken all steps that he or she ought to have taken as a director in order to make the director aware of any relevant audit information and to establish that the Company’s auditors are aware of that information.
This confirmation is given and should be interpreted in accordance with the provisions of section 418 of the Companies Act 2006.
Resolutions are to be proposed at the forthcoming Annual General Meeting for the re-appointment of PricewaterhouseCoopers LLP as auditors of the Company at a rate of remuneration to be determined by the directors.
STRATEGIC REPORT AND DIRECTORS’ REPORTPages 1 to 41 inclusive consist of the strategic report and pages 42 to 75 inclusive consist of the directors’ report. These reports have been drawn up and presented in accordance with, and in reliance upon, applicable English company law and any liability of the directors in connection with these reports shall be subject to the limitations and restrictions provided by such law.
Under the Companies Act 2006, a safe harbour limits the liability of directors in respect of statements in and omissions from the strategic report and the directors’ report. Under English law, the directors would be liable to the Company, but not to any third party, if the strategic report or the directors’ report contain errors as a result of recklessness or knowing misstatement or dishonest concealment of a material fact, but would not otherwise be liable.
The strategic report and the directors’ report were approved by the Board on 23 February 2015.
On behalf of the Board
Paul HusseySecretary23 February 2015

76 BUNZL PLC ANNUAL REPORT 2014
CONSOLIDATED INCOME STATEMENTFOR THE YEAR ENDED 31 DECEMBER 2014
Notes2014
£m2013
£m
Revenue 3 6,156.5 6,097.7Operating profit 3 341.8 332.1Finance income 5 4.0 2.6Finance cost 5 (46.0) (44.8)Profit before income tax 299.8 289.9Income tax 6 (89.1) (83.1)Profit for the year attributable to the Company’s equity holders 210.7 206.8
Earnings per share attributable to the Company’s equity holdersBasic 7 64.5p 63.5pDiluted 7 63.7p 62.7p
Non-GAAP measures*Operating profit 3 341.8 332.1Adjusted for:Intangible amortisation 3 61.9 58.3Acquisition related costs 3 26.1 24.0Adjusted operating profit 429.8 414.4Finance income 5 4.0 2.6Finance cost 5 (46.0) (44.8)Adjusted profit before income tax 387.8 372.2Tax on adjusted profit 6 (106.2) (103.8)Adjusted profit for the year 281.6 268.4
Adjusted earnings per share 7 86.2p 82.4p
* See Note 2w on page 85 for further details of the non-GAAP measures.
The Accounting policies and Notes on pages 81 to 112 form part of these consolidated financial statements.
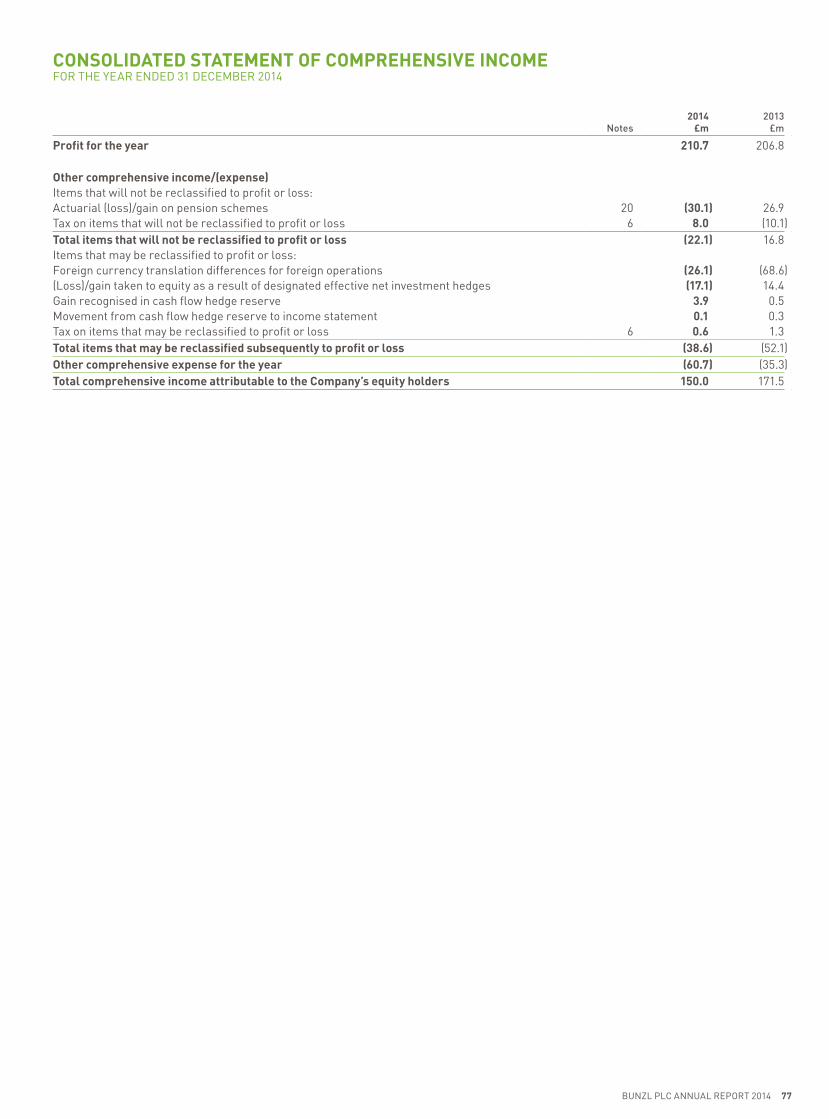
BUNZL PLC ANNUAL REPORT 2014 77
CONSOLIDATED STATEMENT OF COMPREHENSIVE INCOMEFOR THE YEAR ENDED 31 DECEMBER 2014
Notes2014
£m2013
£m
Profit for the year 210.7 206.8
Other comprehensive income/(expense)Items that will not be reclassified to profit or loss:Actuarial (loss)/gain on pension schemes 20 (30.1) 26.9Tax on items that will not be reclassified to profit or loss 6 8.0 (10.1)Total items that will not be reclassified to profit or loss (22.1) 16.8Items that may be reclassified to profit or loss:Foreign currency translation differences for foreign operations (26.1) (68.6)(Loss)/gain taken to equity as a result of designated effective net investment hedges (17.1) 14.4Gain recognised in cash flow hedge reserve 3.9 0.5Movement from cash flow hedge reserve to income statement 0.1 0.3Tax on items that may be reclassified to profit or loss 6 0.6 1.3Total items that may be reclassified subsequently to profit or loss (38.6) (52.1)Other comprehensive expense for the year (60.7) (35.3)Total comprehensive income attributable to the Company’s equity holders 150.0 171.5

78 BUNZL PLC ANNUAL REPORT 2014
CONSOLIDATED BALANCE SHEETAT 31 DECEMBER 2014
Notes2014
£m2013
£m
AssetsProperty, plant and equipment 8 119.2 118.8Intangible assets 9 1,478.8 1,456.9Derivative financial assets 16.3 6.2Deferred tax assets 15 3.9 7.5Total non-current assets 1,618.2 1,589.4
Inventories 10 705.3 645.1Income tax receivable 0.7 0.7Trade and other receivables 11 869.8 863.0Derivative financial assets 12.6 4.4Cash and deposits 23 82.4 73.1Total current assets 1,670.8 1,586.3Total assets 3,289.0 3,175.7
EquityShare capital 16 107.6 107.2Share premium 160.3 153.0Translation reserve (87.2) (45.4)Other reserves 21.0 17.8Retained earnings 782.2 707.3Total equity attributable to the Company’s equity holders 983.9 939.9
LiabilitiesInterest bearing loans and borrowings 23 913.3 851.8Retirement benefit obligations 20 70.3 45.0Other payables 18.5 24.8Derivative financial liabilities – 4.5Provisions 14 20.9 23.8Deferred tax liabilities 15 116.0 129.5Total non-current liabilities 1,139.0 1,079.4
Bank overdrafts 23 28.1 26.3Interest bearing loans and borrowings 23 35.8 42.0Income tax payable 64.6 62.2Trade and other payables 12 1,018.4 1,004.4Derivative financial liabilities 8.5 9.5Provisions 14 10.7 12.0Total current liabilities 1,166.1 1,156.4Total liabilities 2,305.1 2,235.8Total equity and liabilities 3,289.0 3,175.7
Approved by the Board of Directors of Bunzl plc (Company registration number 358948) on 23 February 2015 and signed on its behalf by Michael Roney, Chief Executive and Brian May, Finance Director.
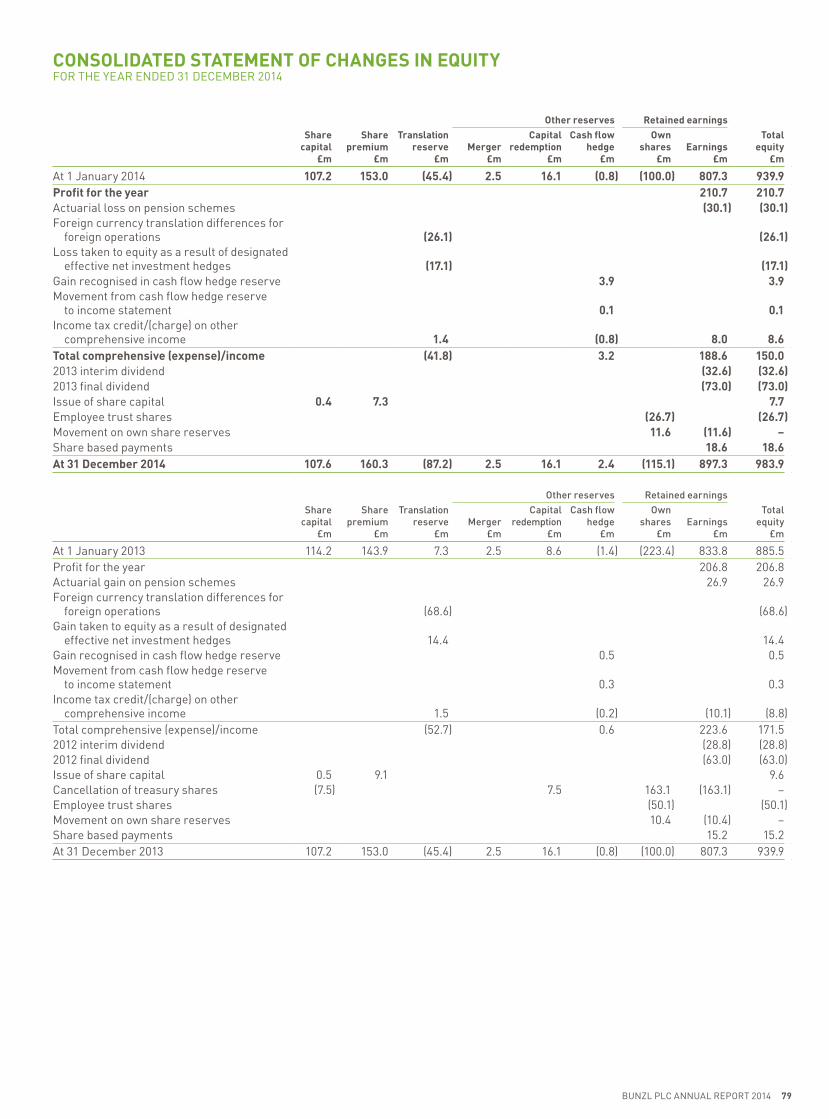
BUNZL PLC ANNUAL REPORT 2014 79
CONSOLIDATED STATEMENT OF CHANGES IN EQUITYFOR THE YEAR ENDED 31 DECEMBER 2014
Other reserves Retained earningsShare
capital £m
Share premium
£m
Translation reserve
£mMerger
£m
Capital redemption
£m
Cash flow hedge
£m
Own shares
£mEarnings
£m
Total equity
£m
At 1 January 2014 107.2 153.0 (45.4) 2.5 16.1 (0.8) (100.0) 807.3 939.9Profit for the year 210.7 210.7Actuarial loss on pension schemes (30.1) (30.1)Foreign currency translation differences for
foreign operations (26.1) (26.1)Loss taken to equity as a result of designated
effective net investment hedges (17.1) (17.1)Gain recognised in cash flow hedge reserve 3.9 3.9Movement from cash flow hedge reserve
to income statement 0.1 0.1Income tax credit/(charge) on other
comprehensive income 1.4 (0.8) 8.0 8.6Total comprehensive (expense)/income (41.8) 3.2 188.6 150.02013 interim dividend (32.6) (32.6)2013 final dividend (73.0) (73.0)Issue of share capital 0.4 7.3 7.7Employee trust shares (26.7) (26.7)Movement on own share reserves 11.6 (11.6) –Share based payments 18.6 18.6At 31 December 2014 107.6 160.3 (87.2) 2.5 16.1 2.4 (115.1) 897.3 983.9
Other reserves Retained earningsShare
capital £m
Share premium
£m
Translation reserve
£mMerger
£m
Capital redemption
£m
Cash flow hedge
£m
Own shares
£mEarnings
£m
Total equity
£m
At 1 January 2013 114.2 143.9 7.3 2.5 8.6 (1.4) (223.4) 833.8 885.5 Profit for the year 206.8 206.8Actuarial gain on pension schemes 26.9 26.9Foreign currency translation differences for
foreign operations (68.6) (68.6)Gain taken to equity as a result of designated
effective net investment hedges 14.4 14.4Gain recognised in cash flow hedge reserve 0.5 0.5Movement from cash flow hedge reserve
to income statement 0.3 0.3Income tax credit/(charge) on other
comprehensive income 1.5 (0.2) (10.1) (8.8)Total comprehensive (expense)/income (52.7) 0.6 223.6 171.52012 interim dividend (28.8) (28.8)2012 final dividend (63.0) (63.0)Issue of share capital 0.5 9.1 9.6Cancellation of treasury shares (7.5) 7.5 163.1 (163.1) –Employee trust shares (50.1) (50.1)Movement on own share reserves 10.4 (10.4) –Share based payments 15.2 15.2 At 31 December 2013 107.2 153.0 (45.4) 2.5 16.1 (0.8) (100.0) 807.3 939.9

80 BUNZL PLC ANNUAL REPORT 2014
CONSOLIDATED CASH FLOW STATEMENTFOR THE YEAR ENDED 31 DECEMBER 2014
Notes2014
£m2013
£m
Cash flow from operating activitiesProfit before income tax 299.8 289.9Adjustments: depreciation 24.4 25.9 intangible amortisation 61.9 58.3 acquisition related costs 26.1 24.0 share based payments 7.9 6.2 finance income (4.0) (2.6) finance cost 46.0 44.8 provisions (5.0) (7.8) retirement benefit obligations (8.0) (7.3) other (1.9) (1.8)Working capital movement (15.6) 16.8Cash generated from operations before acquisition related costs 431.6 446.4Cash outflow from acquisition related costs 24 (14.0) (26.1)Income tax paid (89.8) (80.3)Cash inflow from operating activities 327.8 340.0
Cash flow from investing activitiesInterest received 2.3 1.5Purchase of property, plant and equipment (25.1) (26.5)Sale of property, plant and equipment 1.2 1.2Purchase of businesses 24 (154.1) (253.8)Cash outflow from investing activities (175.7) (277.6)
Cash flow from financing activitiesInterest paid (43.7) (40.5)Dividends paid (105.6) (91.8)Increase in borrowings 181.0 361.4Repayment of borrowings (170.3) (245.1)Realised gains/(losses) on foreign exchange contracts 17.4 (9.7)Proceeds from issue of ordinary shares to settle share options 7.7 9.6Proceeds from exercise of market purchase share options 18.5 12.0Purchase of employee trust shares (48.0) (64.9)Cash outflow from financing activities (143.0) (69.0)
Increase/(decrease) in cash and cash equivalents 9.1 (6.6)
Cash and cash equivalents at start of year 46.8 55.8Increase/(decrease) in cash and cash equivalents 9.1 (6.6)Exchange loss on cash and cash equivalents (1.6) (2.4)Cash and cash equivalents at end of year 23 54.3 46.8

BUNZL PLC ANNUAL REPORT 2014 81
NOTES
1 BASIS OF PREPARATIONThe consolidated financial statements for the year ended 31 December 2014 have been approved by the directors and prepared in accordance with EU endorsed International Financial Reporting Standards (‘IFRS’) and interpretations of the International Financial Reporting Standards Interpretations Committee (‘IFRS IC’). The consolidated financial statements have been prepared on a going concern basis (as referred to in the Financial review on page 33) and under the historical cost convention with the exception of certain items which are measured at fair value as disclosed in the accounting policies below. The Company has elected to prepare its parent company financial statements in accordance with UK Generally Accepted Accounting Practice (‘UK GAAP’).
The Group has adopted the following new standards and amendments to standards, including any consequential amendments to other standards, with a date of initial application of 1 January 2014:
IFRS 10 ‘Consolidated Financial Statements’;IFRS 11 ‘Joint Arrangements’;IFRS 12 ‘Disclosure of Interests in Other Entities’;International Accounting Standard (‘IAS’) 27 (Revised) ‘Separate Financial Statements’;IAS 28 (Revised) ‘Investments in Associates and Joint Ventures’; Amendment to IAS 32 ‘Financial Instruments: Presentation’; Amendments to IAS 36 ‘Impairment of Assets’; and Amendment to IAS 39 ‘Financial Instruments: Recognition and Measurement’.
These have not had a material impact on the Group’s overall results and financial position.
Some of the prior year numbers that were originally presented on a net basis in the Consolidated balance sheet and Consolidated cash flow statement and the relevant Notes have been re-presented on a gross basis to more accurately reflect the underlying transactions and to be consistent with the current year presentation.
The accounting policies set out below have, unless otherwise stated, been applied to all periods presented in the consolidated financial statements.
2 ACCOUNTING POLICIESa Basis of consolidation (i) SubsidiariesSubsidiaries are entities controlled by the Group. Control exists when the Group is exposed or has rights to variable returns from its involvement with the entity and has the ability to affect those returns through its power over the entity. Subsidiaries are included in the consolidated financial statements from the date that control commences until the date that control ceases.
The acquisition method of accounting is used to account for the acquisition of subsidiaries. Identifiable assets acquired and liabilities and contingent liabilities assumed in a business combination are measured initially at fair value at the acquisition date. The consideration paid or payable in respect of acquisitions comprises amounts paid on completion and deferred consideration, excluding payments which are contingent on the continued employment of former owners of businesses acquired. The excess of the consideration (excluding payments contingent on future employment) over the fair value of the identifiable net assets acquired is recorded as goodwill. Payments that are contingent on future employment and transaction costs and expenses such as professional fees are charged to the income statement.
(ii) AssociatesAssociates are entities over which the Group is in a position to exercise significant influence. Associates are accounted for using the equity method and are recognised initially at cost. The consolidated financial statements include the Group’s share of the income and expenses of associates.
(iii) Transactions eliminated on consolidationIntragroup balances and any unrealised gains and losses or income and expenses arising from intragroup transactions are eliminated in preparing the consolidated financial statements.
b Foreign currencyTransactions in foreign currencies are recorded at the rate of exchange at the date of the transaction. Monetary assets and liabilities denominated in foreign currencies at the balance sheet date are translated at the exchange rate prevailing at that date. Foreign exchange differences arising on translation are recognised in the income statement, unless they qualify for cash flow or net investment hedge accounting treatment, in which case the effective portion is recognised directly in a separate component of equity.
Assets and liabilities of foreign operations are translated at the exchange rate prevailing at the balance sheet date. Income and expenses of foreign operations are translated at average exchange rates. All resulting exchange differences, including exchange differences arising from the translation of borrowings and other financial instruments designated as hedges of such investments, are recognised directly in a separate component of equity. Differences that have arisen since 1 January 2004, the date of transition to IFRS, are presented as a separate component of equity.

82 BUNZL PLC ANNUAL REPORT 2014
NOTES CONTINUED
2 ACCOUNTING POLICIES CONTINUEDc RevenueThe Group is engaged in the delivery of goods to customers. Revenue from a sale is recognised in the income statement upon delivery of the relevant goods, which is the point in time at which the significant risks and rewards of ownership of the goods are transferred.
Revenue is valued at invoiced amounts, excluding sales taxes, less estimated provisions for returns and trade discounts where relevant. Returns provisions and early settlement discounts are based on experience over an appropriate period whereas volume discounts are based on agreements with customers.
Revenue is not recognised if there is significant uncertainty regarding recovery of the consideration due.
d Cost of goods sold Cost of goods sold consists of the cost of the inventories sold or disposed of in the period, where the cost of inventories is net of supplier rebate income related to those inventories.
e Supplier rebatesThe Group has various rebate arrangements with a number of suppliers. Some of these arrangements are based on the volume of products purchased and others are based on the volume of products sold. Supplier rebate income is recognised in cost of goods sold concurrent with the sale of the inventories to which it relates and is calculated by reference to the expected consideration receivable from each rebate arrangement. Supplier rebate income is not recognised if there is significant uncertainty regarding recovery of the amount due. Supplier rebate income accrued but not yet received is included in other receivables.
f Share based paymentsThe Group operates equity settled share based compensation plans. Details of these plans are outlined in Note 16 and the Directors’ remuneration report. The total expected expense is based on the fair value of options and other share based incentives on the grant date calculated using a valuation model and is spread over the expected vesting period with a corresponding credit to equity.
g LeasesOperating lease rentals and any incentives receivable are recognised in the income statement on a straight line basis over the term of the relevant lease. Leases in which the Group assumes substantially all the risks and rewards of ownership of the leased assets are classified as finance leases. Where land and buildings are held under leases, the accounting treatment of the land is considered separately from that of the buildings due to the indefinite life of land.
h Income taxIncome tax in the income statement comprises current and deferred tax. Income tax is recognised in the income statement except when it relates to items reflected in equity when it is recognised in equity.
Current tax reflects tax payable on taxable income for the year using rates enacted or substantively enacted at the balance sheet date and any adjustments in respect of prior years.
Deferred tax is provided using the balance sheet liability method providing for temporary differences arising between tax bases and carrying amounts in the consolidated financial statements. Deferred tax is measured at the tax rates that are expected to be applied to temporary differences when they reverse, based on the laws that have been enacted or substantively enacted at the balance sheet date.
Deferred tax is not recognised for the following temporary differences: goodwill not deductible for tax purposes, the initial recognition of assets and liabilities that affect neither accounting nor taxable profits and differences relating to investments in subsidiaries to the extent that they will probably not reverse in the foreseeable future. Deferred tax assets are recognised to the extent that it is probable that future taxable profit will be available against which any asset can be utilised.
i Property, plant and equipmentProperty, plant and equipment are stated at historical cost less accumulated depreciation and any impairment losses.
j DepreciationDepreciation is provided on a straight line basis to write off cost less estimated residual value over the assets’ estimated remaining useful lives. This is applied at the following annual rates:
Buildings 2% (or depreciated over life of lease if shorter than 50 years)Plant and machinery 8%–33%Fixtures, fittings and equipment 8%–33%Freehold land Not depreciated
The assets’ residual values, useful lives and depreciation methods are reviewed, and adjusted if appropriate, at each balance sheet date.

BUNZL PLC ANNUAL REPORT 2014 83
2 ACCOUNTING POLICIES CONTINUEDk Intangible assets(i) GoodwillAcquisitions are accounted for using the acquisition method. As permitted by IFRS 1 ‘First-time Adoption of International Financial Reporting Standards’, the Group has chosen to apply IFRS 3 ‘Business Combinations’ from 1 January 2004 and has elected not to restate previous business combinations. For acquisitions made before 1 January 2004, goodwill represents the amount previously recorded under UK GAAP. For acquisitions that occurred between 1 January 2004 and 31 December 2009, goodwill represents the cost of the business combination in excess of the fair value of the identifiable assets, liabilities and contingent liabilities acquired. For acquisitions that have occurred on or after 1 January 2010, goodwill represents the cost of the business combination (excluding payments contingent on future employment and other acquisition related costs) in excess of the fair value of the identifiable assets, liabilities and contingent liabilities acquired. Goodwill is allocated to cash generating units and is tested annually for impairment. Negative goodwill arising on acquisition is recognised immediately in the income statement.
(ii) Other intangible assetsIntangible assets acquired in a business combination are recognised on acquisition and recorded at fair value. These principally relate to customer relationships and are stated at cost less accumulated amortisation and any impairment losses. Amortisation is charged to the income statement on a straight line basis over the estimated useful economic lives (which range from 10 to 19 years).
l ImpairmentThe carrying amounts of the Group’s assets are reviewed annually to determine if there is any indication of impairment. If any such indication exists, the assets’ recoverable amounts are estimated. The recoverable amounts of assets carried at amortised cost are calculated as the present value of estimated future cash flows, discounted at appropriate pre-tax discount rates. The recoverable amounts of other assets are the greater of their fair value less the costs to sell and the value in use. In assessing the value in use, the estimated future cash flows are discounted to their present values using appropriate pre-tax discount rates. Impairment losses are recognised when the carrying amount of an asset or cash generating unit exceeds its recoverable amount, with impairment losses being recognised in the income statement.
m InventoriesInventories are valued at the lower of cost and net realisable value. The cost of inventories comprises the purchase price, net of any related supplier volume rebates, plus import duties and other taxes, inbound freight and haulage costs and other related costs incurred to bring the product into its present location and condition. Net realisable value is the estimated selling price in the ordinary course of business, less the estimated cost of completion and estimated cost necessary to make the sale.
n Trade and other receivablesTrade and other receivables are stated at cost less any impairment losses. A provision for impairment is established when there is objective evidence that the Group will not be able to collect all amounts due according to the original terms of the receivables or uncertainty as to whether the Group will be able to collect all such amounts.
o Trade and other payablesTrade and other payables are stated at cost.
p Financial instruments Under IAS 39 ‘Financial Instruments: Recognition and Measurement’, financial instruments are initially measured at fair value with subsequent measurement depending upon the classification of the instrument. IFRS 13 defines fair value as the price that would be received to sell an asset or paid to transfer a liability in an orderly transaction between market participants at the measurement date. Other financial assets and liabilities are held at amortised cost unless they are in a fair value hedging relationship. Derivative financial instruments are used to hedge exposures to foreign exchange and interest rate risks.
(i) Fair value hedgeWhere a derivative financial instrument is designated and qualifies as a hedge of a recognised asset or liability, all changes in the fair value of the derivative are recognised immediately in the income statement. The carrying value of the hedged item is adjusted by the change in fair value that is attributable to the risk being hedged with changes recognised in the income statement.
(ii) Cash flow hedgeWhere a derivative that is designated and qualifies as a hedge is used to hedge forecast transactions, any effective portion of the change in fair value is recognised in equity. The gain or loss relating to any ineffective portion is recognised immediately in the income statement. Amounts accumulated in equity are recycled to the income statement in the period when the hedged item affects profit or loss.
(iii) Hedge of a net investment in foreign operationsForeign currency differences arising on the retranslation of a financial liability designated as a hedge of a net investment in foreign operations are recognised directly in equity to the extent the hedge is effective. To the extent that the hedge is ineffective such differences are recognised in the income statement.
q Cash and cash equivalentsCash and cash equivalents comprise cash balances, bank overdrafts and short term deposits with maturities of three months or less from the date the deposit is made.

84 BUNZL PLC ANNUAL REPORT 2014
NOTES CONTINUED
2 ACCOUNTING POLICIES CONTINUEDr Net debtNet debt is defined as interest bearing loans and borrowings and the fair value of interest rate swaps on fixed interest rate borrowings, less cash and cash equivalents.
s ProvisionsProvisions are recognised in the balance sheet when the Group has a present legal or constructive obligation as a result of a past event and where it is probable that an outflow of economic benefits will be required to settle the obligation. If the effect is material, provisions are determined by discounting the expected future cash flows at a pre-tax rate that reflects current market assessments of the time value of money and, where appropriate, the risks specific to the liability.
A provision for onerous contracts is recognised when the expected benefits to be derived by the Group from a contract are lower than the unavoidable costs of meeting the Group’s obligations under the contract.
t Retirement benefit obligations(i) Defined contribution pension schemesObligations for contributions to defined contribution pension schemes are charged as an expense to the income statement as incurred.
(ii) Defined benefit pension schemesPension liabilities are recognised in the balance sheet and represent the difference between the fair value of scheme assets and the present value of scheme liabilities. Scheme liabilities are determined on an actuarial basis using the projected unit method and discounted using the rate applicable to AA rated corporate bonds that have a similar maturity to the scheme liabilities.
Current service cost, past service cost/credit and gains and losses on any settlements and curtailments are credited or charged to the income statement. Past service cost is recognised immediately to the extent benefits are already vested. Net interest on the net defined benefit liability is included within finance cost. The net interest is calculated using the same discount rate that is used in calculating the defined benefit obligation, applied to the net defined benefit liability at the start of the period.
Actuarial gains and losses are recognised in full in the statement of comprehensive income.
u Investment in own sharesThe cost of shares held either directly (treasury shares) or indirectly (employee benefit trust shares) is deducted from equity. Repurchased shares are classified as treasury shares and are presented as a deduction from total equity. When treasury shares are subsequently sold or reissued, the amount received is recognised as an increase in equity and the resulting surplus or deficit on the transaction is recognised in retained earnings.
At each reporting date the Group remeasures the value of the shares held in the employee benefit trust to present them in the own shares reserve at the market value of those shares at the reporting date. This is done through a reclassification from retained earnings to the own shares reserve. This movement has no effect on the actual numbers of shares held by the employee benefit trust.
v DividendsThe interim dividend is recognised in the statement of changes in equity in the period in which it is paid and the final dividend in the period in which it is approved by shareholders at the Annual General Meeting.
w Non-GAAP measuresFurther to the various performance measures defined under IFRS, the Group reports a number of additional performance measures that are designed to assist with the understanding of the underlying performance of the Group and its businesses. These measures are not defined under IFRS and, as a result, do not comply with Generally Accepted Accounting Practice (known as ‘non-GAAP measures’) and may not be directly comparable with other companies’ non-GAAP measures. They are not designed to be a substitute for any of the IFRS measures of performance. The principal additional performance measures used within the consolidated financial statements include:
• adjusted operating profit;
• adjusted profit before income tax;
• adjusted profit for the year;
• adjusted earnings per share; and
• adjusted diluted earnings per share.
These measures exclude the charge for intangible amortisation, acquisition related costs and, where relevant, the associated tax. Intangible amortisation, acquisition related costs and the associated tax are items which are not taken into account by management when assessing the results of the business as they do not relate to the underlying operating performance. Accordingly, these items are removed in calculating the profitability measures by which management assess the performance of the Group.
Acquisition related costs comprise transaction costs and expenses, deferred consideration payments relating to the retention of former owners of businesses acquired and adjustments to previously estimated earn outs.
The Group’s key performance indicators are set out and defined on pages 14 and 15. A number of these are based on, or derived from, the non-GAAP measures noted above.
BUNZL PLC ANNUAL REPORT 2014 85
2 ACCOUNTING POLICIES CONTINUEDCRITICAL ACCOUNTING JUDGEMENTS AND ESTIMATES
The following provides information on those policies that management considers critical because of the level of judgement and estimation required which often involves assumptions regarding future events which can vary from what is anticipated. The directors review the judgements and estimates on an ongoing basis with revisions to accounting estimates recognised in the period in which the estimates are revised and in any future periods affected. The key sources of estimation at the balance sheet date that have risk of causing material adjustment to the carrying amounts of assets and liabilities are set out below. The directors believe that the consolidated financial statements reflect appropriate judgements and estimates and provide a true and fair view of the Group’s performance and financial position. Where appropriate and practicable, sensitivities are disclosed in the relevant notes.
a Retirement benefit obligationsThe cost of defined benefit pension schemes and the present value of the obligations relating thereto are determined using actuarial valuations appropriate for each country where defined benefit pension schemes are provided. The actuarial valuations involve making assumptions about discount rates, future salary increases, future pension increases and mortality rates. All assumptions are reviewed at each reporting date. In determining the appropriate discount rates, management considers the interest rates of corporate bonds with an AA rating in the relevant country. Future salary increases and future pension increases are based on expected future inflation rates for each country. Mortality rates are based on the relevant mortality tables for each country. Further details about the assumptions used are set out in Note 20.
b Intangible assetsIFRS 3 requires the identification of acquired intangible assets as part of a business combination. The methods used to value such intangible assets require the use of estimates including forecast performance and customer attrition rates. Future results are impacted by the amortisation periods adopted and changes to the estimated useful lives would result in different effects on the income statement.
Goodwill is tested annually for impairment. Tests for impairment are based on discounted cash flows and assumptions (including discount rates, timing and growth prospects) which are inherently subjective. Further details about the assumptions used are set out in Note 9.
c AcquisitionsAcquisitions are accounted for using the acquisition method based on the fair value of the consideration paid. Assets and liabilities are measured at fair value and the purchase price is allocated to assets and liabilities based on these fair values.
Determining the fair values of assets and liabilities acquired involves the use of significant estimates and assumptions (including discount rates, asset lives and recoverability). Assets and liabilities are measured at fair value and the value of freehold properties is typically determined by qualified valuers on an open market basis.
d TaxThe Group is subject to income taxes in a number of jurisdictions. Management is required to make judgements and estimates in determining the provisions for income taxes recognised in the consolidated financial statements.
NEW ACCOUNTING STANDARDS AND INTERPRETATIONSThe Group is currently assessing the potential impact of other new and revised standards and interpretations issued by the International Accounting Standards Board that will be effective from 1 January 2015 and beyond. Based on the analysis to date, the Group does not anticipate that these will have a material impact on the Group’s overall results and financial position.

86 BUNZL PLC ANNUAL REPORT 2014
NOTES CONTINUED
3 SEGMENT ANALYSIS
Year ended 31 December 2014
North America
£m
Continental Europe
£m
UK & Ireland
£m
Rest of the World
£mCorporate
£mTotal
£m
Revenue 3,372.1 1,146.3 1,078.5 559.6 6,156.5Adjusted operating profit/(loss) 211.1 103.2 80.1 55.5 (20.1) 429.8Intangible amortisation (13.4) (28.4) (7.6) (12.5) – (61.9)Acquisition related costs (5.6) (4.9) (1.9) (13.7) – (26.1)Operating profit/(loss) 192.1 69.9 70.6 29.3 (20.1) 341.8Finance income 4.0Finance cost (46.0) Profit before income tax 299.8Adjusted profit before income tax 387.8Income tax (89.1)Profit for the year 210.7
Capital expenditure 8.1 7.7 5.3 3.7 0.3 25.1Depreciation 7.5 9.4 4.0 3.3 0.2 24.4
Year ended 31 December 2013
North America
£m
Continental Europe
£m
UK & Ireland
£m
Rest of the World
£mCorporate
£mTotal
£m
Revenue 3,401.7 1,151.5 1,018.5 526.0 6,097.7 Adjusted operating profit/(loss) 213.6 97.0 71.6 51.2 (19.0) 414.4Intangible amortisation (12.6) (29.1) (7.1) (9.5) – (58.3)Acquisition related costs (6.8) (3.5) (1.6) (12.1) – (24.0) Operating profit/(loss) 194.2 64.4 62.9 29.6 (19.0) 332.1Finance income 2.6Finance cost (44.8)Profit before income tax 289.9Adjusted profit before income tax 372.2Income tax (83.1) Profit for the year 206.8
Capital expenditure 11.2 8.7 4.3 2.3 – 26.5 Depreciation 7.8 11.1 4.0 2.8 0.2 25.9
Acquisition related costs for the year ended 31 December 2014 comprise transaction costs and expenses of £4.1m (2013: £8.4m), deferred consideration payments of £21.0m (2013: £22.0m) relating to the retention of former owners of businesses acquired and a charge of £1.0m (2013: £6.4m credit) from adjustments to previously estimated earn outs.
The Group is managed through four business areas based on geographic regions which represent the reporting segments under IFRS 8 ‘Operating Segments’. The revenue presented relates to external customers. Sales between the business areas are not material. Each of the business areas supplies a range of products to customers operating primarily in the foodservice, grocery, cleaning & hygiene, retail, safety and healthcare market sectors. The performance of the four business areas is assessed by reference to adjusted operating profit and this measure also represents the segment results for the purposes of reporting in accordance with IFRS 8. Debt and associated interest is managed at a Group level and therefore has not been allocated across the business areas. In accordance with the provisions of IFRS 8, the Company’s chief operating decision maker is the Board of Directors.

BUNZL PLC ANNUAL REPORT 2014 87
3 SEGMENT ANALYSIS CONTINUEDWithin each of the four business areas, there are a number of further segments based on geography and market sector. These segments have been aggregated into the four business areas as shown above due to the similarity between them in terms of economic characteristics and also in respect of the nature of the products and services, types of customer and the methods used to distribute these products and services.
There are no customers who account for more than 10% of Group revenue. Customer dependencies are regularly monitored.
Revenue by market sector2014
£m2013
£m
Foodservice 1,709.6 1,766.9Grocery 1,610.8 1,648.3Cleaning & hygiene 787.4 733.9Retail 724.4 696.9Safety 687.0 624.7Healthcare 435.6 418.6Other 201.7 208.4
6,156.5 6,097.7
The Other category covers a wide range of market sectors, none of which is sufficiently material to warrant separate disclosure.
At 31 December 2014
North America
£m
Continental Europe
£m
UK & Ireland
£m
Rest of the World
£mUnallocated
£mTotal
£m
Segment assets 1,110.9 879.9 659.6 511.6 3,162.0Unallocated assets 127.0 127.0Total assets 1,110.9 879.9 659.6 511.6 127.0 3,289.0
Segment liabilities 395.5 247.9 288.2 96.3 1,027.9 Unallocated liabilities 1,277.2 1,277.2 Total liabilities 395.5 247.9 288.2 96.3 1,277.2 2,305.1
At 31 December 2013
North America
£m
Continental Europe
£m
UK & Ireland
£m
Rest of the World
£mUnallocated
£mTotal
£m
Segment assets 1,078.6 920.6 624.4 443.9 3,067.5Unallocated assets 108.2 108.2Total assets 1,078.6 920.6 624.4 443.9 108.2 3,175.7
Segment liabilities 407.8 246.9 270.2 87.9 1,012.8Unallocated liabilities 1,223.0 1,223.0 Total liabilities 407.8 246.9 270.2 87.9 1,223.0 2,235.8
Unallocated assets and liabilities include Corporate assets and liabilities, tax assets and liabilities, cash and deposits, borrowings, derivative assets and liabilities and pension scheme assets and liabilities.

88 BUNZL PLC ANNUAL REPORT 2014
NOTES CONTINUED
4 ANALYSIS OF OPERATING INCOME AND EXPENSES 2014
£m2013
£m
Cost of goods sold 4,659.2 4,638.3Employee costs (see Note 21) 594.7 570.2Depreciation of property, plant and equipment 24.4 25.9Amortisation of intangible fixed assets 61.9 58.3Acquisition related costs 26.1 24.0Loss on disposal of property, plant and equipment – (0.2)Rentals payable under operating leases and subleases 93.1 90.2Lease and sublease income (0.3) (0.8)Other operating expenses 355.6 359.7Net operating expenses 5,814.7 5,765.6
2014 2013
Auditors’ remunerationUK £m
Overseas £m
Total £m
UK £m
Overseas £m
Total £m
Audit of these financial statements 0.3 – 0.3 0.3 – 0.3 Amounts receivable by the Company’s auditors and their associates in respect of: audit of financial statements of subsidiaries of
the Company 0.3 1.5 1.8 0.4 1.6 2.0 audit related assurance services 0.1 – 0.1 0.1 – 0.1 taxation compliance services – – – – 0.1 0.1 other tax advisory services 0.1 0.2 0.3 – 0.1 0.1 all other services 0.4 0.2 0.6 0.1 0.4 0.5 Total auditors’ remuneration 1.2 1.9 3.1 0.9 2.2 3.1
During 2014 the Company carried out a tender for the external audit following which PricewaterhouseCoopers LLP (‘PwC’) were appointed as auditors of the Company in place of KPMG Audit Plc (‘KPMG’). Accordingly, the figures for auditors’ remuneration shown above relate to PwC for 2014 and KPMG for 2013.
Non-audit services principally comprise tax services and further assurance services relating to pre-acquisition due diligence and other duties carried out in respect of acquisitions and disposals of businesses. It is the Company’s policy to assess the services required on a case by case basis to ensure that the most appropriate adviser is retained. As a result it is sometimes appropriate for this additional work to be carried out by the Company’s auditors. However other firms are also used by the Company to provide non-audit services if such other firms are thought to be best placed to undertake the work involved.
The Audit Committee, which consists entirely of independent non-executive directors, reviews and approves the level and type of non-audit work which the external auditors perform, including the fees paid for such work, to ensure that the auditors’ objectivity and independence are not compromised. Further information is set out in the Audit Committee’s report on pages 48 to 51.
5 FINANCE INCOME/(COST)2014
£m2013
£m
Interest on deposits 1.6 0.8Interest income from foreign exchange contracts 1.4 1.4Other finance income 1.0 0.4Finance income 4.0 2.6
Interest on loans and overdrafts (41.4) (39.9)Interest expense from foreign exchange contracts (2.0) (1.5)Interest charge on retirement benefit obligations (1.6) (2.8)Fair value (loss)/gain on US private placement notes in a hedge relationship (12.1) 2.0Fair value gain/(loss) on interest rate swaps in a hedge relationship 12.1 (2.0)Foreign exchange (loss)/gain on intercompany funding (10.4) 10.9Foreign exchange gain/(loss) on external debt not in a hedge relationship 9.8 (11.0)Other finance expense (0.4) (0.5)Finance cost (46.0) (44.8)
The foreign exchange (loss)/gain on intercompany funding arises as a result of foreign currency intercompany loans and deposits. This is substantially matched by external debt to minimise this foreign currency exposure in the income statement.
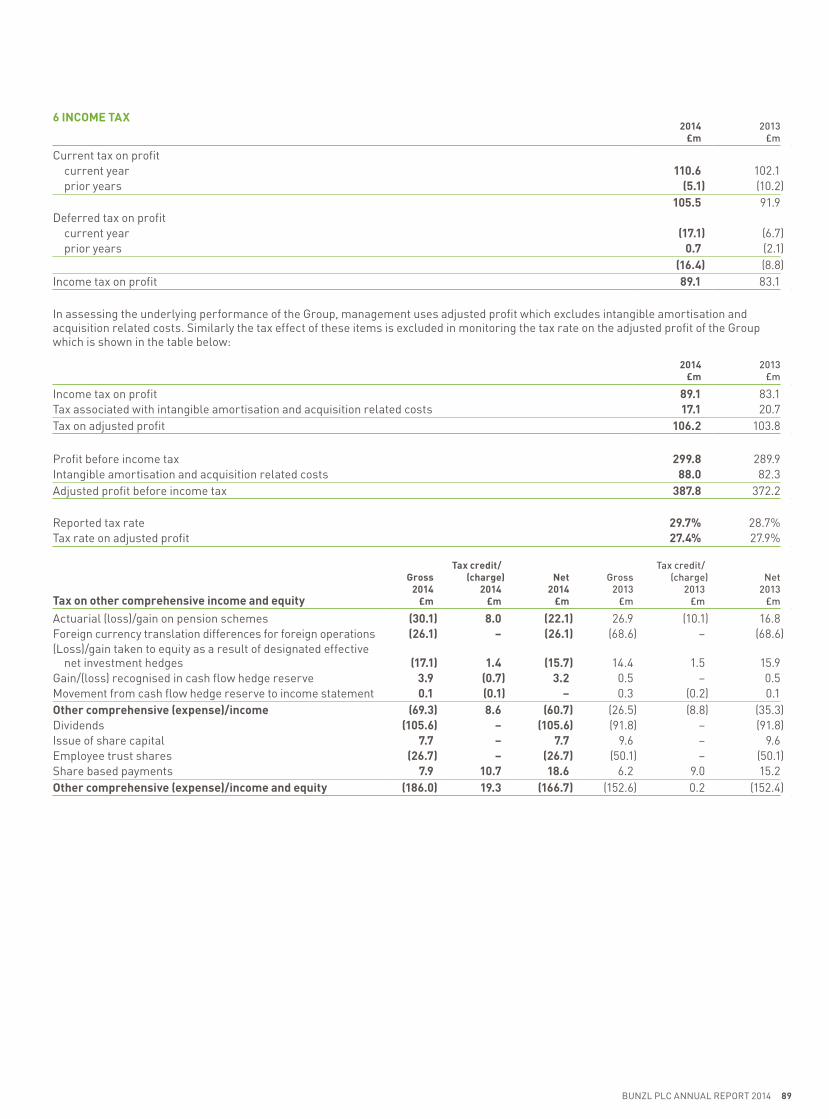
BUNZL PLC ANNUAL REPORT 2014 89
6 INCOME TAX 2014
£m2013
£m
Current tax on profit current year 110.6 102.1 prior years (5.1) (10.2)
105.5 91.9Deferred tax on profit current year (17.1) (6.7) prior years 0.7 (2.1)
(16.4) (8.8)Income tax on profit 89.1 83.1
In assessing the underlying performance of the Group, management uses adjusted profit which excludes intangible amortisation and acquisition related costs. Similarly the tax effect of these items is excluded in monitoring the tax rate on the adjusted profit of the Group which is shown in the table below:
2014 £m
2013 £m
Income tax on profit 89.1 83.1Tax associated with intangible amortisation and acquisition related costs 17.1 20.7Tax on adjusted profit 106.2 103.8
Profit before income tax 299.8 289.9Intangible amortisation and acquisition related costs 88.0 82.3Adjusted profit before income tax 387.8 372.2
Reported tax rate 29.7% 28.7%Tax rate on adjusted profit 27.4% 27.9%
Tax on other comprehensive income and equity
Gross 2014
£m
Tax credit/ (charge)
2014£m
Net 2014
£m
Gross 2013
£m
Tax credit/ (charge)
2013£m
Net 2013
£m
Actuarial (loss)/gain on pension schemes (30.1) 8.0 (22.1) 26.9 (10.1) 16.8Foreign currency translation differences for foreign operations (26.1) – (26.1) (68.6) – (68.6)(Loss)/gain taken to equity as a result of designated effective
net investment hedges (17.1) 1.4 (15.7) 14.4 1.5 15.9Gain/(loss) recognised in cash flow hedge reserve 3.9 (0.7) 3.2 0.5 – 0.5Movement from cash flow hedge reserve to income statement 0.1 (0.1) – 0.3 (0.2) 0.1Other comprehensive (expense)/income (69.3) 8.6 (60.7) (26.5) (8.8) (35.3)Dividends (105.6) – (105.6) (91.8) – (91.8)Issue of share capital 7.7 – 7.7 9.6 – 9.6Employee trust shares (26.7) – (26.7) (50.1) – (50.1)Share based payments 7.9 10.7 18.6 6.2 9.0 15.2Other comprehensive (expense)/income and equity (186.0) 19.3 (166.7) (152.6) 0.2 (152.4)

90 BUNZL PLC ANNUAL REPORT 2014
NOTES CONTINUED
6 INCOME TAX CONTINUEDFactors affecting the tax charge for the yearThe Group operates in many countries and is subject to income tax in many different jurisdictions. The expected tax rate is calculated as a weighted average of the tax rates in the tax jurisdictions in which the Group operates. The adjustments to the tax charge at the weighted average rate to determine the income tax on profit are as follows:
2014 £m
2013 £m
Profit before income tax 299.8 289.9
Tax charge at weighted average rate (2014: 31.5%; 2013: 31.4%) 94.5 91.0Effects of: adjustment in respect of prior years (4.4) (12.3) non-taxable and non-deductible items (3.0) 1.6 other 2.0 2.8Income tax on profit 89.1 83.1
Deferred tax in the income statement2014
£m2013
£m
Accelerated capital allowances (0.6) 1.0Retirement benefit obligations – (0.5)Intangible assets (13.3) (12.4)Share based payments (0.8) (1.5)Provisions 0.5 1.5Other (2.2) 3.1Deferred tax on profit (16.4) (8.8)
UK tax rate changeFollowing the enactment of legislation in the UK, the corporation tax rate was reduced to 21% from 1 April 2014 and 20% from 1 April 2015.
7 EARNINGS PER SHARE 2014
£m2013
£m
Profit for the year 210.7 206.8Adjustment* 70.9 61.6Adjusted profit for the year 281.6 268.4
Basic weighted average ordinary shares in issue (million) 326.6 325.8Dilutive effect of employee share plans (million) 3.9 4.0Diluted weighted average ordinary shares (million) 330.5 329.8
Basic earnings per share 64.5p 63.5pAdjustment 21.7p 18.9pAdjusted earnings per share 86.2p 82.4p
Diluted basic earnings per share 63.7p 62.7pAdjustment 21.5p 18.7pAdjusted diluted earnings per share 85.2p 81.4p
* Adjustment comprises intangible amortisation of £61.9m (2013: £58.3m), acquisition related costs of £26.1m (2013: £24.0m) and associated tax credit of £17.1m (2013: £20.7m).

BUNZL PLC ANNUAL REPORT 2014 91
8 PROPERTY, PLANT AND EQUIPMENT
2014
Land and buildings
£m
Plant and machinery
£m
Fixtures, fittings and equipment
£mTotal
£m
Cost Beginning of year 78.3 111.3 116.5 306.1Acquisitions 0.2 0.7 1.0 1.9Additions 1.5 11.9 11.7 25.1Disposals (0.2) (4.1) (4.5) (8.8)Currency translation (1.0) 1.8 (2.5) (1.7)End of year 78.8 121.6 122.2 322.6
DepreciationBeginning of year 26.7 70.6 90.0 187.3Charge in year 2.7 10.6 11.1 24.4Disposals (0.1) (3.5) (4.0) (7.6)Currency translation 0.1 1.1 (1.9) (0.7)End of year 29.4 78.8 95.2 203.4
Net book value at 31 December 2014 49.4 42.8 27.0 119.2
2013
Land and buildings
£m
Plant and machinery
£m
Fixtures, fittings and equipment
£mTotal
£m
Cost Beginning of year 75.2 98.9 109.4 283.5Acquisitions 3.0 4.4 2.2 9.6Additions 1.9 14.5 10.1 26.5Disposals (1.7) (2.9) (3.5) (8.1)Currency translation (0.1) (3.6) (1.7) (5.4) End of year 78.3 111.3 116.5 306.1
DepreciationBeginning of year 25.2 64.5 82.7 172.4Charge in year 3.3 10.9 11.7 25.9Disposals (1.2) (2.7) (3.2) (7.1)Currency translation (0.6) (2.1) (1.2) (3.9) End of year 26.7 70.6 90.0 187.3
Net book value at 31 December 2013 51.6 40.7 26.5 118.8
The net book value of property, plant and equipment includes assets held under finance leases and hire purchase contracts totalling £4.4m (2013: £8.7m). Accumulated depreciation of these assets was £2.5m (2013: £5.8m). Future capital expenditure at 31 December 2014 consisted of commitments not provided for of £1.0m (2013: £0.6m).

92 BUNZL PLC ANNUAL REPORT 2014
NOTES CONTINUED
9 INTANGIBLE ASSETS
Goodwill2014
£m2013
£m
Beginning of year 901.0 823.2Acquisitions 36.2 97.4Currency translation (14.9) (19.6)End of year 922.3 901.0
Customer relationships2014
£m2013
£m
CostBeginning of year 887.2 793.1Acquisitions 76.0 111.1Currency translation (24.3) (17.0)End of year 938.9 887.2AmortisationBeginning of year 331.3 275.7Charge in year 61.9 58.3Currency translation (10.8) (2.7)End of year 382.4 331.3
Net book value at 31 December 556.5 555.9
Total net book value of intangible assets at 31 December 1,478.8 1,456.9
Both goodwill and customer relationships have been acquired as part of business combinations. Customer relationships are amortised over their estimated useful lives which range from 10 to 19 years.
Impairment testsThe carrying amount of goodwill is allocated across cash generating units (‘CGUs’) and is tested annually for impairment.
A description of the Group’s principal activities is set out in the Chief Executive’s review. There is no significant difference in the nature of activities across different geographies. The identification of CGUs reflects the way in which the business is managed on a geographical basis. Given the similar nature of the activities of each CGU, a consistent methodology is applied across the Group in assessing CGU recoverable amounts. The recoverable amount is the higher of the value in use and the fair value less the costs to sell. The value in use is the present value of the cash flows expected to be generated by the CGU over a projection period together with a terminal value. The projection period is the time period over which future cash flows are predicted. The Group’s methodology is to use a projection period of five years being the maximum period over which detailed future cash flows for each CGU are prepared. For periods after this five year period, the methodology applies a long term growth rate to derive a terminal value. Cash flow expectations exclude any future cash flows that may arise from restructuring or other enhancements to the cash generating activities of the CGU and reflect management’s expectations of the range of economic conditions that may exist over the projection period.
The value in use calculations are principally sensitive to revenue growth, including any significant changes to the customer base, achievability of future margins and the discount rate used in the present value calculation. The information used for valuation purposes takes into consideration past experience and the current economic environment with regard to customer attrition rates and additions to the customer base, the ability to introduce price increases and new products and experience in controlling the underlying cost base. This provides a long term growth rate which is consistent with the geographic segments in which the Group operates and management’s assessment of future operating performance and market share movements. The growth rate has been calculated based principally on expected inflation rates of the relevant economies.
At 31 December 2014 North America, France Hygiene and UK Hospitality carried a significant amount of goodwill in comparison with the total value of the Group’s goodwill. At 31 December 2014 the carrying value of goodwill in respect of North America was £245.2m (2013: £233.5m), France Hygiene was £76.5m (2013: £82.2m) and UK Hospitality was £62.5m (2013: £62.5m). At 31 December 2014 the aggregate amount of goodwill attributable to the Group’s CGUs, excluding North America, France Hygiene and UK Hospitality, was £538.1m (2013: £522.8m). The remaining goodwill relates to CGUs which are not individually significant.
For North America, France Hygiene and UK Hospitality the weighted average long term growth rate used in 2014 was 2.5% (2013: 2.5%). A discount rate of 9% (2013: 9%) has been applied to the value in use calculations representing a pre-tax rate reflecting market assessments of the time value of money at the balance sheet date. Similar assumptions have been applied to the other CGUs but where appropriate the directors have considered alternative market risk assumptions to reflect the specific conditions arising in individual countries (with long term growth rates ranging from 2.5%–7.2% and discount rates ranging from 9%–18%).

BUNZL PLC ANNUAL REPORT 2014 93
9 INTANGIBLE ASSETS CONTINUEDSensitivity to changes in key assumptionsImpairment testing is dependent on management’s estimates and judgements, particularly as they relate to the forecasting of future cash flows, the discount rates selected and expected long term growth rates. A key assumption on which value in use calculations are dependent relates to revenue growth including the impact of changes to the underlying customer base. This assumption is sensitive to customer attrition and the rate at which new customer relationships are introduced and established.
Based on past experience and taking into account current market conditions, management has concluded that it is reasonable to assume that there will be no material deterioration in the customer base over the projection period which will significantly impact future cash flows and that no reasonably possible change in key assumptions would result in impairment in any of the Group’s CGUs. Should such a change occur, this would represent a triggering event to indicate that an impairment review may be necessary. In accordance with IAS 36 ‘Impairment of Assets’, a full impairment review would then be undertaken on the relevant assets within the CGU. Any such changes are monitored through normal monthly procedures.
10 INVENTORIES2014
£m2013
£m
Goods for resale 705.3 645.1
£4.7m was written off inventories during the year (2013: £2.9m) due to obsolescence or damage. The inventories provision at 31 December 2014 was £60.5m (2013: £58.3m).
11 TRADE AND OTHER RECEIVABLES2014
£m2013
£m
Trade receivables 700.9 695.2Prepayments and other receivables 168.9 167.8
869.8 863.0
The ageing of trade receivables at 31 December was:
Gross 2014
£m
Provision 2014
£m
Gross 2013
£m
Provision 2013
£m
Current 568.0 0.7 542.9 0.40–30 days overdue 103.0 0.3 126.0 0.431–90 days overdue 32.3 1.4 28.4 1.3Over 90 days overdue 16.0 16.0 13.8 13.8
719.3 18.4 711.1 15.9
The movement in the provision for doubtful debts in respect of trade receivables during the year was as follows:
2014 £m
2013 £m
Beginning of year 15.9 14.9Acquisitions 1.0 2.0Charge 4.1 1.9Utilised and unused (2.0) (2.6)Currency translation (0.6) (0.3)End of year 18.4 15.9

94 BUNZL PLC ANNUAL REPORT 2014
NOTES CONTINUED
12 TRADE AND OTHER PAYABLES – CURRENT 2014
£m 2013
£m
Trade payables 697.2 682.9Other tax and social security contributions 23.8 23.8Other payables 130.8 140.1Accruals and deferred income 166.6 157.6
1,018.4 1,004.4
13 RISK MANAGEMENT AND FINANCIAL INSTRUMENTSCapital managementThe Group’s policy is to maintain a strong capital base so as to maintain investor, creditor and market confidence and to sustain future development of the business. The Group monitors the return on average operating capital employed and the return on invested capital as well as the level of total shareholders’ equity and the amount of dividends paid to ordinary shareholders. For the year ended 31 December 2014, the return on average operating capital employed was 57.7% (2013: 56.9%), the return on invested capital was 17.6% (2013: 17.9%), the level of total shareholders’ equity at 31 December 2014 was £983.9m (2013: £939.9m) and the amount of dividends paid in the year ended 31 December 2014 was £105.6m (2013: £91.8m).
The Group funds its operations through a mixture of shareholders’ equity and bank and capital market borrowings. All of the borrowings are managed by a central treasury function and funds raised are lent onward to operating subsidiaries as required. The overall objective is to manage the funding to ensure the Group has a portfolio of competitively priced borrowing facilities to meet the demands of the business over time and, in order to do so, the Group arranges a mixture of borrowings from different sources with a variety of maturity dates.
The Group’s businesses provide a high and consistent level of cash generation which helps fund future development and growth. The Group seeks to maintain an appropriate balance between the higher returns that might be possible with higher levels of borrowings and the advantages and security afforded by a sound capital position.
There were no changes to the Group’s approach to capital management during the year and the Group is not subject to any externally imposed capital requirements.
Treasury policies and controlsThe Group has a centralised treasury department to control external borrowings and manage liquidity, interest rate and foreign currency risks. Treasury policies have been approved by the Board and cover the nature of the exposure to be hedged, the types of financial instruments that may be employed and the criteria for investing and borrowing cash. The Group uses derivatives to manage its foreign currency and interest rate risks arising from underlying business activities. No transactions of a speculative nature are undertaken. The treasury department is subject to periodic independent review by the internal audit department. Underlying policy assumptions and activities are periodically reviewed by the executive directors and the Board. Controls over exposure changes and transaction authenticity are in place.
Hedge accountingThe Group designates derivatives which qualify as hedges for accounting purposes as either (a) a hedge of the fair value of a recognised asset or liability; (b) a hedge of the cash flow risk resulting from changes in interest rates or foreign exchange rates; or (c) a hedge of a net investment in a foreign operation. The accounting treatment for hedges is set out in the financial instruments accounting policy in Note 2.
The Group tests the effectiveness of hedges on a prospective and retrospective basis to ensure compliance with IAS 39. Methods for testing effectiveness include dollar offset, critical terms and hypothetical derivatives.
Liquidity riskLiquidity risk is the risk that the Group will not be able to meet its financial obligations as they fall due. The Group continually monitors net debt and forecast cash flows to ensure that sufficient facilities are in place to meet the Group’s requirements in the short, medium and long term and, in order to do so, arranges borrowings from a variety of sources. Additionally, compliance with debt covenants is monitored. During 2014 all covenants have been complied with.
The Group has substantial borrowing facilities available comprising multi-currency credit facilities from the Group’s banks and US private placement notes denominated in US dollars, sterling and euros. Fixed interest US private placement notes of $252.0m and €35.0m were drawn down by the Group during 2014. At 31 December 2014 the total US private placement notes outstanding were £793.2m (2013: £607.1m) with maturities ranging from 2015 to 2026. During the year the Group also refinanced or agreed new banking facilities totalling £358.1m. The Group’s committed bank facilities mature between 2016 and 2020. At 31 December 2014 the available committed bank facilities totalled £917.0m (2013: £886.7m) of which £136.5m (2013: £273.1m) was drawn down.

BUNZL PLC ANNUAL REPORT 2014 95
13 RISK MANAGEMENT AND FINANCIAL INSTRUMENTS CONTINUEDThe undrawn committed bank facilities available at 31 December were as follows:
2014 £m
2013 £m
Expiring within one year – 40.0Expiring after one year but within two years 90.0 245.8Expiring after two years 690.5 327.8
780.5 613.6
In addition the Group maintains overdraft and uncommitted facilities to provide short term flexibility. At 31 December 2014 loans totalling £0.8m were secured by fixed charges on property (2013: £0.8m).
The contractual maturity profile of the Group’s financial assets and liabilities at 31 December is set out in the tables below. The amounts disclosed are the contractual undiscounted cash flows and therefore include interest cash flows (forecast using LIBOR interest rates at 31 December in the case of floating rate financial assets and liabilities). Derivative assets and liabilities have been included within the tables since they predominantly relate to derivatives which are used to manage the interest cash flows on the Group’s debt. Bank loans have been drawn under committed facilities and can be refinanced on maturity from these same facilities. Accordingly they have been aged based on the maturity dates of the underlying facilities.
The tables below also compare the fair value and carrying amounts for financial assets and liabilities:Contractual cash inflows/(outflows)
2014Fair value
£m
Carrying amount
£m
Total contractual
cash flows £m
Within one year
£m
After one year
but within two years
£m
After two years but within five years
£m
After more than five years
£m
Financial assets:Cash and deposits 82.4 82.4 82.4 82.4 – – –Loans and receivablesTrade receivables 700.9 700.9 700.9 700.9 – – –Derivative financial instrumentsInterest rate swaps 16.3 16.3 57.1 6.9 6.1 14.9 29.2Cross currency interest rate swaps 2.5 2.5 2.5 2.5 – – –Foreign exchange contracts for
net investment hedging 7.0 7.0 7.0 7.0 – – – Foreign exchange contracts for
cash flow hedging 3.1 3.1 3.1 3.1 – – –812.2 812.2 853.0 802.8 6.1 14.9 29.2
Financial liabilities:Financial liabilities at amortised costBank loans (138.5) (138.5) (141.5) (2.9) (88.4) (50.2) –US private placement notes (681.8) (635.7) (774.5) (65.5) (135.1) (215.2) (358.7)Bank overdrafts (28.1) (28.1) (28.1) (28.1) – – –Other interest bearing loans and
borrowings (0.2) (0.2) (0.2) (0.2) – – –Finance lease creditors (1.1) (1.1) (1.5) (0.4) (0.7) (0.4) –Trade payables (697.2) (697.2) (697.2) (697.2) – – –Other current payables (143.9) (143.9) (143.9) (143.9) – – –Non-current payables (16.7) (16.7) (16.7) – (16.7) – –
Financial liabilities at fair valueUS private placement notes (173.2) (173.6) (237.3) (6.7) (6.7) (20.2) (203.7)Derivative financial instrumentsCross currency interest rate swaps (2.8) (2.8) (2.8) (2.8) – – –Foreign exchange contracts for net
investment hedging (5.6) (5.6) (5.6) (5.6) – – –Foreign exchange contracts for
cash flow hedging (0.1) (0.1) (0.1) (0.1) – – – (1,889.2) (1,843.5) (2,049.4) (953.4) (247.6) (286.0) (562.4)

96 BUNZL PLC ANNUAL REPORT 2014
NOTES CONTINUED
13 RISK MANAGEMENT AND FINANCIAL INSTRUMENTS CONTINUEDContractual cash inflows/(outflows)
2013Fair value
£m
Carrying amount
£m
Total contractual cash flows
£m
Within one year
£m
After one year
but within two years
£m
After two years but within five years
£m
After more than five years
£m
Financial assets:Cash and deposits 73.1 73.1 73.1 73.1 – – –Loans and receivablesTrade receivables 695.2 695.2 695.2 695.2 – – –Derivative financial instrumentsInterest rate swaps 6.0 6.0 6.4 2.1 2.1 2.2 –Cross currency interest rate swaps 0.5 0.5 0.7 0.4 0.3 – –Foreign exchange contracts for
net investment hedging 3.0 3.0 3.0 3.0 – – –Foreign exchange contracts for
cash flow hedging 0.8 0.8 0.8 0.8 – – – 778.6 778.6 779.2 774.6 2.4 2.2 –
Financial liabilities: Financial liabilities at amortised costBank loans (285.5) (285.4) (294.6) (14.8) (4.1) (275.7) –US private placement notes (635.7) (607.1) (761.3) (58.2) (61.2) (258.8) (383.1)Bank overdrafts (26.3) (26.3) (26.3) (26.3) – – –Other interest bearing loans and
borrowings (0.2) (0.2) (0.2) – (0.2) – –Finance lease creditors (1.1) (1.1) (1.1) (0.4) (0.2) (0.5) –Trade payables (682.9) (682.9) (682.9) (682.9) – – –Other current payables (151.1) (151.1) (151.1) (151.1) – – –Non-current payables (22.7) (22.7) (22.7) – (22.7) – –
Derivative financial instrumentsCross currency interest rate swaps (9.7) (9.7) (10.2) (5.7) (4.5) – –Foreign exchange contracts for net
investment hedging (2.8) (2.8) (2.8) (2.8) – – –Foreign exchange contracts for
cash flow hedging (1.5) (1.5) (1.5) (1.5) – – –(1,819.5) (1,790.8) (1,954.7) (943.7) (92.9) (535.0) (383.1)
All financial assets and liabilities stated at fair value in the tables above have carrying amounts where the fair value component is, and has been throughout the year, a level two fair value measurement. Level two fair value measurements use inputs other than quoted prices that are observable for the relevant asset or liability, either directly or indirectly. The fair values of both financial assets and liabilities are calculated by discounting expected future cash flows using observable inputs and translating at the appropriate balance sheet date exchange rates. The Group has taken into account its own credit risk in the valuation of financial assets and its counterparties’ credit risk in the valuation of financial liabilities carried at fair value.
Fair value gains and losses on interest rate caps impact the income statement immediately while all other financial assets and liabilities stated at fair value are in hedging relationships.

BUNZL PLC ANNUAL REPORT 2014 97
13 RISK MANAGEMENT AND FINANCIAL INSTRUMENTS CONTINUEDOffsetting of financial assets and liabilitiesThe following table sets out the Group’s financial assets and financial liabilities that are subject to counterparty offsetting or master netting agreements. The master netting agreements regulate settlement amounts in the event either party defaults on their obligations.
2014
Gross amounts ofrecognised financialassets and liabilities
£m
Amounts offset inthe balance sheet
£m
Net amountsrecognised in the
balance sheet£m
Amounts notoffset in
balance sheet£m
Net amounts£m
Derivative assets 33.9 (5.0) 28.9 – 28.9Derivative liabilities (13.5) 5.0 (8.5) – (8.5)Cash and cash equivalents 298.4 (216.0) 82.4 – 82.4Bank overdrafts (244.1) 216.0 (28.1) – (28.1)
74.7 – 74.7 – 74.7
2013
Derivative assets 17.7 (7.1) 10.6 – 10.6Derivative liabilities (21.1) 7.1 (14.0) – (14.0)Cash and cash equivalents 116.7 (43.6) 73.1 – 73.1Bank overdrafts (69.9) 43.6 (26.3) – (26.3)
43.4 – 43.4 – 43.4
Interest rate riskThe Group is funded by a mixture of fixed and floating rate debt. In addition, interest rate swaps and interest rate caps are used to manage the interest rate risk profile. At 31 December 2014 fixed rate debt of £635.7m (2013: £607.1m) related to fixed rate US private placement notes denominated in US dollars, sterling and euros was stated at amortised cost with maturities ranging from 2015 to 2024.
At 31 December 2014, floating rate debt was comprised of £136.5m floating rate bank loans (2013: £273.1m) and £173.6m of fixed rate US private placement notes with maturities in 2025 and 2026 which have been swapped to floating rates using interest rate swaps (2013: £nil). Bank loans are drawn for various periods of up to three months at interest rates linked to LIBOR. The interest rate swaps reprice every three months.
The interest rate risk on the floating rate debt is managed using interest rate options. Borrowings with a notional principal of £45.5m were capped at 31 December 2014 (2013: £60.0m). Hedge accounting is not applied to the interest rate caps since the majority of their value is related to time value. The strike rates of these options are based on LIBOR repricing every three months.
After taking account of hedge relationships, a change of 1% in the interest rate forward curves on 31 December would have increased/(decreased) profit before tax and equity for the year by the amounts shown below as a result of changes in the fair values of derivative assets and liabilities at that date:
Impact on profit before tax Impact on equity+1% £m
–1% £m
+1% £m
–1% £m
2014 1.4 – 1.4 –2013 0.6 (0.1) 0.6 (0.1)
Foreign currency riskThe majority of the Group’s sales are made and income is earned in US dollars, euros and other foreign currencies. The Group does not hedge the impact of exchange rate movements arising on translation of earnings into sterling at average exchange rates.
The following significant exchange rates applied during the year:
Average rate Closing rate
2014 2013 2014 2013
US dollar 1.65 1.56 1.56 1.66Euro 1.24 1.18 1.29 1.20
For the year ended 31 December 2014, a movement of one cent in the US dollar and euro average exchange rates would have changed profit before income tax by £0.9m and £0.4m respectively (2013: £1.0m and £0.3m) and adjusted profit before income tax by £1.0m and £0.6m respectively (2013: £1.1m and £0.6m).

98 BUNZL PLC ANNUAL REPORT 2014
NOTES CONTINUED
13 RISK MANAGEMENT AND FINANCIAL INSTRUMENTS CONTINUEDThe majority of the Group’s transactions are carried out in the respective functional currencies of the Group’s operations and so transaction exposures are usually relatively limited. Where they do occur the Group’s policy is to hedge significant exposures of firm commitments for a period of up to one year as soon as they are committed using forward foreign exchange contracts and these are designated as cash flow hedges. However, the economic impact of foreign exchange on the value of uncommitted future purchases and sales is not hedged. As a result, sudden and significant movements in foreign exchange rates can impact profit margins where there is a delay in passing on to customers the resulting price increases. For the year ended 31 December 2014 all foreign exchange cash flow hedges were effective with a gain of £3.0m recognised in equity (2013: loss of £0.7m) which will affect the income statement during 2015.
The majority of the Group’s borrowings are effectively denominated in US dollars, sterling and euros, aligning them to the respective functional currencies of the component parts of the Group’s EBITDA. This currency profile is achieved using short term foreign exchange contracts, long term cross currency interest rate swaps and foreign currency debt. This currency composition minimises the impact of foreign exchange rates on the ratio of net debt to EBITDA.
Cross currency interest rate swaps in a cash flow hedge relationship were effective during the year with no gain or loss (2013: loss of £0.4m) being recognised in equity which will affect the income statement in 2015.
The currency profile of the Group’s net debt at 31 December is set out in the table below:
2014 £m
2013 £m
US dollar 398.6 388.2Sterling 261.7 292.7Euro 133.9 149.9Other 83.2 18.7
877.4 849.5
If a 10% strengthening or weakening of sterling had taken place on 31 December it would have increased/(decreased) profit before tax and equity for the year by the amounts shown below. The impact of this translation is much greater on equity than it is on profit before tax since equity is translated using the closing exchange rates and profit before tax is translated using the average exchange rates for the year. As a result the value of equity is more sensitive than the value of profit before tax to a movement in exchange rates on 31 December and the resulting movement in profit before tax is due solely to the translation effect on monetary items. This analysis assumes that all other variables, and in particular interest rates, remain constant.
Impact on profit before tax Impact on equity+10%
£m–10%
£m+10%
£m–10%
£m
2014 1.2 (1.4) (75.6) 92.42013 0.7 (0.8) (71.6) 87.5
Credit riskCredit risk is the risk of loss in relation to a financial asset due to non-payment by the relevant counterparty. The Group’s objective is to reduce its exposure to counterparty default by restricting the type of counterparty it deals with and by employing an appropriate policy in relation to the collection of financial assets.
The Group’s principal financial assets are cash and deposits, derivative financial instruments and trade receivables which represent the Group’s maximum exposure to credit risk in relation to financial assets. The maximum exposure to credit risk for cash and deposits (Note 23), derivative financial instruments (see page 95) and trade and other receivables (Note 11) is their carrying amount.
Dealings are restricted to those banks with the relevant combination of geographic presence and investment grade rating. The Group continually monitors the credit ratings of its counterparties and the credit exposure to each counterparty.
For trade and other receivables, the amounts represented in the balance sheet are net of allowances for doubtful receivables, estimated by the Group’s management based on prior experience and their assessment of the current economic environment. Note 11 sets out an analysis of trade and other receivables and the provision for doubtful debts in respect of trade receivables.
At the balance sheet date there were no significant concentrations of credit risk.

BUNZL PLC ANNUAL REPORT 2014 99
14 PROVISIONS2014
£m2013
£m
Current 10.7 12.0Non-current 20.9 23.8
31.6 35.8
Properties 2014
£m
Claims 2014
£m
Total 2014
£m
Properties 2013
£m
Claims 2013
£m
Total 2013
£m
Beginning of year 16.5 19.3 35.8 17.1 25.5 42.6Charge 0.8 0.5 1.3 0.5 2.4 2.9Acquisitions 0.5 1.7 2.2 2.6 1.8 4.4Utilised or released (3.5) (3.1) (6.6) (3.5) (9.9) (13.4)Currency translation (0.1) (1.0) (1.1) (0.2) (0.5) (0.7)End of year 14.2 17.4 31.6 16.5 19.3 35.8
The properties provision includes provisions for vacant properties where amounts are held against liabilities for onerous lease commitments, repairs and dilapidations. These provisions cover the relevant periods of the lease agreements, up to the earliest possible termination date, which typically extend from one to 10 years.
The Group has provisions for expected legal, environmental and other claims based on management’s best estimate at the balance sheet date of the probable loss likely to be incurred. It expects that these amounts, which are based on detailed plans or other known factors and take account of past experience for similar items, will be settled within the next one to five years.
The Group is a defendant in a number of legal proceedings incidental to its operations. While any litigation has an element of uncertainty, management does not expect that the outcome of such proceedings, either individually or in the aggregate, will have a material adverse effect on the Group’s financial condition or results of operations.
15 DEFERRED TAX 2014 2013
Asset £m
Liability £m
Net £m
Asset £m
Liability £m
Net £m
Accelerated capital allowances 1.7 (9.1) (7.4) 1.4 (7.7) (6.3)Defined benefit obligations 22.4 – 22.4 14.4 – 14.4Intangible assets – (148.4) (148.4) – (147.5) (147.5)Share based payments 16.2 – 16.2 13.6 – 13.6Provisions 12.1 (1.2) 10.9 14.0 (1.2) 12.8Inventories 8.6 (16.7) (8.1) 9.2 (15.5) (6.3)Other 7.5 (5.2) 2.3 5.9 (8.6) (2.7)Deferred tax asset/(liability) 68.5 (180.6) (112.1) 58.5 (180.5) (122.0)Set-off of tax (64.6) 64.6 – (51.0) 51.0 –Net deferred tax asset/(liability) 3.9 (116.0) (112.1) 7.5 (129.5) (122.0)
Except as noted below, deferred tax is calculated in full on temporary differences under the liability method using the tax rate of the country of operation.
The Company is able to control the dividend policy of its subsidiaries and, therefore, the timing of the remittance of the undistributed earnings of overseas subsidiaries. In general, the Company has determined either that such earnings will not be distributed in the foreseeable future or, where there are plans to remit those earnings, no tax liability is expected to arise. A deferred tax liability of £3.0m (2013: £3.0m) has been recognised in exceptional cases where distribution of earnings is both planned and expected to result in a tax liability.
Deferred tax assets in respect of temporary differences have only been recognised in respect of tax losses and other temporary differences where it is probable that these assets will be realised. No deferred tax asset has been recognised in respect of unutilised tax losses of £8.6m (2013: £9.0m).
No deferred tax has been recognised in respect of unutilised capital losses of £96.2m (2013: £96.1m) as it is not considered probable that there will be suitable future taxable profits against which they can be utilised.

100 BUNZL PLC ANNUAL REPORT 2014
NOTES CONTINUED
15 DEFERRED TAX CONTINUEDThe movement on the net deferred tax liability is shown below:
2014 £m
2013£m
Beginning of year 122.0 116.7Acquisitions 12.6 13.2Credit to income statement (16.4) (8.8)Recognised in other comprehensive income and equity (9.8) 3.5Reclassification to current tax 4.7 (1.6)Currency translation (1.0) (1.0)End of year 112.1 122.0
16 SHARE CAPITAL AND SHARE BASED PAYMENTS2014
£m2013
£m
Issued and fully paid ordinary shares of 321⁄7p each 107.6 107.2
Number ordinary shares in issue and fully paidBeginning of year 333,515,233 355,420,634Cancelled – treasury shares – (23,325,000)Issued – option exercises 1,191,643 1,419,599End of year 334,706,876 333,515,233
The Company operates the following share plans for the benefit of employees of the Company and its subsidiaries relating to the acquisition of shares in the Company. Further details of the share plans operated by the Company are set out in the Directors’ remuneration report.
Sharesave Scheme (2011) The Sharesave Scheme (2011), approved by shareholders at the 2011 Annual General Meeting, is an HM Revenue & Customs (‘HMRC’) tax advantaged scheme in the UK and is open to all UK employees, including UK based executive directors, who have completed at least three months of continuous service. It is linked to a contract for monthly savings of up to £250 per month over a period of either three or five years. Under the Sharesave Scheme (2011) options are granted to participating employees at a discount of up to 20% of the market price prevailing shortly before the invitation to apply for the option. Options are normally exercisable either three or five years after they have been granted.
The Sharesave Scheme (2011) replaced the Sharesave Scheme (2001) which was approved by shareholders at the 2001 Annual General Meeting. The Sharesave Scheme (2001) operates on a similar basis to the Sharesave Scheme (2011). Although there are a number of options outstanding under the Sharesave Scheme (2001), no further options have been granted under this Scheme since it expired in May 2011.
International Sharesave Plan The International Sharesave Plan was introduced following the approval of the Sharesave Scheme (2001) by shareholders and was extended following the approval of the Sharesave Scheme (2011). The plan operates on a similar basis to both the Sharesave Scheme (2001) and the Sharesave Scheme (2011) as described above except that it is linked to a contract for monthly savings of approximately £250 per month (or the equivalent in other currencies) over a period of three years.
Irish Sharesave Plan The Irish Sharesave Plan was also introduced following the approval of the Sharesave Scheme (2001) by shareholders and was extended following the approval of the Sharesave Scheme (2011). It is approved by the Irish Revenue Commissioners and operates on a similar basis to both the Sharesave Scheme (2001) and the Sharesave Scheme (2011) as described above except that it is linked to a contract for monthly savings of the euro equivalent of approximately £250 per month over a period of three years.

BUNZL PLC ANNUAL REPORT 2014 101
16 SHARE CAPITAL AND SHARE BASED PAYMENTS CONTINUEDLong Term Incentive Plan 2004 (‘2004 LTIP’)The 2004 LTIP was approved by shareholders at the 2004 Annual General Meeting and expired in May 2014. No further share options or performance share awards have been granted under the 2004 LTIP since that date. The 2004 LTIP is divided into two parts.
Part A of the 2004 LTIP allowed the Remuneration Committee of the Board to grant market priced executive share options. In normal circumstances options granted are only exercisable if the relevant performance condition has been satisfied. Share options granted up to April 2014 have a performance condition attached based on the Company’s adjusted earnings per share growth exceeding UK RPI inflation over three financial years by a specified margin.
Part B of the 2004 LTIP allowed the Remuneration Committee of the Board to grant performance share awards which are conditional rights to receive shares in the Company for nil consideration. A performance share award will normally vest (i.e. become exercisable) on the third anniversary of its grant to the extent that the applicable performance condition has been satisfied. The extent to which performance share awards granted vest is normally partly subject to the Company’s total shareholder return performance relative to a comparator group of companies over a three year period and partly subject to the Company’s adjusted earnings per share growth exceeding UK RPI inflation over three years by a specified margin.
Long Term Incentive Plan 2014 (‘2014 LTIP’)The 2014 LTIP was approved by shareholders at the 2014 Annual General Meeting and replaced the 2004 LTIP. The 2014 LTIP is also divided into two parts.
Part A of the 2014 LTIP allows the Remuneration Committee of the Board to grant market priced executive share options. In normal circumstances options granted are only exercisable if the relevant performance condition has been satisfied. The performance condition for the share options granted to date is based on the Company’s adjusted earnings per share growth over three financial years meeting certain specified targets.
Part B of the 2014 LTIP allows the Remuneration Committee of the Board to grant performance share awards which are conditional rights to receive shares in the Company for nil consideration. A performance share award will normally vest (i.e. become exercisable) on the third anniversary of its grant to the extent that the applicable performance condition has been satisfied. The extent to which performance share awards granted vest is normally partly subject to the Company’s total shareholder return performance relative to a comparator group of companies over a three year period and partly subject to the Company’s adjusted earnings per share growth over three financial years meeting certain specified targets.
Investment in own sharesThe Company holds a number of its ordinary shares in an employee benefit trust. The principal purpose of this trust is to hold shares in the Company for subsequent transfer to certain senior employees and executive directors relating to options granted and awards made in respect of market purchase shares under the LTIP and the Deferred Annual Share Bonus Scheme (‘DASBS’). Details of such plans are set out above and in the Directors’ remuneration report. The assets, liabilities and expenditure of the trust have been incorporated in the consolidated financial statements. Finance costs and administration charges are included in the income statement on an accruals basis. At 31 December 2014 the trust held 6,527,329 (2013: 6,895,539) shares, upon which dividends have been waived, with an aggregate nominal value of £2.1m (2013: £2.2m) and market value of £115.1m (2013: £100.0m).
IFRS 2 disclosuresOptions granted during the year have been valued using a stochastic model. The fair value per option granted during the year and the assumptions used in the calculations are as follows:
2014 2013
Grant date 27.02.14–06.10.14 28.02.13–07.10.13Share price at grant date (£) 15.69–16.46 12.61–13.61Exercise price (£) nil–16.41 nil–13.75Options granted during the year (shares) 3,367,183 3,569,284Vesting period (years) 3–5 3–5Expected volatility (%) 16–21 18–22Option life (years) 3–10 3–10Expected life (years) 3.0–6.0 3.0–6.1Risk free rate of return (%) 1.1–1.8 0.3–2.0Expected dividends expressed as a dividend yield (%) 1.9–2.1 2.0–2.2Fair value per option (£) 1.88–4.85 1.43–3.29
The expected volatility is based on historical volatility over the last three to seven years. The expected life is the average expected period to exercise. The risk free rate of return is the yield on zero coupon UK government bonds of a term consistent with the assumed option life.
The weighted average share price for options exercised by employees of the Company and its subsidiaries during the year was £16.43 (2013: £13.24). The total charge for the year relating to share based payments was £7.9m (2013: £6.2m). After tax the total charge was £5.3m (2013: £3.7m).
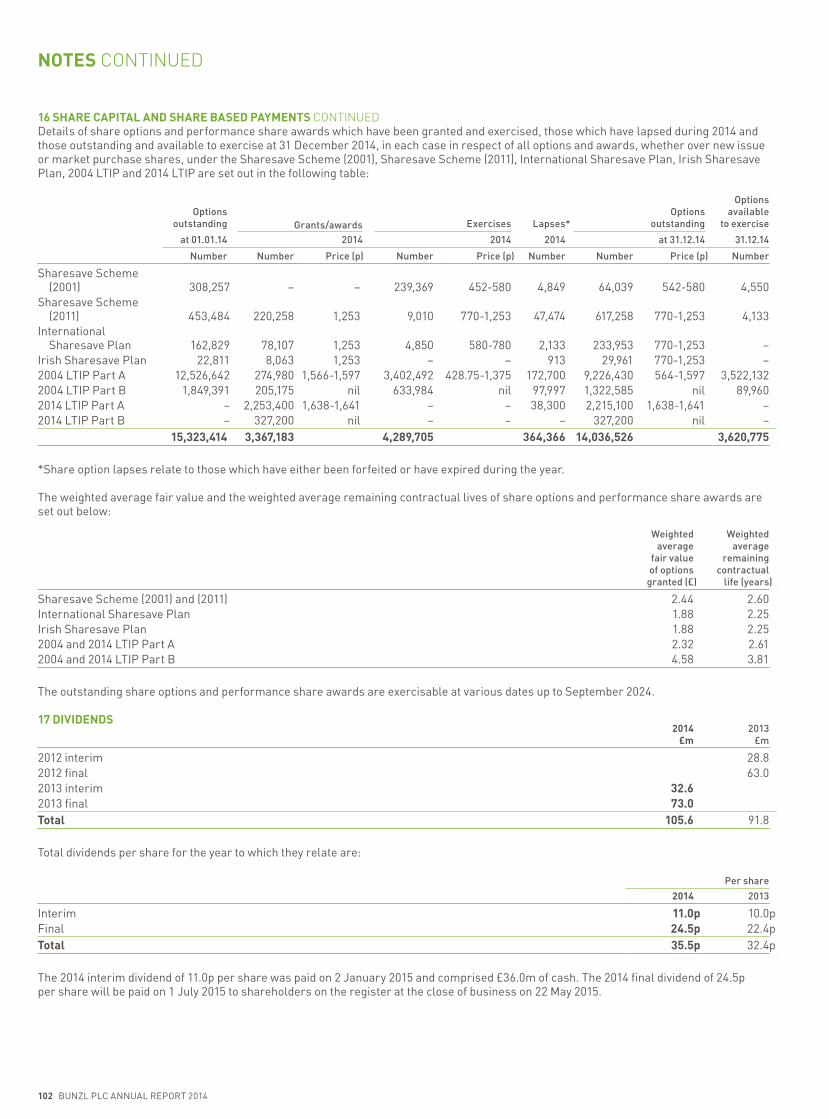
102 BUNZL PLC ANNUAL REPORT 2014
NOTES CONTINUED
16 SHARE CAPITAL AND SHARE BASED PAYMENTS CONTINUEDDetails of share options and performance share awards which have been granted and exercised, those which have lapsed during 2014 and those outstanding and available to exercise at 31 December 2014, in each case in respect of all options and awards, whether over new issue or market purchase shares, under the Sharesave Scheme (2001), Sharesave Scheme (2011), International Sharesave Plan, Irish Sharesave Plan, 2004 LTIP and 2014 LTIP are set out in the following table:
Options outstanding Grants/awards Exercises Lapses*
Options outstanding
Options available
to exercise
at 01.01.14 2014 2014 2014 at 31.12.14 31.12.14
Number Number Price (p) Number Price (p) Number Number Price (p) Number
Sharesave Scheme (2001) 308,257 – – 239,369 452-580 4,849 64,039 542-580 4,550
Sharesave Scheme (2011) 453,484 220,258 1,253 9,010 770-1,253 47,474 617,258 770-1,253 4,133
International Sharesave Plan 162,829 78,107 1,253 4,850 580-780 2,133 233,953 770-1,253 –
Irish Sharesave Plan 22,811 8,063 1,253 – – 913 29,961 770-1,253 –2004 LTIP Part A 12,526,642 274,980 1,566-1,597 3,402,492 428.75-1,375 172,700 9,226,430 564-1,597 3,522,1322004 LTIP Part B 1,849,391 205,175 nil 633,984 nil 97,997 1,322,585 nil 89,960 2014 LTIP Part A – 2,253,400 1,638-1,641 – – 38,300 2,215,100 1,638-1,641 –2014 LTIP Part B – 327,200 nil – – – 327,200 nil –
15,323,414 3,367,183 4,289,705 364,366 14,036,526 3,620,775
*Share option lapses relate to those which have either been forfeited or have expired during the year.
The weighted average fair value and the weighted average remaining contractual lives of share options and performance share awards are set out below:
Weighted average
fair value of options
granted (£)
Weighted average
remaining contractual
life (years)
Sharesave Scheme (2001) and (2011) 2.44 2.60International Sharesave Plan 1.88 2.25Irish Sharesave Plan 1.88 2.252004 and 2014 LTIP Part A 2.32 2.612004 and 2014 LTIP Part B 4.58 3.81
The outstanding share options and performance share awards are exercis able at various dates up to September 2024.
17 DIVIDENDS 2014
£m2013
£m
2012 interim 28.82012 final 63.02013 interim 32.62013 final 73.0Total 105.6 91.8
Total dividends per share for the year to which they relate are:
Per share
2014 2013
Interim 11.0p 10.0pFinal 24.5p 22.4pTotal 35.5p 32.4p
The 2014 interim dividend of 11.0p per share was paid on 2 January 2015 and comprised £36.0m of cash. The 2014 final dividend of 24.5p per share will be paid on 1 July 2015 to shareholders on the register at the close of business on 22 May 2015.

BUNZL PLC ANNUAL REPORT 2014 103
18 CONTINGENT LIABILITIES2014
£m2013
£m
Bank guarantees 0.4 0.4
19 DIRECTORS’ ORDINARY SHARE INTERESTSThe interests of the directors, and their connected persons, in the share capital of the Company at 31 December were:
2014 2013
Philip Rogerson 10,000 10,000Michael Roney 312,263 312,263Patrick Larmon 121,216 117,838Peter Johnson 6,630 6,630Brian May 105,240 105,240David Sleath 4,000 4,000Eugenia Ulasewicz 4,000 4,000Jean-Charles Pauze 2,500 2,500Meinie Oldersma 2,500 2,500
568,349 564,971
Details of directors’ options over ordinary shares and awards made under the 2004 LTIP, 2014 LTIP, Sharesave Scheme (2001), Sharesave Scheme (2011) and DASBS are set out in the Directors’ remuneration report. Since 31 December 2014 Patrick Larmon has acquired interests in 603 ordinary shares as a result of his election to participate in the dividend reinvestment plan in respect of the interim dividend which was paid on 2 January 2015 and he has also acquired an interest in 280 ordinary shares pursuant to the Company’s US Employee Stock Purchase Plan. No other changes to the directors’ ordinary share interests shown in this Note and the Directors’ remuneration report have taken place between 31 December 2014 and 23 February 2015.
20 RETIREMENT BENEFIT OBLIGATIONS The Group operates a number of retirement benefit schemes in the UK, the US and other countries including both defined benefit and defined contribution schemes. The funds of the principal defined benefit schemes are administered by trustees and are held independently from the Group. Pension costs of defined benefit schemes are assessed in accordance with the advice of independent professionally qualified actuaries. Full triennial actuarial valuations were last carried out on the UK defined benefit schemes in April 2012 and annual actuarial valuations are performed on the principal US defined benefit schemes. The valuation of the UK defined benefit schemes has been updated to 31 December 2014 by the Group’s actuaries. Contributions to all schemes are determined in line with actuarial advice and local conditions and practices. Scheme assets for the purpose of IAS 19 are stated at their bid value.
CharacteristicsEuropeThe Group operates a number of defined benefit pension schemes in Europe including the UK, France, the Netherlands and the Republic of Ireland. The Group’s principal defined benefit scheme in Europe is the UK scheme. The UK defined benefit scheme is a contributory defined benefit pension scheme providing benefits based on final pensionable pay. The scheme has been closed to new members since 2003.
The UK scheme is an HMRC registered pension scheme and is subject to standard UK pensions and tax law. This means that the payment of contributions and benefits are subject to the appropriate tax treatments and restrictions and the scheme is subject to the scheme funding requirements outlined in section 224 of the Pensions Act 2004.
In accordance with UK trust and pensions law, the pension scheme has a corporate trustee. Although the Company bears the financial cost of the scheme, the responsibility for the management and governance of the scheme lies with the trustee, which has a duty to act in the best interest of members at all times. The assets of the scheme are held in trust by the trustee who consults with the Company on investment strategy decisions.
A de-risking strategy has been agreed for the scheme to reduce the mismatch between the assets and liabilities, whereby investments are switched from return seeking assets to liability matching assets as the funding improves, based on pre-agreed triggers.
The last triennial review was carried out by a qualified actuary as at 5 April 2012 and showed that there was a deficit on the agreed funding basis. To address the deficit, the Company has agreed to contribute an additional £5.5m per year from April 2013 to March 2019.
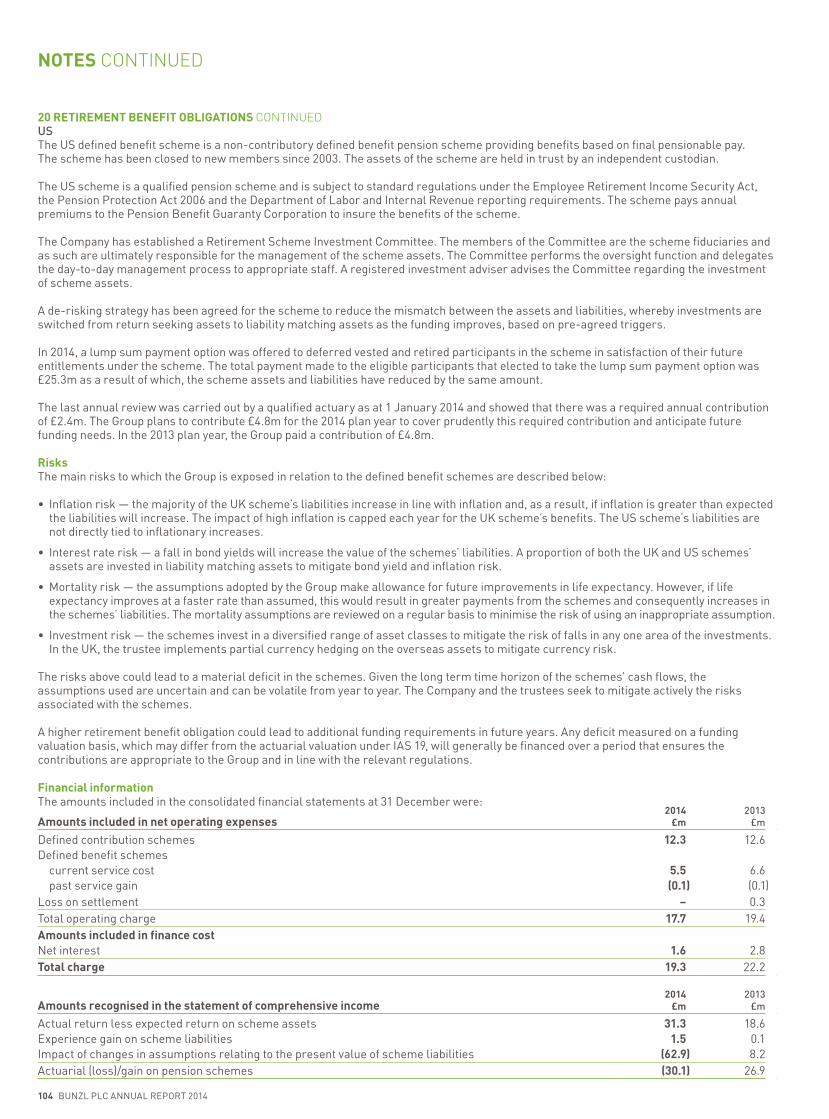
104 BUNZL PLC ANNUAL REPORT 2014
NOTES CONTINUED
20 RETIREMENT BENEFIT OBLIGATIONS CONTINUEDUSThe US defined benefit scheme is a non-contributory defined benefit pension scheme providing benefits based on final pensionable pay. The scheme has been closed to new members since 2003. The assets of the scheme are held in trust by an independent custodian.
The US scheme is a qualified pension scheme and is subject to standard regulations under the Employee Retirement Income Security Act, the Pension Protection Act 2006 and the Department of Labor and Internal Revenue reporting requirements. The scheme pays annual premiums to the Pension Benefit Guaranty Corporation to insure the benefits of the scheme.
The Company has established a Retirement Scheme Investment Committee. The members of the Committee are the scheme fiduciaries and as such are ultimately responsible for the management of the scheme assets. The Committee performs the oversight function and delegates the day-to-day management process to appropriate staff. A registered investment adviser advises the Committee regarding the investment of scheme assets.
A de-risking strategy has been agreed for the scheme to reduce the mismatch between the assets and liabilities, whereby investments are switched from return seeking assets to liability matching assets as the funding improves, based on pre-agreed triggers.
In 2014, a lump sum payment option was offered to deferred vested and retired participants in the scheme in satisfaction of their future entitlements under the scheme. The total payment made to the eligible participants that elected to take the lump sum payment option was £25.3m as a result of which, the scheme assets and liabilities have reduced by the same amount.
The last annual review was carried out by a qualified actuary as at 1 January 2014 and showed that there was a required annual contribution of £2.4m. The Group plans to contribute £4.8m for the 2014 plan year to cover prudently this required contribution and anticipate future funding needs. In the 2013 plan year, the Group paid a contribution of £4.8m.
RisksThe main risks to which the Group is exposed in relation to the defined benefit schemes are described below:
• Inflation risk — the majority of the UK scheme’s liabilities increase in line with inflation and, as a result, if inflation is greater than expected the liabilities will increase. The impact of high inflation is capped each year for the UK scheme’s benefits. The US scheme‘s liabilities are not directly tied to inflationary increases.
• Interest rate risk — a fall in bond yields will increase the value of the schemes’ liabilities. A proportion of both the UK and US schemes’ assets are invested in liability matching assets to mitigate bond yield and inflation risk.
• Mortality risk — the assumptions adopted by the Group make allowance for future improvements in life expectancy. However, if life expectancy improves at a faster rate than assumed, this would result in greater payments from the schemes and consequently increases in the schemes’ liabilities. The mortality assumptions are reviewed on a regular basis to minimise the risk of using an inappropriate assumption.
• Investment risk — the schemes invest in a diversified range of asset classes to mitigate the risk of falls in any one area of the investments. In the UK, the trustee implements partial currency hedging on the overseas assets to mitigate currency risk.
The risks above could lead to a material deficit in the schemes. Given the long term time horizon of the schemes’ cash flows, the assumptions used are uncertain and can be volatile from year to year. The Company and the trustees seek to mitigate actively the risks associated with the schemes.
A higher retirement benefit obligation could lead to additional funding requirements in future years. Any deficit measured on a funding valuation basis, which may differ from the actuarial valuation under IAS 19, will generally be financed over a period that ensures the contributions are appropriate to the Group and in line with the relevant regulations.
Financial informationThe amounts included in the consolidated financial statements at 31 December were:
Amounts included in net operating expenses2014
£m2013
£m
Defined contribution schemes 12.3 12.6Defined benefit schemes current service cost 5.5 6.6 past service gain (0.1) (0.1)Loss on settlement – 0.3Total operating charge 17.7 19.4Amounts included in finance costNet interest 1.6 2.8Total charge 19.3 22.2
Amounts recognised in the statement of comprehensive income 2014
£m 2013
£m
Actual return less expected return on scheme assets 31.3 18.6Experience gain on scheme liabilities 1.5 0.1Impact of changes in assumptions relating to the present value of scheme liabilities (62.9) 8.2Actuarial (loss)/gain on pension schemes (30.1) 26.9

BUNZL PLC ANNUAL REPORT 2014 105
20 RETIREMENT BENEFIT OBLIGATIONS CONTINUEDThe cumulative amount of actuarial losses arising since 1 January 2004 recognised in the statement of comprehensive income at 31 December 2014 was £114.1m (2013: £84.0m).
The principal assumptions used by the independent qualified actuaries for the purposes of IAS 19 were:
Europe 2014 2013
Longevity at age 65 for current pensioners (years) 22.6 22.5Longevity at age 65 for future pensioners (years) 24.4 24.3USLongevity at age 65 for current and future pensioners (years) 22.8 20.2
Europe US
2014 2013 2012 2014 2013 2012
Rate of increase in salaries 3.8% 4.1% 3.7% 3.0% 3.0% 3.0%Rate of increase in pensions 3.0% 3.2% 2.9% – – –Discount rate 3.7% 4.6% 4.5% 4.1% 4.9% 4.1%Inflation rate 2.1% 2.4% 2.2% 2.5% 2.5% 2.5%
The assumptions used by the actuaries are the best estimates chosen from a range of possible actuarial assumptions which, due to the timescales covered, may not necessarily be borne out in practice.
The impact on the net pension deficit as at 31 December 2014 of reasonably possible changes to key assumptions was:
Impact of change in inflation rate
Impact of change in discount rate
+0.25%£m
–0.25%£m
+0.25%£m
–0.25%£m
Europe 9.8 (10.5) (14.6) 15.7US (0.1) 0.1 (4.6) 4.9
The market value of scheme assets and the present value of retirement benefit obligations at 31 December were:
Europe2014
US 2014
Total 2014
£m £m £m
Equities 94.5 51.4 145.9Bonds 187.2 27.3 214.5Other 1.7 3.4 5.1Total market value of scheme assets 283.4 82.1 365.5Present value of funded obligations (306.0) (111.8) (417.8)Present value of unfunded obligations (5.8) (12.2) (18.0)Present value of funded and unfunded obligations (311.8) (124.0) (435.8)Deficit (28.4) (41.9) (70.3)Deferred tax 6.4 16.0 22.4Net deficit (22.0) (25.9) (47.9)
Europe US Total2013 2013 2013
£m £m £m
Equities 89.7 57.8 147.5Bonds 150.5 31.4 181.9Other 1.4 4.8 6.2 Total market value of scheme assets 241.6 94.0 335.6 Present value of funded obligations (258.8) (106.7) (365.5)Present value of unfunded obligations (5.4) (9.7) (15.1) Present value of funded and unfunded obligations (264.2) (116.4) (380.6) Deficit (22.6) (22.4) (45.0)Deferred tax 6.8 7.6 14.4Net deficit (15.8) (14.8) (30.6)

106 BUNZL PLC ANNUAL REPORT 2014
NOTES CONTINUED
20 RETIREMENT BENEFIT OBLIGATIONS CONTINUED
Five year summary2014
£m2013
£m2012
£m2011
£m2010
£m
Total market value of scheme assets 365.5 335.6 303.8 272.3 258.0Present value of funded and unfunded obligations (435.8) (380.6) (379.4) (346.7) (310.5)Unrecognised past service cost – – 0.1 0.1 0.2Deficit (70.3) (45.0) (75.5) (74.3) (52.3)
Experience adjustments arising on scheme liabilities (1.5) (0.2) (4.7) 0.4 1.2
Movement in deficit2014
£m2013
£m
Beginning of year (45.0) (75.5)Current service cost (5.5) (6.6)Past service gain 0.1 0.1Contributions 13.5 14.1Net interest (1.6) (2.8)Actuarial (loss)/gain (30.1) 26.9Loss on settlement – (0.3)Currency and other movements (1.7) (0.9)End of year (70.3) (45.0)
Changes in the present value of defined benefit obligations2014
£m2013
£m
Beginning of year 380.6 379.4Current service cost 5.5 6.6Past service gain (0.1) (0.1)Interest costs 17.4 16.4Contributions by employees 0.7 0.8Settlement payments (25.3) (0.6)Actuarial loss/(gain) 61.4 (8.3)Benefits paid (10.2) (12.6)Loss on settlement – 0.3Currency translation 5.8 (1.3)End of year 435.8 380.6
Changes in the fair value of scheme assets £m £m
Beginning of year 335.6 303.8Interest income 15.8 13.6Actuarial gain 31.3 18.6Contributions by employer 13.5 14.1Contributions by employees 0.7 0.8Settlement payments (25.3) (0.6)Benefits paid (10.2) (12.6)Currency translation 4.1 (2.1)End of year 365.5 335.6
The actual return on scheme assets was £47.1m (2013: £32.2m).
The Group expects to pay approximately £14.4m (expected as of 2013: £14.1m) in contributions to the defined benefit pension schemes in the year ending 31 December 2015.
The weighted average duration of the defined benefit obligations at 31 December 2014 was approximately 21.0 years (2013: 19.8 years) for Europe and 15.0 years (2013: 13.5 years) for the US.
The total retirement benefit obligations are divided between active (£172.8m (2013: £135.0m)), deferred members (£134.2m (2013: £121.0m)) and pensioners (£128.8m (2013: £124.6m)).

BUNZL PLC ANNUAL REPORT 2014 107
21 DIRECTORS AND EMPLOYEES
Average number of employees 2014 2013
North America 5,194 4,756Continental Europe 3,472 3,408UK & Ireland 3,569 3,456Rest of the World 2,322 2,005
14,557 13,625Corporate 52 50
14,609 13,675
Employee costs 2014
£m 2013
£m
Wages and salaries 508.4 483.8Social security costs 60.7 60.8Retirement benefit obligation costs 17.7 19.4Share based payments 7.9 6.2
594.7 570.2
In addition to the above, acquisition related costs for the year ended 31 December 2014 include deferred consideration payments of £21.0m (2013: £22.0m) relating to the retention of former owners of businesses acquired.
Key management remuneration2014
£m2013
£m
Salaries and short term employee benefits 5.9 5.9Share based payments 1.9 1.9Post employment benefits 0.9 1.0
8.7 8.8
The Group considers key management personnel as defined in IAS 24 ‘Related Party Disclosures’ to be the directors of the Company and those members of the Executive Committee and the Managing Directors of the major geographic regions who are not directors of the Company.
Directors’ emoluments 2014
£m 2013
£m
Non-executive directors 0.7 0.7Executive directors: remuneration excluding performance related elements 2.4 2.4 annual bonus 1.8 1.9
4.9 5.0
More detailed information concerning directors’ emoluments and long term incentives is set out in the Directors’ remuneration report. The aggregate amount of gains made by directors on the exercise of share options during the year was £5.5m (2013: £2.5m). The aggregate market value of performance share awards exercised by directors under long term incentive schemes during the year was £3.6m (2013: £2.0m). The aggregate market value of shares exercised by directors under the DASBS was £1.5m (2013: £0.9m).
22 LEASE COMMITMENTSThe Group leases certain property, plant and equipment under non-cancellable operating lease agreements. These leases have varying terms and renewal rights. At 31 December the total future minimum lease payments under non-cancellable operating leases for each of the following periods were:
Land & buildings
2014 £m
Other 2014
£m
Land & buildings
2013 £m
Other 2013
£m
Within one year 62.4 22.8 53.2 21.0Between one and five years 152.9 35.4 139.9 33.3After five years 56.6 1.9 65.0 1.9
271.9 60.1 258.1 56.2
Total of future minimum sublease income under non-cancellable subleases (0.2) – (0.2) –
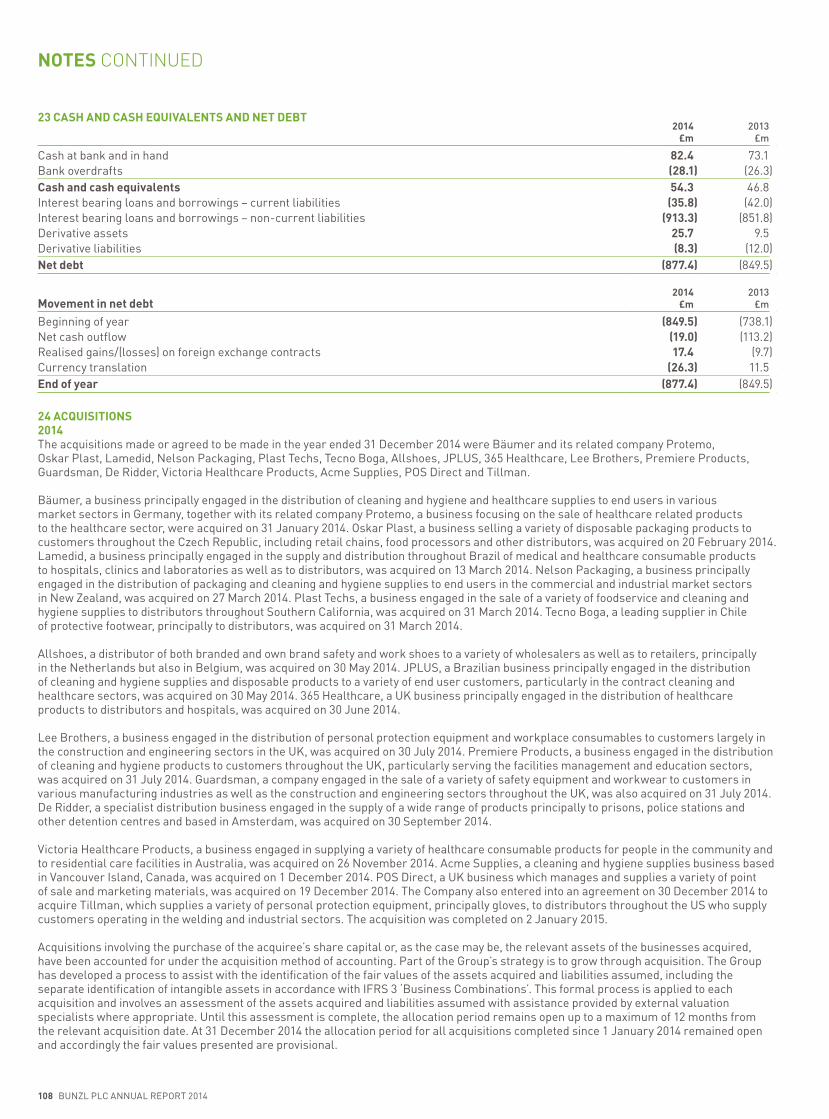
108 BUNZL PLC ANNUAL REPORT 2014
NOTES CONTINUED
23 CASH AND CASH EQUIVALENTS AND NET DEBT2014
£m2013
£m
Cash at bank and in hand 82.4 73.1Bank overdrafts (28.1) (26.3)Cash and cash equivalents 54.3 46.8Interest bearing loans and borrowings – current liabilities (35.8) (42.0)Interest bearing loans and borrowings – non-current liabilities (913.3) (851.8)Derivative assets 25.7 9.5Derivative liabilities (8.3) (12.0)Net debt (877.4) (849.5)
Movement in net debt2014
£m2013
£m
Beginning of year (849.5) (738.1)Net cash outflow (19.0) (113.2)Realised gains/(losses) on foreign exchange contracts 17.4 (9.7)Currency translation (26.3) 11.5End of year (877.4) (849.5)
24 ACQUISITIONS 2014The acquisitions made or agreed to be made in the year ended 31 December 2014 were Bäumer and its related company Protemo, Oskar Plast, Lamedid, Nelson Packaging, Plast Techs, Tecno Boga, Allshoes, JPLUS, 365 Healthcare, Lee Brothers, Premiere Products, Guardsman, De Ridder, Victoria Healthcare Products, Acme Supplies, POS Direct and Tillman.
Bäumer, a business principally engaged in the distribution of cleaning and hygiene and healthcare supplies to end users in various market sectors in Germany, together with its related company Protemo, a business focusing on the sale of healthcare related products to the healthcare sector, were acquired on 31 January 2014. Oskar Plast, a business selling a variety of disposable packaging products to customers throughout the Czech Republic, including retail chains, food processors and other distributors, was acquired on 20 February 2014. Lamedid, a business principally engaged in the supply and distribution throughout Brazil of medical and healthcare consumable products to hospitals, clinics and laboratories as well as to distributors, was acquired on 13 March 2014. Nelson Packaging, a business principally engaged in the distribution of packaging and cleaning and hygiene supplies to end users in the commercial and industrial market sectors in New Zealand, was acquired on 27 March 2014. Plast Techs, a business engaged in the sale of a variety of foodservice and cleaning and hygiene supplies to distributors throughout Southern California, was acquired on 31 March 2014. Tecno Boga, a leading supplier in Chile of protective footwear, principally to distributors, was acquired on 31 March 2014.
Allshoes, a distributor of both branded and own brand safety and work shoes to a variety of wholesalers as well as to retailers, principally in the Netherlands but also in Belgium, was acquired on 30 May 2014. JPLUS, a Brazilian business principally engaged in the distribution of cleaning and hygiene supplies and disposable products to a variety of end user customers, particularly in the contract cleaning and healthcare sectors, was acquired on 30 May 2014. 365 Healthcare, a UK business principally engaged in the distribution of healthcare products to distributors and hospitals, was acquired on 30 June 2014.
Lee Brothers, a business engaged in the distribution of personal protection equipment and workplace consumables to customers largely in the construction and engineering sectors in the UK, was acquired on 30 July 2014. Premiere Products, a business engaged in the distribution of cleaning and hygiene products to customers throughout the UK, particularly serving the facilities management and education sectors, was acquired on 31 July 2014. Guardsman, a company engaged in the sale of a variety of safety equipment and workwear to customers in various manufacturing industries as well as the construction and engineering sectors throughout the UK, was also acquired on 31 July 2014. De Ridder, a specialist distribution business engaged in the supply of a wide range of products principally to prisons, police stations and other detention centres and based in Amsterdam, was acquired on 30 September 2014.
Victoria Healthcare Products, a business engaged in supplying a variety of healthcare consumable products for people in the community and to residential care facilities in Australia, was acquired on 26 November 2014. Acme Supplies, a cleaning and hygiene supplies business based in Vancouver Island, Canada, was acquired on 1 December 2014. POS Direct, a UK business which manages and supplies a variety of point of sale and marketing materials, was acquired on 19 December 2014. The Company also entered into an agreement on 30 December 2014 to acquire Tillman, which supplies a variety of personal protection equipment, principally gloves, to distributors throughout the US who supply customers operating in the welding and industrial sectors. The acquisition was completed on 2 January 2015.
Acquisitions involving the purchase of the acquiree’s share capital or, as the case may be, the relevant assets of the businesses acquired, have been accounted for under the acquisition method of accounting. Part of the Group’s strategy is to grow through acquisition. The Group has developed a process to assist with the identification of the fair values of the assets acquired and liabilities assumed, including the separate identification of intangible assets in accordance with IFRS 3 ‘Business Combinations’. This formal process is applied to each acquisition and involves an assessment of the assets acquired and liabilities assumed with assistance provided by external valuation specialists where appropriate. Until this assessment is complete, the allocation period remains open up to a maximum of 12 months from the relevant acquisition date. At 31 December 2014 the allocation period for all acquisitions completed since 1 January 2014 remained open and accordingly the fair values presented are provisional.

BUNZL PLC ANNUAL REPORT 2014 109
24 ACQUISITIONS CONTINUEDAdjustments are made to the assets acquired and liabilities assumed during the allocation period to the extent that further information and knowledge come to light that more accurately reflect conditions at the acquisition date. To date the adjustments made have impacted assets acquired to reflect more accurately the estimated realisable or settlement value. Similarly, adjustments have been made to acquired liabilities to record onerous commitments or other commitments existing at the acquisition date but not recognised by the acquiree. Adjustments have also been made to reflect the associated tax effects.
The consideration paid or payable in respect of acquisitions comprises amounts paid on completion, deferred consideration and payments which are contingent on the retention of former owners of businesses acquired. IFRS 3 requires that any payments that are contingent on future employment, including payments which are contingent on the retention of former owners of businesses acquired, are charged to the income statement. All other consideration has been allocated against the identified net assets, with the balance recorded as goodwill. Transaction costs and expenses such as professional fees are charged to the income statement. The acquisitions provide opportunities for further development of the Group’s activities and create enhanced returns. Such opportunities and the workforces inherent in each of the acquired businesses do not translate to separately identifiable intangible assets but do represent much of the assessed value that supports the recognised goodwill.
A summary of the effect of acquisitions completed in 2014 is detailed below:
Provisional fair value of assets acquired £m
Intangible assets 76.0Property, plant and equipment 1.9Inventories 13.9Trade and other receivables 25.8Trade and other payables (15.2)Net bank overdrafts (8.9)Provisions for liabilities and charges (2.2)Tax and deferred tax (14.4)
76.9Goodwill 36.2Consideration 113.1
Satisfied by: cash consideration 107.1 deferred consideration 6.0
113.1Contingent payments relating to retention of former owners 19.1Net bank overdrafts acquired 8.9Transaction costs and expenses 4.1Total committed spend in respect of acquisitions completed in the current year 145.2Spend on acquisition committed as at 31 December 2014 65.8Total committed spend in respect of acquisitions agreed in the current year 211.0
The net cash outflow in the year in respect of acquisitions comprised:Cash consideration 107.1Net bank overdrafts acquired 8.9Deferred consideration in respect of prior year acquisitions 38.1Net cash outflow in respect of acquisitions 154.1Acquisition related costs 14.0Total cash outflow in respect of acquisitions 168.1

110 BUNZL PLC ANNUAL REPORT 2014
NOTES CONTINUED
24 ACQUISITIONS CONTINUEDCash flow on acquisition related costs relates to £3.5m (2013: £9.6m) of transaction costs paid and £10.5m (2013: £16.5m) of payments relating to retention of former owners.
Acquisitions made in the year ended 31 December 2014 contributed £90.6m to the Group’s revenue and £10.2m to the Group’s adjusted operating profit for the year ended 31 December 2014.
The estimated contributions of businesses acquired during the year to the results of the Group for the year ended 31 December 2014 if such acquisitions had been made at the beginning of the year, are as follows:
£m
Revenue 162.7Adjusted operating profit 20.6
The estimated revenue which would have been contributed by the businesses acquired or agreed to be acquired during the year to the results for the year ended 31 December 2014 if such acquisitions had been made at the beginning of the year is £223.3m.
2013The acquisitions completed in the year ended 31 December 2013 were McNeil Surgical, Vicsa Brasil, Labor Import, MDA, most of the Industrial & Safety division of Jeminex, TFS, Espomega, ProEpta, Wesclean Equipment & Cleaning Supplies, pka Klöcker, De Santis and SAS Safety.
McNeil Surgical, a business principally engaged in the sale of healthcare consumables and equipment to aged care facilities, hospitals and medical centres as well as to distributors throughout South Australia, was acquired on 31 January 2013. Vicsa Brasil, the proposed acquisition of which was agreed in December 2012, was acquired on 19 February 2013. The business is engaged in the sale of personal protection equipment throughout Brazil. Labor Import, which is principally engaged in the supply and distribution of own label medical and healthcare consumable products to distributors as well as to hospitals, clinics, laboratories and care homes throughout Brazil, was acquired on 1 March 2013. MDA, which is engaged in the procurement and fulfilment of promotional products and marketing point of sale materials for a variety of customers in the UK, principally in the food and drinks industries, was acquired on 15 March 2013.
Three businesses which formed part of the Industrial & Safety division of Jeminex in Australia were acquired on 30 April 2013. The workwear and personal safety business distributes an extensive range of specialist personal protection equipment and workwear to the mining, resources, construction and general industrial sectors. The lifting, rigging and height safety business is principally engaged in the supply of lifting chains and ropes, slings and load restraints as well as the provision of accredited testing and repair services. The third business is involved in the supply of industrial packaging products to a variety of customers in different market sectors.
TFS, a business engaged in the procurement and fulfilment of promotional products and marketing point of sale materials for customers in the UK across various market sectors, was acquired on 31 July 2013. Espomega, a business supplying a variety of safety products, including gloves and protective clothing, to distributors throughout Mexico, was acquired on 30 August 2013. ProEpta, a leading distributor of catering equipment throughout Mexico, principally to luxury hotels and restaurants, was acquired on 27 September 2013.
Wesclean, a business principally engaged in the distribution of cleaning and hygiene equipment and supplies to a variety of customer markets throughout Western Canada, was acquired on 1 November 2013. pka Klöcker, a business based in Germany engaged in the sale to distributors of personal protection equipment, principally own label workwear, was acquired on 29 November 2013. De Santis, a business based in Brazil and principally engaged in the sale of personal protection equipment to end user customers in a number of different market sectors, was acquired on 20 December 2013. SAS Safety, a business specialising in the sourcing and sale of a variety of own label personal protection equipment, principally safety gloves, to distributors in the US was acquired on 23 December 2013.

BUNZL PLC ANNUAL REPORT 2014 111
24 ACQUISITIONS CONTINUEDA summary of the effect of the 2013 acquisitions is detailed below:
Fair value of assets acquired
Fair valueof assets acquired
£m
Intangible assets 111.1 Property, plant and equipment 9.6Inventories 51.2Trade and other receivables 50.3Trade and other payables (38.0)Net bank overdrafts (7.5)Provisions for liabilities and charges (4.4)Tax and deferred tax (13.2)
159.1Goodwill 97.4Consideration 256.5
Satisfied by: cash consideration 223.8 deferred consideration 32.7
256.5Contingent payments relating to retention of former owners 32.4Net bank overdrafts acquired 7.5Transaction costs and expenses 8.4 Total committed spend in respect of acquisitions completed in the current year 304.8Spend on acquisition committed as at 31 December 2012 (9.7) Total committed spend in respect of acquisitions agreed in the current year 295.1
The net cash outflow in the year in respect of acquisitions comprised:
Cash consideration 223.8Net bank overdrafts acquired 7.5Deferred consideration in respect of prior year acquisitions 22.5 Net cash outflow in respect of acquisitions 253.8Acquisition related costs 26.1Total cash outflow in respect of acquisitions 279.9
Acquisitions made in the year ended 31 December 2013 contributed £129.5m to the Group’s revenue and £16.5m to the Group’s adjusted operating profit for the year ended 31 December 2013.
The estimated contributions of acquired businesses to the results of the Group for the year ended 31 December 2013 if such acquisitions had been made at the beginning of the year, are as follows:
£m
Revenue 281.1Adjusted operating profit 37.5
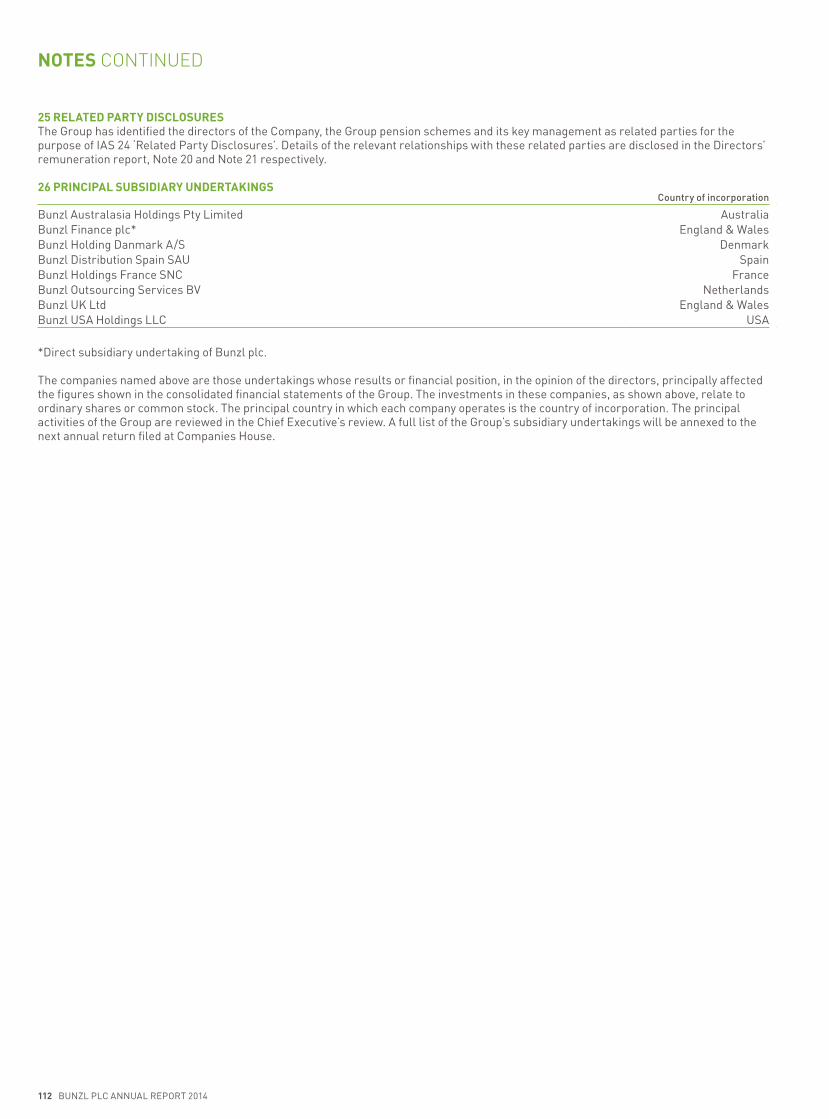
112 BUNZL PLC ANNUAL REPORT 2014
NOTES CONTINUED
25 RELATED PARTY DISCLOSURES The Group has identified the directors of the Company, the Group pension schemes and its key management as related parties for the purpose of IAS 24 ‘Related Party Disclosures’. Details of the relevant relationships with these related parties are disclosed in the Directors’ remuneration report, Note 20 and Note 21 respectively.
26 PRINCIPAL SUBSIDIARY UNDERTAKINGSCountry of incorporation
Bunzl Australasia Holdings Pty Limited AustraliaBunzl Finance plc* England & WalesBunzl Holding Danmark A/S DenmarkBunzl Distribution Spain SAU SpainBunzl Holdings France SNC FranceBunzl Outsourcing Services BV NetherlandsBunzl UK Ltd England & WalesBunzl USA Holdings LLC USA
*Direct subsidiary undertaking of Bunzl plc.
The companies named above are those undertakings whose results or financial position, in the opinion of the directors, principally affected the figures shown in the consolidated financial statements of the Group. The investments in these companies, as shown above, relate to ordinary shares or common stock. The principal country in which each company operates is the country of incorporation. The principal activities of the Group are reviewed in the Chief Executive’s review. A full list of the Group’s subsidiary undertakings will be annexed to the next annual return filed at Companies House.
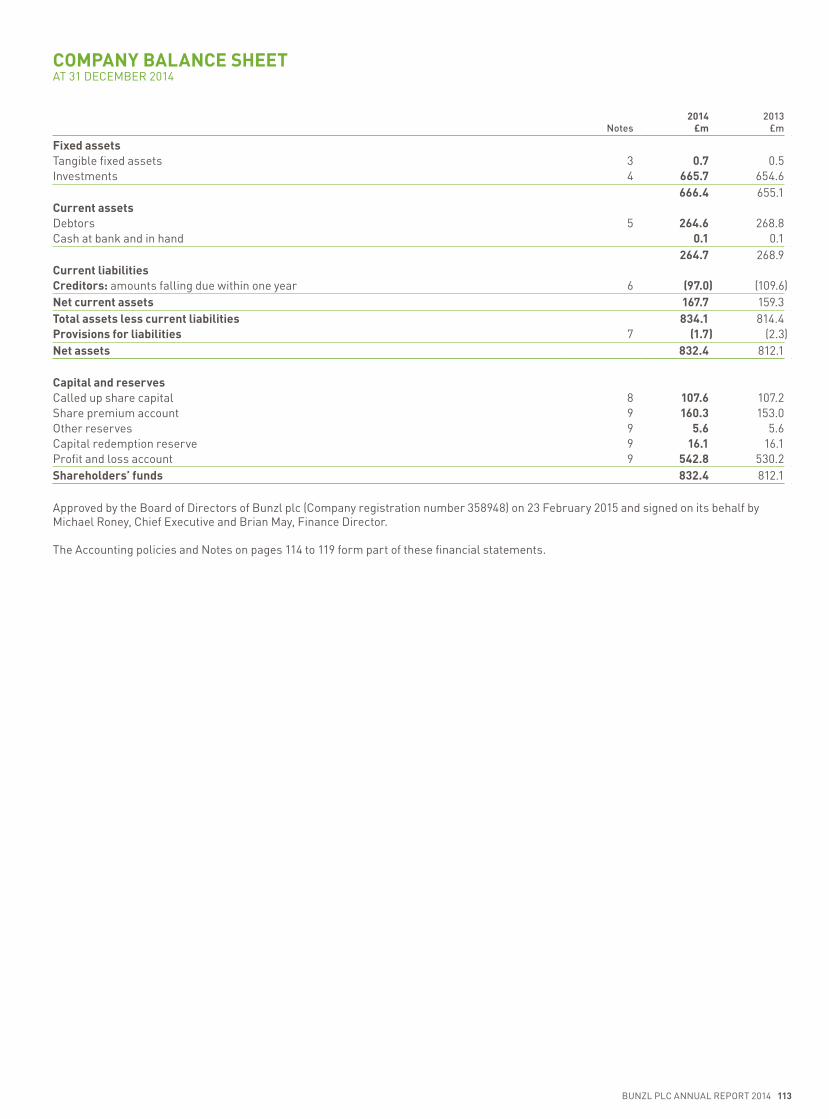
BUNZL PLC ANNUAL REPORT 2014 113
COMPANY BALANCE SHEETAT 31 DECEMBER 2014
Notes2014
£m2013
£m
Fixed assetsTangible fixed assets 3 0.7 0.5Investments 4 665.7 654.6
666.4 655.1Current assetsDebtors 5 264.6 268.8Cash at bank and in hand 0.1 0.1
264.7 268.9Current liabilitiesCreditors: amounts falling due within one year 6 (97.0) (109.6)Net current assets 167.7 159.3Total assets less current liabilities 834.1 814.4Provisions for liabilities 7 (1.7) (2.3)Net assets 832.4 812.1
Capital and reservesCalled up share capital 8 107.6 107.2Share premium account 9 160.3 153.0Other reserves 9 5.6 5.6Capital redemption reserve 9 16.1 16.1Profit and loss account 9 542.8 530.2Shareholders’ funds 832.4 812.1
Approved by the Board of Directors of Bunzl plc (Company registration number 358948) on 23 February 2015 and signed on its behalf by Michael Roney, Chief Executive and Brian May, Finance Director.
The Accounting policies and Notes on pages 114 to 119 form part of these financial statements.
114 BUNZL PLC ANNUAL REPORT 2014
NOTES TO THE COMPANY FINANCIAL STATEMENTS
1 BASIS OF PREPARATIONThe financial statements of Bunzl plc (‘the Company’) have been prepared on a going concern basis and under the historical cost convention and have been prepared in accordance with the Companies Act 2006 and UK Generally Accepted Accounting Practice. Under section 408 of the Companies Act 2006, the Company is exempt from the requirement to present its own profit and loss account.
In accordance with the exemption allowed by paragraph 5 (a) of Financial Reporting Standard (‘FRS’) 1 ‘Cash Flow Statements’, a cash flow statement has not been provided for the Company.
The Financial Reporting Council (‘FRC’) has published four standards which together form the basis of the new financial reporting framework in the UK. Subject to shareholders’ notification, with effect from 1 January 2015, the Company has applied the recognition, measurement and disclosure requirements of EU endorsed International Financial Reporting Standards (‘IFRS’) with disclosure exemptions permitted by FRS 101 ‘Reduced Disclosure Framework’.
The following accounting policies have been applied consistently in dealing with items which are considered material in relation to the Company’s financial statements.
2 ACCOUNTING POLICIESa Investments in subsidiary undertakingsInvestments in subsidiary undertakings are held at cost less any provisions for impairment.
b Investment in own sharesThe cost of shares held either directly (treasury shares) or indirectly (employee benefit trust shares) is deducted from equity. Repurchased shares are classified as treasury shares and are presented as a deduction from total equity. When treasury shares are subsequently sold or reissued, the amount received is recognised as an increase in equity and the resulting surplus or deficit on the transaction is recognised in retained earnings.
c Share based paymentsThe Company operates equity settled share based compensation plans for which the total expected expense is based on the fair value of options and other share based incentives on the grant date, calculated using a valuation model, and is spread over the expected vesting period with a corresponding credit to equity. The amount recognised as an expense is adjusted to reflect the number of options that are expected to vest. Details of the relevant plans are outlined in Note 16 to the consolidated financial statements. Where the Company grants options over its own shares to the employees of its subsidiaries these awards are accounted for by the Company as an additional investment in the relevant subsidiary equivalent to the equity settled share based payment charge recognised in the consolidated financial statements with the corresponding credit recognised directly in equity. Any payment made by the subsidiaries in respect of these arrangements is treated as a return of this investment. These costs are determined in accordance with FRS 20 ‘Share-based Payment’.
d Tangible fixed assetsAll tangible fixed assets are included at historical cost, less accumulated depreciation. The profit or loss on sale of tangible fixed assets is calculated by reference to the carrying values of the assets. The carrying values of tangible fixed assets are periodically reviewed for impairment when events or changes in circumstances indicate that the carrying values may not be recoverable.
e DepreciationDepreciation is provided on a straight line basis to write off cost less estimated residual value over the assets’ estimated remaining useful lives. This is applied at the following annual rates:
Buildings 2% (or depreciated over life of lease if shorter than 50 years)Fixtures, fittings and equipment 10%–33%
The assets’ residual values, useful lives and depreciation methods are reviewed, and adjusted if appropriate, at each balance sheet date.
f LeasesOperating lease rentals and any incentives receivable are recognised in the income statement on a straight line basis over the term of the relevant lease. Leases in which the Company assumes substantially all the risks and rewards of ownership of the leased assets are classified as finance leases. Where land and buildings are held under leases, the accounting treatment of the land is considered separately from that of the buildings due to the indefinite life of land.

BUNZL PLC ANNUAL REPORT 2014 115
2 ACCOUNTING POLICIES CONTINUED g TaxThe charge for tax is based on the profit or loss for the year and takes into account tax deferred due to timing differences between the treatment of certain items for tax and accounting purposes. Deferred tax is recognised in respect of all timing differences between the treatment of certain items for tax and accounting purposes which have arisen but not reversed by the balance sheet date, except as otherwise required by FRS 19 ‘Deferred Tax’.
h Retirement benefit obligationsThe Company participates in a Group UK defined benefit scheme providing benefits based on final pensionable pay. As the Company is unable to identify its share of scheme assets and liabilities on a consistent and reasonable basis, the Company treats contributions to the defined benefit scheme as if they were contributions to a defined contribution scheme in accordance with the exemptions permitted by FRS 17 ‘Retirement Benefits’. As a result the amount charged to the profit and loss account represents the contributions payable to the scheme in respect of the relevant accounting period.
i Financial guarantee contractsWhere the Company enters into financial guarantee contracts to guarantee the indebtedness of other companies within the Group, the Company considers these to be insurance arrangements and accounts for them as such. In this respect, the Company treats the guarantee contract as a contingent liability until such time as it becomes probable that the Company will be required to make a payment under the guarantee.
j DividendsThe interim dividend is included in the financial statements in the period in which it is paid and the final dividend in the period in which it is approved by shareholders at the Annual General Meeting.
3 TANGIBLE FIXED ASSETS
Short leasehold
£m
Fixtures, fittings and equipment
£mTotal
£m
Cost Beginning of year 0.5 2.8 3.3Additions – 0.3 0.3Disposals (0.4) (1.5) (1.9)End of year 0.1 1.6 1.7
DepreciationBeginning of year 0.5 2.3 2.8Charge in year – 0.1 0.1Disposals (0.4) (1.5) (1.9)End of year 0.1 0.9 1.0
Net book value at 31 December 2014 – 0.7 0.7Net book value at 31 December 2013 – 0.5 0.5

116 BUNZL PLC ANNUAL REPORT 2014
NOTES TO THE COMPANY FINANCIAL STATEMENTS CONTINUED
4 INVESTMENTS HELD AS FIXED ASSETSInvestments in
subsidiary undertakings
£m
Cost Beginning of year 700.2Additions 11.1Liquidations of dormant companies (5.3)End of year 706.0
Impairment provisionsBeginning of year 45.6Decrease during year (5.3)End of year 40.3
Net book value at 31 December 2014 665.7Net book value at 31 December 2013 654.6
The principal companies in which the Company’s interest at 31 December 2014 is more than 20% are as follows:
Country of incorporation
Bunzl Australasia Holdings Pty Limited AustraliaBunzl Finance plc* England & WalesBunzl Holding Danmark A/S DenmarkBunzl Distribution Spain SAU SpainBunzl Holdings France SNC FranceBunzl Outsourcing Services BV NetherlandsBunzl UK Ltd England & WalesBunzl USA Holdings LLC USA
*Direct subsidiary undertaking of Bunzl plc.
5 DEBTORS 2014
£m 2013
£m
Amounts owed by Group undertakings 262.9 261.1Prepayments and other debtors 1.2 1.1Corporation tax 0.4 6.4Deferred tax 0.1 0.2
264.6 268.8

BUNZL PLC ANNUAL REPORT 2014 117
6 CREDITORS: AMOUNTS FALLING DUE WITHIN ONE YEAR2014
£m2013
£m
Trade creditors 0.5 0.2Amounts owed to Group undertakings 85.8 101.1Other tax and social security contributions 1.6 1.6Accruals and deferred income 9.1 6.7
97.0 109.6
7 PROVISIONS2014
£m2013
£m
Beginning of year 2.3 2.7Utilised or released (0.6) (0.4)End of year 1.7 2.3
The provisions relate to properties, where amounts are held against liabilities for onerous lease commitments, repairs and dilapidations and other claims.
8 SHARE CAPITAL AND SHARE BASED PAYMENTS 2014
£m 2013
£m
Issued and fully paid ordinary shares of 321⁄7p each 107.6 107.2
Number of ordinary shares in issue and fully paidBeginning of year 333,515,233 355,420,634Cancelled – treasury shares – (23,325,000)Issued – option exercises 1,191,643 1,419,599End of year 334,706,876 333,515,233
The Company operates a number of share plans, for the benefit of employees of the Company and its subsidiaries relating to the acquisition of shares in the Company, which are described in Note 16 to the consolidated financial statements.

118 BUNZL PLC ANNUAL REPORT 2014
NOTES TO THE COMPANY FINANCIAL STATEMENTS CONTINUED
8 SHARE CAPITAL AND SHARE BASED PAYMENTS CONTINUED FRS 20 disclosuresOptions granted to employees of the Company during the year have been valued using a stochastic model. The fair value per option granted during the year and the assumptions used in the calculations are as follows:
2014 2013
Grant date 27.02.14–06.10.14 28.02.13–07.10.13Share price at grant date (£) 15.69–16.46 12.61–13.61Exercise price (£) nil–16.41 nil–13.75Options granted during the year (shares) 487,061 525,997Vesting period (years) 3–5 3–5Expected volatility (%) 16–21 18–22Option life (years) 3–10 3–10Expected life (years) 3.0–6.0 3.0–6.1Risk free rate of return (%) 1.1–1.8 0.3–1.8Expected dividends expressed as a dividend yield (%) 2.00–2.08 2.16–2.24Fair value per option (£) 2.23–4.85 1.78–3.29
The expected volatility is based on historical volatility over the last three to seven years. The expected life is the average expected period to exercise. The risk free rate of return is the yield on zero coupon UK government bonds of a term consistent with the assumed option life.
The weighted average share price for options exercised by employees of the Company during the year was £16.36 (2013: £13.33). The total Company charge for the year relating to share based payments was £1.6m (2013: £1.3m).
Details of share options and awards to employees of the Company which have been granted and exercised, those which have lapsed during 2014 and those outstanding and available to exercise at 31 December 2014, in each case in respect of all options and awards, whether over new issue or market purchase shares, under the Sharesave Scheme (2001), Sharesave Scheme (2011), 2004 Long Term Incentive Plan (‘2004 LTIP’) and 2014 Long Term Incentive Plan (‘2014 LTIP’) are set out in the following table:
Options outstanding Grants/awards Exercises Lapses*
Options outstanding
Options available
to exercise
at 01.01.14† 2014 2014 2014 at 31.12.14 31.12.14
Number Number Price (p) Number Price (p) Number Number Price (p) Number
Sharesave Scheme (2001) 26,806 – – 18,410 452-580 – 8,396 542-580 –Sharesave Scheme (2011) 18,115 9,976 1,253 – – – 28,091 770-1,253 –2004 LTIP Part A 1,682,229 108,520 1,566 636,058 585-1,116 30,150 1,124,541 585-1,566 297,2712004 LTIP Part B 834,640 80,265 nil 292,210 – 55,328 567,367 nil –2014 LTIP Part A – 206,500 1,641 – – – 206,500 1,641 –2014 LTIP Part B – 81,800 nil – – – 81,800 nil –
2,561,790 487,061 946,678 85,478 2,016,695 297,271
† Options outstanding at 1 January 2014 have been adjusted to include any options held by individuals whose employment has transferred from a wholly owned subsidiary to the Company during 2014.
*Share option lapses relate to those which have either been forfeited or have expired during the year.
The weighted average fair value and the weighted average remaining contractual lives of share options and performance share awards are set out below:
Weightedaverage
fair valueof options
granted (£)
Weightedaverage
remainingcontractual
life (years)
Sharesave Scheme (2001) and (2011) 2.57 3.372004 and 2014 LTIP Part A 2.30 2.492004 and 2014 LTIP Part B 4.58 2.51
The outstanding options and awards are exercis able at various dates up to September 2024.

BUNZL PLC ANNUAL REPORT 2014 119
9 CAPITAL AND RESERVES
Share capital
£m
Sharepremium
account£m
Otherreserves
£m
Capitalredemption
reserve£m
Profit and loss account
Total£m
Ownshares
£m
Retainedearnings
£m
At 1 January 2014 107.2 153.0 5.6 16.1 (100.0) 630.2 812.1Issue of share capital 0.4 7.3 7.7Employee trust shares (26.7) (26.7)Movement on own share reserves 11.6 (11.6) –Share based payments 12.7 12.7Profit for the year 132.2 132.22013 interim dividend (32.6) (32.6)2013 final dividend (73.0) (73.0)At 31 December 2014 107.6 160.3 5.6 16.1 (115.1) 657.9 832.4
As permitted by section 408 of the Companies Act 2006, the profit and loss account of the Company has not been separately presented in these financial statements.
Included within own shares are ordinary shares of the Company held by the Group in an employee benefit trust. The principal purpose of this trust is to hold shares in the Company for subsequent transfer to certain senior employees and executive directors relating to options granted and awards made in respect of market purchase shares under the 2004 LTIP, the 2014 LTIP and the Deferred Annual Share Bonus Scheme. Details of such plans are set out in Note 16 to the consolidated financial statements and the Directors’ remuneration report. The assets, liabilities and expenditure of the trust have been included in the consolidated financial statements. Finance costs and administration charges are included in the income statement on an accruals basis. At 31 December 2014 the trust held 6,527,329 (2013: 6,895,539) shares, upon which dividends have been waived, with an aggregate nominal value of £2.1m (2013: £2.2m) and market value of £115.1m (2013: £100.0m).
10 RECONCILIATION OF MOVEMENT IN SHAREHOLDERS’ FUNDS2014 2013
£m £m
Profit for the year 132.2 1.1Dividends (105.6) (91.8)
26.6 (90.7)Issue of share capital 7.7 9.6Employee trust shares (26.7) (50.1)Share based payments 12.7 1.3Net increase/(decrease) in shareholders’ funds 20.3 (129.9)Opening shareholders’ funds 812.1 942.0Closing shareholders’ funds 832.4 812.1
The Company had no other recognised gains or losses in the year ended 31 December 2014 or the year ended 31 December 2013.
11 CONTINGENT LIABILITIESBorrowings by subsidiary undertakings totalling £929.7m (2013: £874.3m) which are included in the Group’s borrowings have been guaranteed by the Company.
12 DIRECTORS’ REMUNERATIONThe remuneration of the directors of the Company is disclosed in Note 21 to the consolidated financial statements and the Directors’ remuneration report.
13 EMPLOYEE NUMBERS AND COSTSThe average number of persons employed by the Company (including directors) during the year was 42 (2013: 41).
The aggregate employee costs relating to these persons were:2014 2013
£m £m
Wages and salaries 7.6 7.5Social security costs 2.8 1.6Share based payments 1.6 1.3Pension costs 1.0 1.0
13.0 11.4
14 RELATED PARTY DISCLOSURESThe Company has identified the directors of the Company, the UK pension scheme and its key management as related parties for the purpose of FRS 8 ‘Related Party Disclosures’. Details of the relevant relationships with these related parties are disclosed in the Directors’ remuneration report, Note 20 and Note 21 to the consolidated financial statements respectively.

120 BUNZL PLC ANNUAL REPORT 2014
STATEMENT OF DIRECTORS’ RESPONSIBILITIES
The directors are responsible for preparing the Annual Report and the Group and parent company financial statements in accordance with applicable law and regulations.
Company law requires the directors to prepare Group and parent company financial statements for each financial year. Under that law the directors are required to prepare the Group financial statements in accordance with IFRS as adopted by the EU and applicable law and have elected to prepare the parent company financial statements in accordance with UK GAAP and applicable law.
Under company law the directors must not approve the financial statements unless they are satisfied that they give a true and fair view of the state of affairs of the Group and parent company and of their profit or loss for that period.
In preparing both the Group and parent company financial statements, the directors are required to:
• select suitable accounting policies and then apply them consistently;
• make judgements and estimates that are reasonable and prudent;
• for the Group financial statements, state whether they have been prepared in accordance with IFRS as adopted by the EU;
• for the parent company financial statements, state whether applicable UK GAAP has been followed, subject to any material departures disclosed and explained in the parent company financial statements; and
• prepare the financial statements on the going concern basis unless it is inappropriate to presume that the Group and the parent company will continue in business.
The directors are responsible for keeping adequate accounting records that are sufficient to show and explain the parent company’s transactions and disclose with reasonable accuracy at any time the financial position of the parent company and enable them to ensure that its financial statements comply with the Companies Act 2006 and, as regards the Group financial statements, Article 4 of the IAS Regulation. They have general responsibility for taking such steps as are reasonably open to them to safeguard the assets of the Group and to prevent and detect fraud and other irregularities.
Under applicable law and regulations, the directors are also responsible for preparing a strategic report, directors’ report, Directors’ remuneration report and Corporate governance statement that comply with that law and those regulations.
The directors are responsible for the maintenance and integrity of the corporate and financial information included on the Company’s website.
Legislation in the UK governing the preparation and dissemination of financial statements may differ from legislation in other jurisdictions.
The Annual Report and financial statements comply with the Disclosure and Transparency Rules of the United Kingdom’s Financial Conduct Authority in respect of the requirement to produce an annual financial report.
We confirm on behalf of the Board that to the best of our knowledge:
• the Group and parent company financial statements have been prepared in accordance with the applicable set of accounting standards and give a true and fair view of the assets, liabilities, financial position and profit or loss of the Company and the undertakings included in the consolidation taken as a whole; and
• the Annual Report and financial statements include a fair review of the development and performance of the business and the position of the Company and the undertakings included in the consolidation taken as a whole, together with a description of the principal risks and uncertainties that they face.
On behalf of the Board
Michael Roney Brian MayChief Executive Finance Director 23 February 2015

BUNZL PLC ANNUAL REPORT 2014 121
INDEPENDENT AUDITORS’ REPORT TO THE MEMBERS OF BUNZL PLC
REPORT ON THE FINANCIAL STATEMENTSOur opinionIn our opinion:
• Bunzl plc’s Group and Company financial statements (the ‘financial statements’) give a true and fair view of the state of the Group’s and of the Company’s affairs as at 31 December 2014 and of the Group’s profit and cash flows for the year then ended;
• the Group financial statements have been properly prepared in accordance with International Financial Reporting Standards (‘IFRSs’) as adopted by the European Union;
• the Company financial statements have been properly prepared in accordance with United Kingdom Generally Accepted Accounting Practice (‘UK GAAP’); and
• the financial statements have been prepared in accordance with the requirements of the Companies Act 2006 and, as regards the Group financial statements, Article 4 of the IAS Regulation.
What we have auditedThe financial statements, which have been prepared by Bunzl plc, comprise:
• the Consolidated and Company balance sheets as at 31 December 2014;
• the Consolidated income statement and Consolidated statement of comprehensive income for the year then ended;
• the Consolidated statement of changes in equity for the year then ended;
• the Consolidated cash flow statement for the year then ended; and
• the Notes to the financial statements, which include a summary of significant accounting policies and other explanatory information.
Certain required disclosures have been presented elsewhere in the Annual Report, rather than in the Notes to the financial statements. These are cross-referenced from the financial statements and are identified as audited.
The financial reporting framework that has been applied in the preparation of the Group financial statements is applicable law and IFRSs as adopted by the European Union. The financial reporting framework that has been applied in the preparation of the Company financial statements is applicable law and UK GAAP.
Our audit approachOverview
Materiality • Overall Group materiality: £15 million which represents 5% of profit before taxation
Audit scope • We perform audit work in 21 different countries in North America, Continental Europe, UK & Ireland and Rest of the World, representing 72 components
Areas of focus • Impairment of goodwill and other intangible assets
• Corporate tax exposures
• Rebate accounting
• Defined benefit pension liabilities
• Business combinations

122 BUNZL PLC ANNUAL REPORT 2014
INDEPENDENT AUDITORS’ REPORT TO THE MEMBERS OF BUNZL PLC CONTINUED
The scope of our audit and our areas of focusWe conducted our audit in accordance with International Standards on Auditing (UK and Ireland) (‘ISAs (UK & Ireland)’).
We designed our audit by determining materiality and assessing the risks of material misstatement in the financial statements. In particular, we looked at where the directors made subjective judgements, for example in respect of significant accounting estimates that involved making assumptions and considering future events that are inherently uncertain. As in all of our audits, we also addressed the risk of management override of internal controls, including evaluating whether there was evidence of bias by the directors that represented a risk of material misstatement due to fraud.
The risks of material misstatement that had the greatest effect on our audit, including the allocation of our resources and effort, are identified as ‘areas of focus’ in the table below. We have also set out how we tailored our audit to address these specific areas in order to provide an opinion on the financial statements as a whole and any comments we make on the results of our procedures should be read in this context. This is not a complete list of all risks identified by our audit.
Area of focus How our audit addressed the area of focus
Impairment of goodwill and other intangible assets Refer to page 50 (Audit Committee report), page 83 (accounting policies) and page 92 (Note 9).
The Group has material goodwill balances and customer relationship intangible assets spread across multiple geographies. We focused on each significant cash generating unit (‘CGU’) (the most significant being North America, France Hygiene and UK Hospitality) as well as the smaller goodwill and intangibles balances relating to the CGUs with the lowest level of headroom.
In assessing whether the carrying amount of these assets has been impaired, management considers forecast cash flows of the individual CGUs which are identified on a market and geographical basis.
Management’s impairment assessment involves significant estimation, principally relating to short and long term revenue growth, future profitability and discount rates. The number of acquisitions and the magnitude of the aggregated related goodwill and intangible assets, together with the subjectivity of the principal assumptions, required a significant amount of audit effort, particularly as some of those assumptions are dependent on economic factors and trading conditions specific to overseas territories.
As described in Note 9 to the financial statements, management concluded that, based on their own sensitivity calculations, no reasonable change in assumptions would lead to an impairment of goodwill or other intangible assets.
In our testing of management’s annual goodwill and other intangible assets impairment calculations, we used our specialist valuation knowledge to assist our evaluation of the appropriateness of the models and the key assumptions used by management. We evaluated the reasonableness of the directors’ forecast by comparing the assumptions made to internal and external data. In particular:
• we compared short term revenue growth rates to the latest three year strategic plans and found them to be consistent;
• we confirmed that long term growth rates were not inconsistent with economic forecasts;
• we found the achievability of future margins to be plausible based on past and current performance; and
• we challenged the discount rate used to determine the present value by assessing the cost of capital for the Company and comparable organisations.
Furthermore, we obtained evidence to confirm adequate historical accuracy in management’s forecasting process. Having ascertained the extent of change in key assumptions that either individually or collectively would be required for goodwill and other intangible assets to be materially impaired, we considered the likelihood of such a movement in those key assumptions to be low.
Corporate tax exposuresRefer to page 50 (Audit Committee report), page 82 (accounting policies) and pages 89 and 90 (Note 6).
The Group operates in a number of international territories with complex taxation rules and regulations. The interpretation of these complex regulations and the unknown future outcome of pending judgements by the tax authorities results in the need to provide against a number of uncertain tax positions.
We focused on this area because of the risk surrounding the level of estimation and judgement that is necessary in determining the provisions required.
We discussed with management the known uncertain tax positions both at Group and local levels.
We used our specialist tax knowledge and experience to assist us in challenging the appropriateness of management’s judgements in relation to uncertain tax positions. These procedures assisted in our corroboration of management’s position on the amount of significant tax exposures and the provision and disclosures made in the financial statements.
In assessing the adequacy of the tax provisions, we also considered factors such as possible penalties and interest. Furthermore, we confirmed that the calculations were in line with the Group’s policy and that the methodology and principles had been applied consistently.

BUNZL PLC ANNUAL REPORT 2014 123
Area of focus How our audit addressed the area of focus
Rebate accounting Refer to page 50 (Audit Committee report) and page 82 (accounting policies).
We focused on this area as rebate income from suppliers is material to the consolidated financial statements.
Given the degree of estimation involved in accounting for volume based rebates, including the level of judgement involved in forecasting the volume of products expected to be purchased, we focused our audit procedures on the accuracy, valuation, completeness and cut-off of these transactions.
We evaluated the processes in place for recognition of supplier rebates by the Group and found these to be consistently applied. We agreed the nature of rebate arrangements to contracts or other supporting agreements and agreed the rates indicated in the agreements with those used in the calculations. We also reperformed rebate calculations. No exceptions were noted from this testing.
For rebates that depend on the volumes purchased in a given period, we compared the volume included in the rebate calculation to the volume of products recorded in the underlying records in management’s forecasts. This did not identify any rebate amounts which were misstated.
Where possible, we also agreed the post year end settlement of year end receivable amounts included in the opening and closing Consolidated balance sheets to bank receipts.
Defined benefit pension liabilities Refer to page 50 (Audit Committee report), page 84 (accounting policies) and pages 103 to 106 (Note 20).
The Group has significant defined benefit pension schemes in the US and UK with a net pension deficit of £70.3 million which is material in the context of the Consolidated balance sheet.
Management estimation is required in relation to the measurement of pension scheme liabilities and management employs independent actuarial experts to assist it in determining appropriate assumptions such as inflation levels, discount rates, salary increases and mortality rates.
Movements in these assumptions can have a material impact on the determination of the liability.
We used our own specialist actuarial knowledge to satisfy ourselves that the assumptions used in calculating the US and UK pension scheme liabilities are appropriate, including confirming that salary increases and mortality rate assumptions were consistent with relevant national and industry benchmarks. We verified that the discount and inflation rates used in the valuation of the pension liabilities were consistent with our internally developed benchmarks and, where available, with other companies’ reporting as at 31 December 2014. In each case we considered the assumptions made by management to be reasonable in light of the available evidence.
Business combinationsRefer to page 50 (Audit Committee report), page 81 (accounting policies) and pages 108 to 111 (Note 24).
Given the acquisitive nature of the Group, accounting for business combinations is an area of focus due to the judgements involved.
Business combinations can involve significant judgements in relation to the assets and liabilities that are recognised, particularly the allocation of purchase consideration to goodwill and separately identified intangible assets. Any misstatement made in the identification and/or valuation of acquired intangibles gives rise to an equal, compensating misstatement in goodwill.
Management relies on external experts to value significant intangibles acquired in business combinations. Where management has relied on such experts, we assessed their competency and tested the results of their work and found no issues.
We used our own specialist valuation knowledge to challenge the methodology and key assumptions used in determining the value of the customer relationship assets for the more significant acquisitions. We concluded that the cash flows applied within the valuation models and the key assumptions applied to the cash flows, such as the discount and growth rates, were appropriate.
124 BUNZL PLC ANNUAL REPORT 2014
INDEPENDENT AUDITORS’ REPORT TO THE MEMBERS OF BUNZL PLC CONTINUED
How we tailored the audit scopeWe tailored the scope of our audit to ensure that we performed enough work to be able to give an opinion on the financial statements as a whole, taking into account the geographic structure of the Group, the accounting processes and controls and the sectors in which the Group operates.
The Group is organised geographically into four business areas, being North America, Continental Europe, UK & Ireland and Rest of the World.
We identified one significant component, being North America. In addition to this, we have identified eight components across Continental Europe, UK & Ireland and Rest of the World for which a full scope audit of their financial information was required. In order to satisfy the request of the Audit Committee and management, we performed full scope audits on a further 63 components. Our audit procedures covered over 95% of total Group revenue, profit before taxation and total assets.
The audit undertaken for Group reporting purposes at the key reporting components of the Group were performed to respective statutory materiality levels of the individual components. These local statutory materiality levels were set individually for each component and agreed with the Group audit team and ranged up to £12.8 million.
Where work was performed by component auditors, detailed instructions were issued by us and we ensured that our involvement in this work was at such a level that we could conclude that sufficient appropriate audit evidence had been obtained as a basis for our opinion on the Group financial statements as a whole. The Group audit team visited North America, UK, France and Brazil. Telephone discussions were also held with component auditors at these locations and with the majority of the components which the Group audit team did not visit in person. Further, specific audit procedures over central functions and areas of significant judgement, including taxation, pensions, acquisitions and impairment of goodwill and intangible assets, were performed by the Group audit team centrally.
MaterialityThe scope of our audit is influenced by our application of materiality. We set certain quantitative thresholds for materiality. These, together with qualitative considerations, helped us to determine the scope of our audit and the nature, timing and extent of our audit procedures and to evaluate the effect of misstatements, both individually and on the financial statements as a whole.
Based on our professional judgement, we determined materiality for the financial statements as a whole as follows:
Overall Group materiality £15 million
How we determined it 5% of profit before taxation
Rationale for benchmark applied Given that the Group’s businesses are profit orientated, we believe that profit before taxation provides us with a consistent year-on-year basis for determining materiality
We agreed with the Audit Committee that we would report to them any misstatements identified during our audit above £750,000 as well as misstatements below that amount that, in our view, warranted reporting for qualitative reasons.
Going concernUnder the Listing Rules we are required to review the directors’ statement, set out on page 33, in relation to going concern. We have nothing to report having performed our review.
As noted in the directors’ statement, the directors have concluded that it is appropriate to prepare the financial statements using the going concern basis of accounting. The going concern basis presumes that the Group and Company have adequate resources to remain in operation, and that the directors intend them to do so, for at least one year from the date the financial statements were signed. As part of our audit we have concluded that the directors’ use of the going concern basis is appropriate.
However, because not all future events or conditions can be predicted, these statements are not a guarantee as to the Group’s and Company’s ability to continue as a going concern.
BUNZL PLC ANNUAL REPORT 2014 125
OTHER REQUIRED REPORTINGConsistency of other informationCompanies Act 2006 opinionIn our opinion, the information given in the strategic report and the directors’ report for the financial year for which the financial statements are prepared is consistent with the financial statements.
ISAs (UK & Ireland) reportingUnder ISAs (UK & Ireland) we are required to report to you if, in our opinion:
• Information in the Annual Report is:
− materially inconsistent with the information in the audited financial statements; or
− apparently materially incorrect based on, or materially inconsistent with, our knowledge of the Group and Company acquired in the course of performing our audit; or
− is otherwise misleading.
We have no exceptions to report arising from this responsibility.
• the statement given by the directors, in accordance with provision C.1.1 of the UK Corporate Governance Code (the ‘Code’), that they consider the Annual Report taken as a whole to be fair, balanced and understandable and provides the information necessary for members to assess the Group’s performance, business model and strategy is materially inconsistent with our knowledge of the Group acquired in the course of performing our audit.
We have no exceptions to report arising from this responsibility.
• the section of the Annual Report, as required by provision C.3.8 of the Code, describing the work of the Audit Committee does not appropriately address matters communicated by us to the Audit Committee.
We have no exceptions to report arising from this responsibility.
Adequacy of accounting records and information and explanations receivedUnder the Companies Act 2006 we are required to report to you if, in our opinion:
• we have not received all the information and explanations we require for our audit; or
• adequate accounting records have not been kept by the Company, or returns adequate for our audit have not been received from branches not visited by us; or
• the Company financial statements and the part of the Directors’ remuneration report to be audited are not in agreement with the accounting records and returns.
We have no exceptions to report arising from this responsibility.
Directors’ remunerationDirectors’ remuneration report – Companies Act 2006 opinionIn our opinion, the part of the Directors’ remuneration report to be audited has been properly prepared in accordance with the Companies Act 2006.
Other Companies Act 2006 reportingUnder the Companies Act 2006 we are required to report to you if, in our opinion, certain disclosures of directors’ remuneration specified by law are not made. We have no exceptions to report arising from this responsibility.
Corporate governance statementUnder the Listing Rules we are required to review the part of the Corporate governance report relating to the Company’s compliance with nine provisions of the Code. We have nothing to report having performed our review.
RESPONSIBILITIES FOR THE FINANCIAL STATEMENTS AND THE AUDITOur responsibilities and those of the directorsAs explained more fully in the Statement of directors’ responsibilities set out on page 120, the directors are responsible for the preparation of the financial statements and for being satisfied that they give a true and fair view.
Our responsibility is to audit and express an opinion on the financial statements in accordance with applicable law and ISAs (UK & Ireland). Those standards require us to comply with the Auditing Practices Board’s Ethical Standards for Auditors.
This report, including the opinions, has been prepared for and only for the Company’s members as a body in accordance with Chapter 3 of Part 16 of the Companies Act 2006 and for no other purpose. We do not, in giving these opinions, accept or assume responsibility for any other purpose or to any other person to whom this report is shown or into whose hands it may come save where expressly agreed by our prior consent in writing.

126 BUNZL PLC ANNUAL REPORT 2014
INDEPENDENT AUDITORS’ REPORT TO THE MEMBERS OF BUNZL PLC CONTINUED
What an audit of financial statements involvesAn audit involves obtaining evidence about the amounts and disclosures in the financial statements sufficient to give reasonable assurance that the financial statements are free from material misstatement, whether caused by fraud or error. This includes an assessment of:
• whether the accounting policies are appropriate to the Group’s and the Company’s circumstances and have been consistently applied and adequately disclosed;
• the reasonableness of significant accounting estimates made by the directors; and
• the overall presentation of the financial statements.
We primarily focus our work in these areas by assessing the directors’ judgements against available evidence, forming our own judgements and evaluating the disclosures in the financial statements.
We test and examine information, using sampling and other auditing techniques, to the extent we consider necessary to provide a reasonable basis for us to draw conclusions. We obtain audit evidence through testing the effectiveness of controls, substantive procedures or a combination of both.
In addition, we read all the financial and non-financial information in the Annual Report to identify material inconsistencies with the audited financial statements and to identify any information that is apparently materially incorrect based on, or materially inconsistent with, the knowledge acquired by us in the course of performing the audit. If we become aware of any apparent material misstatements or inconsistencies we consider the implications for our report.
Paul Cragg (Senior Statutory Auditor)for and on behalf of PricewaterhouseCoopers LLPChartered Accountants and Statutory AuditorsLondon23 February 2015

BUNZL PLC ANNUAL REPORT 2014 127
FIVE YEAR REVIEW
2014 2013 2012* 2011* 2010*£m £m £m £m £m
Revenue 6,156.5 6,097.7 5,359.2 5,109.5 4,829.6Operating profit 341.8 332.1 293.8 279.3 255.7Finance income 4.0 2.6 3.6 3.5 3.5Finance cost (46.0) (44.8) (37.6) (37.0) (37.9)Disposal of business – – 4.0 (56.0) –Profit before income tax 299.8 289.9 263.8 189.8 221.3Income tax (89.1) (83.1) (72.5) (68.8) (65.1)Profit for the year attributable to the Company’s equity holders 210.7 206.8 191.3 121.0 156.2
Basic earnings per share 64.5p 63.5p 58.7p 37.3p 48.2p
Non-GAAP measures†
Adjusted operating profit 429.8 414.4 352.4 335.7 306.7Adjusted profit before income tax 387.8 372.2 318.4 302.2 272.3Adjusted profit for the year 281.6 268.2 230.2 219.9 193.3Adjusted earnings per share 86.2p 82.4p 70.6p 67.6p 59.7p
*Restated on adoption of IAS 19 (revised 2011) ‘Employee Benefits’.†See Note 2w on page 85 for further details of the non-GAAP measures.
128 BUNZL PLC ANNUAL REPORT 2014
SHAREHOLDER INFORMATION
FINANCIAL CALENDAR 2015
Annual General Meeting 15 AprilResults for the half year to 30 June 2015 24 August
2016
Results for the year to 31 December 2015 FebruaryAnnual Report circulated March
Dividend payments are normally made on these dates or the following working day:Ordinary shares (final) 1 JulyOrdinary shares (interim) 2 January
ANALYSIS OF ORDINARY SHAREHOLDERSAt 31 December 2014 the Company had 5,281 (2013: 5,397) shareholders who held 334.7 million (2013: 333.5 million) ordinary shares between them, analysed as follows:
Size of holdingNumber of
shareholders% of issued
share capital
0 – 10,000 4,673 210,001 – 100,000 347 4100,001 – 500,000 168 11500,001 – 1,000,000 41 81,000,001 and over 52 75
5,281 100
REGISTRARComputershare Investor Services PLC The Pavilions Bridgwater Road Bristol BS99 6ZZ Telephone +44 (0) 870 889 3257 Fax +44 (0) 870 703 6101 Email [email protected] Website www.computershare.com
INVESTOR CENTREShareholders can manage their shareholding online at www.investorcentre.co.uk. The Investor Centre is our registrar’s easy to use website, available 24 hours a day, 7 days a week, where the following services are available:
• change of address;
• view share balance information;
• join the dividend reinvestment plan; and
• view dividend payment and tax information.
In order to register for the Investor Centre, shareholders will need their shareholder reference number which can be found on either their share certificate or dividend tax voucher.
DIVIDEND PAYMENT BY BACSShareholders can have their dividends paid directly into their bank or building society account using the Bankers’ Automated Clearing Service (‘BACS’). This means that dividends will be in the account on the same day the dividend payment is made. Shareholders will receive their tax vouchers by post. To use this method of payment please contact our registrar on +44 (0) 870 889 3257 or visit the Investor Centre website. Please note that this option will not override any existing dividend scheme mandate, which would need to be revoked in writing.
DIVIDEND REINVESTMENT PLANThe Company operates a dividend reinvestment plan which allows shareholders to use the whole of their cash dividend to buy additional shares in the Company, thereby increasing their shareholding.
Shareholders can apply to join the plan online in the Investor Centre or can contact the Company’s registrar to request the terms and conditions of the plan and a printed mandate form.
AMERICAN DEPOSITARY RECEIPTSThe Company has a sponsored Level 1 American Depositary Receipt (ADR) programme that trades on the over-the-counter (OTC) market in the US. Citibank N.A. acts as the Depositary Bank.Telephone Citibank +1 781 575 4555 Email [email protected] Website www.citi.com/dr
GLOBAL PAYMENTS SERVICEShareholders may if they wish have their dividend payments paid directly into their bank account in certain foreign currencies. Please contact the Company’s registrar on +44 (0) 870 889 3257 to request further information about the currencies for which this service is available.
SHARE DEALINGBunzl plc shares can be traded through most banks and stockbrokers. The Company’s registrar also offers an internet and telephone dealing service. Further details can be found at www.computershare.com/dealing/uk or by telephoning +44 (0) 870 703 0084.
SHAREGIFTSometimes shareholders have only a small holding of shares which may be uneconomical to sell. Shareholders who wish to donate these shares to charity can do so through ShareGift, an independent charity share donation scheme (registered charity no. 1052686). Further information about ShareGift may be obtained from ShareGift on +44 (0) 20 7930 3737 or at www.sharegift.org.
SHAREHOLDER SECURITYShareholders are advised to be cautious about any unsolicited financial advice, offers to buy shares at a discount or offers of free company reports. More detailed information about this can be found at www.fca.org.uk in the Consumers section. Details of any share dealing facilities that the Company endorses will be included in Company mailings.
AUDITORSPricewaterhouseCoopers LLP
STOCKBROKERSJ.P. Morgan Cazenove Citigroup
COMPANY SECRETARYPaul Hussey
REGISTERED OFFICEYork House 45 Seymour Street London W1H 7JT Telephone +44 (0) 20 7725 5000 Fax +44 (0) 20 7725 5001
Website www.bunzl.com Registered in England no. 358948
FORWARD-LOOKING STATEMENTSThe Annual Report contains certain statements about the future outlook for the Group. Although the Company believes that the expectations are based on reasonable assumptions, any statements about future outlook may be influenced by factors that could cause actual outcomes and results to be materially different.

Printed on Amadeus 50 Silk which is produced using 50% recycled post-consumer waste and 50% wood fibre from fully sustainable forests with FSC® certification. All pulps used are Elemental Chlorine Free (ECF). Printed in the UK by Pureprint using their ® and ®
environmental printing technology and vegetable inks were used throughout. Pureprint is a Carbon Neutral® company. Both the manufacturing mill and the printer are registered to the Environmental Management System ISO14001 and are Forest Stewardship Council® (FSC) chain-of-custody certified.
Designed and produced by

York House 45 Seymour Street London W1H 7JTwww.bunzl.com