kdump and introduction to vmcore analysis · kdump and introduction to vmcore analysis how to get...
TRANSCRIPT

KDUMP AND INTRODUCTIONTO VMCORE ANALYSISHOW TO GET STARTED WITH INSPECTINGKERNEL FAILURES
PATRICK LADD
TECHNICAL ACCOUNT MANAGER, RED HAT
slides available at https://people.redhat.com/pladd

SUMMARY
TOPICS TO BE COVEREDWHAT IS A VMCORE, AND WHEN IS ISCAPTURED?
CONFIGURATION OF THE KDUMP UTILITY ANDTESTING
SETTING UP A VMCORE ANALYSIS SYSTEM
USING THE "CRASH" UTILITY FOR INITIALANALYSIS OF VMCORE CONTENTS
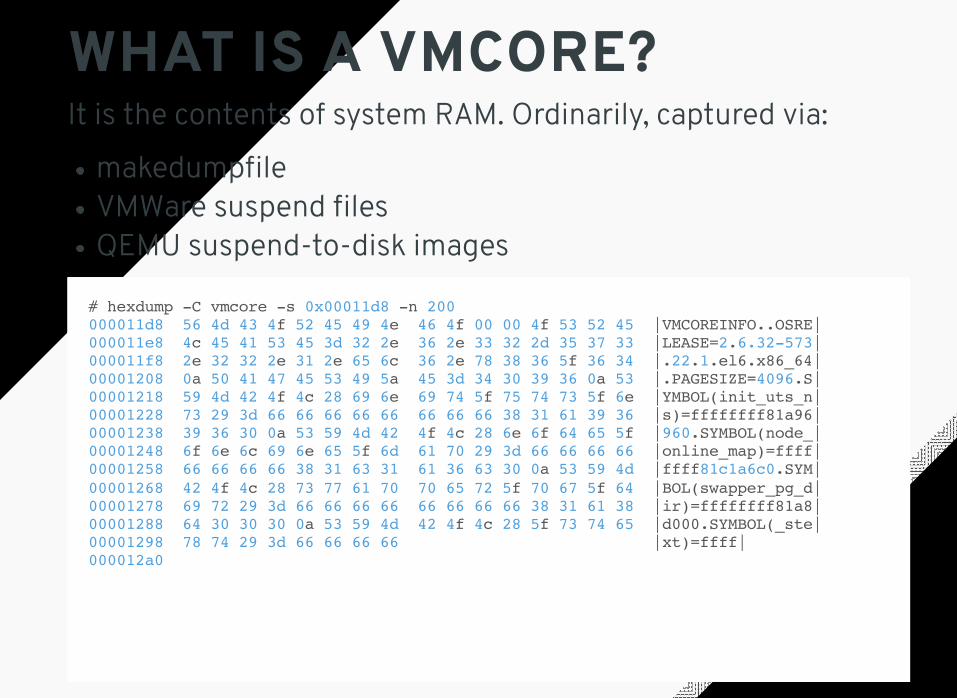
WHAT IS A VMCORE?It is the contents of system RAM. Ordinarily, captured via:
makedumpfileVMWare suspend filesQEMU suspend-to-disk images
# hexdump -C vmcore -s 0x00011d8 -n 200000011d8 56 4d 43 4f 52 45 49 4e 46 4f 00 00 4f 53 52 45 |VMCOREINFO..OSRE|000011e8 4c 45 41 53 45 3d 32 2e 36 2e 33 32 2d 35 37 33 |LEASE=2.6.32-573|000011f8 2e 32 32 2e 31 2e 65 6c 36 2e 78 38 36 5f 36 34 |.22.1.el6.x86_64|00001208 0a 50 41 47 45 53 49 5a 45 3d 34 30 39 36 0a 53 |.PAGESIZE=4096.S|00001218 59 4d 42 4f 4c 28 69 6e 69 74 5f 75 74 73 5f 6e |YMBOL(init_uts_n|00001228 73 29 3d 66 66 66 66 66 66 66 66 38 31 61 39 36 |s)=ffffffff81a96|00001238 39 36 30 0a 53 59 4d 42 4f 4c 28 6e 6f 64 65 5f |960.SYMBOL(node_|00001248 6f 6e 6c 69 6e 65 5f 6d 61 70 29 3d 66 66 66 66 |online_map)=ffff|00001258 66 66 66 66 38 31 63 31 61 36 63 30 0a 53 59 4d |ffff81c1a6c0.SYM|00001268 42 4f 4c 28 73 77 61 70 70 65 72 5f 70 67 5f 64 |BOL(swapper_pg_d|00001278 69 72 29 3d 66 66 66 66 66 66 66 66 38 31 61 38 |ir)=ffffffff81a8|00001288 64 30 30 30 0a 53 59 4d 42 4f 4c 28 5f 73 74 65 |d000.SYMBOL(_ste|00001298 78 74 29 3d 66 66 66 66 |xt)=ffff|000012a0
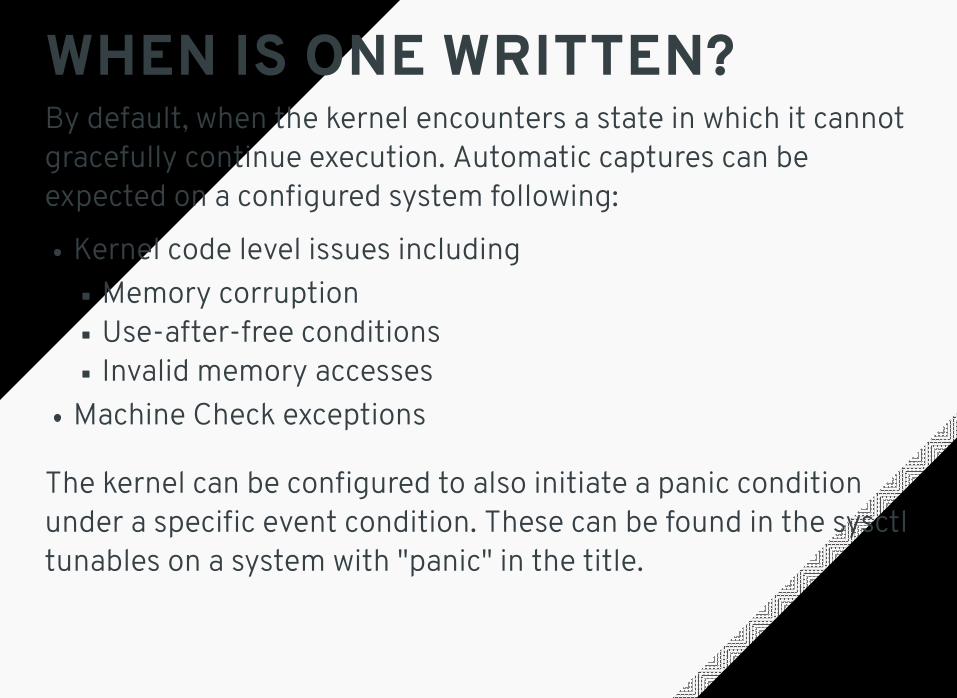
WHEN IS ONE WRITTEN?By default, when the kernel encounters a state in which it cannotgracefully continue execution. Automatic captures can beexpected on a configured system following:
Kernel code level issues includingMemory corruptionUse-after-free conditionsInvalid memory accesses
Machine Check exceptions
The kernel can be configured to also initiate a panic conditionunder a specific event condition. These can be found in the sysctltunables on a system with "panic" in the title.

# sysctl -A | grep panickernel.panic = 0kernel.panic_on_oops = 1kernel.softlockup_panic = 0kernel.unknown_nmi_panic = 0kernel.panic_on_unrecovered_nmi = 0kernel.panic_on_io_nmi = 0kernel.hung_task_panic = 0kernel.panic_on_warn = 0vm.panic_on_oom = 0

KDUMP CONFIGURATIONThe kdump service is the primary mechanismconfiguration component that allows systems to capturea vmcore during a failure.
Provided by the "kexec-tools" packageConfiguration located in /etc/kdump.conf and mostoptions are documented within the configuration file.

#raw /dev/sda5#ext4 /dev/sda3#ext4 LABEL=/boot#ext4 UUID=03138356-5e61-4ab3-b58e-27507ac41937#net my.server.com:/export/tmp#net [email protected] /var/crashcore_collector makedumpfile -c --message-level 1 -d 31#core_collector scp#core_collector cp --sparse=always#extra_bins /bin/cp#link_delay 60#kdump_post /var/crash/scripts/kdump-post.sh#extra_bins /usr/bin/lftp#disk_timeout 30#extra_modules gfs2#options modulename options#default shell#debug_mem_level 0#force_rebuild 1#sshkey /root/.ssh/kdump_id_rsa#fence_kdump_args -p 7410 -f auto -c 0 -i 10#fence_kdump_nodes node1 node2

CONFIGURATION CONT.Required additional configuration:
The "crashkernel" option.This is applied within the bootloader configuration file anddetermines how much RAM is used for the secondary kernelwhich is responsible for writing the contents of RAM for theprimary failing kernelShould be sized appropriately to the amount of RAMinstalled to the system, with an eye to how many paths andmodules are loaded on the system to establish a base levelof functionality.

CONFIGURATION CONT.For example:
# awk '/^title/,/EOF/' /boot/grub/grub.conf title Red Hat Enterprise Linux Server (2.6.32-573.22.1.el6.x86_64) root (hd0,0) kernel /vmlinuz-2.6.32-573.22.1.el6.x86_64 crashkernel=128M ro root=/dev/mapper/vg_unused-lv_root initrd /initramfs-2.6.32-573.22.1.el6.x86_64.img

FURTHER ASSISTANCE:How to troubleshoot kernel crashes, hangs, or rebootswith kdump on Red Hat Enterprise Linuxhttps://access.redhat.com/solutions/6038

FURTHER ASSISTANCE:In addition, the following lab app guides administratorsthrough the process of configuration dynamically based on theindividual end system.
Kdump Helperhttps://access.redhat.com/labs/kdumphelper/

KDUMP TESTINGThough the kdump service and configuration is fairlystraightforward, the possible sources of failure are numerous. Itis paramount to test the configuration. By initiating a kernelpanic and verifying that a vmcore is present afterwards,confidence is raised that the service will function at a later date.
root@example ~]# echo c > /proc/sysrq-trigger
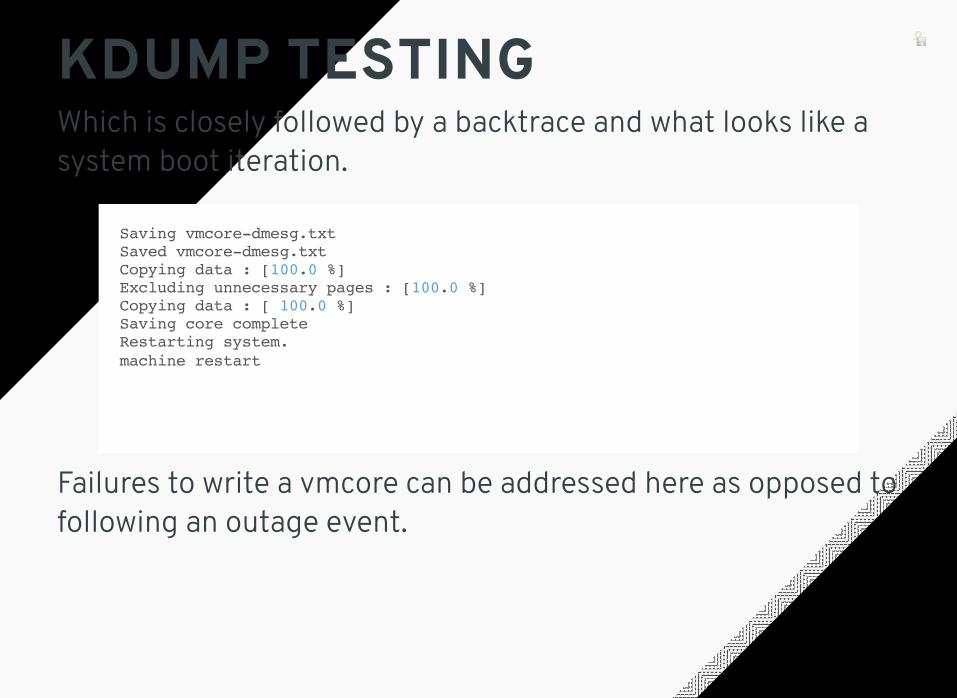
KDUMP TESTINGWhich is closely followed by a backtrace and what looks like asystem boot iteration.
Failures to write a vmcore can be addressed here as opposed tofollowing an outage event.
Saving vmcore-dmesg.txtSaved vmcore-dmesg.txtCopying data : [100.0 %]Excluding unnecessary pages : [100.0 %]Copying data : [ 100.0 %]Saving core completeRestarting system.machine restart

ANALYSIS SYSTEMFor any system that will review vmcore contents, the followingmust be installed:
1 The crash utility, available within the rhel-6-server-rpmsbase channel
2 Debugging symbols contained within the "vmlinux" file fromthe debuginfo package associated with the vmcore needingto be analyzed.

[root@example ~]# yum install crash --disablerepo=\* --enablerepo=rhel-6-server-rpmsLoaded plugins: product-id, security, subscription-managerSetting up Install ProcessResolving Dependencies<snip>Dependencies Resolved
======================================================================================= Package Arch Version Repository Size=======================================================================================Installing: crash x86_64 7.1.0-3.el6_7.1 rhel-6-server-rpms 2.5 M
Transaction Summary=======================================================================================Install 1 Package(s)
Total download size: 2.5 MInstalled size: 7.0 MIs this ok [y/N]: y

[root@example ~]# yum install kernel-debuginfo-`uname -r` --disablerepo=* \--enablerepo=rhel-6-server-debug-rpmsLoaded plugins: product-id, security, subscription-managerSetting up Install Processrhel-6-server-debug-rpms | 2.9 kB 00:00 rhel-6-server-debug-rpms/primary_db | 1.8 MB 00:00 Resolving Dependencies<snip>Dependencies Resolved
======================================================================================= Package Arch Version Repository Size=======================================================================================Installing: kernel-debuginfo x86_64 2.6.32-573.8.1.el6 rhel-6-server-debug-rpms 266 MInstalling for dependencies: kernel-debuginfo-common-x86_64 x86_64 2.6.32-573.8.1.el6 rhel-6-server-debug-rpms 43 M
Transaction Summary=======================================================================================Install 2 Package(s)
Total size: 309 MTotal download size: 43 MInstalled size: 1.7 GIs this ok [y/N]: y
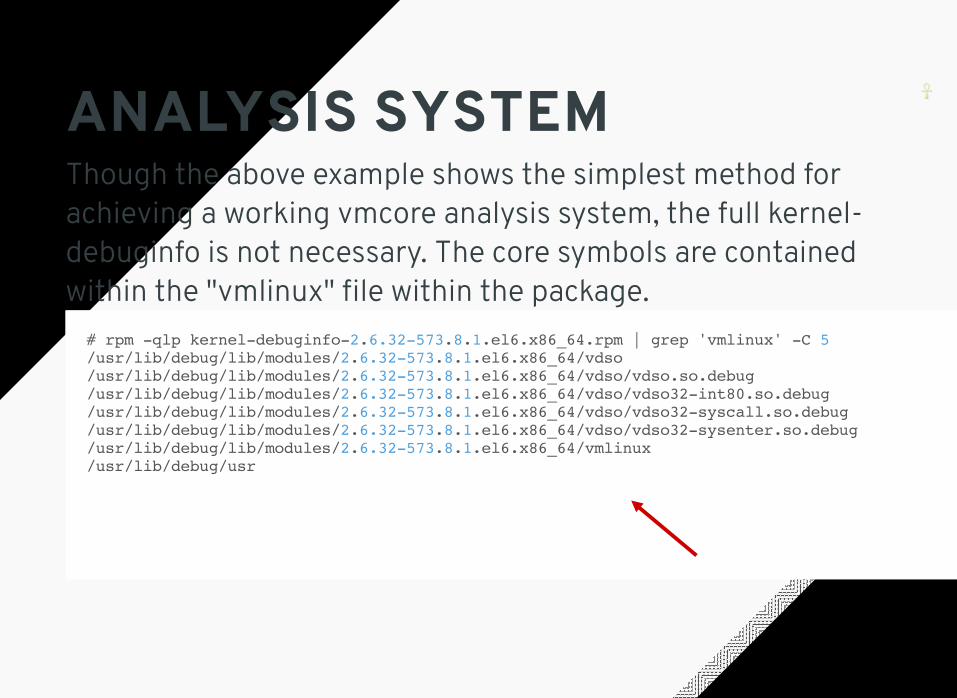
ANALYSIS SYSTEMThough the above example shows the simplest method forachieving a working vmcore analysis system, the full kernel-debuginfo is not necessary. The core symbols are containedwithin the "vmlinux" file within the package.
# rpm -qlp kernel-debuginfo-2.6.32-573.8.1.el6.x86_64.rpm | grep 'vmlinux' -C 5/usr/lib/debug/lib/modules/2.6.32-573.8.1.el6.x86_64/vdso/usr/lib/debug/lib/modules/2.6.32-573.8.1.el6.x86_64/vdso/vdso.so.debug/usr/lib/debug/lib/modules/2.6.32-573.8.1.el6.x86_64/vdso/vdso32-int80.so.debug/usr/lib/debug/lib/modules/2.6.32-573.8.1.el6.x86_64/vdso/vdso32-syscall.so.debug/usr/lib/debug/lib/modules/2.6.32-573.8.1.el6.x86_64/vdso/vdso32-sysenter.so.debug/usr/lib/debug/lib/modules/2.6.32-573.8.1.el6.x86_64/vmlinux/usr/lib/debug/usr
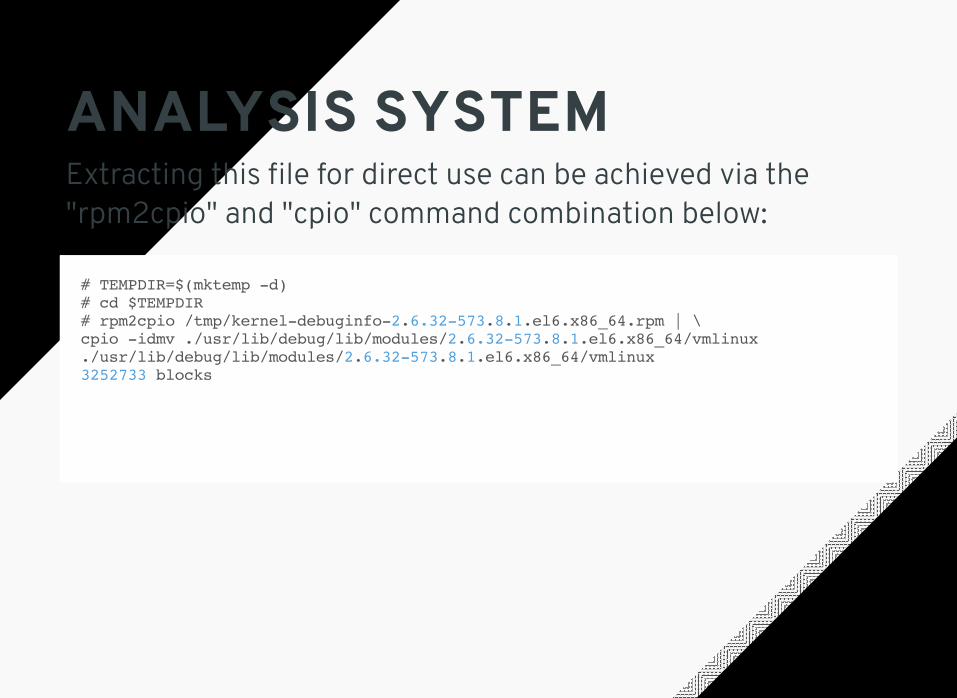
ANALYSIS SYSTEMExtracting this file for direct use can be achieved via the"rpm2cpio" and "cpio" command combination below:
# TEMPDIR=$(mktemp -d)# cd $TEMPDIR# rpm2cpio /tmp/kernel-debuginfo-2.6.32-573.8.1.el6.x86_64.rpm | \cpio -idmv ./usr/lib/debug/lib/modules/2.6.32-573.8.1.el6.x86_64/vmlinux./usr/lib/debug/lib/modules/2.6.32-573.8.1.el6.x86_64/vmlinux3252733 blocks
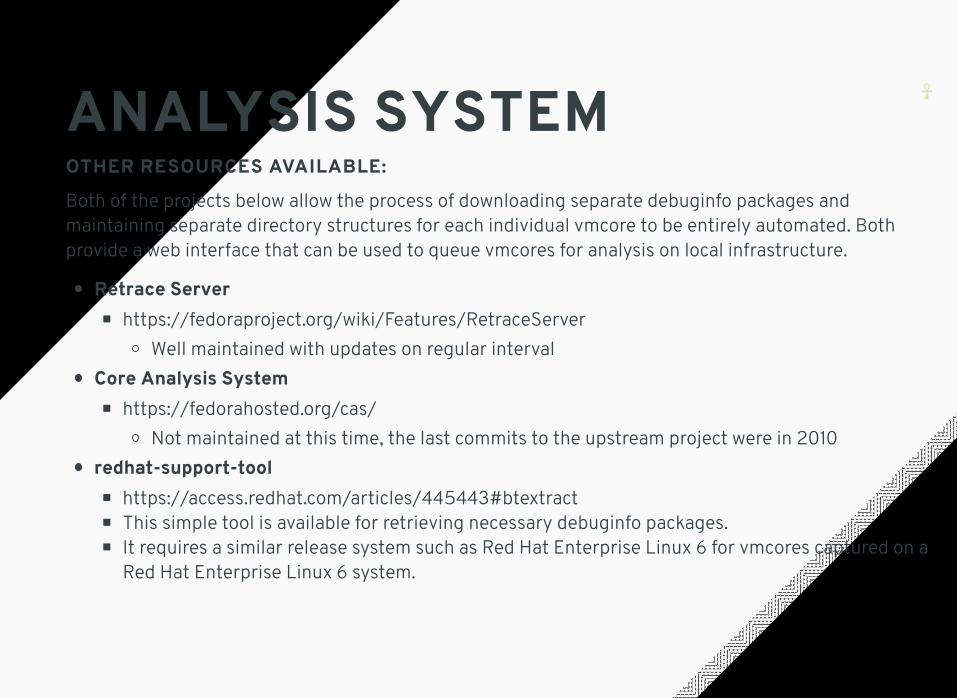
ANALYSIS SYSTEMOTHER RESOURCES AVAILABLE:
Both of the projects below allow the process of downloading separate debuginfo packages andmaintaining separate directory structures for each individual vmcore to be entirely automated. Bothprovide a web interface that can be used to queue vmcores for analysis on local infrastructure.
Retrace Server
https://fedoraproject.org/wiki/Features/RetraceServer
Well maintained with updates on regular interval
Core Analysis System
https://fedorahosted.org/cas/
Not maintained at this time, the last commits to the upstream project were in 2010
redhat-support-tool
https://access.redhat.com/articles/445443#btextractThis simple tool is available for retrieving necessary debuginfo packages.It requires a similar release system such as Red Hat Enterprise Linux 6 for vmcores captured on aRed Hat Enterprise Linux 6 system.

INITIAL ANALYSISNOW THAT A VMCORE HAS BEEN CAPTURED, WHAT NEXT?
The initial steps within a vmcore can be distilled down to the following few commands:
Each of these commands help narrow the focus of what could have caused a particular outage and willbe discussed in the following slides.
1 log
2 bt
3 kmem -i

INITIAL ANALYSISCrash itself is a debugger utility that acts as an interactive shell, accessing the contents of a givenvmcore in a human readable format using the debugging symbols provided.
[root@example 127.0.0.1-2016-04-25-13:21:13]# crash -v
crash 7.1.0-3.el6_7.1Copyright (C) 2002-2014 Red Hat, Inc.Copyright (C) 2004, 2005, 2006, 2010 IBM CorporationCopyright (C) 1999-2006 Hewlett-Packard CoCopyright (C) 2005, 2006, 2011, 2012 Fujitsu LimitedCopyright (C) 2006, 2007 VA Linux Systems Japan K.K.Copyright (C) 2005, 2011 NEC CorporationCopyright (C) 1999, 2002, 2007 Silicon Graphics, Inc.Copyright (C) 1999, 2000, 2001, 2002 Mission Critical Linux, Inc.This program is free software, covered by the GNU General Public License,and you are welcome to change it and/or distribute copies of it undercertain conditions. Enter "help copying" to see the conditions.This program has absolutely no warranty. Enter "help warranty" for details. GNU gdb (GDB) 7.6Copyright (C) 2013 Free Software Foundation, Inc.License GPLv3+: GNU GPL version 3 or later <http://gnu.org/licenses/gpl.html>This is free software: you are free to change and redistribute it.There is NO WARRANTY, to the extent permitted by law. Type "show copying"and "show warranty" for details.This GDB was configured as "x86_64-unknown-linux-gnu".
Opening the utility simply requires the vmcore and vmlinux file
BUG: unable to handle kernel NULL pointer dereference at (null)IP: [<ffffffff81350f46>] sysrq_handle_crash+0x16/0x20PGD 21d711067 PUD 21d520067 PMD 0 Oops: 0002 [#1] SMP last sysfs file: /sys/devices/pci0000:00/0000:00:05.7/usb1/1-1/speedCPU 0 Modules linked in: onload(U) sfc_char(U) sfc_resource(U) sfc_affinity(U) <snip>
Pid: 2932, comm: bash Not tainted 2.6.32-573.8.1.el6.x86_64 #1 Bochs BochsRIP: 0010:[<ffffffff81350f46>] [<ffffffff81350f46>] sysrq_handle_crash+0x16/0x20RSP: 0018:ffff88021da87e18 EFLAGS: 00010096RAX: 0000000000000010 RBX: 0000000000000063 RCX: 0000000000000000RDX: 0000000000000000 RSI: 0000000000000000 RDI: 0000000000000063RBP: ffff88021da87e18 R08: 0000000000000000 R09: 00007fed7d8f5700R10: 00000000ffffffff R11: 0000000000000246 R12: 0000000000000000R13: ffffffff81b109a0 R14: 0000000000000286 R15: 0000000000000004FS: 00007fed7d8f5700(0000) GS:ffff880028200000(0000) knlGS:0000000000000000CS: 0010 DS: 0000 ES: 0000 CR0: 0000000080050033CR2: 0000000000000000 CR3: 000000021db04000 CR4: 00000000000406f0DR0: 0000000000000000 DR1: 0000000000000000 DR2: 0000000000000000DR3: 0000000000000000 DR6: 00000000ffff0ff0 DR7: 0000000000000400<snip>
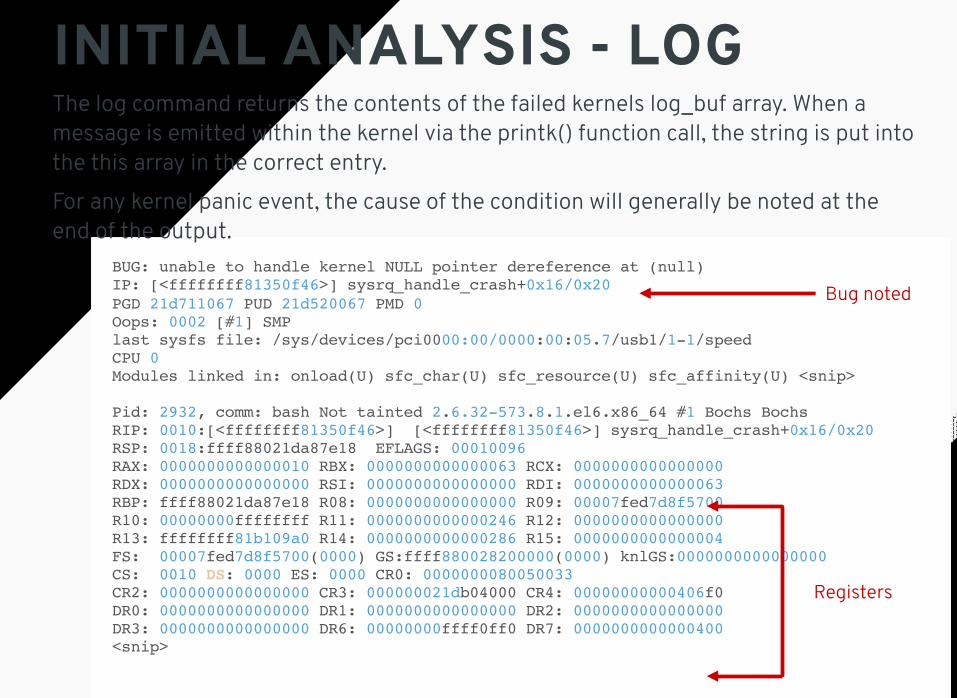
INITIAL ANALYSIS - LOGThe log command returns the contents of the failed kernels log_buf array. When amessage is emitted within the kernel via the printk() function call, the string is put intothe this array in the correct entry.
For any kernel panic event, the cause of the condition will generally be noted at theend of the output.
Bug noted
Registers

Process bash (pid: 2932, threadinfo ffff88021da84000, task ffff88021d450ab0)Stack: ffff88021da87e68 ffffffff81351202 ffff88021ad58728 0000000000000000<d> 0000000000000022 0000000000000002 ffff88011afd99c0 00007fed7d8fc000<d> 0000000000000002 fffffffffffffffb ffff88021da87e98 ffffffff813512beCall Trace: [<ffffffff81351202>] __handle_sysrq+0x132/0x1a0 [<ffffffff813512be>] write_sysrq_trigger+0x4e/0x50 [<ffffffff811fd29e>] proc_reg_write+0x7e/0xc0 [<ffffffff81191ab8>] vfs_write+0xb8/0x1a0 [<ffffffff81192fa6>] ? fget_light_pos+0x16/0x50 [<ffffffff811925f1>] sys_write+0x51/0xb0 [<ffffffff8100b0d2>] system_call_fastpath+0x16/0x1bCode: d0 88 81 a3 6e ff 81 c9 c3 66 66 66 2e 0f 1f 84 00 00 00 00 00 55 48 <snip>RIP [<ffffffff81350f46>] sysrq_handle_crash+0x16/0x20 RSP <ffff88021da87e18>CR2: 0000000000000000
INITIAL ANALYSIS - LOGContinued.
In the event that a vmcore was captured not as a result of a kernel panic, careful inspection of the fullring buffer contents will be necessary. A system may enter a degraded state, but continue operation forsome time without encountering a panic state. This, if continued long enough can result in the ringbuffer wrapping and thereby masking the original initiating failure condition.
Backtrace

INITIAL ANALYSIS - LOGIn the above example, the following message is reported:
Pid: 2932, comm: bash Not tainted 2.6.32-573.8.1.el6.x86_64 #1 Bochs BochsRIP: 0010:[<ffffffff81350f46>] [<ffffffff81350f46>] sysrq_handle_crash+0x16/0x20<snip>Call Trace: [<ffffffff81351202>] __handle_sysrq+0x132/0x1a0 [<ffffffff813512be>] write_sysrq_trigger+0x4e/0x50 [<ffffffff811fd29e>] proc_reg_write+0x7e/0xc0 [<ffffffff81191ab8>] vfs_write+0xb8/0x1a0 [<ffffffff81192fa6>] ? fget_light_pos+0x16/0x50 [<ffffffff811925f1>] sys_write+0x51/0xb0 [<ffffffff8100b0d2>] system_call_fastpath+0x16/0x1bCode: d0 88 81 a3 6e ff 81 c9 c3 66 66 66 2e 0f 1f 84 00 00 00 00 00 55 48 89 e5 0f 1f 44 00 00 c7 05 RIP [<ffffffff81350f46>] sysrq_handle_crash+0x16/0x20 RSP <ffff88021da87e18>CR2: 0000000000000000
BUG: unable to handle kernel NULL pointer dereference at (null)
Followed by a register dump, and backtrace. Register contents have been omitted from the following forlegibility:
RIP: Is the instruction that was underway at the time of the failure.
Call Trace: Is the breadcrumb trail of functions that led to this end RIP. Functions with a "?" next to themare a guess by the stack unwinder and should not be assumed to be correct without further verification.
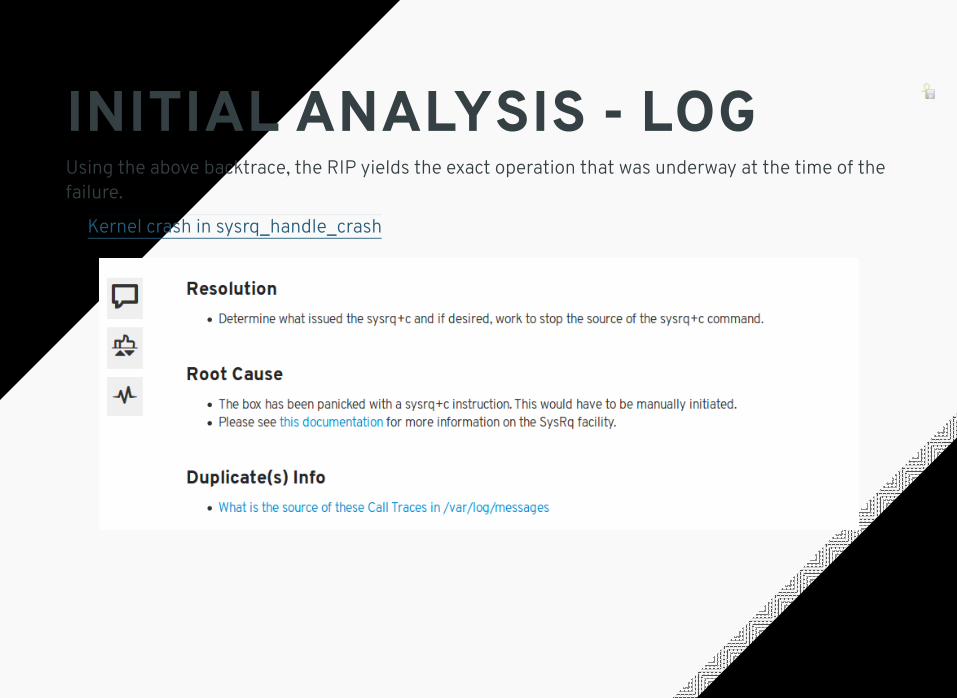
INITIAL ANALYSIS - LOGUsing the above backtrace, the RIP yields the exact operation that was underway at the time of thefailure.
Kernel crash in sysrq_handle_crash
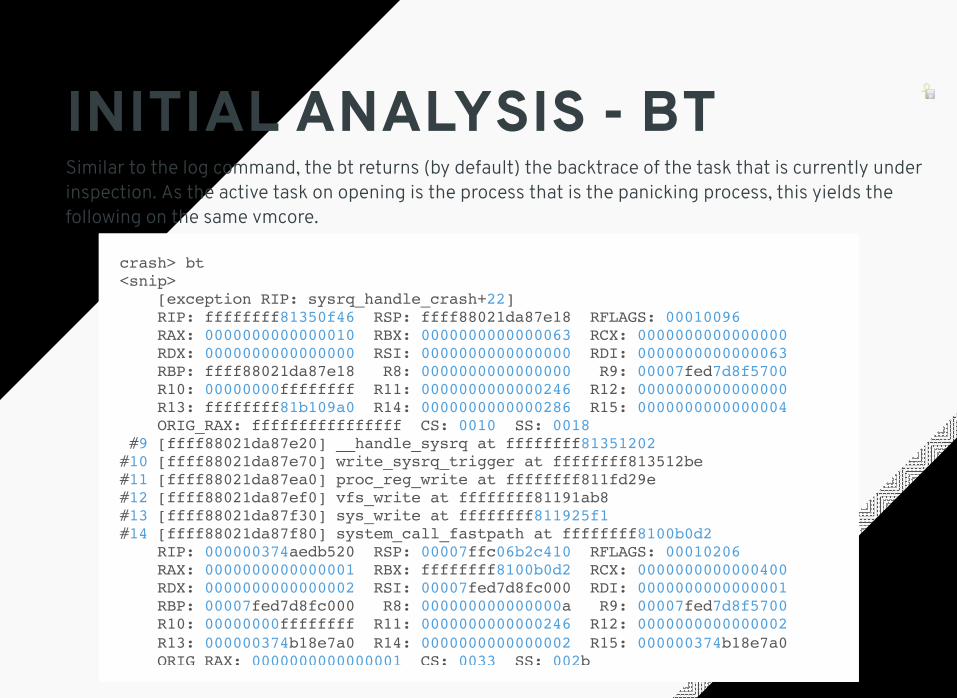
INITIAL ANALYSIS - BTSimilar to the log command, the bt returns (by default) the backtrace of the task that is currently underinspection. As the active task on opening is the process that is the panicking process, this yields thefollowing on the same vmcore.
crash> bt<snip> [exception RIP: sysrq_handle_crash+22] RIP: ffffffff81350f46 RSP: ffff88021da87e18 RFLAGS: 00010096 RAX: 0000000000000010 RBX: 0000000000000063 RCX: 0000000000000000 RDX: 0000000000000000 RSI: 0000000000000000 RDI: 0000000000000063 RBP: ffff88021da87e18 R8: 0000000000000000 R9: 00007fed7d8f5700 R10: 00000000ffffffff R11: 0000000000000246 R12: 0000000000000000 R13: ffffffff81b109a0 R14: 0000000000000286 R15: 0000000000000004 ORIG_RAX: ffffffffffffffff CS: 0010 SS: 0018 #9 [ffff88021da87e20] __handle_sysrq at ffffffff81351202#10 [ffff88021da87e70] write_sysrq_trigger at ffffffff813512be#11 [ffff88021da87ea0] proc_reg_write at ffffffff811fd29e#12 [ffff88021da87ef0] vfs_write at ffffffff81191ab8#13 [ffff88021da87f30] sys_write at ffffffff811925f1#14 [ffff88021da87f80] system_call_fastpath at ffffffff8100b0d2 RIP: 000000374aedb520 RSP: 00007ffc06b2c410 RFLAGS: 00010206 RAX: 0000000000000001 RBX: ffffffff8100b0d2 RCX: 0000000000000400 RDX: 0000000000000002 RSI: 00007fed7d8fc000 RDI: 0000000000000001 RBP: 00007fed7d8fc000 R8: 000000000000000a R9: 00007fed7d8f5700 R10: 00000000ffffffff R11: 0000000000000246 R12: 0000000000000002 R13: 000000374b18e7a0 R14: 0000000000000002 R15: 000000374b18e7a0 ORIG_RAX: 0000000000000001 CS: 0033 SS: 002b

INITIAL ANALYSIS - BTFor initial analysis purposes, the bt command also allows backtraces to be returned for all active tasks inthe vmcore via the "-a" flag:
crash> bt -a | grep PID -A 1PID: 2932 TASK: ffff88021d450ab0 CPU: 0 COMMAND: "bash" #0 [ffff88021da879e0] machine_kexec at ffffffff8103d1ab--PID: 0 TASK: ffff88011e679520 CPU: 1 COMMAND: "swapper" #0 [ffff880028246e90] crash_nmi_callback at ffffffff81033cf6--PID: 0 TASK: ffff88011e688040 CPU: 2 COMMAND: "swapper" #0 [ffff880028286e90] crash_nmi_callback at ffffffff81033cf6--PID: 0 TASK: ffff88011e6d0ab0 CPU: 3 COMMAND: "swapper" #0 [ffff8800282c6e90] crash_nmi_callback at ffffffff81033cf6--PID: 0 TASK: ffff88011e6f5520 CPU: 4 COMMAND: "swapper" #0 [ffff880028306e90] crash_nmi_callback at ffffffff81033cf6--PID: 0 TASK: ffff88011e704040 CPU: 5 COMMAND: "swapper" #0 [ffff880028346e90] crash_nmi_callback at ffffffff81033cf6--PID: 0 TASK: ffff88011e74aab0 CPU: 6 COMMAND: "swapper" #0 [ffff880123c06e90] crash_nmi_callback at ffffffff81033cf6--PID: 0 TASK: ffff88011e767520 CPU: 7 COMMAND: "swapper" #0 [ffff880123c46e90] crash_nmi_callback at ffffffff81033cf6--PID: 0 TASK: ffff88011e77c040 CPU: 8 COMMAND: "swapper"

INITIAL ANALYSIS - BTBased on the RIP of the process at the time of the failure, mapping the failure to code is possible.
crash> bt | awk '/#8/,/#9/' #8 [ffff88021da87d60] page_fault at ffffffff8153bf05 [exception RIP: sysrq_handle_crash+22] RIP: ffffffff81350f46 RSP: ffff88021da87e18 RFLAGS: 00010096 RAX: 0000000000000010 RBX: 0000000000000063 RCX: 0000000000000000 RDX: 0000000000000000 RSI: 0000000000000000 RDI: 0000000000000063 RBP: ffff88021da87e18 R8: 0000000000000000 R9: 00007fed7d8f5700 R10: 00000000ffffffff R11: 0000000000000246 R12: 0000000000000000 R13: ffffffff81b109a0 R14: 0000000000000286 R15: 0000000000000004 ORIG_RAX: ffffffffffffffff CS: 0010 SS: 0018 #9 [ffff88021da87e20] __handle_sysrq at ffffffff81351202
RIP
The "dis" function can be used to inspect the RIP using either the hexadecimal representation, orsymbol+offset value.
crash> dis -l sysrq_handle_crash+22<snip>/drivers/char/sysrq.c: 1300xffffffff81350f46 <sysrq_handle_crash+22>: movb $0x1,0x0
Though the above path is truncated, the above dis operation yields the source in which the system wasexecuting at the time of the failure.

INITIAL ANALYSIS - BTWith source file and line number, the Red Hat Code browser can be used to determine what operationwas underway at the time.
Within the code browser, navigating to the drivers/char/sysrq.c source file at line number 130 yields:
Red Hat Code Browserhttps://access.redhat.com/labs/psb/versions/kernel-2.6.32-573.8.1.el6/
INITIAL ANALYSIS - BTIn the event that the log output shows that there is a failure present in a task that is not in the enddefault bt command, using the bt command with the specific PID will allow a review of the current stateof that task.
For hung_task_panic events, a careful review of the current state of the task is necessary as the panictask will be the "khungtaskd" process and not the actual task that has been within Uninterruptible sleepstate for greater than 120 seconds.

INITIAL ANALYSIS - KMEMThe kmem command can be used to determine a wealth of information regarding the VMM subsystem.However, an overview of memory use can be reviewed via the "-i" flag:
crash> kmem -i PAGES TOTAL PERCENTAGE TOTAL MEM 2012387 7.7 GB ---- FREE 1911140 7.3 GB 94% of TOTAL MEM USED 101247 395.5 MB 5% of TOTAL MEM SHARED 12196 47.6 MB 0% of TOTAL MEM BUFFERS 4964 19.4 MB 0% of TOTAL MEM CACHED 38010 148.5 MB 1% of TOTAL MEM SLAB 20287 79.2 MB 1% of TOTAL MEM
TOTAL SWAP 2047999 7.8 GB ---- SWAP USED 0 0 0% of TOTAL SWAP SWAP FREE 2047999 7.8 GB 100% of TOTAL SWAP
COMMIT LIMIT 3054192 11.7 GB ---- COMMITTED 60579 236.6 MB 1% of TOTAL LIMIT
Specific types of memory starvation can be evaluated further using the kmem utility in full.

crash> kmem -z | headNODE: 0 ZONE: 0 ADDR: ffff880000015440 NAME: "DMA" SIZE: 4095 PRESENT: 3830 MIN/LOW/HIGH: 41/51/61 VM_STAT: NR_FREE_PAGES: 3926 NR_INACTIVE_ANON: 0 NR_ACTIVE_ANON: 0 NR_INACTIVE_FILE: 0 NR_ACTIVE_FILE: 0 NR_UNEVICTABLE: 0 NR_MLOCK: 0
INITIAL ANALYSIS - KMEM"kmem -s" - Slab usage
crash> kmem -s | headCACHE NAME OBJSIZE ALLOCATED TOTAL SLABS SSIZEffff88011c1d1fc0 onloadfs_inode_cache 616 1 6 1 4kffff88011c3e1f80 nfs_direct_cache 200 0 0 0 4kffff88011c3d1f40 nfs_commit_data 704 0 0 0 8kffff88011c3c1f00 nfs_write_data 960 36 36 9 4kffff88011c3b1ec0 nfs_read_data 896 0 0 0 4kffff88011c3a1e80 nfs_inode_cache 1048 1 3 1 4kffff88011c391e40 nfs_page 128 0 0 0 4kffff88011cc51e00 fscache_cookie_jar 80 3 48 1 4kffff88011cc41dc0 rpc_buffers 2048 8 8 4 4k
"kmem -z" - Per zone statistics

QUESTIONS?

twitter.com/RedHatNews
youtube.com/redhat
facebook.com/redhatinc
THANK YOU!
plus.google.com/+RedHat
linkedin.com/company/red-hat
slides available at https://people.redhat.com/pladd