karolinska institutet, 171 77 stockholm, sweden (dated
TRANSCRIPT
Intercellular communication induces glycolytic synchronization waves betweenindividually oscillating cells
Martin Mojica-Benavides,1 David D. van Niekerk,2 Mite Mijalkov,3 Jacky L. Snoep,2, 4
Bernhard Mehlig,1 Giovanni Volpe,1 Mattias Goksor,1, ∗ and Caroline B. Adiels1, ∗
1Department of Physics, University of Gothenburg, SE-41296 Gothenburg, Sweden2Department of Biochemistry, Stellenbosch University, Matieland 7602, South Africa
3Department of Neurobiology, Care Sciences and Society,Karolinska Institutet, 171 77 Stockholm, Sweden
4Molecular Cell Physiology, Vrije Universiteit Amsterdam, 1081 HV Amsterdam, The Netherlands(Dated: March 30, 2020)
Metabolic oscillations in single cells underliethe mechanisms behind cell synchronization andcell-cell communication. For example, glycolyticoscillations mediated by biochemical communica-tion between cells may synchronize the pulsatileinsulin secretion by pancreatic tissue, and alink between glycolytic synchronization anoma-lies and type-2 diabetes has been hypotesized.Cultures of yeast cells have provided an idealmodel system to study synchronization andpropagation waves of glycolytic oscillations inlarge populations. However, the mechanism bywhich synchronization occurs at individual celllevel is still an open question due to experimentallimitations in sensitive and specific handling ofsingle cells. Here, we show how the coupling ofintercellular diffusion with the phase regulationof individual oscillating cells induces glycolyticsynchronization waves. We directly measure thesingle-cell metabolic responses from yeast cellsin a microfluidic environment and characterize adiscretized cell-cell communication using graphtheory. We corroborate our findings with sim-ulations based on a detailed kinetic model forindividual yeast cells. These findings can provideinsight into the roles cellular synchronizationplay in biomedical applications, such as insulinsecretion regulation at the cellular level.
Early studies on glycolytic oscillations detected in pop-ulation measurements proposed acetaldehyde (ACA) asthe chemical mediator between oscillating yeast cells [1].ACA is a metabolite either produced by the cells them-selves [2] or externally supplied [3]. By local additionof glucose (GLC), macroscopic glycoytic synchronizationwaves can be induced [4–6] but not resolved at the single-cell level. Only recently, single-cell analysis has beenachieved by using fixed cells on coated microscope slides[7, 8] and in alginate microparticles [9]. While these ap-proaches manage to obtain biochemical information at
∗ These two authors contributed [email protected]
the single-cell level, they allow limited control on theenvironment to characterize the interaction between thecells. Recently, we have used microfluidics to preciselycontrol the flow fields, and chemical concentrations sur-rounding yeast cells. This has permitted us to externallyentrain the oscillations of single yeast cells by the periodicinjection of ACA or a respiration inhibitor i.e., cyanide(CN−) [10, 11]. The flow present in these microfluidicsystems removes cell secretions, including the ACA me-diator required to achieve cell-cell communication. Suchan approach prevents studying the process leading fromindividual cell oscillations to synchronization.
Here, we show how glycolytic synchronization wavesare induced by intercellular communication between in-dividual cells and the emergence of coupled subpopula-tion clusters. We address the process by which the dif-fusion and reaction of intercellular chemicals couple theoscillation phases of neighboring cells. To do this, we im-plement a custom-designed diffusion-limited microfluidicdevice to host a mesoscopic cell culture. While control-ling the extracellular environment to trigger the oscilla-tory behavior, we acquire biochemical information fromevery single cell. To characterize the spatio-temporal be-havior of the ensuing glycolytic synchronization, we thenemploy tools from graph theory. Finally, we test in a de-tailed kinetic model [11–13] the proposed mechanism ofcoupling between oscillatory cells leading to synchroniza-tion. We employ numerical simulations that integrate thekinetic model for the intracellular reaction network [13]with the physical geometry and hydrodynamic conditionsin the experiment. These results are potentially useful tostudy the role of cellular synchronization in biomedicalapplications, such as insulin secretion regulation.
RESULTS
Glycolytic oscillations in a microfluidic environment
We designed a microfluidic environment that permitsus to trigger and track glycolytic oscillations in an ar-ray of yeast cells (Saccharomyces cerevisiae) with singlecell resolution (see methods sections “Microfluidic device
arX
iv:1
909.
0518
7v2
[ph
ysic
s.bi
o-ph
] 2
6 M
ar 2
020
2
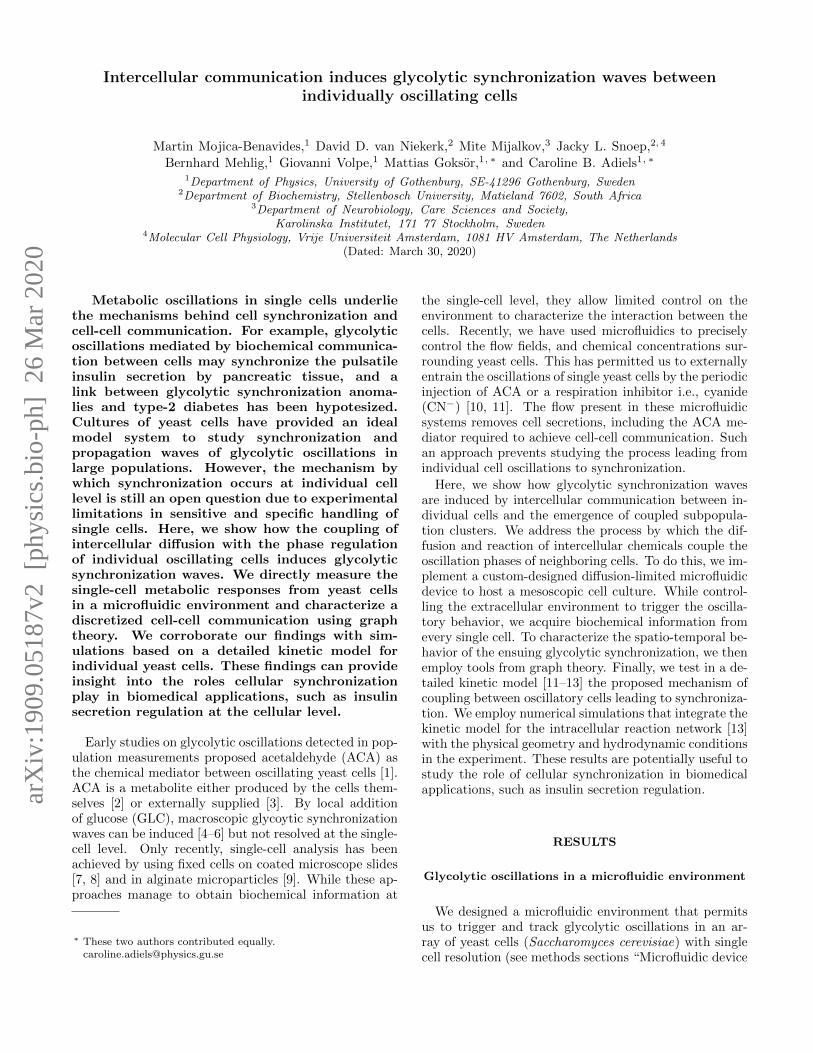
design and fabrication” and “Cell preparation”). Fig-ure 1(a) shows an image of the microfluidic chip withfive chambers, one of which is highlighted by the blackbox and zoomed-in in Figure 1(b). The use of a singlemicrofluidic device with multiple chambers permits usto load cells from a single batch and expose them to arange of stress solution concentrations in parallel, thusavoiding artifacts that might arise when performing ex-periments sequentially due to confounding factors suchas cell storing time. As shown in Figure 1(a), each cellchamber has an inlet channel (shaded in yellow), whichwe use to load the yeast cells into the chamber, and aperfusion channel (shaded in blue), which we use to ex-pose the cells to a GLC and CN− solution with variousconcentrations of CN− (indicated by the different shadesof blue). Importantly, the perfusion occurs by diffusionin quasi-static flow conditions through a series of diffu-
Figure 1. Glycolytic oscillations are affected by cell-positionin the microfluidic chamber. (a) Yeast cells from a singlebatch culture are loaded through the central yellow-shadedinlet channels of the diffusion chambers. They are then ex-posed to GLC and different concentrations of CN− (weightedblue shades) and NADH autofluorescence signals detected inindividual cells. The length bar is 200 µm. (b) Zoom-in ofa loaded cell chamber showing the individual cells’ locations.The length bar is 20 µm. (c) Processed time series of theNADH concentration at the cells color-coded in (b) for the 12mM CN− case. The intensity of the signals is shifted alongthe y-axis for visualization purposes. An NADH wave prop-agates through the cells, starting at the top of the chamber(orange cell, from about 100 s), propagating to the middle ofthe (cyan and blue cells, from about 300 s), and finally to thebottom of the chamber (red cell, from about 500 s).
sion apertures between the perfusion channel and the cellchamber, as can be seen in Figure 1(b). In this diffusion-limited cell chamber, the ACA produced by the cells isnot washed away by convection and can mediate the cell-cell interactions.
Figure 1(b) zooms in on a loaded cell chamber wherethe single yeast cells can be clearly seen. We grow, har-vest, and starve the yeast cells to obtain a strong oscilla-tory behaviour in response to GLC addition (see meth-ods section “Cell preparation”). The cells are loaded ata controlled density in all cell chambers using a precisionmulti-syringe pump. Afterwards, we inject the stress so-lutions containing 40 mM GLC with 8, 12, 16, 20 and24 mM CN− using a second multi-syringe pump. Weprovide a constant stress solution supply for 20 minutes;during this time, GLC and CN− diffuse into the cellchambers through the diffusion apertures and are pro-gressively consumed by the cells leading to the formationof a decreasing concentration gradient. GLC consump-tion is linked to the production of reduced nicotinamideadenine dinucleotide (NADH), an intermediate metabo-lite which can be detected on an individual cell basis dueto its autoflorescence. NADH show an excitation peakaround a wavelength of 340 nm and emission peak around460 nm (see supplementary video 1). The details of theexperiment are provided in the Methods section “Exper-imental procedure” and those of the signal acquisitionand analysis in the Methods section “Signal acquisitionand conditioning”.
The NADH signals of four different cells are shownin Figure 1(c) for the 12 mM CN− case. They arecolor-coded to correspond to the cells highlighted in Fig-ure 1(b). Depending on their positions in the chamber,the cells start to oscillate at different times: the orangecell is located next to a diffusion aperture and about 100 safter the stress solution injection it starts to show oscil-lations with a transient increase in the amplitude; thecyan and blue cells are located further away from the dif-fusion apertures; and they display sustained oscillationsand the amplitude increase at about 300 s; the red cell iseven further away from the diffusion apertures, and thestrong oscillations appear only after about 600 s. Theamplitudes of these NADH signals depend on the CN−
concentration [10, 13, 14], which follows the diffusion gra-dient away from the diffusion apertures: the amplitudeof the orange cell signal is smaller than those of the cyanand blue cells, which in turn are smaller than that of thered cell.
Finally, local synchronization between cells occurs be-cause of their secretion and exchange of ACA, which de-termines the local cell-cell coupling [12, 13]. For example,the cyan and blue cells are close to each other and, thus,their signals are highly synchronized for the whole dura-tion of the experiment.

3
50
100
150
200aaaaaaaaaaaaaaaaaaaaaaaaaaaaaaaaaaaaaaaaaaaaaaaaaaaaaaaaaaaaaaaaaaaaaaaaaaaaaaaaaaaaaaaaaaaaaaaaaaaaaaaaaaaaaaaaaaaaaaaaaaaaaaaaaaaaaaaaaaaaaaaaaaaaaaaaaaaaaaaaaaaaaaaaaaaaaaaaaaaaaaaaaaaaaaaaaaaaaaaaaaaaaaa
0
0.5
1
50
100
150
bbbbbbbbbbbbbbbbbbbbbbbbbbbbbbbbbbbbbbbbbbbbbbbbbbbbbbbbbbbbbbbbbbbbbbbbbbbbbbbbbbbbbbbbbbbbbbbbbbbbbbbbbbbbbbbbbbbbbbbbbbbbbbbbbbbbbbbbbbbbbbbbbbbbbbbbbbbbbbbbbbbbbbbbbbbbbbbbbbbbbbbbbbbbbb
0
0.5
1
50
100
150
ccccccccccccccccccccccccccccccccccccccccccccccccccccccccccccccccccccccccccccccccccccccccccccccccccccccccccccccccccccccccccccccccccccccccccccccccccccccccccccccccccccccccccccccccccc
200 400 600 800 1000 1200
0
0.5
1
Figure 2. Coupling between the glycolytic signals of the singlecells. Instantaneous phases (-π to π) of the NADH autofluo-rescent signals for all cells (top panels) and normalized orderparameter r(t) (bottom panels) when glycolytic oscillations inyeast cells are triggered using (a) 12 mM, (b) 16 mM and (c)20 mM CN− combined with 40 mM GLC. (a-b) At interme-diate CN− concentrations, the instantaneous phases featureglobal patterns across the cell array corresponding to the peri-ods when r(t) ≈ 1 maxima of the order parameter, suggestiveof a spatio-temporal synchronization. (c) At high CN− con-centrations, this synchronization is lost, reflected in the lowvalues of the order parameter.
Synchronization analysis
For the synchronization analysis of the NADH signals,we extract instantaneous phases of the discrete Hilberttransforms of the time series. (color-coded phase plotsin Figure 2). From these phases, we calculate the time-dependent order parameter r(t) normalized between 0and 1, which measures the overall degree of synchrony ofthe cell array (lower plots in Figure 2) [15] (see methodssection “Synchronization analysis”).
When the concentration of CN− in the stress solutionis sufficiently high (12 mM, Figure 2(a), and 16 mM, Fig-ure 2(b)), the majority of the cells exhibit sustained os-cillatory behaviour and synchronization, which is shownby the fact that r(t) is consistently very close to 1. Inboth cases, r(t) features some minima, which reflect tem-porary incoherent behavior between the oscillating cells.
When the CN− is even higher (20 mM CN−, Fig-ure 2(c)), the cells still oscillate but the phase plotdoes not show any global synchronization between them,which is reflected in the fact that r(t) is consistentlysmaller than 1 and fluctuates for the whole duration ofthe experiment. This suggests the absence of local cou-pling between cells, that the ACA lowering due to bindingby cyanide weakens the local coupling to such an extentthat it cannot lead to global synchronization. The casesfor 8 mM and 24 mM CN− are shown in SupplementaryFigure 2.
Synchronization communities
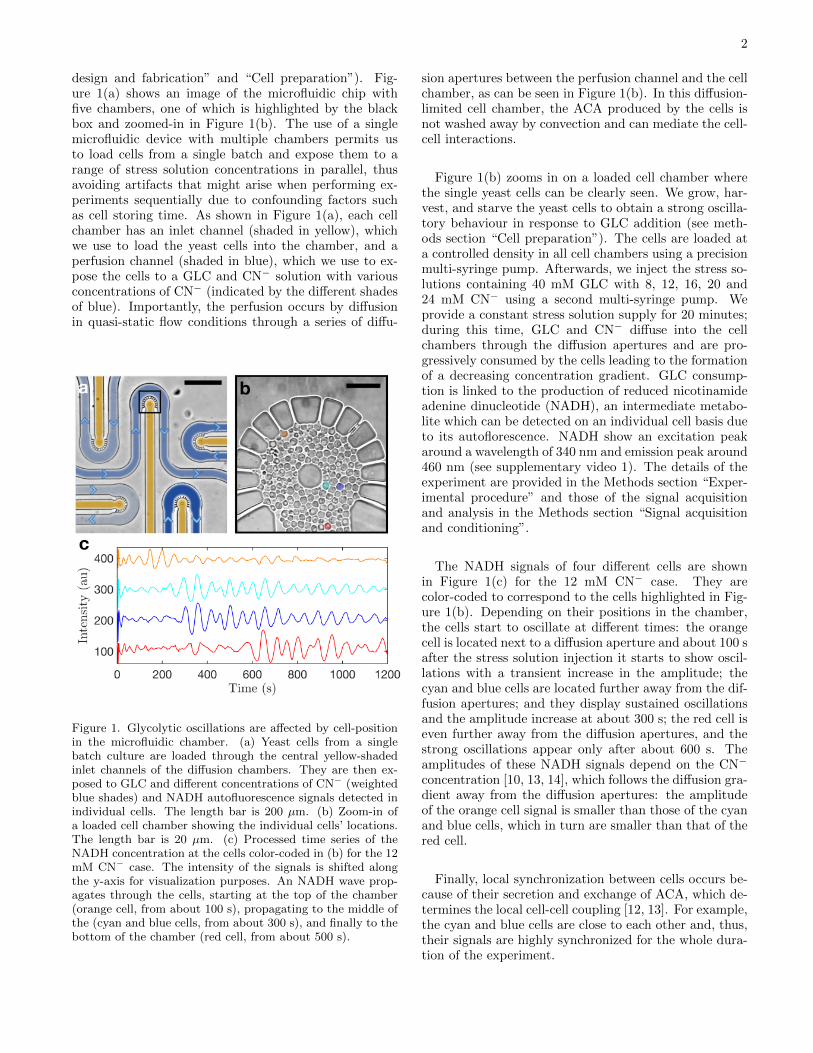
To test for the existence of locally synchronized com-munities within the population, we make use of graphtheory and community analysis (see methods section“Graph construction and community analysis”). Usinga technique that is commonly employed in studying con-nectivity between brain regions [16], we determine thecoupling strength between cells based on the degree ofsynchrony in their glycolytic signals. The resulting graphcan be represented as a series of nodes (cells) and edges(correlation) (Figure 3(a)) or, more conveniently for anal-ysis purposes, as an adjacency matrix (Figure 3(b)),which is a square matrix where each entry representsthe strength of the connection between the nodes cor-responding to its row and column indices.
A graph can be divided into communities so that thenodes within each community are more strongly con-nected with each other than with the rest of the graph.We identify the communities using the Louvain algorithm[17]. For example, we show the color-coded communitieson the schematic of the graph in Figure 3(a) and on theadjacency matrix in Figure 3(b).
Figures 3(c-e) show the adjacency matrices and thecorresponding communities overlaid on the cell imagesfor cell arrays exposed to different CN− concentrations.When exposed to 12 mM CN− (Figure 3(c)), three well-defined communities form. The community in yellow
4
Figure 3. Synchronization communities. (a) From the NADH autofluorescent signals of the cells, we construct a graph whereeach cell is a node, and the correlation between the signals of two cells is a measure of their connection strength. In theresulting graph, it is possible to identify communities of cells (colored subgraphs) that are well connected with each other,but poorly connected to cells belonging to different communities. (b) Such community structure is reflected in the adjacencymatrix representing the graph. Note that the order of the nodes has been rearranged to more clearly highlight the communitystructure. (c-e) Adjacency matrices and corresponding communities overlaid on the images of the corresponding cell arrays for(c) 12 mM, (d) 16 mM and (e) 20 mM CN−.
covering half of the circular chamber is radially exposedto the stress solution through the diffusion apertures.Hence, these cells experience simultaneous triggering ofthe oscillations. The community in red is triggered by theresulting concentration of the stress solution that passesthrough the yellow community and the lateral diffusionapertures. Consequently, the oscillations appear with adelay in respect to those of the yellow community. Fi-nally, the cells in blue are not directly exposed to thediffusion apertures. This community shows the longestdelay and will be exposed to lower concentrations of GLCand CN−. Each of the communities remains synchro-nized due to the local exchange of ACA.
When the CN− concentration is increased to 16 mM(Figure 3(d)), the boundaries between the communitiesbecome less defined. The yellow community (top half) forms similarly to the 12 mM scenario. However, asecond community (red) appears with scattered cells atdifferent locations in the top half of the cell chamber.This can be explained by the mentioned uncoupling effect
that higher concentrations of CN− can produce betweenneighboring cells, despite the fact that the oscillations aretriggered simultaneously. With a less defined boundary,a third community (blue) appears where cells are notexposed to diffusion apertures. Interestingly, one of thediffusion apertures in this specific cell chamber (bottom-right in Figure 3(d)) is obstructed, and this deforms theresulting community, confirming its dependence on thedirect diffusion of the stress solution. At 20 mM CN−
(Figure 3(e)) consumption of ACA is so high that thecells display uncorrelated behavior, and the communitystructure breaks down.
Glycolytic synchronization waves
Supplementary video 1 shows the NADH autofluores-cence spatio-temporal distribution across the cell array.We characterize the arising glycolytic wave by calculat-ing the delayed cross-correlation between the NADH sig-
5
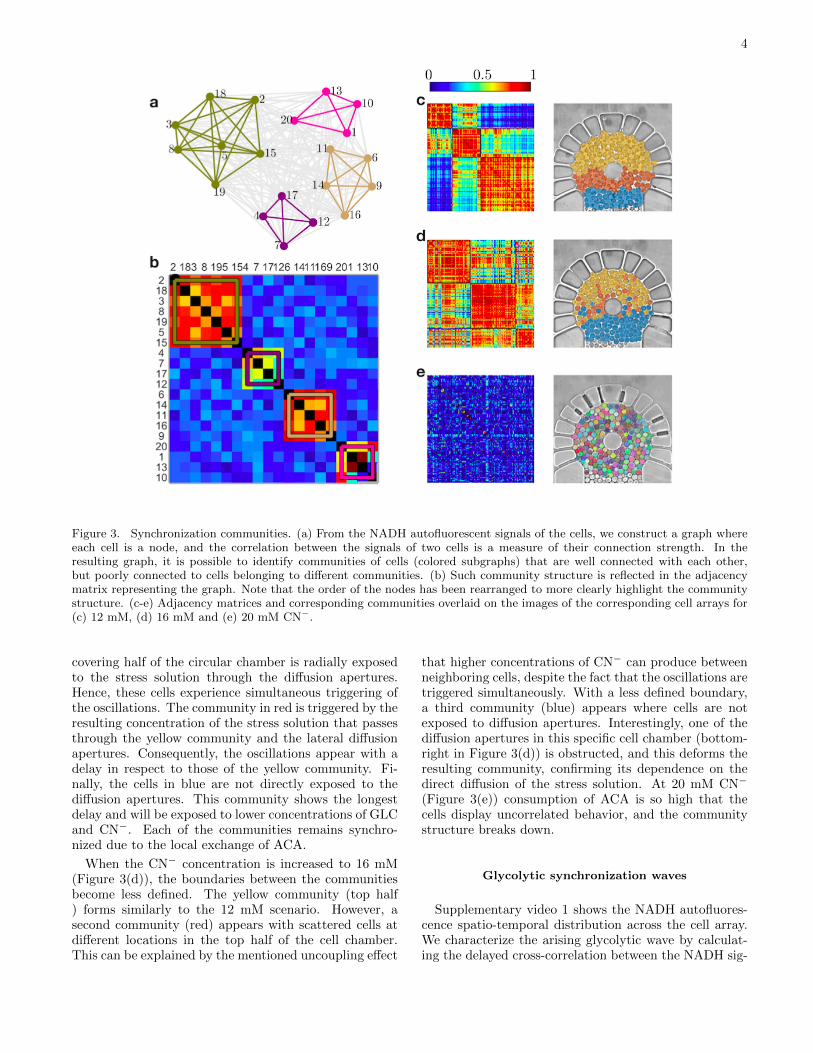
Figure 4. Propagation of a glycolitic synchronization wave. Average delayed correlations between a community of synchronizedcells (marked with black rings) and every cell present in the chamber (red circles) for a cell array exposed to 12 mM CN−.The delayed Pearson correlations are calculated with delays from -20 s to +20 s and feature a series of maxima that propagatefrom top to bottom. The shape of this glycolytic wave depends on the chemical diffusion profiles of stress solution and secretedmetabolites, and it is influenced by the geometrical constraints of the device.
nals in a community of cells identified with the modu-larity analysis (black rings in figure 4), and the rest ofthe cell array (see methods section “Graph constructionand community analysis”). The wavefront propagation isthen displayed as a relative measure with respect to oneof the communities obtained at zero delay. Hence, thegradual increase in each cell correlation level translatesinto a reduction of the phase difference between the celland the reference community. The obtained wave there-fore describes the transition between the communities asa function of their relative delays, giving a phase relationbetween them.
Figure 4 shows the spatio-temporal evolution of a syn-chronization wave propagating in a cell array exposed to12 mM CN−. The high values of the normalized cross-correlations (dark red) travel from the region mostly ex-posed to the diffusion apertures, to the region containingthe cells further away from the direct exposure to thestress solution. It can be noticed that at zero delay thecells in the reference community (black rings) give an ap-proximate profile of the propagating wavefront. Due tothe cell heterogeneity and the discrete nature of the cellmonolayer, local cell-cell interactions show small varia-tions in the wavefront shape. However the overall syn-chronization wave can be tracked despite these devia-tions.
Simulations
We simulate a 2D array of cells with the same struc-ture as the experimental one. We calculate the time-dependent concentrations of GLC, CN−, ACA andethanol (ETOH) (see supplementary video 2) togetherwith all the intracellular metabolites.
To test the ACA coupling, we used a previously pub-lished detailed enzyme mechanistic model [13] to sim-ulate glycolysis in each cell as a set of ordinary differ-ential equations. Transport and diffusion of extracel-lular metabolites were simulated using partial differen-
tial equations with the physical characteristics of the mi-crofluidic chamber determining the boundary conditions.(see methods section “Numerical simulations”). We thenextract the glycolytic signals (NADH concentration) foreach cell and analyze them as in the experimental data(synchronization analysis and community structure anal-ysis). Supplementary Figure 1 shows the NADH instan-taneous phase distribution and the community structurefor the simulated cases of 20, 24 and 28 mM CN−. As theCN− concentration is increased, the communities showless defined boundaries, in good agreement with the ex-periments (Figure 3), albeit that higher cyanide concen-trations were used in the simulations. High CN− con-centrations only induce transient oscillations leading toa steady state (Supplementary Figures 1(b-c)).
The simulated time-dependent ACA distribution forexternal and internal concentrations (see supplementaryvideo 2) reflect an adaptation to travelling waves. Theinitial oscillations display uncorrelated behaviour thatgradually transforms to periodic propagations across thecell array. The simulation results are in good agreementwith the experimental results although wavefronts in thesimulations show a more continuous profile than is ob-served in the experimental data. This is most likely dueto an incomplete capture of cellular heterogeneity in themodel.
The high external GLC concentration supply (40 mM)induces a fast diffusion until homogeneous covering ofthe complete monolayer (see supplementary video 3). Incontrast, the diffusion of CN− shows a quasi-constantdistribution profile to which the ACA wavefront shapesadapt. The periodic fluctuations given by the externalACA and CN− reaction show negligible influence on theCN− levels as it has a much higher absolute concentra-tion.
6
DISCUSSION
We presented a three part methodology to study thecoupling between individually oscillating cells in yeastat a single-cell level. First we detected the single-cellmetabolic responses from yeast cells in a microfluidicdevice. Second, we identify synchronized communitiesand track the synchronization waves using graph theory.Third, the underlying mechanism for cell-cell communi-cation was tested in a validated mechanistic model forindividually oscillating yeast cells, where each glycolyticnetwork is linked to the architecture and physics of themicrofluidic system.
We have shown that the lateral metabolic coupling be-tween individual cells can induce metabolic synchroniza-tion waves. The implemented microfluidic device permitsus to control the concentration of extracellular chemi-cals required to trigger glycolytic oscillations, ensuringa constant supply of GLC and CN− by direct diffusion.After addition of the stress solution, the start of oscil-lations in individual cells is dependent on the positionof cells in the cell chamber. The spatial distribution ofCN− concentration influences the overall degree of syn-chronization, which is reflected in the time-evolution ofthe extracted instantaneous phases and order parameter.Furthermore, even in the presence of low overall values ofsynchronization, there can be communities of cells thatare synchronized at the local level, which we have iden-tified using graph theory analysis.
Our findings corroborate the observations of previousstudies on macroscopic glycolytic waves [5, 6, 18] and ex-plain these waves in terms of metabolic coupling betweenindividually oscillating cells. In [11] it was demonstrated,through experimental observation and analyses using adetailed mechanistic model, that single oscillating cellscan adapt their phases to external ACA signals. Thesesignals are transduced through the system of cofactorswhich regulates the activity of phosphofructokinase andleads to the correct movement of the phase to allow forsynchronization. Here we show that the spatio-temporaldynamics of synchronization waves in a population arewell-described by the same detailed mechanistic model(constrained to the physical conditions of the cells in themicrofluidic chamber) showing that the proposed ACAcoupling between the cells is sufficient for the observedcollective behaviour.
The method we developed allows for the combinationof detailed mechanistic models at single cell level, withthe experimental analyses of collective synchronized re-sponses at the population level. Such an approach canalso be used for studying the spatio-temporal dynamicspresent during insulin production by pancreatic β cells[19–22]. Furthermore, the presented analysis can be ap-plicable to other biological systems that display synchro-nization of individual oscillators e.g. wave propagation inthe heart leading to muscle contraction and synchronizedoscillatory phenomena in groups of neurons.
METHODS
Microfluidic device design and fabrication
Each chamber where the cells are loaded (diameter55 µm, height 5 µm, Figure 1(b)) is surrounded by a se-ries of diffusion apertures (width 2 µm). These diffusionapertures are connected to a perfusion channel (width65 µm, weighted blue shades in Figure 1(a)), where thestress solution flows through inlet and outlet channels(width 50 µm). A cylindrical pillar (diameter 3 µm) isplaced at the center of the chamber to prevent the cham-ber ceiling from bending.
Silicon molding masters are fabricated using pho-tolithography. A negative photoresist (SU-8 3005, Mi-croChem Corp., Newton, MA, USA) is spin-coated(3500 rpm, 30 s), soft-baked (2 minutes at 65◦C; 3 min-utes at 95◦C), UV-exposed (15 mW cm−2 for 10 s (SussMicroTec SE., Garching, Germany) under HardContactpressure mode), post-exposure-baked (3 minutes at 65◦C;4 minutes at 95◦C), and developed (2 minutes, SU-8 de-veloper mr-Dev 600, Micro resist technology GmbH).
For the molding procedure, we have followed the es-tablished procedure described in Ref. [23]. Briefly, poly-dimethylsiloxane (PDMS) is homogeneously mixed witha curing agent (Sylgard 184 Silicone Elastomer Kit, DowCorning Corp. Seneffe, Belgium) in a 15:1 ratio. Themixture is degassed using a vacuum dessicator (30 min-utes), poured onto the master, and baked (3 hours at90◦C). The resulting PDMS structure is covalently bondto a cover glass (thickness No. 1 (0.13 to 0.16 mm),45×60 mm, HECH990/6045, VWR) using oxygen plasma(40 s, PDC-32G, Harric Plasma).
Cell preparation
The yeast cell strain used in the experiments is X2180Saccharomyces cerevisiae. Single colonies are grown fol-lowing the same protocol used in Refs. [24, 25]. The cellsare grown in a carbon source medium containing 10 g L−1
GLC, 6.7 g L−1 yeast nitrogen base (YNB), and 100 mMof potasssium phthalate at pH 5. The suspensions arecultured in a rotary shaker at 30◦C until GLC depletionin the media. To achieve the diauxic shift (GLC starvedand switched to a slower exponential growth), the cellsare washed and starved in 100 mM potassium phosphate(pH 6.8) for 3 more hours in the rotary shaker at 30◦C.Finally, in order to maintain the cells in the diauxic shift,they are washed and stored at 4◦C until the experiments.
Experimental procedure
Cells are loaded into the five cell chambers using 250 µLglass syringes connected via polytetrafluoroethylene tub-ing (inner diameter 0.012 in, Cole-Parmer, Vernon Hills,IL, USA). In order to obtain equal cell densities, the cell

7
solution is introduced via equal length microfluidic pathsand flow rates (40 nL/min ) until the cell chambers arefilled. After cell loading, the experiment is initiated withthe injection of 40 mM GLC and 8 mM, 12 mM, 16 mM,and 24 mM CN− stress solutions, which circulate in theperfusion channel surrounding around each cell chamberat 25 nL min−1. This perfusion flow remains constant forthe 20 minutes corresponding to the complete experimen-tal acquisition. The cell loading and stress injection areperformed using a precision multi syringe pump (CMA400, CMA Microdialysis, Solna, Sweden).
Signal acquisition and conditioning
Image acquisition is performed using an inverted micro-scope (DMi 6000B; Leica Microsystems, Wetzlar, Ger-many) with a 100×, NA=1.33 oil-immersion objective inan epifluorescence configuration. In order to measure theNADH autofluorescence intensity fluctuations, a 350/54excitation filter and a 415/64 emission filter (DAPI set)are used together with a 15 W mercury short-arc reflectorlamp (EL6000, Leica Microsystems, Wetzlar, Germany)[26]. An EMCCD camera (C9100-12, Hamamatsu Pho-tonics, Shizuoka, Japan) is used with an exposure time of400 ms. Images are acquired every 2 s for a total period of20 minutes using an automatized illumination, position-ing, and acquisition routine programed using OpenLab(PerkinElmer, Waltham, MA, USA).
The time series for the individual cells are obtainedfrom the NADH autofluorescence images. For each celland frame, the average intensity xn(t) of cell n is com-puted over the region of interest (ROI) corresponding tothe cell area. Using MATLABR©, a background signal anda running averages of 55 data points are subtracted fromthe signal to reduce noise and short-term fluctuations.
Synchronization analysis
Starting from the glycolythic signals xn(t), the phase ofcell n is calculated as
Φn(t) = arctan
[H(xn)(t)
xn(t)
], (1)
where H(xn)(t) is the Hilbert transform of xn(t) evalu-ated with the MATLABR© built-in function. These dataare shown in Figure 2 and Supplementary Figure 1(a-c)for the experimental and simulated signals, respectively.
To evaluate synchronization, as standardized in previ-ous works [8, 10], the time-dependent order parameterr(t) is obtained from the expression:
r(t) =
∣∣∣∣∣ 1
N
N∑n=1
e−iΦn(t)
∣∣∣∣∣ , (2)
where N is the number of cells in the cell chamber and
Φn is the instant phase for each yeast cell. The orderparameter is normalized between 0 and 1. When r(t) islarge, the individual cells’ phases are synchronized; whenr(t) is small, there is high heterogeneity in the individualcell phases [27, 28]. The degree of synchrony is character-ized with r values from 0 to 1 where low order parametertranslates into high heterogeneity in the instant phases.
Graph construction and community analysis
By using graph theory, all the oscillating cells are con-sidered as nodes of a network with connections weightedby the correlation of their signals. Synchronization dis-tribution can then be characterized in terms of the for-mation of cell communities showing higher coherence intheir signals.
The community structure algorithms aim to optimizethe modularity, a measure of the quality of the commu-nity division of the network. In short, modularity mea-sures the density of the connections within a communityand compares it with what it would be in a given randomnetwork. The more positive modularity indicates a betterdivision of the network into communities. The Louvainalgorithm approaches the problem of modularity maxi-mization by iteratively grouping single nodes into com-munities. It starts by assigning each node in the networkto a separate community. By changing the communityparticipation of a node and its neighbors, it optimizes themodularity locally throughout the network. This resultsin having some community structure in the network. Inthe second step, these communities become nodes, andthe first step of local modularity maximization is reap-plied. These two steps are repeated until the maximummodularity is obtained and there are no changes in modu-larity values with any new iteration. Finally, the commu-nity organization of the step with maximal modularity istaken to be the real and final community of the network.
By setting a threshold in the correlation coefficient of0.7, subgroups of cells showing synchronized behaviorare obtained for the different concentration ratios in thestress solution. The functions to perform this processare adapted from the MatLab-based software BRAPH[16]. A correlation adjacency matrix weighted with thecorrelation coefficients can be constructed by rearrangingthe node indices in subgroups showing higher connectiv-ity. The indices assigned to each community can then bemapped based on their original location in the cell arrayand display the community spatial distribution.
To map the spatial distribution of the phase in formof wavefronts propagating across the cell array, the av-erage correlation coefficient is calculated between eachcell signal and a reference synchronization community atdifferent delays.

8
Numerical simulations
The numerical simulations combine a kinetic model forsingle-cell glycolysis [12] with the geometrical and hydro-dynamical conditions given by the cell arrangement in themicrofluidic chip. The flow velocity field and the concen-tration gradients through the device are calculated usingthe finite-element based interpolation software COMSOLMultiphysics (COMSOL Inc., Burlington, MA, USA).The device geometry is defined with no-slip boundaryconditions, and the nodes for the numerical interpolationare generated using the ”Extra fine”, Physics controlledmesh mode. The fluid inside the device design is consid-ered as Newtonian and incompressible, which obeys theNavier-Stokes equation for the stationary case:
ρ(u · ∇)u = −∇p+ η∇2u + f (3)
Where u is the flow velocity, f represents body forcedensities –which are negligible for this case–and the con-stants ρ and η are the density and dynamic viscosity re-spectively corresponding to water at room temperature;finally, p represents the pressure [29]. The density anddynamic viscosity of the fluid is considered as the prede-fined for water by the software. To simulate the chemicaltransport and distribution, the time-dependent concen-tration gradients are calculated in order to follow diffu-sion across the cell chamber. The relation describing theprocess is given by the convection-diffusion equation:
δc
δt= −∇ · (−D∇c+ cu) (4)
Here, c is the concentration and D is the diffusion coeffi-cient. The stress solution contained GLC and CN− withdiffusion coefficients of 6.7x10⁻¹⁰ m2/s and 20.7x10⁻¹⁰
m2/s, respectively. In addition, the concentration gra-dients are calculated for the time-dependent secretionsof ETOH and ACA from the cells, with diffusion coeffi-
cients of 1.15x10⁻⁹ m2/s and 1.3x10⁻⁹ m2/s respectively.Initial concentrations in the chamber are defined withthe minimum values required to guarantee the oscilla-tory state of all the cells [24], with 5 mM CN− , 9 mMGLC, 1x10⁻⁶ mM ACA and 1x10⁻⁶ mM ETOH.
A total of 210 circular boundaries are defined with sizesin the range of yeast cells at different ages –between 4 µmand 10 µm –and are distributed inside the chamber de-sign in a dense monolayer to emulate the experimentalconditions. Global definitions of the membrane diffu-sion coefficients are assigned for ETOH, ACA, and CN−
with values of 5.88x10⁻¹² m2/s, 5.87x10⁻¹² m2/s and5.88x10−12 m2/s respectively. On the other hand, Diffu-sion coefficients inside the cells are defined high enough(1 m2/s) to consider the chemical concentrations to behomogenous and obtain single values for each cell ge-ometry. The kinetic model previously described for in-dividual cells in a microfluidic device [11, 12, 24, 30] isimplemented to calculate the metabolite concentrationsinside the cells as well as the secretions of ACA andETOH in the chamber. For these calculations, the GLCand CN− total exposure is defined by the convection-diffusion equation in combination with the lactonitrileformation from the reaction of CN− with ACA [1, 31].The initial concentrations inside the cells are defined witha global initial intracellular GLC level of 3 mM and aheterogeneity of 10 different values of initial CN− , ACAand ETOH. Similarly, 10 different initial values are as-signed for all the metabolites taking place in the or-dinary differential equations along the metabolic path-way. The reaction rates taking place inside the cellsare defined for each of the circular domains for GLC,CN− , ACA, and ETOH (for details on all the rateequations see the interactive online model applicativein https://jjj.bio.vu.nl/models/gustavsson5/simulate/).The resulting concentrations are tracked in time by in-dividual probes inside each cell and in the extracellularmedia.
[1] Betz, A. & Becker, J. U. Phase dependent phase shiftsinduced by pyruvate and acetaldehyde in oscillating nadhof yeast cells. Journal of Interdisciplinary Cycle Research6, 167–173 (1975).
[2] Richard, P., Bakker, B. M., Teusink, B., Van Dam, K.& Westerhoff, H. V. Acetaldehyde mediates the synchro-nization of sustained glycolytic oscillations in populationsof yeast cells. European Journal of Biochemistry 235,238–241 (1996).
[3] Danø, S., Madsen, M. F. & Sørensen, P. G. Quantitativecharacterization of cell synchronization in yeast. Proceed-ings of the National Academy of Sciences of the UnitedStates of America 104, 12732–12736 (2007).
[4] Jacobsen, H., Busse, H. & Havsteen, B. Spontaneousspatio-temporal organization in yeast cell suspension.Journal of Cell Science 43, 367–377 (1980).
[5] Bolyo, J., Mair, T., Kuncova, G. & Hauser, M. J. Spa-
tiotemporal dynamics of glycolytic waves provides newinsights into the interactions between immobilized yeastcells and gels. Biophysical Chemistry 153, 54 – 60 (2010).
[6] Schutze, J., Mair, T., Hauser, M. J., Falcke, M. & Wolf,J. Metabolic synchronization by traveling waves in yeastcell layers. Biophysical Journal 100, 809 – 813 (2011).
[7] Weber, A., Prokazov, Y., Zuschratter, W. & Hauser, M.J. B. Desynchronisation of glycolytic oscillations in yeastcell populations. PLOS ONE 7, 1–8 (2012).
[8] Weber, A., Prokazov, Y., Zuschratter, W. & Hauser, M.J. B. From Synchronised to Desynchronised GlycolyticOscillations in Individual Yeast Cells, 239–254 (SpringerInternational Publishing, Cham, 2018).
[9] Amemiya, T. et al. Collective and individual glycolyticoscillations in yeast cells encapsulated in alginate mi-croparticles. Chaos: An Interdisciplinary Journal ofNonlinear Science 25, 064606 (2015).
9
[10] Gustavsson, A.-K., Adiels, C. B., Mehlig, B. & Goksor,M. Entrainment of heterogeneous glycolytic oscillationsin single cells. Scientific Reports 5, 9404 EP – (2015).
[11] van Niekerk, D. et al. Phosphofructokinase controls theacetaldehyde induced phase shift in isolated yeast gly-colytic oscillators. Biochemical Journal (2019).
[12] du Preez, F. B., van Niekerk, D. D., Kooi, B., Rohwer,J. M. & Snoep, J. L. From steady-state to synchronizedyeast glycolytic oscillations i: model construction. TheFEBS Journal 279, 2810–2822 (2012).
[13] Gustavsson, A.-K. et al. Allosteric regulation of phospho-fructokinase controls the emergence of glycolytic oscilla-tions in isolated yeast cells. FEBS Journal 281, 2784–2793 (2014).
[14] Hynne, F., Dano, S. & Sorensen, P. G. Full-scale modelof glycolysis in saccharomyces cerevisiae. Biophys Chem94, 121–163 (2001).
[15] Strogatz, S. H. From kuramoto to crawford: exploringthe onset of synchronization in populations of coupledoscillators. Physica D Nonlinear Phenomena 143, 1–20(2000).
[16] Mijalkov, M., Kakaei, E., Pereira, J. B., Westman, E. &Volpe, G. Braph: A graph theory software for the anal-ysis of brain connectivity. PLOS ONE 12, 1–23 (2017).
[17] Blondel, V. D., Guillaume, J.-L., Lambiotte, R. & Lefeb-vre, E. Fast unfolding of communities in large networks.Journal of Statistical Mechanics: Theory and Experiment2008, P10008 (2008).
[18] Bagyan, S. et al. Glycolytic oscillations and waves in anopen spatial reactor: Impact of feedback regulation ofphosphofructokinase. Biophysical Chemistry 116, 67 –76 (2005).
[19] Chou, H. F., Berman, N. & Ipp, E. Oscillations of lactatereleased from islets of langerhans: evidence for oscillatoryglycolysis in beta-cells. American Journal of Physiology-Endocrinology and Metabolism 262, E800–E805 (1992).
[20] Merrins, M. J., Van Dyke, A. R., Mapp, A. K., Rizzo,M. A. & Satin, L. S. Direct measurements of oscilla-tory glycolysis in pancreatic islet -cells using novel flu-orescence resonance energy transfer (fret) biosensors for
pyruvate kinase m2 activity. Journal of Biological Chem-istry 288, 33312–33322 (2013).
[21] Tornheim, K. Are metabolic oscillations responsible fornormal oscillatory insulin secretion? Diabetes 46, 1375–1380 (1997).
[22] Bertram, R., Sherman, A. & Satin, L. S. Metabolic andelectrical oscillations: partners in controlling pulsatile in-sulin secretion. Am J Physiol Endocrinol Metab 293,E890–900 (2007).
[23] K., S., E., E. & Goksor, M. Acquisition of single celldata in an optical microscope. Lab on a Chip Technology:Biomolecular Separation and Analysis 151–166 (2009).
[24] Poulsen, A. K., Petersen, M. Ø. & Olsen, L. F. Singlecell studies and simulation of cell–cell interactions usingoscillating glycolysis in yeast cells. Biophysical Chemistry125, 275 – 280 (2007).
[25] Richard, P., Teusink, B., Westerhoff, H. V. & van Dam,K. Around the growth phase transition s. cerevisiae’smake-up favours sustained oscillations of intracellularmetabolites. FEBS Letters 318, 80 – 82 (1993).
[26] Patterson, G. H., Knobel, S. M., Arkhammar, P., Thas-trup, O. & Piston, D. W. Separation of the glucose-stimulated cytoplasmic and mitochondrial nad(p)h re-sponses in pancreatic islet cells. Proceedings of the Na-tional Academy of Sciences 97, 5203–5207 (2000).
[27] Kuramoto, Y. Self-entrainment of a population of cou-pled non-linear oscillators. In Araki, H. (ed.) Interna-tional Symposium on Mathematical Problems in Theoret-ical Physics, 420–422 (Springer Berlin Heidelberg, Berlin,Heidelberg, 1975).
[28] Shinomoto, S. & Kuramoto, Y. Phase transitions in ac-tive rotator systems. Progress of Theoretical Physics 75,1105–1110 (1986).
[29] Tabeling, P. Introduction to Microfluidics (Oxford Uni-versity Press, New York, USA, 2005).
[30] Gustavsson, A.-K. et al. Sustained glycolytic oscillationsin individual isolated yeast cells. FEBS Journal 279,2837–2847 (2012).
[31] Yates, W. & Heider, R. The dissociation of lactonitrilein aqueus solution. J. Am. Chem. Soc. 74 (1952).

10
Supplementary Figure 1. The kinetic model for single cells predicts the formation of synchronization communities. The 210simulated cells using the Gustavsson model under the boundary conditions that resembled the experiments, display coupledoscillatory behaviour in the metabolites present through the individual glycolytic pathways. For the CN− concentrationsin the stress solution of (a) 20 mM, (b) 24 mM and (c) 28 mM, NADH instantaneous phases (from -π to π) showed themost distinguishable cases of synchronization distribution across the cell array. (d)- (f) The weighted matrices with Pearsoncorrelation coefficients from 0 to 1 underline the synchronization communities, that emerge shaped by the diffusion gradientsfrom the geometrical conditions. In contrast with the experimental results, a steady state was achieved more homogeneusly ascells were exposed to the higher CN− concentrations, resulting into new non-oscillating communities. Community colors areassigned randomly.

11
Supplementary Figure 2. Synchronization analysis and community structure for the experimental cases of 8 mM and 24 mM ofCN−. (a) For concentrations sufficiently low, glycolytic oscillations are less sustained. Despite the fact that the order parameterr can show higher values, oscillations not necessarily correspond to the glycolytic cycle. (b) Significantly high concentrationsof CN− induce uncorrelated behaviour among the cells as can be noticed from the low values of the order parameter r. (c-d)Present the community structures for these two extreme experimental cases, where the 8 mM case reveal larger communitiesdue to the high presence of secreted ACA. On the other hand in the 24 mM case, a higher amount of ACA is consumed by thebinding with CN− resulting in an undefined community structure. Community colors are assigned randomly.