kaombo; a new methodology to validate as built thermal
TRANSCRIPT
NOVOTEL LONDON WEST • LONDON, UNITED KINGDOM • 2-4 APRIL 2019
Kaombo; A new methodology to validate
as built thermal performances
Xavier HENNEUSE - Julien ROLLAND
TechnipFMC – TOTAL E&P Angola
© M C E D e e p w a t e r D e v e l o p m e n t a n d G u l f Q u e s t L L C
©opyright: TOTAL
2
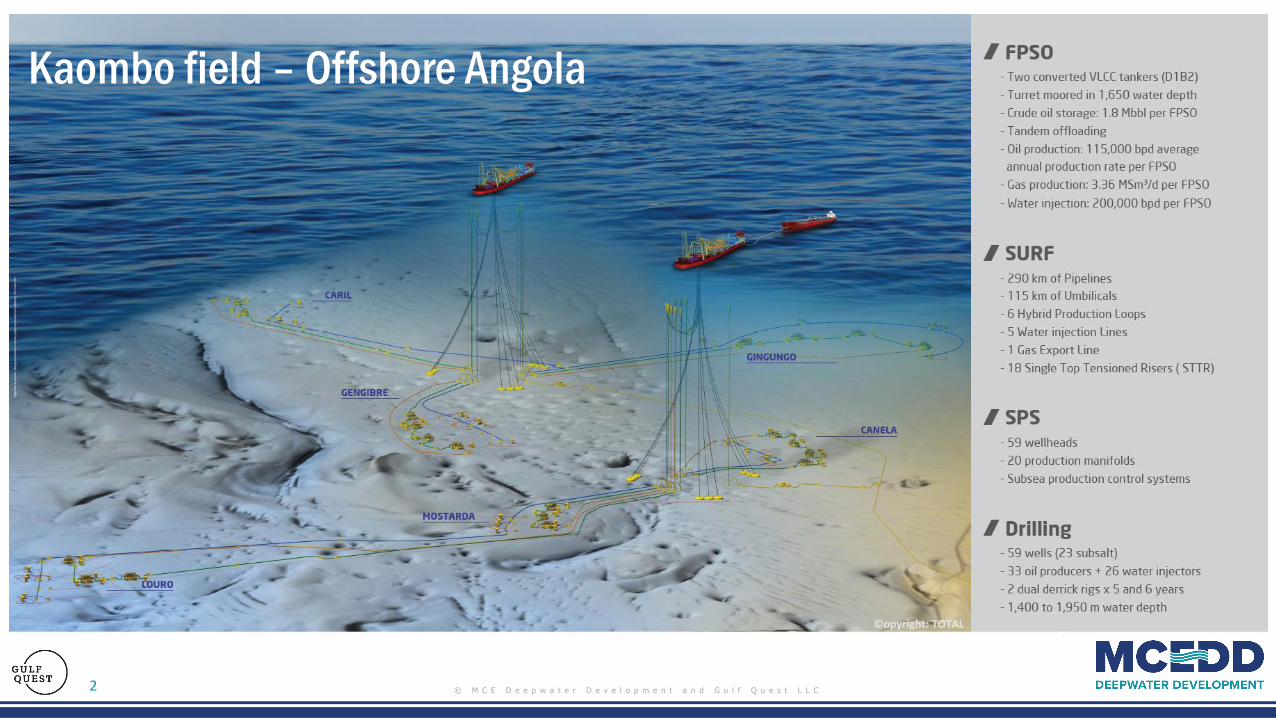
Kaombo field – Offshore Angola
© M C E D e e p w a t e r D e v e l o p m e n t a n d G u l f Q u e s t L L C3
Kaombo fields – Production in challenging environment
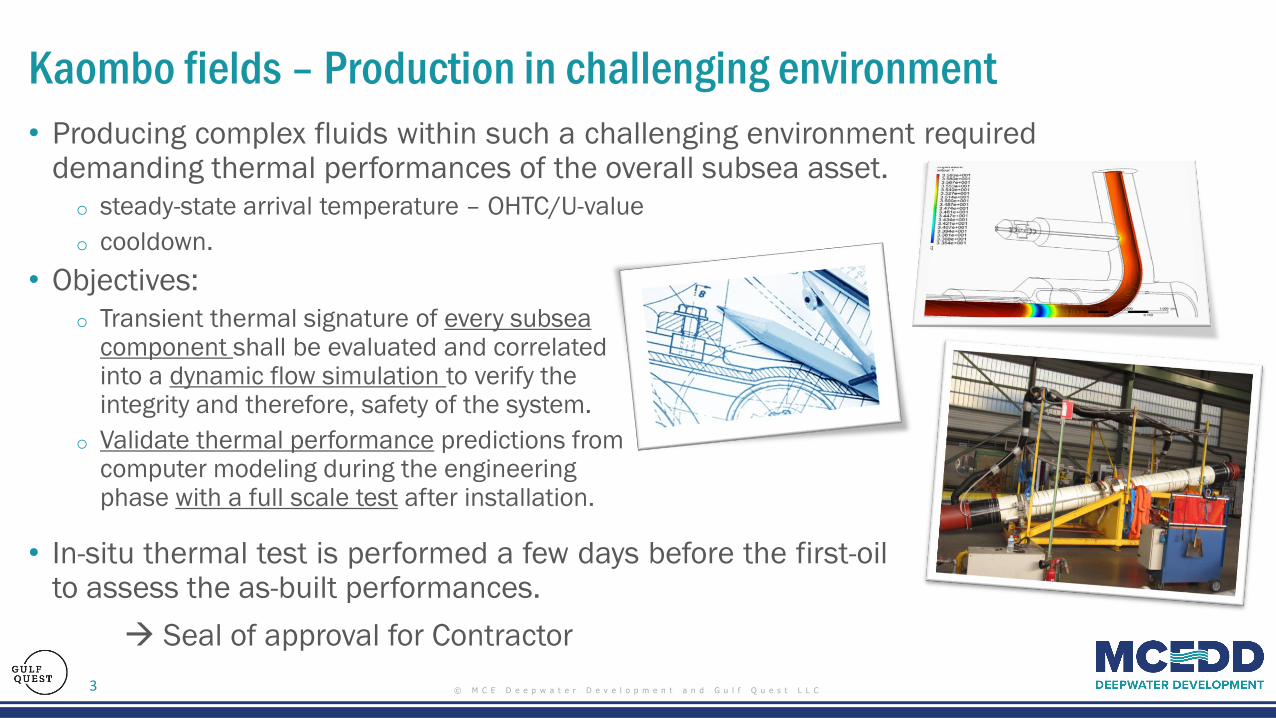
• Producing complex fluids within such a challenging environment requireddemanding thermal performances of the overall subsea asset.
o steady-state arrival temperature – OHTC/U-value
o cooldown.
• Objectives:
o Transient thermal signature of every subsea component shall be evaluated and correlated into a dynamic flow simulation to verify the integrity and therefore, safety of the system.
o Validate thermal performance predictions from computer modeling during the engineering phase with a full scale test after installation.
• In-situ thermal test is performed a few days before the first-oilto assess the as-built performances.
Seal of approval for Contractor
© M C E D e e p w a t e r D e v e l o p m e n t a n d G u l f Q u e s t L L C4
What is an in-situ Thermal Performance Test? (1/2)
• Prior to the first oil production, a global in-situ thermal performance test of the fullproduction loop is conducted during commissioning to assess the following systemperformances:
o Average OHTC/U-value between two sensors,
o Cool down performance (using the sensors on the subsea manifolds and at riser base).
• The purpose of the global in-situ thermal performance test is to confirm/verify that thethermal insulation used for Kaombo production system complies with the specifiedrequirements.
© M C E D e e p w a t e r D e v e l o p m e n t a n d G u l f Q u e s t L L C
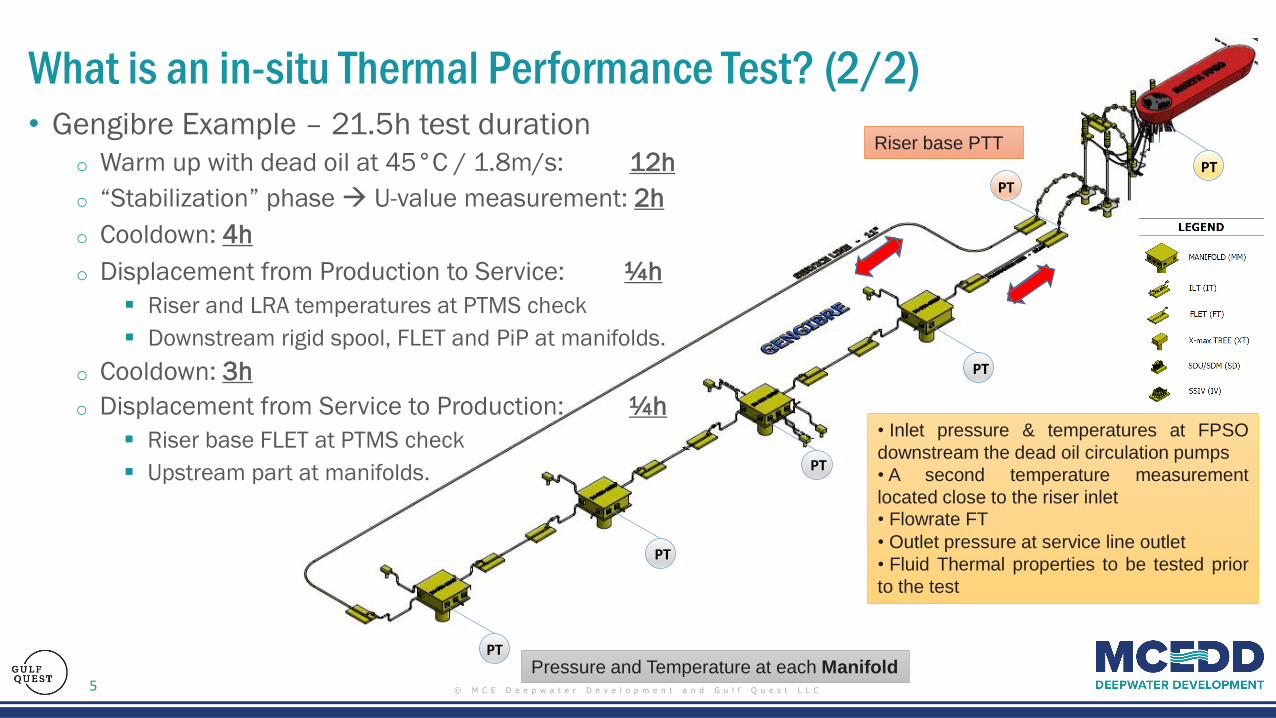
• Gengibre Example – 21.5h test duration
o Warm up with dead oil at 45°C / 1.8m/s: 12h
• Inlet pressure & temperatures at FPSO
downstream the dead oil circulation pumps
• A second temperature measurement
located close to the riser inlet• Flowrate FT
• Outlet pressure at service line outlet
• Fluid Thermal properties to be tested prior
to the test
PT
PT
PT
PT
PT
PTPressure and Temperature at each Manifold
Riser base PTT
5
What is an in-situ Thermal Performance Test? (2/2)
o “Stabilization” phase U-value measurement: 2h
o Displacement from Service to Production: ¼h
▪ Riser base FLET at PTMS check
▪ Upstream part at manifolds.
o Cooldown: 4h
o Displacement from Production to Service: ¼h
▪ Riser and LRA temperatures at PTMS check
▪ Downstream rigid spool, FLET and PiP at manifolds.
o Cooldown: 3h
© M C E D e e p w a t e r D e v e l o p m e n t a n d G u l f Q u e s t L L C6
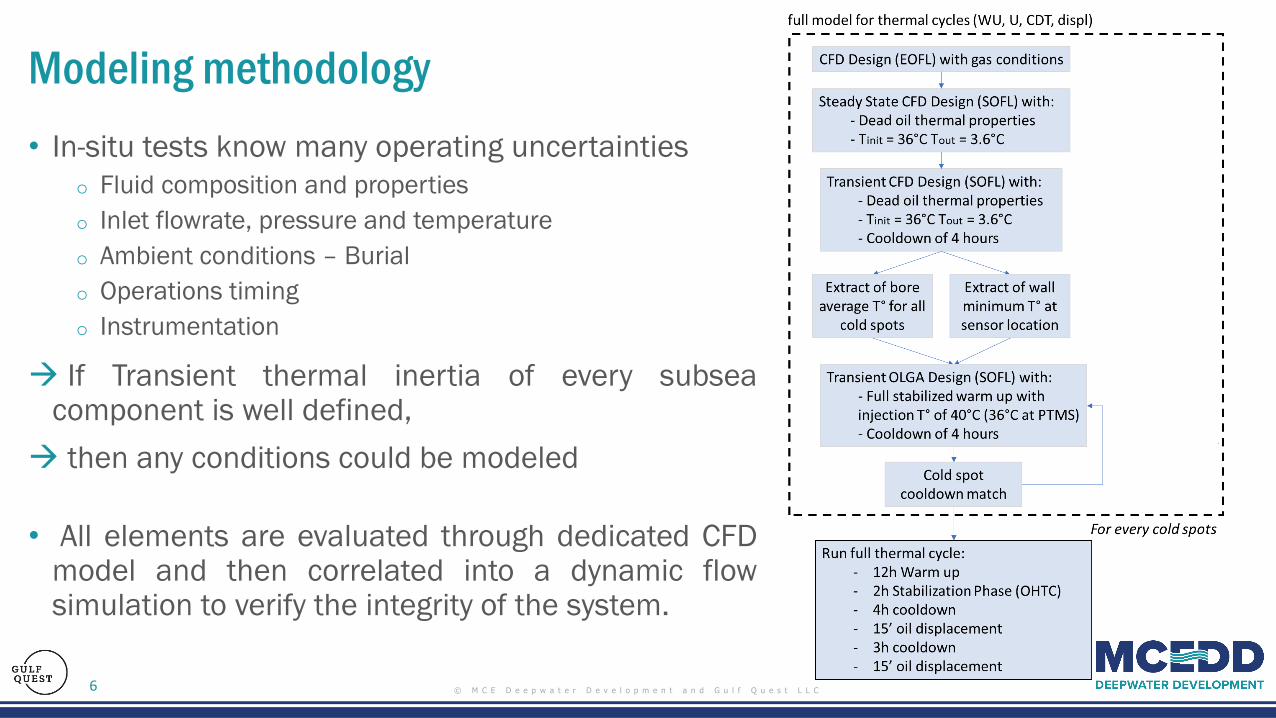
Modeling methodology
• In-situ tests know many operating uncertainties
o Fluid composition and properties
o Inlet flowrate, pressure and temperature
o Ambient conditions – Burial
o Operations timing
o Instrumentation
• All elements are evaluated through dedicated CFDmodel and then correlated into a dynamic flowsimulation to verify the integrity of the system.
If Transient thermal inertia of every subseacomponent is well defined,
then any conditions could be modeled
© M C E D e e p w a t e r D e v e l o p m e n t a n d G u l f Q u e s t L L C7
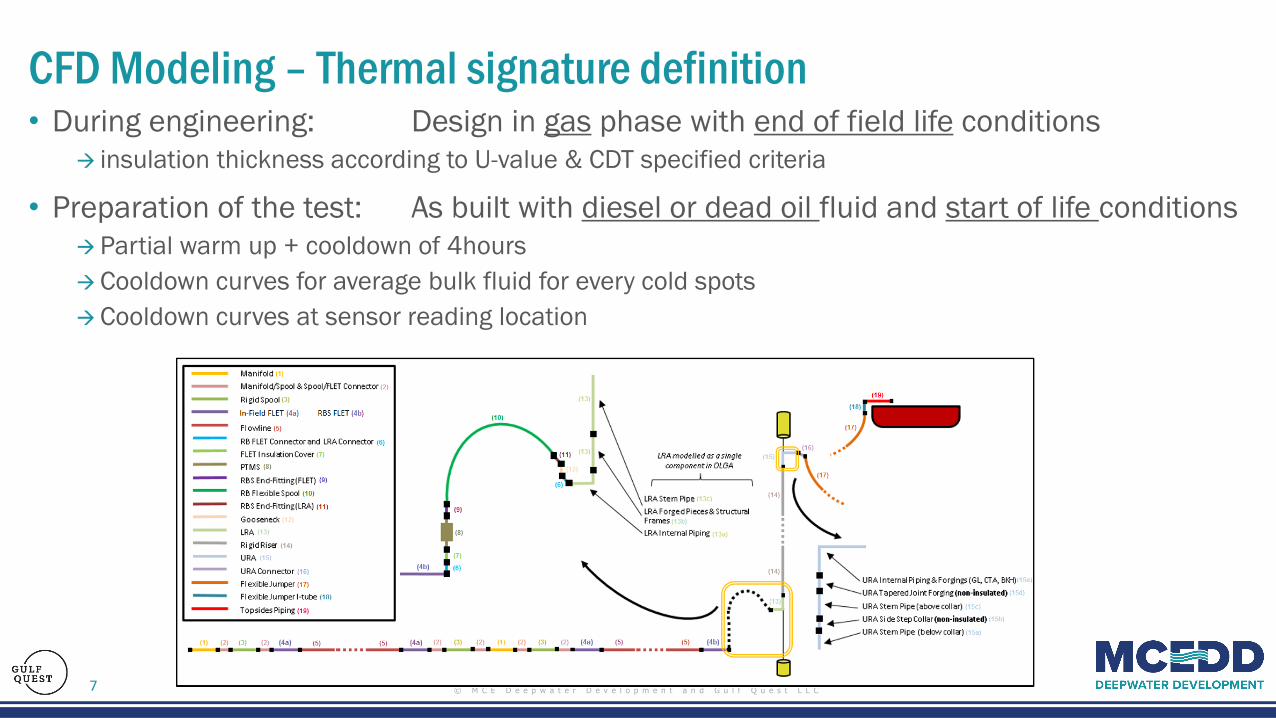
CFD Modeling – Thermal signature definition• During engineering: Design in gas phase with end of field life conditions
insulation thickness according to U-value & CDT specified criteria
• Preparation of the test: As built with diesel or dead oil fluid and start of life conditions
Partial warm up + cooldown of 4hours
Cooldown curves for average bulk fluid for every cold spots
Cooldown curves at sensor reading location
© M C E D e e p w a t e r D e v e l o p m e n t a n d G u l f Q u e s t L L C8
Dynamic Flow Modeling• During engineering: Olga used to define pressure, temperature, density for
mechanical design purpose – early project
• Preparation of the test: As built with diesel or dead oil fluid and start of life conditions
Wall definition tuned to match CFD modeling and thermal signature of every cold spots
Full thermal cycle with follow-up of wall and bulk temperatures
• OLGA is a 1D modeling whereas CFD models are in 3D or 2D axisymmetric
Main challenge is to well capture the full behavior of each elements that interact with each others
Full thermal cycle with follow-up of wall and bulk temperatures
© M C E D e e p w a t e r D e v e l o p m e n t a n d G u l f Q u e s t L L C9
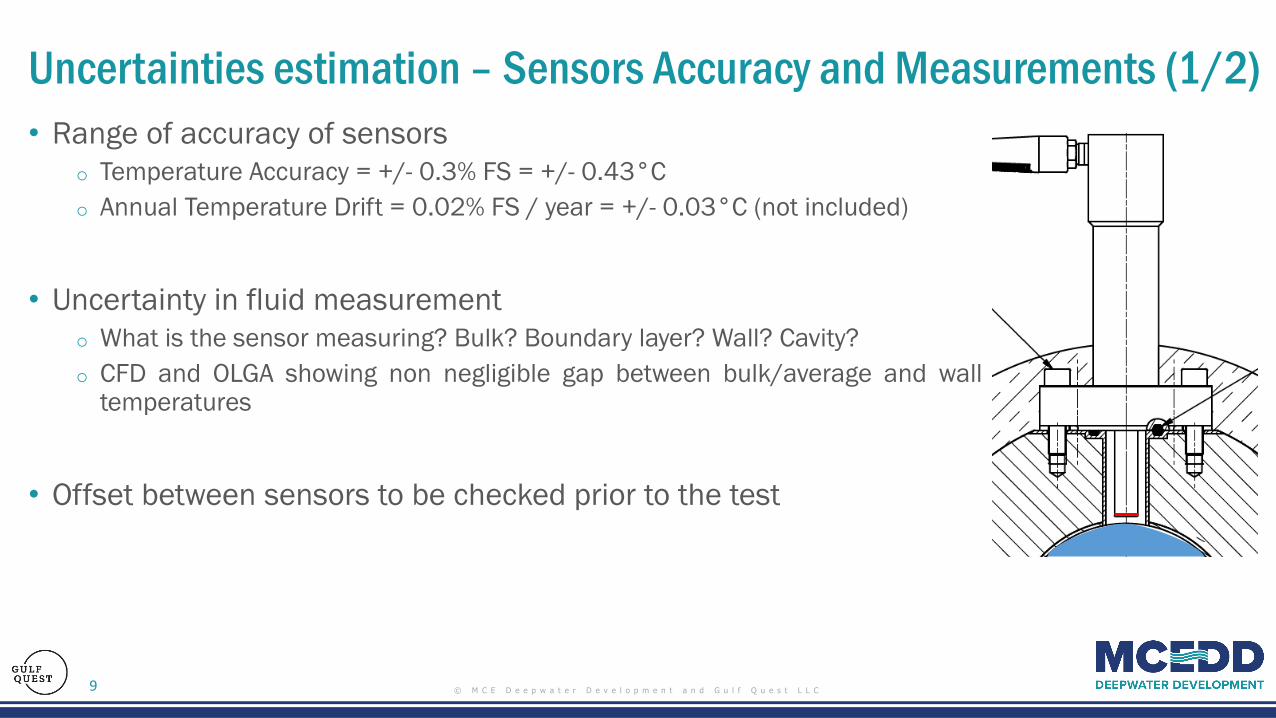
Uncertainties estimation – Sensors Accuracy and Measurements (1/2)
• Range of accuracy of sensors
o Temperature Accuracy = +/- 0.3% FS = +/- 0.43°C
o Annual Temperature Drift = 0.02% FS / year = +/- 0.03°C (not included)
• Uncertainty in fluid measurement
o What is the sensor measuring? Bulk? Boundary layer? Wall? Cavity?
o CFD and OLGA showing non negligible gap between bulk/average and walltemperatures
• Offset between sensors to be checked prior to the test
© M C E D e e p w a t e r D e v e l o p m e n t a n d G u l f Q u e s t L L C10
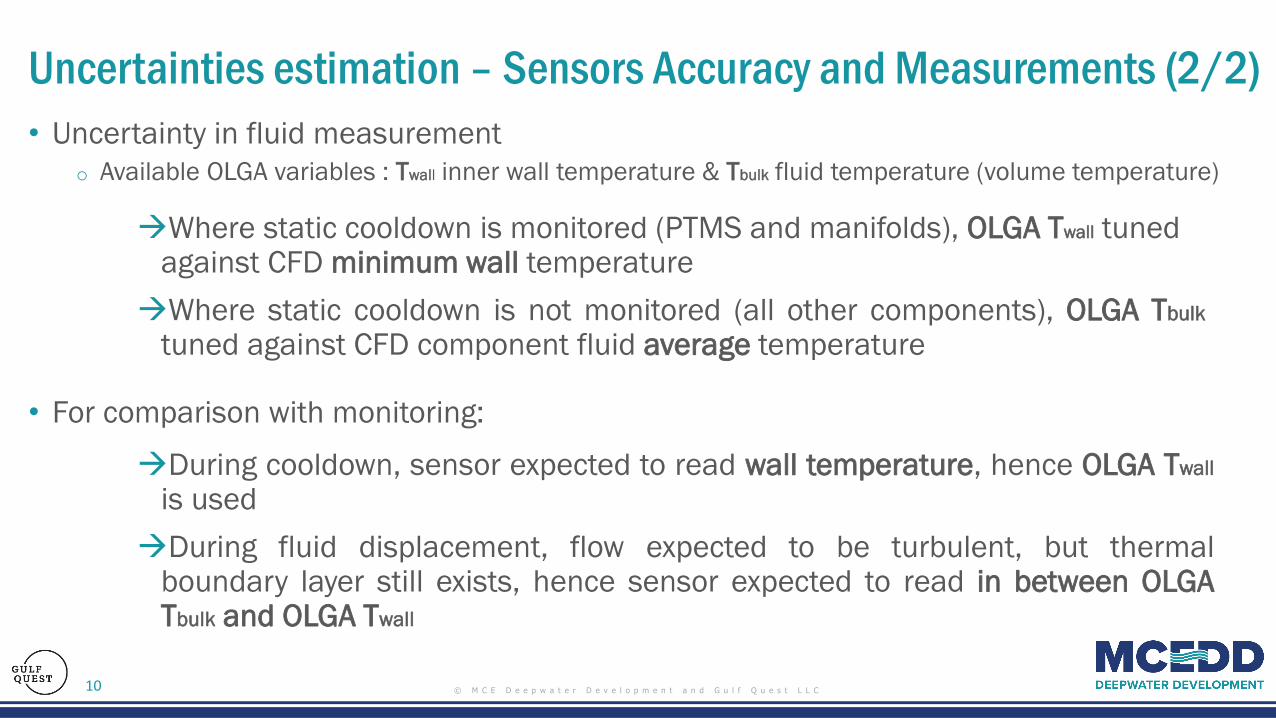
Uncertainties estimation – Sensors Accuracy and Measurements (2/2)
• Uncertainty in fluid measurement
o Available OLGA variables : Twall inner wall temperature & Tbulk fluid temperature (volume temperature)
Where static cooldown is monitored (PTMS and manifolds), OLGA Twall tuned against CFD minimum wall temperature
Where static cooldown is not monitored (all other components), OLGA Tbulk
tuned against CFD component fluid average temperature
• For comparison with monitoring:
During cooldown, sensor expected to read wall temperature, hence OLGA Twall
is used
During fluid displacement, flow expected to be turbulent, but thermalboundary layer still exists, hence sensor expected to read in between OLGATbulk and OLGA Twall
© M C E D e e p w a t e r D e v e l o p m e n t a n d G u l f Q u e s t L L C11
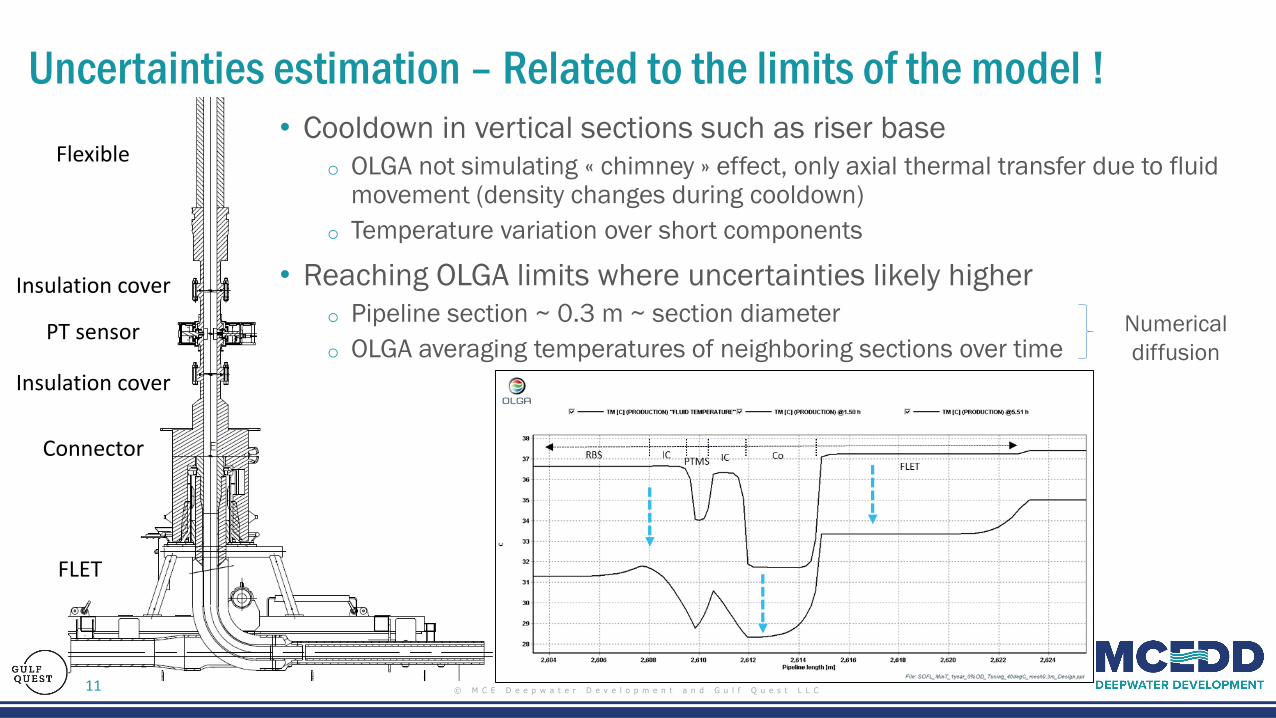
Uncertainties estimation – Related to the limits of the model !
• Cooldown in vertical sections such as riser base
o OLGA not simulating « chimney » effect, only axial thermal transfer due to fluid movement (density changes during cooldown)
o Temperature variation over short components
• Reaching OLGA limits where uncertainties likely higher
o Pipeline section ~ 0.3 m ~ section diameter
o OLGA averaging temperatures of neighboring sections over time
Flexible
Insulation cover
PT sensor
Connector
FLET
Insulation cover
Numerical
diffusion

© M C E D e e p w a t e r D e v e l o p m e n t a n d G u l f Q u e s t L L C12
Uncertainties estimation
• And so much others uncertainties…
o Fluid properties
o Meshing sensitivity
o Warm up duration (tuning performed for a certain range of internal/ambient differential temperature)
o Pump flowrate
o Pressure equilibrium during oil displacement (fluid displacement when opening valves…)
o Ambient conditions
o Embedment

© M C E D e e p w a t e r D e v e l o p m e n t a n d G u l f Q u e s t L L C13
Results – Preliminary results with tolerance band

© M C E D e e p w a t e r D e v e l o p m e n t a n d G u l f Q u e s t L L C14
Results
© M C E D e e p w a t e r D e v e l o p m e n t a n d G u l f Q u e s t L L C
©opyright: TOTAL
15
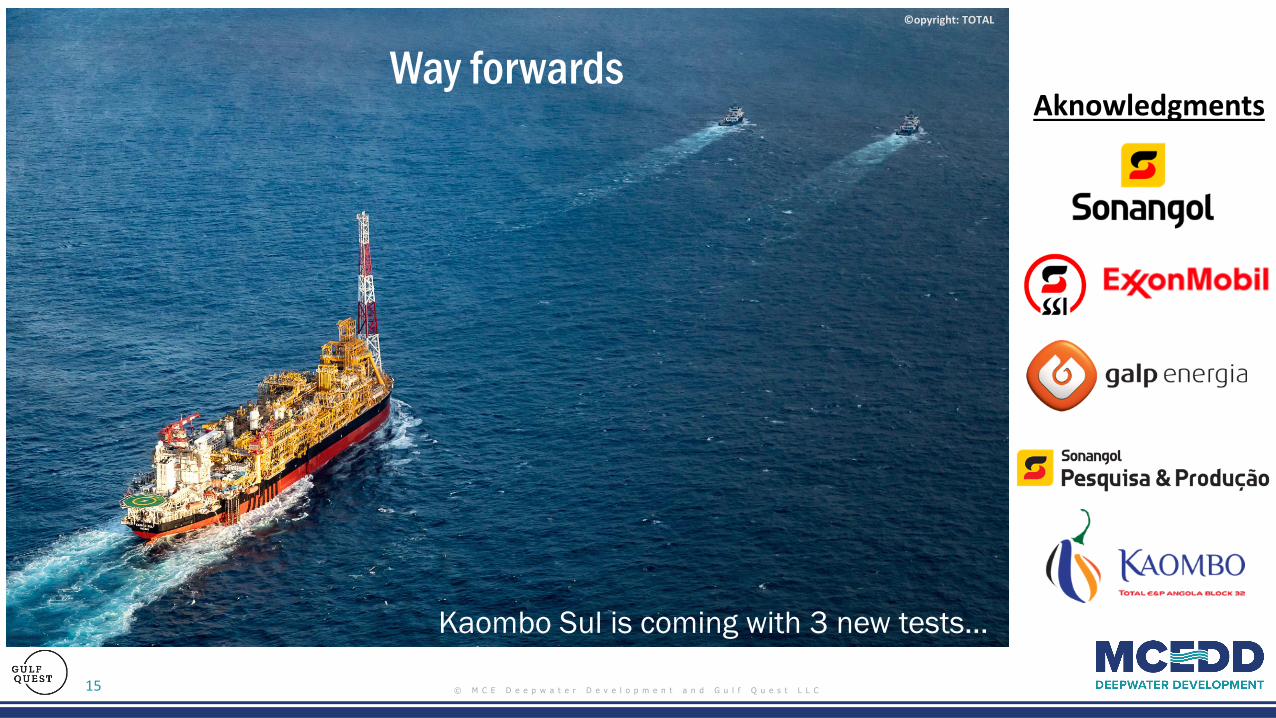
Way forwards
Kaombo Sul is coming with 3 new tests…
Aknowledgments

© M C E D e e p w a t e r D e v e l o p m e n t a n d G u l f Q u e s t L L C16
Questions ?
• Contact information:
Xavier HENNEUSE
Flow Assurance Lead
TechnipFMC Paris - Subsea Africa RBU
6-8 Allée de l’Arche | 92400 Courbevoie, France
Tel: +33 1 47 78 50 86
Email: [email protected]
Julien ROLLAND
Flow Assurance Lead
Total E&P Angola - Block 32 - Kaombo Project
Rua Rainha Ginga,262 | 2610 Luanda, Angola
Tel: +244 222 672 421
Mobile: +244 916 578 781
Email: [email protected]