kansei engineering influences and service … · kansei engineering influences and service...
TRANSCRIPT

KANSEI ENGINEERING INFLUENCES AND SERVICE
DIFFERENTIATION AMONG SINGAPORE, INDONESIA AND
JAPAN
MARKUS HARTONO
NATIONAL UNIVERSITY OF SINGAPORE
2012

KANSEI ENGINEERING INFLUENCES AND SERVICE
DIFFERENTIATION AMONG SINGAPORE, INDONESIA AND
JAPAN
MARKUS HARTONO
(B.Eng (Hons), University of Surabaya; M.Sc, NUS; CHFP)
A THESIS SUBMITTED
FOR THE DEGREE OF DOCTOR OF PHILOSOPHY
DEPARTMENT OF INDUSTRIAL AND SYSTEMS ENGINEERING
NATIONAL UNIVERSITY OF SINGAPORE
2012

I
Acknowledgements
I have been abundantly and exceedingly blessed by the Lord Jesus Christ for every
single moment that I spent in Singapore and at NUS in particular. This is unmerited,
undeserved and unearned favor from Him. First and foremost, my heartiest gratitude goes to
my parents who everlastingly support me in every area of struggle and challenge. I would like
to thank my supervisor, Associate Professor Tan Kay Chuan, for his valuable guidance,
support, patience, attention and kindness throughout this research project. I have learnt a lot
from him, not only in research work, but also in other areas such as time and schedule
managements, action plan and professionalism. A very big thank to Professor John Brian
Peacock who gives me valuable insights. I also thank the Department of Industrial and
Systems Engineering (ISE), NUS, for the full scholarship and other support given to me. I
have been given a chance to visit Beijing, China, to present a paper at the International
Ergonomics Association 2009 conference. I was greatly honored to visit Hiroshima
International University, Japan, and to meet Professors Shigekazu Ishihara and Mitsuo
Nagamachi to discuss Kansei Engineering research and methodology. That opportunity has
been very useful in enhancing and supporting my research.
I thank my laboratory mates and members of the ISE Department, including Nugroho
Pujowidianto, Jin Dayu, Aldy Gunawan, Steve Kardinal Jusuf, Zhou Qi, Xu Bin, Budi
Hartono, Nguyen Viet Anh and Usman Asad. I thank also my colleagues at the Department of
Industrial Engineering, University of Surabaya, for their support and care.
This thesis is for my beloved fiancé, Henindya Gunawan, for her patience, support and
love to me.
Markus Hartono
Singapore, June 2012

II
DECLARATION
I hereby declare that the thesis is my original work and it has been written by me in its
entirely. I have duly acknowledged all the sources of information which have been used in the
thesis.
This thesis has also not been submitted for any degree in any university previously.
_____________________
Markus Hartono
20 June 2012

III
TABLE OF CONTENTS
Acknowledgements ………………………………………………………………………….. I
DECLARATION .................................................................................................................. II
TABLE OFCONTENTS …………………………………………………………………. III
SUMMARY …………………………………………………………………………………... VI
LIST OF TABLES ………………………………………………………………………….. VIII
LIST OF FIGURES ………………………………………………………………………….. X
LIST OF ACRONYMS …………………………………………………………………. XI
1 INTRODUCTION .......................................................................................................................... 1
1.1 Research Motivation ..................................................................................................... 1 1.2 The scope and flow of this research work .................................................................... 9
1.2.1 The scope of this research work ...................................................................... 9 1.2.2 The flow of this research work ........................................................................ 9
1.3 Brief overview of published and submitted works ..................................................... 10
2 LITERATURE REVIEW ........................................................................................................... 12
2.1 Kansei Engineering (KE) and its characteristics ........................................................ 12 2.1.1 Kansei and emotion ....................................................................................... 12 2.1.2 Kansei Engineering (KE) and its superiority ................................................. 13 2.1.3 Different types of Kansei Engineering (KE) ................................................. 15 2.1.4 What constitutes product and service in KE.................................................. 16 2.1.5 KE methodology in product design ............................................................... 17 2.1.6 Succesful application of KE in industry ........................................................ 20 2.1.7 The common supporting tools used in KE .................................................... 22 2.1.8 Challenges and opportunities in KE .............................................................. 24
2.2 Quality ........................................................................................................................ 26 2.2.1 Quality in the framework of human factors and Kansei ................................ 26 2.2.2 The Kano model and KE ............................................................................... 26 2.2.3 Kansei quality management (KQM) ............................................................. 28
2.3 Services and human factors ........................................................................................ 31 2.3.1 Dimensions of services: servicescape and people interactions ..................... 32 2.3.2 Service Quality .............................................................................................. 34 2.3.3 Emotions in services ...................................................................................... 36 2.3.4 Customer expectation, cognition, affect and satisfaction .............................. 40 2.3.5 Behavioral intention ...................................................................................... 41 2.3.6 Cultural differences on service quality .......................................................... 42
3 RESEARCH GAPS, OBJECTIVES AND QUESTIONS ......................................................... 44
3.1 Research Gaps ............................................................................................................ 44 3.1.1 Gap 1: Lack KE methodology to services ..................................................... 44 3.1.2 Gap 2: Very little attention paid to the dynamics of customer preferences in
the steady-state condition ........................................................................ 47 3.1.3 Gap 3: Very little attention paid to cultural differences on Kansei ............... 48
3.2 Research objectives and questions ............................................................................. 50 3.2.1 Research objectives ....................................................................................... 50 3.2.2 Research questions ........................................................................................ 50
4 PRELIMINARY STUDY ............................................................................................................ 52

IV
4.1 Research methodology ............................................................................................... 52 4.2 Summary of findings on several case studies ............................................................. 53
4.2.1 Services in beauty salon ................................................................................ 53 4.2.2 Services in fitness centre/gym ....................................................................... 54 4.2.3 Services in multiplayer game/game centre .................................................... 55 4.2.4 Services in café .............................................................................................. 56 4.2.5 Services in home theatre................................................................................ 57 4.2.6 Services in policlinic for minor surgery ........................................................ 58
4.3 Conclusion .................................................................................................................. 59
5 DEVELOPMENT AND TESTING OF THE SURVEY INSTRUMENT .............................. 60
5.1 Introduction ................................................................................................................ 60 5.2 Data collection strategy .............................................................................................. 60
5.2.1 Case study research strategy .......................................................................... 61 5.2.2 Survey research strategy ................................................................................ 62
5.3 Result of interview ..................................................................................................... 65 5.4 Pilot test of the survey instrument .............................................................................. 67
5.4.1 Translation of questionnaires ........................................................................ 68 5.4.2 Testing of questionnaires............................................................................... 68 5.4.3 Testing of translated questionnaires .............................................................. 69
5.5 Surveyed population ................................................................................................... 71 5.6 Conclusion .................................................................................................................. 74
6 PRELIMINARY STUDY OF KANSEI ENGINEERING GENERAL FRAMEWORK IN
SERVICES ................................................................................................................................... 75
6.1 Introduction ................................................................................................................ 75 6.2 Problem description .................................................................................................... 75 6.3 Framework development and empirical study ........................................................... 75 6.4 Discussion .................................................................................................................. 78 6.5 Conclusion .................................................................................................................. 80
7 TESTING THE HYPOTHESES OF KE APPLICATION TO SERVICES USING PLS
METHOD ..................................................................................................................................... 83
7.1 Introduction ................................................................................................................ 83 7.2 Analytical approach: the use of SEM technique ........................................................ 83
7.2.1 Superiority of SEM technique ....................................................................... 84 7.2.2 Use of partial least square (PLS) estimation approach .................................. 85
7.3 Description of latent variable and its measurement items .......................................... 85 7.3.1 Descriptive statistics ...................................................................................... 87
7.4 Model testing and results ............................................................................................ 90 7.4.1 Face validity and content validity ................................................................. 90 7.4.2 Convergent validity ....................................................................................... 91 7.4.3 Discriminant validity ..................................................................................... 92 7.4.4 Reliability ...................................................................................................... 93
7.5 Analysis of the structural model ................................................................................. 95 7.6 Analysis of Kansei.................................................................................................... 100
7.6.1 Importance of Kansei .................................................................................. 100 7.6.2 Kansei response ........................................................................................... 102
7.7 Conclusion ................................................................................................................ 106
8 INTEGRATING THE EFFECTS OF KANO MODEL IN KANSEI ENGINEERING ..... 108
8.1 Introduction .............................................................................................................. 108 8.2 Problem description .................................................................................................. 108

V
8.3 The Kano model and its potential benefits ............................................................... 111 8.4 A proposed integrative framework of the Kano model and KE ............................... 114
8.4.1 Initial phase ................................................................................................. 115 8.4.2 Span the semantic space .............................................................................. 115 8.4.3 Span the service attributes space and the Kano model application ............. 115 8.4.4 Modeling and analysis ................................................................................. 116
8.5 Empirical Study: A case in luxury hotel services ..................................................... 117 8.5.1 Collection and evaluation of service attributes incorporated the Kano model
.............................................................................................................. 118 8.5.2 Model fitting: link and evaluation ............................................................... 121 8.5.3 Analysis of action ........................................................................................ 123
8.6 Discussion and implication ...................................................................................... 124 8.7 Conclusion ................................................................................................................ 126
9 USING MARKOV CHAIN MODEL TO ANALYZE FUTURE CUSTOMER
PREFERENCES ........................................................................................................................ 129
9.1 Introduction .............................................................................................................. 129 9.2 The Markov chain model in customer preference .................................................... 131 9.3 Future customer preference and quality function deployment (QFD) ..................... 132 9.4 Case study and its analysis ....................................................................................... 132
9.4.1 Initial and transition probabilities ................................................................ 133 9.4.2 Steady-state probability and expected weight of customer preference ....... 136 9.4.3 Analysis of predicted weight by incorporating the Kano categorization and
Kansei ................................................................................................... 139 9.5 Conclusion ................................................................................................................ 144
10 DISCUSSION ............................................................................................................................. 146
10.1 Introduction .............................................................................................................. 146 10.2 Research findings ..................................................................................................... 146
11 CONCLUSION AND RECOMMENDATION ....................................................................... 163
11.1 Introduction .............................................................................................................. 163 11.2 Contribution to theory .............................................................................................. 164 11.3 Contribution to methodology ................................................................................... 164 11.4 Contribution to practice ............................................................................................ 165 11.5 Limitations of this study ........................................................................................... 166 11.6 Recommendation for future research ....................................................................... 166
References …………………………………………………………………………………… 171
Appendix A. Case study of beauty salon service……….……………………………………… 181
Appendix B. Case study of fitness centre/gym services ……….………………………………. 184
Appendix C. Case study of café services……………………….………………………………. 187
Appendix D. Case study of home theater services………………….………………………….. 188
Appendix E. Case study of policlinic for surgery services………...…………………………... 190
Appendix F. Questionnaires in hotel services…………………………...…………………...… 192

VI
SUMMARY
Products and services of similar quality are ubiquitous in today‟s global market.
Functionality and usability alone are no longer prominent success factors in product and
service innovation. This is because customers today concern themselves more on satisfying
their emotions than merely their cognition. Kansei Engineering (KE) has shown its superiority
in investigating and modelling customer emotion (“Kansei” in Japanese) for product design
and development. Its application has been extended to services, as the fastest growing sector
in businesses today.
Some commonly used service quality tools, such as quality function deployment and
Kano‟s model, have been applied extensively in services. But none have been able to
incorporate customers‟ emotional needs. Some attention has been given to investigate this.
But thus far, there is no formal methodology that can account for customer emotional needs in
service design. To fill this niche, this study proposes an integrative framework of KE applied
to services. Preliminary case studies on services in Indonesia were conducted. It was found
that design elements and service attributes influence customer Kansei. Some common Kansei
words were identified. They include convenient, comfortable, clean, cool and spacious. The
main study involved a survey of luxury hotel services involving 425 Indonesian, Singaporean
and Japanese tourists. Services in luxury hotel are very complex involving many customer
activities. People can perform all their activities and needs throughout the day. According to
recent research, luxury hotels are reported to have greater strength of emotion than any other
hotel segment.
The research found emotion to be more important than cognition in impacting overall
customer satisfaction. Practically, it gives insight on which service attributes deserve more
attention with regard to their impact on customer emotion. In addition, cultural differences

VII
significantly impact on tourists‟ emotional needs. Japanese tourists are found to be the most
Kansei-oriented. Indonesian and Singaporean tourists share a common response to the Kansei
word “elegant” which correlates with their common cultural dimension of “power distance”.
Performing a Kansei evaluation to understanding cultural differences may yield valuable
insights for international tourist marketing strategies.

VIII
LIST OF TABLES
Table 2-1 Five approaches to define quality ........................................................................................ 26
Table 2-2 Overview of consumer research using emotions on satisfaction ......................................... 38
Table 2-3 Hierarchical consumer emotions (Laros and Steenkamp, 2005) .......................................... 39
Table 4-1 Customer satisfaction scores for beauty salon services ....................................................... 54
Table 4-2 Selected Kansei words and related design elements for fitness centre ................................ 55
Table 4-3 Selected Kansei words and related design elements for game center .................................. 56
Table 4-4 Selected Kansei words and related design elements for café ............................................... 56
Table 4-5 Selected Kansei words and related design elements for home theater ................................. 57
Table 4-6 Selected Kansei words and related design elements for policlinic ...................................... 58
Table 4-7 Customer satisfaction scores for policlinic services ............................................................ 59
Table 5-1 Relevant situations for research strategies ........................................................................... 60
Table 5-2 Interview questions .............................................................................................................. 62
Table 5-3 Interpretation of customer statements .................................................................................. 65
Table 5-4 Matrix for chosen subject for pilot study ............................................................................. 69
Table 5-5 Assignment of coin sides to questionnaire version .............................................................. 69
Table 5-6 Summary of statistical test for pilot test ............................................................................... 71
Table 5-7 Number of participants ......................................................................................................... 72
Table 5-8 Profile of respondents .......................................................................................................... 72
Table 6-1 Descriptive statistics of constructs ....................................................................................... 78
Table 6-2 Significant coefficient and p-value of correlation among constructs in KE services........... 78
Table 7-1 Description of latent variables ............................................................................................. 86
Table 7-2 Descriptive statistics of measurement items ........................................................................ 89
Table 7-3 Assessment of discriminant validity .................................................................................... 94
Table 7-4 Assessment of convergent validity ....................................................................................... 95
Table 7-5 Results of structural model................................................................................................... 96
Table 7-6 Comparison of Kansei importance scores among 3 groups ............................................... 101
Table 7-7 Factor structure of affective process/Kansei ...................................................................... 102
Table 7-8 Comparison of Kansei response scores among 3 groups ................................................... 104
Table 7-9 The scores of national cultural dimension (Hofstede and Bond, 1988) ............................. 105
Table 8-1 Kano evaluation table ......................................................................................................... 113
Table 8-2 Descriptive statistics of Kansei words ............................................................................... 118
Table 8-3 An overview of recapitulation of Kano result (unit in frequency percentage) ................... 119
Table 9-1 The initial and conditional probabilities of service attribute .............................................. 134
Table 9-2 Expected weight in 5 steps for each service attribute ........................................................ 137
Table 9-3 Steady-state probability and expected weight .................................................................... 138

IX
Table 9-4 Comparison between the current and future weight ........................................................... 140
Table 9-5 Future weight of service attribute incorporated Kano‟s category and Kansei ................... 141
Table 10-1 Significant regression model for each Kansei word for Japanese tourist ......................... 156
Table 10-2 The significant relationship between service attribute and Kansei word for Japanese .... 157
Table 10-3 Prioritized managerial strategies in dealing with future customer needs ......................... 158
Table 10-4 The summary of research findings ................................................................................... 159
Table 11-1 Anthropometric data for Singaporean males (Tan and Hartono, 2010) ........................... 170

X
LIST OF FIGURES
Figure 1-1 Conventional approach in product development phase ........................................................ 3
Figure 1-2 Incorporating KE in product development steps .................................................................. 8
Figure 2-1 KE methodology developed by Schütte et al. (2004) ......................................................... 18
Figure 2-2 An illustrative synthesis phase developed by Schütte et al. (2004) .................................... 19
Figure 2-3 An example of Category Identification .............................................................................. 19
Figure 2-4 Three-dimensional image of KE “Good Up Bra” (A) and normal brassiere (B), courtesy of
Nagamachi and Lokman (2011) ................................................................................................... 21
Figure 2-5 An example of a 5-point rating scale .................................................................................. 23
Figure 2-6 The affective flow developed by Schütte (2005) ................................................................ 25
Figure 2-7 The Kano model modified from Kano et al. (1984) and ReVelle et al. (1998) .................. 28
Figure 2-8 Diagram of Kansei quality management system (Nagamachi and Lokman, 2011) ............ 29
Figure 2-9 Proposed human factors-service quality by Strawderman and Koubek (2008) .................. 36
Figure 2-10 The cross-coupling of affect and cognition (Helander and Khalid, 2006) ........................ 40
Figure 2-11 The modified expectancy-disconfirmation theory adopted from Oliver (1980; 1993) ..... 41
Figure 3-1 Modified framework of KE in service encounter ............................................................... 47
Figure 4-1 A general research methodology for KE in services .......................................................... 54
Figure 5-1 Replication approach to case study method (Yin, 2003) .................................................... 61
Figure 5-2 Emoticons used and attached in survey paper .................................................................... 67
Figure 6-1 Framework of KE in services ............................................................................................. 78
Figure 7-1 Integrative framework of KE in service encounter ............................................................. 83
Figure 7-2 Proposed structural model of KE application in services ................................................... 94
Figure 7-3 Structural model with path coefficients .............................................................................. 96
Figure 7-4 Structural model of constructs ............................................................................................ 97
Figure 8-1 A proposed integrative framework of the Kano model and KE in services ..................... 117
Figure 8-2Kano evaluation process .................................................................................................... 119
Figure 9-2 Integrative framework of future customer preference study ............................................. 134
Figure 9-3 Illustration of the trends for each service attribute ........................................................... 139
Figure 9-4 HOQ for Indonesian group ............................................................................................... 144
Figure 9-5 HOQ for Singaporean group ............................................................................................. 144

XI
LIST OF ACRONYMS HOQ : House of Quality
Indo : Indonesia
Jpn : Japan
KE : Kansei Engineering
KQM : Kansei Quality Management
NPD : New Product Development
PLS : Partial Least Square
QFD : Quality Function Deployment
SD : Semantic Differential
SEM : Structural Equation Modeling
SPSS : Statistical Package for the Social Sciences
Sin : Singapore
TQM : Total Quality Management
TIPS : Theory of Inventive Problem Solving
TRIZ : Teoriya Resheniya Izobretatelskikh Zadatch

Chapter 1 Introduction
1
1 Introduction
1.1 Research Motivation
In today‟s fast changing and globally competitive world, it is imperative for
companies to provide competitive and differentiated products and services. Competitive
pricing, performance and features have become relevant factors in deciding which
products to buy (Schifferstein and Hekkert, 2008). Products and services, therefore, need
to offer features and properties which can make them distinguishable and attractive to
customers.
The sale of many products tends to decrease over time as compared to their first
launch. The increasing number of products available in the market together with a
decrease in purchasing power forces companies to reconsider their product planning and
development strategies (Shimizu et al., 2004). Efforts such as quick model changes,
technical updates, or even price reduction have been taken into account to reduce
turnover. However, these are no longer sufficient solutions (Shaw and Ivens, 2002;
Schütte, 2005) and indicate a lack of understanding of customer needs (see Figure 1-1).
Designing for customer experience is increasingly important for the success of
new services and products. Basically, there are two challenges. First, customer
experience is determined by both service and interaction with the product during service
provision. Second, customer experience is formed in all moments of interaction with a
product or a service.
Customers today are highly dynamic and demanding. They tend to be disloyal to
particular products and services. Companies must listen closely and carefully to the
voices of their customers, especially their latent needs. These are the unspoken emotional

Chapter 1 Introduction
2
needs that customers seek in products and services. According to Nagamachi and
Lokman (2011), good quality products are not enough to win market competition.
However, products that consider peoples‟ feelings and emotions will sell. Thus,
businesses must strive for total customer satisfaction and delight (Bowen and Schneider,
1999).
Nowadays, the focus by customers has shifted from objects to product/service
experiences. This refers to the switch from functionalism to product semantics
(Krippendorff, 1995). This is deemed to be the new battleground (Shaw and Ivens, 2002).
The impression of product experience brings customer satisfaction (Shimizu et al., 2004;
Khalid and Helander, 2006; Schifferstein and Hekkert, 2008). Norman (2004) argues that
customers are happy because the products and services that they use are easy to deal with
and more harmonious results are produced. This fact is supported, for example, by
evidence of the very successful sale of Apple products that incorporated emotional
design. More than 150 million iPods have been sold worldwide since September 2007
(Block, 2007).
In dealing with emotions in product design and development, Kansei Engineering
(KE) has been proposed since the 1970s (see Figure 1-2). KE is conceived as the only
tool that can quantify customer emotions and translate them into product features
(Nagamachi, 1995). This method has been extensively applied to the design of physical
products/articles (Nagamachi and Imada, 1995; Nagamachi, 1995; Ishihara et al., 1996;
Schütte, 2005; Horiguchi and Suetomi, 1995; Hsu et al., 2000; Nagamachi, 2002; Schütte
et al., 2004; Schütte et al., 2008). Its extended application to services was initiated by

Chapter 1 Introduction
3
Nagamachi in the 1980s (Nagamachi and Lokman, 2011). Up to today, however, it is still
relatively unexplored.
Figure 1-1 Conventional approach in product development phase
Due to increasing customer demands on product design, it is a must for company
to fulfill functionality and usability of the products. Nowadays, many companies meet
challenges that force them to put strong emphasis on also integrating affective aspects in
their product design. It is something that now has become distinguishing quality of
products. Different methodologies have been developed and integrated in product design
processes in order to measure the affective impact of different products on customers and
users.
Several research directions have in common that they try to grasp the customers‟
and users‟ personal impression and emotions and make it describable or even measurable
in order to evaluate product solution according to their emotional impact. However, as
these research directions are not interconnected, one could say that there is a great need
for methods, but the research is still in its infancy (Schutte, 2005). Kansei Engineering is
one of these methods, aimed at determining relationships between the feelings and
impressions of the humans and product properties (Schutte, 2005). The idea of integrating
customer emotions into products is not entirely new. This kind of research/work has been

Chapter 1 Introduction
4
developed gradually since the early of 1970s. However, what distinguishes Kansei
Engineering from other similar methods is its ability to build mathematical prediction
models on how feelings are connected to product properties (Schutte et al., 2004).
Some labels have been used in this KE methodology, such as emotional
engineering, affective design, affective engineering, affective ergonomics, design for
experience, pleasure with products and sensorial engineering (Schutte, 2005). The term
“engineering” explains a systematic approach that integrates scientific, engineering and
artistic approaches for product design.
The success of product and service is more than just about capturing or meeting
emotional needs. The quality of planning before the beginning of the actual development
stage is decisive for the success of the new product development (NPD) project (Ernst,
2002). It consists of the initial, evaluation of ideas, evaluation of market-oriented
feasibility studies including a thorough commercial evaluation of the project. In general,
all these process steps must align with the market requirements. In addition, the NPD
team should be cross-functional. The team members should have full responsibility for
the whole NPD process so that they belong the expected motivation and commitment.
According to Ernst (2002), the organizational culture and NPD strategy may bring impact
on the success of new products. However, this is relatively less explored.
Related to successful product in the market, there are several aspects to consider
such as marketing, after sale service, fuel efficiency, and et cetera. They may belong to
augmented services. Kansei design can contribute to any aspect of that design system.
For instance, in terms of Mazda Thinking for car design, Mazda still uses KE as the
underlying design principle. It‟s called “Jinba Ittai” which means “horse and rider to be a

Chapter 1 Introduction
5
unity”. Also, Mazda design adopts a principle of Karakuri, i.e., with one simple touch,
the user can instantly fold down car rear seats into a flat floor for extra storage. The
company also considers fuel efficiency. Its principle is a whole lot of pure driving
pleasure than just mere kilometers out of every drop you pay for at the pump. The
contour follows a textured surfacing (“Nagare” design). Regarding the car weight, Mazda
promotes lighter, tighter and more agile on their wheels (it is called Gram Strategy). In
terms of safety, Mazda presents MAIDAS (Mazda‟s Advanced Impact Distribution and
Absorption System). It is capable of withstanding a wide variety of accidents, including
offsetting collisions and side collisions.
Research on the use of KE in the service sector has huge potential. The service
sector has become a driver of economic growth that creates competitive advantage.
Almost all economies have a substantial service sector. Services account for more than 60
percent of GDP worldwide (Lovelock and Wirtz, 2007). China and India have gone
strongly into providing services in the last decade. More than 97 percent of jobs added to
U.S. payrolls from 1990 to 2002 were provided by the service sector.
The main research area of this thesis, i.e., customer emotional need in services, is
not entirely new. In fact, affective values in products and attractive products have always
been an issue for customers. Another concern of research in services is the development
and use of service quality tools. A very well known method, for instance, is Quality
Function Deployment (QFD). It is a planning process for translating customer needs into
appropriate organizational requirements at every stage of a product‟s life cycle, from
research to sales and service. The most important matrix is the house of quality (HOQ)
which is made up of two main parts: “whats” and “hows”. This tool helps an organization

Chapter 1 Introduction
6
set targets and determine the priority of actions need to be taken. This tool is very
powerful since it can be applied for various product and service development. However,
this method does not provide procedures how to capture customer needs, especially for
emotional needs. There is no distinction of the nature of customer needs within the
“whats” (e.g., emotional vs non-emotional needs). Yamashina et al. (2002) address that
QFD has a lack of methodology for innovative application, i.e., QFD cannot clearly
indicate that part of a product to which technological innovation should be applied. Their
work extends the QFD methodology by proposing an integrative framework of QFD and
the theory of inventive problem solving (TIPS) / Teoriya Resheniya Izobretatelskikh Zadatch
(TRIZ). According to Schutte (2005), interpreting customers‟ statements is very difficult
and requires much experience. KE is designed for evaluating the unconscious wants and
needs, and delivers statistical mathematical values for the connection between a need and
its technical response. KE data can be used in order to identify customer needs and
determine their importance, facilitating the setting of target values for technical data and
perform benchmarking between different products and brands and quantify the
relationships in the relationship matrix in a more exact way (Schutte, 2005). However, in
some cases more detailed information is desirable. KE can quantify those relationships by
building mathematical models of the customer‟s Kansei.
Another example of service quality methods is service quality model
(SERVQUAL) (Parasuraman et al., 1988), which is measured by calculating the
difference scores between corresponding items (i.e., perceptions minus expectations).
According to Babakus and Boller (1992), SERVQUAL is said to suffer from a number of
methodological shortcomings. The dimensionality of service quality may highly depend

Chapter 1 Introduction
7
on the type of services under study. The use of mixed-item wording and the current
operationalization of service quality on the basis of gap scores appear to be major
problems in the measurement of the construct. In addition, it assumes that the relationship
between customer satisfaction and service attribute performance is linear (Tan and
Pawitra, 2001). The implication is that low customer satisfaction results from low
attribute performance. Thus, this will be the focus for improvement. It is, however, not
necessarily true. Customer satisfaction can sometimes be highly improved by a small
improvement of a service attribute that is unexpected. Here, Kano‟s model (Kano et al.,
1984) plays important role in categorizing the product and service performances. A very
impresive quality performance is known as “delighter”. It is something not requested by
customers. However, once it is fulfilled, it makes the customers delighted and highly
satisfied. By incorporating elements of Kano‟s model into SERVQUAL, this limitation
can be overcome (Pawitra and Tan, 2003).
Changes in lifestyle brought forward by new products and services will
potentially change the affective impact of products on human (Jordan, 2001). This
phenomenon has been recognized long time ago in KE research. In fact, Kano et al.
(1984) poses that the way anciently attractive product features are perceived and changed
quickly. According to Schutte (2005), in the context of integrating feelings into product
design and development, the Kano model is highly relevant. Most product properties
have an emotional impact on the users mind, especially interesting in this context is
attractive quality. The user should become positively surprised about this kind of feature.
This of course is closely connected to the affect or emotion. The Kano model (Kano et
al., 1984) is used in order to create attractive products. Successful product development

Chapter 1 Introduction
8
means that the development team must meet the basic expectations (i.e., the must-be
quality) as well as the one-dimensional quality, which correspondents to the expressed
expectations a customer has on the products or services. However, this is everyday work
for product designers. What is considerably more complex but necessary is the attractive
quality creation in new products. Once an attractive new property is integrated into the
product or service, the customer is surprised and delighted and is tempted to purchase the
product or service (Schutte, 2005).
The integration of SERVQUAL model, Kano‟s model, QFD and Kansei
Engineering methodology can result in ways to close the gap between perceived service
and predicted service for current and future needs. This research aims to propose an
integrative framework of KE applied to services. Several quality tools that can enhance
the integrative framework are discussed. By adopting and applying this framework, it is
hoped that customer emotional satisfaction and loyalty can be achieved. The findings of
several empirical studies in services are discussed.
Figure 1-2 Incorporating KE in product development steps

Chapter 1 Introduction
9
1.2 The scope and flow of this research work
1.2.1 The scope of this research work
This research begins with a literature review of KE and its supporting quality
tools. The literature review includes KE and its methodology, supporting tools and
concepts in KE, services quality and emotion in services. The results of several empirical
studies of KE in services are discussed.
Based on the above literature review and from empirical findings of preliminary
case studies, an integrative framework of KE applied to services is discussed. A
comprehensive case study in luxury hotel services incorporating cultural differences was
done and discussed to showcase the framework‟s applicability. This serves as the main
part of this study.
Finally, research contribution, limitation and recommendations for future works
are summarized.
1.2.2 The flow of this research work
This thesis consists of 11 chapters. Chapter 1 discusses the research motivation of
KE and the scope and flow of the research work. Chapter 2 is a literature review of KE
and emotions in services. Chapter 3 discusses the research gaps, objectives and questions.
Chapter 4 covers the preliminary case studies and their findings. Chapter 5 discusses the
development and testing of the survey instrument. Chapters 6 and 7 discuss the proposed
integrative framework and the main empirical study involving three population groups.
Chapter 8 provides an evaluation of the use of Kano‟s model in KE. Chapter 9 discusses
how to use Markov chain to analyzing future customer preferences. The last two chapters

Chapter 1 Introduction
10
are the Discussion (Chapter 10) and Conclusion and Recommendations (Chapter 11). At
the end of the thesis are the references and appendices.
1.3 Brief overview of published and submitted works
The following are selected works that have been published or submitted:
Paper 1: A proposed framework of Kansei Engineering application in dealing with
customer emotional needs in services, published in the Proceedings of IEA 17th
World
Congress on Ergonomics, August 9-14, 2009, Beijing, China. The corresponding
chapter is Chapter 5.
Paper 2: The role of Kansei Engineering in influencing overall satisfaction and
behavioral intention in service encounters, published in the Proceedings of the first
SEANES Conference, December 14-17, 2010, Cebu, Philippines. This work was
extended and submitted to The Journal of Philippine Institute of Industrial Engineers
(JPIIE). The corresponding chapter is Chapter 5.
Paper 3: A proposed integrative framework of Kansei Engineering and Kano model
applied to services, published in the Proceedings of the 2nd
International Research
Symposium in Service Management, July 26, 2011, Yogyakarta, Indonesia. This
article was awarded as the best paper. The author also received the Young Service
Researcher Award (YSRA). The corresponding chapter is Chapter 7.
Paper 4: Anthropometry of the Singaporean and Indonesian populations, published in
International Journal of Industrial Ergonomics, 2010, Vol. 40, Issue 6, pp. 757-766.
The corresponding chapter is Chapter 10.

Chapter 1 Introduction
11
Paper 5: How the Kano model contributes to Kansei Engineering in services,
published in Ergonomics, 2011, Vol. 54, Issue 11, pp. 987-1004. The corresponding
chapter is Chapter 7.
Paper 6: Applying Kansei Engineering, the Kano model and QFD to services,
submitted to Management Decision (special issue). The manuscript is now under
review. The corresponding chapters are Chapters 7 and 8.
Paper 7: Incorporating Markov chain modeling and QFD into Kansei Engineering
applied to services, accepted for publication in International Journal of Human
Factors and Ergonomics. The corresponding chapters are Chapters 4, 5, 6, 7, 8, 9 and
10.

Chapter 2 Literature review
12
2 Literature review
This section covers Kansei methodology and application, the concepts of quality such as
the Kano model and quality function deployment (QFD) as the main contributor of the
KE method. It is then followed by human factors, emotions and service interaction.
2.1 Kansei Engineering (KE) and its characteristics
2.1.1 Kansei and emotion
Many definitions and classifications of emotion can be found in the literature.
They exist in the areas of human factors, product design, marketing, psychology, et
cetera. According to Khalid and Helander (2006), the definition of pleasure covers
physical, social, psychological, reflective and normative emotions. In Japanese, a term for
emotion is known as Kansei. It is a concept of sensing a phenomenon or an artifact that
builds impressions. According to Nagamachi (1995), Kansei is defined as customer
psychological feeling and image of a new product.
Luxurious, gorgeous and impresive products and services are highly expected. All
human senses of vision, hearing, feeling, smell, taste, as well as cognition are
simultaneously involved (Schütte et al., 2008). Understanding emotional needs of human
beings will lead to creative ideas and innovations (Lee et al., 2002). People with rich
Kansei are those who are full of emotion, knowledge and passion, and those who are
sensitive and responsive to any change. Kansei, therefore, should be incorporated into
human-centered product development processes to win over customers (Nagamachi and
Lokman, 2011).

Chapter 2 Literature review
13
2.1.2 Kansei Engineering (KE) and its superiority
KE is defined as an ergonomic technology of customer-oriented product
development. This method focuses on user feelings and needs (Nagamachi and Imada,
1995). It is the first and foremost product development methodology that can translate
customer impressions, feelings and demands on existing products and concepts into
concrete design parameters (Nagamachi 1991; 1995; Schütte, 2005). Yun (2008)
categorizes KE into three main components: i) user acceptance and ergonomic design
(i.e., ease of use, customer perceived value, universal design, safety and protection), ii)
design strategy and identity (i.e., visual quality, touch feel, sound quality and appeal
quality) and iii) emotional satisfaction (i.e., luxuriousness, craftsmanship, pleasantness
and comfort).
According to Nagamachi and Lokman (2011), a good product is more appealing
to consumers in terms of its price as well as its function, shape and color. That is a
product which represents customer needs and has Kansei incorporated into it. Even
though a product is good, if it has too many unnecessary functions, it will not capture the
attention of today‟s customers. However, it does not mean that a product is good if it is
inexpensive. Thus, developing products or services that get into the deep layer of what
consumers actually want will produce good products and valuable products to be supplied
into market.
KE product is not always an expensive or high-end product (Nagamachi and
Lokman, 2011). KE product emphasizes the actualization of the needs and emotions,
considering functions and shapes, and also whether the customers would want what the
product offers. For example, a video tape recorder (VTR) with very clear buttons and

Chapter 2 Literature review
14
easy recording mode can evoke consumer‟s Kansei (Nagamachi and Lokman, 2011). The
application of KE covers very wide scope of products and services. They include interiors
and car designs (i.e., Mazda, Nissan, Mitsubishi, Toyota, Honda, Ford, Fiat and
Hyundai), brassieres (i.e., Wacoal), housing (see Llinares and Page, 2011), drink (i.e.,
Asahi beer), electronics (i.e., Sharp‟s VTR LCD ViewCam) and services (i.e., restaurant,
ladies‟ wear department, supermarket‟s cashier).
Basically, KE is useful in several regards as follows:
This method is able to translate customer emotional needs into concrete design features
and elements (Nagamachi, 2002a; 2002b; Nagamachi et al., 2009). According to
Llinares and Page (2011), KE is able to work with symbolic attributes and user
perceptions, expressed in their own words; whereas, other techniques base their product
and service developments on user preference of functional aspects.
Since it is not easy to measure Kansei, KE tries to minimize subjectivity by building a
mathematical model between Kansei responses through all the human senses and
external stimuli (e.g., product traits and service attributes). This condition is supported
by the affective flow that enables users to perceive certain stimuli with their appropriate
senses without any barrier (Nagamachi, 1995; 1997; Picard, 1997).
Besides dealing with attractive exterior and physical appearances, KE has an ability to
optimize properties which are not directly detectable or visible (i.e., interior/hidden
qualities), such as the atmosphere of a concert hall and the concept of good driving
feelings. It is done by modifying the engineering properties of artifacts (Nagamachi,
1991; 1995; 2002a; 2002b). In other words, KE covers both the tangible and intangible
dimensions of product experiences and service encounters.
Chapter 2 Literature review
15
KE is known as a quality framework with an integrated set of tools and methods. It
deals with dynamic market and customer preferences. KE applies statistical engineering
in the use of service tools (Nagamachi and Lokman, 2011). Its role is to tunnel through
the borders among different scientific fields, to identify suitable tools and to reassemble
them as a means to quantify the impact of product features on user emotions.
KE has a strong ability to grasp and accommodate 21st century trends, which are
hedonistic, pleasure and individualistic. This is where customers tend to focus on their
emotional impressions rather than merely on product functionality and usability
(Nagamachi, 1991; 1995; 2002b).
This KE method has demonstrated a relational model between cognitive and affective
experiences. These two experiences explain all manifestations of human interaction
with products and services. Customers cognitively evaluate the performance of external
stimuli (e.g., products or services traits) that appeal to their emotions (Hartono and Tan,
2010).
The internet KE system can work as a catalyst for innovative ideas during the product
design process (Ishihara et al., 2005; 2007).
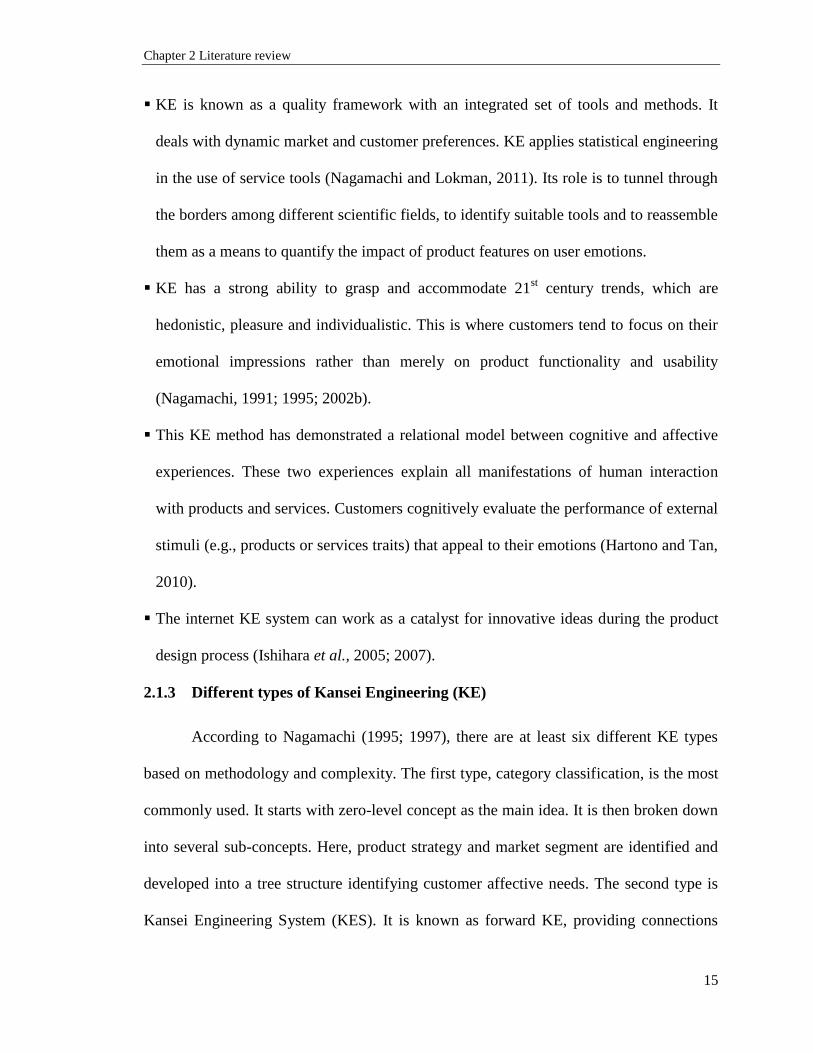
2.1.3 Different types of Kansei Engineering (KE)
According to Nagamachi (1995; 1997), there are at least six different KE types
based on methodology and complexity. The first type, category classification, is the most
commonly used. It starts with zero-level concept as the main idea. It is then broken down
into several sub-concepts. Here, product strategy and market segment are identified and
developed into a tree structure identifying customer affective needs. The second type is
Kansei Engineering System (KES). It is known as forward KE, providing connections

Chapter 2 Literature review
16
between Kansei and product properties through mathematical and statistical tools. It can
be used to translate consumers‟ Kansei into design parameters. The third KE type is
hybrid KES. It is known as backward KE. This hybrid KES builds up a database of
product properties and elements to predict users‟ Kansei.
The fourth type is called KE model. It focuses on building mathematical models
to access human feelings represented in series of Kansei words. This fourth type is more
strongly validated than the second and third types. Some studies have applied a
mathematical model using quantification theory I and semantic differential (Fukushima et
al., 1995). The fifth type is an extended KES equipped with virtual reality (VR). VR is an
advanced technology to place a user in virtual 3D environment. This technology enables
users to adjust and manipulate their desires and intentions.
The sixth type is called collaborative KE. This is internet-supported KE system.
This KE type brings many benefits such as: i) it offers viewpoints from customers and
designers, ii) it shortens product development phase, iii) it works with many participants
to support effective consumer-producer interaction and iv) it provides many innovative
ideas.
According to Nagamachi and Lokman (2011), a recent Kansei type applied to
service science and quality management is called Kansei quality management (KQM). It
is customer-focused quality and service management.
2.1.4 What constitutes product and service in KE
Since KE deals with product development, its perspective on products needs to be
clarified. Initially, KE only focused on artifacts and physical products. According to
product development for the future, KE should be capable of conducting examinations of

Chapter 2 Literature review
17
both physical products and services in a single study (Schütte et al., 2004). Services
include both physical stuffs and interaction between customer and employee.
2.1.5 KE methodology in product design
Here is the basic KE methodology (see Figure 2-1) adapted from Schütte et al.
(2004).
Choice of domain
It includes the selection of a target group, market, particular population and the
specifications of a new product. For example, a new concept of mobile phone for the
elderly is chosen.
Span the semantic space and how to measure Kansei
This is done through three main steps: i) collecting Kansei, ii) selecting Kansei
and iii) compiling data. Kansei can be obtained by a series of measurement methods
through interpretation of (Nagamachi, 2001): peoples‟ behavior and actions, words, facial
and body expressions and physiological responses (e.g., heart rate, blood pressure, skin
responses, papillary responses, Electromyography [EMG] and Electroencephalogram
[EEG]). Nagasawa (2002) categorizes Kansei measurement as physiological and
psychological measures. According to Desmet (2004), this measurement refers to two
groups: i) non-verbal (e.g., expressive and physiological components) and ii) verbal (e.g.,
rating scale).
Due to complexity and multifaceted phenomenon, the evaluation of words
(Kansei words) is commonly used in KE study. Kansei words, providentially, can express
composite and mixed emotions, not limited to certain set of emotions. Kansei words can
be used to unveil emotions evoked by product and service experience (Desmet, 2004).

Chapter 2 Literature review
18
The semantic differential (SD) method (Osgood et al., 1957) is commonly utilized
for KE studies. SD is deemed to be more appropriate to identify a rough picture of Kansei
than other physiological measurement tools (Nagasawa, 2002).
The following are potential sources to collect Kansei words. They include survey
and interview with potential targets, magazines, pertinent literatures, manuals, experts,
experienced users, ideas and visions. The collected Kansei words will be reduced and
structured to form high level Kansei words. These final Kansei words represent general
customer impressions and emotions on particular product and service concepts. Affinity
diagram, interviews and factor analysis are some common methods to reduce and
structure the collected Kansei words.
Figure 2-1 KE methodology developed by Schütte et al. (2004)
Span the space of properties
Individual or dozen of product elements may have influence on the overall
Kansei. Hence, it is important to collect all product and service elements and select only
those which have the largest impact on Kansei (Nagamachi and Lokman, 2011). A
variety of sources can be used, such as technical documents, comparisons of competing
products, magazines, relevant literature, manuals, experts, experienced users, related
Kansei studies, ideas, visions, concept studies, analysis of the usage of existing products,
related case studies and related product groups. Frequency analysis and Pareto diagram
may be used to determine the most important product parameters or properties.

Chapter 2 Literature review
19
Synthesis
This is a phase where Kansei and product or service properties are met and linked
(see Figure 2-2). For every Kansei word, a number of product properties are found.
Category Identification (KE Type I) is commonly used to link Kansei words with product
properties (Nagamachi, 1997; 2001). An example of Category Identification is shown in
Figure 2-3. Other potential methods are Linear Regression (Ishihara, 2001), Multiple
Linear Regression (Schütte, 2002), General Linear Model (GLM) (Arnold and Burkhard,
2001), Quantification Theory type 1 (Komazawa and Hayashi, 1976), Neural Networks
(Ishihara et al., 1996) and Structural Equation Modeling (SEM).
Model building
The simple model is YKansei = f (product properties). Given the Kansei response
on a particular product property, Kansei scores can be predicted.
Figure 2-2 An illustrative synthesis phase developed by Schütte et al. (2004)
Figure 2-3 An example of Category Identification

Chapter 2 Literature review
20
2.1.6 Succesful application of KE in industry
The most successful company that has applied KE is Mazda. That is a great
success of KE type I application in industry. Mazda used KE for developing its Miyata
model (in Europe, it is known as MX5). This model symbolizes “Human-Machine Unity”
(Jinba-Ittai in Japanese) (Nagamachi, 1995). It describes the unification of the driver and
the car.
Another success story is that a new design video camcorder with a LCD-display
by Sharp. It has replaced a conventional ocular viewer used in simple videocameras. This
innovative design increased the company‟s market share (from 3% to 24%).
Apart from electronic and automotive products, KE has been applied to fashion.
Wacoal, a manufacturing company for woman apparel, introduced a new design of
brassiere using KE. This company reached its market share of 42 percents in Japanese
markets and recorded a huge sale of 3 million pieces. According to Nagamachi and
Lokman (2011), Wacoal surveyed 2000 women and found the needs of a brassiere that
shapes “beautiful”. Based on that survey, there were two top voice of customer, i.e., (i)
both breasts should settle within the chest width, and (ii) nipples should be in parallel and
face upward evenly. By utilizing database of accumulative anthropometry/biological
human engineering and doing some experiments on designated materials, the company
successfully developed the refined amorphous fiber which is strong enough yet soft to
deal with the sense of soft and sensitive breasts. The product is called “Good Up Bra”
which creates a beautiful impression (see Figure 2-4).

Chapter 2 Literature review
21
Figure 2-4 Three-dimensional image of KE “Good Up Bra” (A) and normal brassiere (B),
courtesy of Nagamachi and Lokman (2011)
Apart from KE methodology, some companies also realized the importance of
customer emotional needs and how to fulfil them. Ethnographic research is believed to be
one way to get a more in-depth and honest look at consumers (Wellner, 2002).
Ethnographic research is also known as fieldwork, immersion or observational research.
This research method is considered to be a catalyst for innovative thinking. According to
Perry et al. (2004), this method brings actionable insights, outcome of an ability to “see
with new eyes” and rejuvenated sense of energy to the customer. Compared to other
qualitative methods, ethnography brings superiority as follows (Perry et al., 2004). First,
ethnography is an inductive approach. It produces new and unconstrained findings as it is
open to any phenomenon/situation out there, instead of being restricted to what is
presumed to be relevant. Second, this method targets on context, not on laboratory-based.
It provides a deeper level of understanding, values, assumptions and new directions for
action. Third, ethnography is a holistic approach. It starts with very wide perspective and
then narrows to a very specific focus. In facts, in contrast to “one-on-ones” and “focus
group discussion (FGD)”, ethnographic method has key strenghts on opinion lead,
general market education and immersion, and hypothesis generation.

Chapter 2 Literature review
22
Lipstick is a very interesting product to show the use of ethnography. By utilizing
a small sample size, this technique is possible to explore in-depth information. This
technique starts with choice of potential lipstick users, observation, in-depth interview
and survey with each subject. The subject may be asked several questions, such as their
demography, where they want to be, what they want to do, and et cetera. According to
Wellner (2002), a case study by Radar Communications found that “feeling good” and
“looking good” are important emotional needs for lipstick users. These needs were then
translated into product characteristics (e.g., lip and skin products, aromatherapy, natural
color, and et cetera). Thus, it gives valuable input for marketer and product designer.
Expensive cost is still a sensitive concern on this technique (Wellner, 2002; Perry et al.,
2004). The results from ethnographic survey can be combined with QFD in setting design
targets and also the priority for development and improvement.
2.1.7 The common supporting tools used in KE
As one of the powerful consumer-oriented tools in product development, the
future growth of KE makes it necessary to develop a methodology of how different tools
can work together in order to quantify the impact of particular product properties on
customers‟ Kansei (Schütte et al., 2004).
2.1.7.1 Semantic differential (SD)
SD is a common method to measure the emotional content of words objectively in
the 1960s (Osgood and Suci, 1969). More than 30 years later, it became the most
prevalent method of modern KE. At the initial use of SD, subjects are required to rate the
signs or words of objects on bipolar scales. A respondent is asked to choose where his/her
position lies on bipolar scales (right and left sides) (see Figure 2-4). The applicability of

Chapter 2 Literature review
23
this method in KE has been shown by Lottum et al. (2006) and Hsu et al. (2000) through
empirical studies on footwear and telephone designs, respectively.
Elegant Inelegant
Figure 2-5 An example of a 5-point rating scale
2.1.7.2 Quality function deployment (QFD)
QFD is a quality tool to improve customer satisfaction by translating their
requirements into appropriate technical measures (Sullivan, 1986; Akao and Mazur,
2003). Not only does this increase customer satisfaction, QFD also delight customers
through innovation (Lee et al., 2000).
The critical part in QFD is to construct a house of quality (HOQ). It is where
customer requirements meet with technical measures. An HOQ serves as a product-
planning matrix that consists of customer requirements, technical measures, target values
and competitive analyses. In short, an HOQ provides useful information of target setting
and improvement priority (Pawitra and Tan, 2003).
There is a similarity and a difference between KE and QFD. They both try to
capture what customers need and want, and then translate them into systematic product or
service capabilities. KE, however, focuses on customer emotional needs and wants.
Nowadays, QFD application reaches to lifestyle, image and psychological needs
(Mazur, 2005). Such notion is called „lifestyle deployment‟, which is a modified QFD in
dealing with customer Kansei. In integrating with QFD, KE is designed to interpret and
to evaluate the unspoken and unconscious wants and needs (Schütte et al., 2004; Schütte,
2005).
Chapter 2 Literature review
24
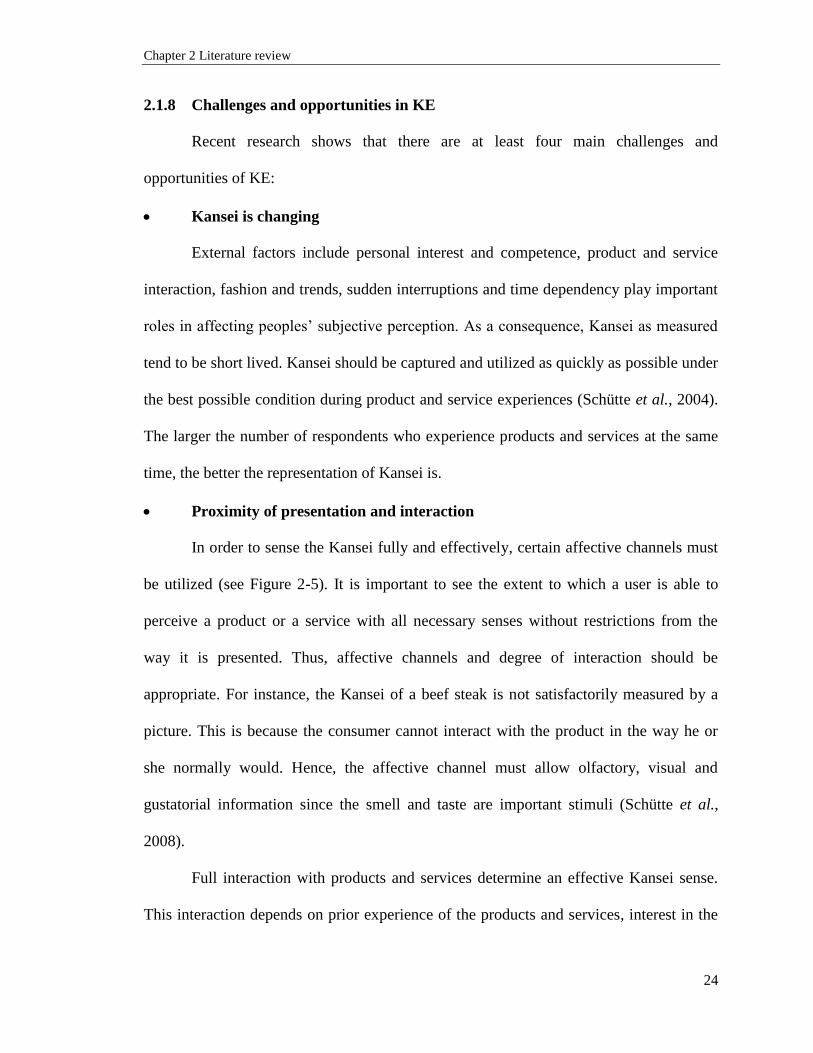
2.1.8 Challenges and opportunities in KE
Recent research shows that there are at least four main challenges and
opportunities of KE:
Kansei is changing
External factors include personal interest and competence, product and service
interaction, fashion and trends, sudden interruptions and time dependency play important
roles in affecting peoples‟ subjective perception. As a consequence, Kansei as measured
tend to be short lived. Kansei should be captured and utilized as quickly as possible under
the best possible condition during product and service experiences (Schütte et al., 2004).
The larger the number of respondents who experience products and services at the same
time, the better the representation of Kansei is.
Proximity of presentation and interaction
In order to sense the Kansei fully and effectively, certain affective channels must
be utilized (see Figure 2-5). It is important to see the extent to which a user is able to
perceive a product or a service with all necessary senses without restrictions from the
way it is presented. Thus, affective channels and degree of interaction should be
appropriate. For instance, the Kansei of a beef steak is not satisfactorily measured by a
picture. This is because the consumer cannot interact with the product in the way he or
she normally would. Hence, the affective channel must allow olfactory, visual and
gustatorial information since the smell and taste are important stimuli (Schütte et al.,
2008).
Full interaction with products and services determine an effective Kansei sense.
This interaction depends on prior experience of the products and services, interest in the

Chapter 2 Literature review
25
products and services and also degree, time and context of interaction (Schütte et al.,
2008). Logically, participants with a high proximity of interaction usually deliver more
relevant Kansei results than others.
KE is a way of innovation
A lack of innovativeness is a hot issue to spur the use of the KE methodology
(Schütte et al., 2008). The integration of creative and supporting tools with KE
methodology such as brainstorming, Pareto diagram, affinity diagram and other methods
is encouraged in order to collect new and innovative ideas.
KE deals with the long-term usage of products and services. The concept of
attractive quality creation (Kano et al., 1984) may give an innovative idea to KE. It is
about to give suggestions and directions to the existing products and services which
trigger creativity rather and revolutionize the product and service types.
Figure 2-6 The affective flow developed by Schütte (2005)
KE is not meant for product development only
Shimizu et al. (2004) imply that KE is not only applicable for product
development, but for all areas of the human existence such as culture, society and
philosophy. As long as there is a human-system interaction, KE can contribute.

Chapter 2 Literature review
26
2.2 Quality
In order to fit what a customer needs and wants, a product or a service should be
qualified. Quality can be defined as “fitness for use”, “conformance to requirements”
and “lost to society”. According to Hollins and Shinkins (2006), there are five
approaches to describe quality (see Table 2-1).
Table 2-1 Five approaches to define quality Approach Definition
Transcendent It is recognized when we experience it using our senses
Manufacturing It is how well the product matching the design specification
Product-based It is defined by measurable characteristics
User-based It is fitness for use as perceived by customers
Value-based It is a balance between price and performance
In terms of product and service consumption, a definition of quality was proposed
by Bergman and Klefsjo (1994), i.e., “The quality of a product (article or service) is its
ability to satisfy the needs and expectations of the customer”. Essentially, the quality of
products and services should be evaluated and assessed from customers‟ perspectives.
2.2.1 Quality in the framework of human factors and Kansei
By incorporating human factors and affect, quality of products and services
should promote happiness and health to the users. Improved quality and long-lasting
products make customers happy (Nagamachi and Lokman, 2011). According to Tribus
(1990), quality is defined as a condition when customers have a love affair and emotional
bondage with particular products and services (Tribus, 1990). It implies that the main
concern of qualified products and services is customer emotional experience.
2.2.2 The Kano model and KE
Inherently, the Kano model categorizes customer attributes into three different
types, namely, Must-be (M), One-dimensional (O) and Attractive (A) (see Figure 2-6). A
Must-be (M) or basic attribute is related to something taken for granted and not

Chapter 2 Literature review
27
mentioned explicitly by customers. The absence of this attribute will cause significant
dissatisfaction, while the existence of it will not give any significant impression.
Provision of toilet paper in a hotel restroom is an example of basic quality. Late
availability of it brings complaint from customers.
A One-dimensional (O) attribute shows the linear relationship between customer
satisfaction and the performance of the product/service attribute. The better the
performance, the higher the level of customer satisfaction is. For instance, a faster hotel
check-in process results in higher customer satisfaction.
The Attractive (A) attribute, known as delighter, is beyond customer expectation.
A little fulfillment of it brings a great deal of satisfaction. Free ultra speed wireless
internet access in a hotel is an example of this attribute.
The attractive attribute of a product or a service can provide a „wow‟ impression
to customers. It is a precious key to compete in the market place (Matzler and
Hinterhuber, 1998). Therefore, it can be of a great opportunity for companies since most
customers do not realize their attractive needs. In the context of integrating customer
Kansei into products, the Kano model is highly relevant. The Kano attractive feature is
deemed closely connected to affect (Schutte, 2005).

Chapter 2 Literature review
28
Figure 2-7 The Kano model modified from Kano et al. (1984) and ReVelle et al.
(1998)
The idea of integrating the Kano model and KE was first investigated by Lanzotti
and Tarantino (2008). Though, this typical research is less explored. There has been no
research, however, that analyzed the relationship between the performance of products/
services and Kansei. Details of the Kano contribution to KE are discussed in Chapter 8.
2.2.3 Kansei quality management (KQM)
It is a recent type of KE that focuses on service quality. This concept is inspired
by the concepts of quality control (QC) and total quality control (TQC). KQM is
described as quality management practice which begins with focusing on customers‟
Kansei to maximize total customer satisfaction.
Customers, definitely, have specific Kansei expectations when they approach
either manufacturing or service companies. Products and services offered should match
customers‟ Kansei (see Figure 2-7). Likewise, employees‟ Kansei plays an important role
in meeting customers‟ Kansei. This combined role is known as organizations‟ Kansei.

Chapter 2 Literature review
29
Thus, hardware, software and humanware must interact with one another in order to
match customers‟ Kansei.
Figure 2-8 Diagram of Kansei quality management system (Nagamachi and
Lokman, 2011)
Employees‟ emotion and satisfaction will influence positively on customer
emotion, service encounter satisfaction and behavioral intention/customer loyalty.
Positive inner emotions of customer show positive effects on positive emotions during
service delivery and encounter (Pugh, 2001). A study by Lin and Lin (2011) showed
physical surroundings in services (tangible aspects), internal part of employees‟ emotion
(inner emotion) and group mood (moods of surrounding people/colleagues in work
teams) bring positive impact on employee affect delivery. The physical surroundings may
include store atmosphere (e.g., air quality, lighting, odor and music) and physical
environment (e.g., display, facility and space). Employees‟ inner emotions consist of
enthusiastic, interested, determined, excited, inspired, alert, active, strong, proud, and
attentive (Watson et al., 1988). Group moods include facial expressions, vocal indicators
and body gestures/movements. These are all the significant factors of customer emotion
and service outcomes. Indeed, during service encounters, front-line employees are very

Chapter 2 Literature review
30
important in providing positive emotions, such as warmth and friendliness (Ashforth and
Humphrey, 1993).
In service encounters, it shows that customers‟ evaluations correlate significantly
with their displayed emotions during transaction and postencounter states (Mattila and
Enz, 2002). The overall evaluation of organization is influenced by customers‟ affective
process.
According to Mattila and Enz (2002), positive emotion in the customer leads to
customer satisfaction and behavioral intentions. This emphasizes that employee affect
delivery plays an importance role in service firms‟ longterm business success (Lin and
Lin, 2011). Several implications/practical contributions for service provider/manager
should be taken into consideration. According to Lin and Lin (2011), employees should
be encouraged to develop empathy and responsiveness with customers by putting
themselves in the customers‟ point of view, while regulating their own inner emotions.
Within group members, a manager should aware of employees‟ moods and develop
mutual relationships with all members within the group. In addition, when designing
physical surroundings/servicescape, employee needs should be taken into account. It is
thus confirmed that service firms should focus their attention on both employees‟ and
customers‟ emotions to enhance customer delight (Rust and Oliver, 2000).
In KQM system, it is highly expected to provide consistent Kansei all the way
through reception, main process (i.e., offering of products and services) and payment to
customers (Nagamachi and Lokman, 2011). Expected services may include providing
good service and treatment at the reception and always asking feedbacks and addressing

Chapter 2 Literature review
31
customers by their names. In order to maintain the consistency of quality of services and
products, quality control takes place.
2.3 Services and human factors
Essentially, services reveal an interaction between two parties. It is a human-
oriented activity where humans play the roles of provider and customer. The centrality of
human in both human factors/ergonomics and service science forms the basic link to
further explore the possible area of intersection between them.
Service is a prominent driver of economic growth in today‟s global world. It is
defined as activity, deed or process and interaction rather than goods (Solomon et al.,
1985; Lovelock, 1991; Zeithaml and Bitner, 2003; Vargo and Lusch, 2004). Service is
also viewed as a wider concept of product (Edvardsson, 1997). Since it is argued to be an
integrative process and interaction rather than an object, service encounters will be a
critical part of services (Lovelock, 1991).
The focus of services today and in the future is on how we capture and deliver the
added-values to customers based on their views and perceptions. It is no longer strictly
on the differences between goods and services (Edvardsson et al., 2005). Thus, customer
and company should portray a service to make its perspective and purpose clear.
Basically, the characteristics of services are IHIP (Intangibility, Heterogeneity,
Inseparability and Perishability) (Zeithaml et al., 1985). They may also include lack of
transportability, labor intensity, demand fluctuation, and et cetera.
There is a similarity between human factors and service disciplines. Initially,
human factors have workplace programs aim to reduce the severity of musculo-skeletal
disorders (MSDs). Nowadays, human factors/ergonomics has been expanded into socio-

Chapter 2 Literature review
32
technical systems by focusing on the redesign of organizations to meet people and
organizational needs (Hendrick, 1997). It is known as macro ergonomics. Though
ergonomics has been applied to service industries such as emergency medical service
(Drury, 1984) and transportation (Wiener and Nagel, 1988), its exploration in service
encounters is relatively less (Drury, 2003).
The critical part of services is service encounter. There has been little study of the
service encounter from a human factors viewpoint (Falzon, 2000). Falzon (2000)
introduces four possible conditions when human factors involved in service encounters: i)
the absent customer, ii) the customer as a factor in work conditions, iii) the customer as
an object of work and iv) the customer as a partner in a cooperative work. He argues that
a more direct study of the human factors and ergonomics of customer interaction is
required.
As argued by Drury (2003), there are many opportunities for combining the
human factors and service quality fields, such as interface design, error free services,
maximizing operator well-being and function allocation. Inherently, human factors has a
concern with human well-being applied to both the customer and the employee. In terms
of the scope of service industries, human factors and service quality need to exploit their
similarities rather than dwell on their differences to ensure satisfying employment (Drury,
2003).
2.3.1 Dimensions of services: servicescape and people interactions
When customers evaluate services, they tend to focus on both appearance and
external impression. Consumers are more likely to judge and evaluate tangible aspects,
such as external appearances and physical surroundings. Actually, the service evaluation

Chapter 2 Literature review
33
is not only involving physical appearances and surroundings, but also the overall quality
of services.
What constitutes physical appearances and surroundings in services refers to
servicescape (Bitner, 1992). It builds the quality of social interaction between customers
and employees. Once servicescapes are designed and built, they are not easy to change.
Hence, they are very costly in terms of effort and time (Lovelock and Wirtz, 2007).
Bitner (1992) introduces a framework of servicescape that consists of three parts:
i) ambient conditions (e.g., temperature, air quality, noise, music, scent, et cetera), ii)
space and function (e.g., layout, equipment, furnishings, et cetera) and iii) signs, symbols
and artifacts (e.g., signage, personal artifacts, style of décor, et cetera). Likewise, Lin
(2004) categorizes servicescape into two components (Hall, 1969), i.e., distance receptors
and immediate receptors. The former refers to the retrieval of visual sensory input from
the eyes, auditory sensory data from the ears and olfactory sensory input from the nose.
The latter discusses the specific sensory responses through skins, membranes and
muscles. Some examples may include (Lin, 2004): i) visual cues (e.g., color, lighting,
space and function, personal artifacts and plants), ii) auditory cues (e.g., music and non-
musical sounds), iii) olfactory cues (e.g., scents and ambient odors) and iv) immediate
receptors (e.g., temperature, texture, hardness and shape).
Regarding non-physical appearances and surroundings in services, they refer to
the active interaction between the customers and the employees. This recalls the
definition of services as the application of specialized competences (knowledge and
skills) through processes, activities and interactions which rather than things (Vargo and
Lusch, 2004; Lovelock, 1991). This interactive process is expected to provide solutions

Chapter 2 Literature review
34
to the customers‟ problems (Edvardsson et al., 2005; Gronroos, 2001). Prompt service
and friendliness of the receptionist in a luxury hotel can be regarded as the examples of
the interactive process between the customer and the employee. Norman (2004) proposes
an interesting example in contrasting differences between the two. He highlights the
different strategies in fashion industries to serve customers better in the cases of Gap®,
Banana Republic® and Diesel
®. Gap
® and Banana Republic
® standardize their store
layouts to put their customers at ease (servicescape-oriented); whereas Diesel®
deliberately confuses its layout. It thus drives the Diesel‟s customers to approach a
helpful salesperson (interaction-orientation).
2.3.2 Service Quality
The quality of products and services is measured by the degree to which the
products and services meet the customers‟ expectations and needs. Service quality is
positively related to customer emotional satisfaction in many research (Wong, 2004).
According to Kotler et al. (2003), service quality comprises two main aspects, i.e.,
technical quality and functional quality. Technical quality refers to tangible aspects and
physical appearances of the services (servicescape). It is what is delivered to the
customers and what the essential features the customers receive after the customer-
employee interactions have been produced. Physical surroundings may unconsciously
affect people emotion, cognition and behavior. Exterior facilities, general interior, store
layout, interior displays and social dimensions in a retail store show the examples of
technical quality of services (Lovelock and Wirtz, 2007). Functional quality refers to
intangible aspects of services. It focuses on the interaction between customers and
employees during service encounters (Brady and Cronin, 2001; Kotler et al., 2003).

Chapter 2 Literature review
35
Parasuraman et al. (1988, 1991) introduce a service quality model (known as
SERVQUAL) for measuring and exploring overall customer experiences. This model
covers five dimensions as follows:
(1) Tangibles: It includes all physical facilities and personnel appearances such as
exterior facilities (e.g., size of building, architectural style, parks, et cetera),
interior facilities (e.g., flooring and carpeting, lighting, scents, et cetera), social
dimensions (e.g., employee uniforms and personnel characteristics), music, color,
room layout, signs, symbols and artifacts (Lovelock and Wirtz, 2007).
(2) Reliability: It is an organization‟s ability to perform the promised services
accurately.
(3) Responsiveness: It refers to the willingness to help customers and provide prompt
services.
(4) Assurance: It is the knowledge and courtesy of employees and their ability to
convey trust.
(5) Empathy: It is a caring and individualized attention that an organization provides.
Human factors should satisfy at least one of the service quality dimensions and
requirements. Strawderman and Koubek (2008) propose a unified framework of human
factors and service quality dimensions, and test it by taking an empirical study at a
student health centre (see Figure 2-8). The dimension “Usability” is added in the unified
framework. When experiencing a certain service, it is argued that customers will evaluate
all these service quality dimensions.
The customers‟ evaluation of service quality is reflected by the magnitude of
difference between predicted and perceived services. During service encounters, there are
five gaps identified (Parasuraman et al., 1988): i) a gap of customer expectation and
management perception, ii) a gap of management perception and service quality
specification, iii) a gap of service quality specification and service delivery, iv) a gap of
service delivery and external communication and v) a gap of perceived service and
delivered service.

Chapter 2 Literature review
36
Human Factors
Productive
Safe
Comfortable
Effective
Reliability
Responsiveness
Assurance
Empathy
Tangible
Service Quality
Responsiveness
Reliability
Usability
Assurance
Empathy
Tangible
Learnability Memorability
Service Quality
Figure 2-9 Proposed human factors-service quality by Strawderman and Koubek
(2008)
2.3.3 Emotions in services
Service encounters involve both cognitive and affective processes (Oliver, 1993).
Basically, both affect and cognition are information-processing systems, but they have
different functions. The affective process is deemed to be a mediator between the
cognitive process and customer satisfaction (Oliver and Westbrook, 1993). Helander and
Khalid (2006) highlight the difference between affect and cognition (see Figure 2-9).
Affective processes make judgments and quickly help us determine which things in the
environment are dangerous or safe. In contrast to affect, cognition forms beliefs,
knowledge and information processing.
Norman (2004) elaborates on the complex affective processes into three different
levels of the human brain. The first level is called the automatic and prewired layer. This
is where appearance matters and first impressions are formed. The second level is known
as the behavioral level. It is about use and experience with a product which have three
facets (i.e., function, performance and usability). The third level is the contemplative part
of the brain or the reflective level. It is where consciousness and the highest levels of

Chapter 2 Literature review
37
feelings, emotions and cognition reside. In other words, it is only here that the full impact
of both emotions and cognitions are experienced.
In Japanese, affect is known as Kansei. There are two kinds of affect (i.e., positive
and negative affects) significantly related to customer satisfaction (Oliver, 1993;
Westbrook, 1987; Izard, 1977; Mano and Oliver, 1993; Dube and Morgan, 1998; Philips
and Baumgartner, 2002). Affects or emotions have been intensively explored in many
different contexts (Laros and Steenkamp, 2005), such as: advertisement (Derbaix, 1995),
mediator on the customer satisfaction (Philips and Baumgartner, 2002), customer
complain (Stephens and Gwinner, 1998), service failures (Zeelenberg and Pieters, 1999)
and product attitudes (Dube et al., 2003). The importance of emotions as the main aspect
in consumer research is summarized in Table 2-2.
There are some measures of consumption emotions. Plutchik (1991) proposes
eight primary dimensions that include fear, anger, sadness, disgust, expectancy,
acceptance, joy and surprise. Izard (1977) presents an emotional scale which is composed
as ten emotions (enjoyment, interest, surprise, anger, fear, contempt, disgust, guilt,
distress and shame). In addition, Mehrabian and Russell (1974) propose two dimensions
of emotion: i) pleasure dimension (e.g., happy-unhappy, pleased-annoyed, satisfied-
unsatisfied, contented-melancholic, hopeful-despairing and relaxed-bored) and ii) arousal
dimension (e.g., stimulated-relaxed, excited-calm, frenzied-sluggish, jittery-dull, awake-
sleepy and aroused-unaroused). It is then followed by Richin (1997) that uses forty three
emotional elements, such as frustrated, angry, irritated, discontented, nervous, worried,
scared, embarrassed, contented, fulfilled, et cetera.

Chapter 2 Literature review
38
Table 2-2 Overview of consumer research using emotions on satisfaction1
Reference Emotions used from Resulting structure Industry/domain
Edell and Burke (1987) Edell and Burke (1987) Upbeat, negative and warm Advertisement
Hollbrook and Batra
(1987)
Hollbrook and Batra
(1987)
Pleasure, arousal and
domination
Advertisement
Westbrook (1987) Izard (1977) Positive and negative affect Otomobile owners and
CATV subscribers
Olney et al. (1991) Mehrabian and Russell
(1974)
Pleasure and arousal Advertisement
Holbrook and Gardner
(1993)
Russell et al. (1989) Pleasure and arousal Advertisement with musical
stimuli
Mano and Oliver (1993) Watson et al. (1988);
Mano (1991)
Upbeat, negative and warm;
positive and negative
Consumer products
Oliver (1993) Izard (1977) Positive and negative affect Education: a course of
principles of marketing and
otomobiles
Derbaix (1995) Derbaix (1995) Positive and negative affect Advertisement and brand
Steenkamp et al. (1996) Mehrabian and Russell
(1974)
Arousal Fear-appeal advertisement
Nyer (1997) Shaver et al. (1987) Anger, joy/satisfaction and
sadness
Computer software
benchmarking
Richins (1997) Richins (1997) Anger, discontent, worry,
sadness, fear, shame, envy,
loneliness, romantic love,
love, peacefulness,
contentment, optimism, joy,
excitement and surprise
Six empirical studies were
conducted in use of a favorite
possession, a recent
important purchase, or a
recent purchase of a clothing
item, a food item, a durable
good or a service
Dube and Morgan
(1998)
Watson et al. (1988) Positive and negative affect Health care services
Philips and
Baumgartner (2002)
Edell and Burke (1987) Positive and negative affect New product to be
introduced, i.e., a new orange
juice
Ruth et al. (2002) Shaver et al. (1987) Love, happiness, pride,
gratitude, fear, anger,
sadness, guilt, uneasiness and
embarrassment
Advertisement
Smith and Bolton
(2002)
Smith and Bolton (2002) Anger, discontent,
disappointment, self-pity and
anxiety
Restaurant and hotel
In spite of wide divergence in the context of emotions used in consumer research,
researchers frequently use a relatively small number of dimensions (Bagozzi et al., 2002).
According to Russell (1980), emotions are divided into two categories, i.e., pleasure and
arousal. The classification of emotions into positive affect and negative affect is
intensively utilized (see Table 2.3). It is quite simple and common, and it can cover any
1 It is adopted from Laros and Steenkamp (2005)

Chapter 2 Literature review
39
categorization of affect. Positive emotions lead to a decision to continue with the plan
and stay in the involvement, whereas negative emotions (outraged) result from problems
with ongoing plans and failures to achieve desired goals (Stein et al., 1996; Bagozzi et
al., 2002; Wong, 2004).
In order to integrate different research streams concerning emotions contents and
structures, Laros and Steenkamp (2005) propose a hierarchy of emotions that comprises
three levels (see Table 2-3): i) the super ordinate level with positive and negative affects,
ii) the basic level with four positive and four negative emotions and iii) the subordinate
level with specific emotions.
Table 2-3 Hierarchical consumer emotions (Laros and Steenkamp, 2005) Super Negative affect Positive affect
Basic Anger Fear Sadness Shame Contentment Happiness Love Pride
Su
bo
rdin
ate
Angry Scared Depressed Embarrassed Contented Optimistic Sexy Pride
Frustrated Afraid Sad Ashamed Fulfilled Encouraged Romantic
Irritated Panicky Miserable Humiliated Peaceful Hopeful Passionate
Unfulfilled Nervous Helpless Happy Loving
Discontented Worried Nostalgia Pleased Sentimental
Envious Tense Guilty Joyful Warm-hearted
Jealous Relieved
Thrilled
Enthusiastic
In short, the service encounter is a critical part of the interaction between
customers and all dimensions of services (e.g., servicescape and service contact
employees) (Bitner, 1990). According to Shostack (1985), it is defined as “a certain
period of time when customers directly interact with certain services”. It involves
discrete, separate and distinct events and behavior. During the customer-employee
process, more concerns should be addressed on how to minimize any negative emotion
since they have stronger effects than positive emotion on overall satisfaction (Liljander
and Strandvik, 1997).

Chapter 2 Literature review
40
Figure 2-10 The cross-coupling of affect and cognition (Helander and Khalid, 2006)
2.3.4 Customer expectation, cognition, affect and satisfaction
Westbrook (1987) conducted a study to investigate the effect of consumer
emotional responses on product experiences and post purchase behaviors. Past product
and service experiences drive customer expectation. Generally, there are two kinds of
customer expectation (Iglesias, 2004): “will” and “should” expectations. “Will” refers to
what is going to be in the future, thus, it is called future-oriented expectation. “Should”
discusses about what should be like, it is known as present-oriented expectation
(Bounding et al., 1993).
Cognition in product and service experiences may refer to the formation of pre-
consumption expectancies, to observe performances, to compare product performances
with expectations, to form disconfirmation perceptions, to combine perceptions with
expectation levels and to form satisfaction judgments (Oliver 1980, 1993; Tse and
Wilton, 1988). Cognitive processes essentially cover expectation formation processes. It
makes a comparison between performance and expectation, an equity judgment and
causal attributions (Oliver, 1993).
Cognition is argued to be a driver of affect (Russell, 1980). According to this
view, disconfirmation of expectation and perception is the most immediate influence on
satisfaction. Consumers form expectations about functional attributes of a product or a

Chapter 2 Literature review
41
service, evaluate how it actually performs on its attributes and compare its perceived
performances with prior expectations (Philips and Baumgartner, 2002). Product and
service performances influence customer satisfaction and dissatisfaction through two
mechanisms (Bolton and Drew, 1991). First, it is directly through consumer observation
of good and bad performances. Second, it is indirectly as an input to the disconfirmation
comparison.
Regarding emotion or affect or affective process or Kansei (in Japanese), Oliver
(1980; 1993) proposes a model of modified expectancy-disconfirmation theory. Emotion
is argued to be a mediator of product evaluation and satisfaction. Product evaluation
includes expectation and perceived performance.
The relationship between customer expectation, perceived performance, emotion
and satisfaction is summarized (Oliver, 1980; 1993; Wong, 2004; see Figure 2-10).
According to Oliver (1993), there are three different scenarios of disconfirmation: i) if
performance is equal to customer expectation, confirmation is met, ii) if performance is
greater than expectation, positive disconfirmation occurs, iii) if performance is less than
expectation, negative disconfirmation occurs.
Figure 2-11 The modified expectancy-disconfirmation theory adopted from Oliver
(1980; 1993)
2.3.5 Behavioral intention
Behavior intention is a similar form of customer loyalty. It is a customer intended
action as a result of satisfaction. Bowen and Shoemaker (1998) define the behavioral
intention as a likelihood of customers returning, making business referrals, providing

Chapter 2 Literature review
42
strong “word-of-mouth” and providing references and publicity to others. According to
Ladhari (2009), he utilized three different variables to assses customer behavioral
intentions in hotel services. These variables include recommendation to acquaintances,
first choice of service provider and willingness to pay higher price.
Emotional satisfaction is positively related to customer loyalty (Liljander and
Strandvik, 1997; Wong, 2004). A positive emotion triggered by the provision of
excellent service quality may lead to a high level of customer satisfaction, increase of
hedonic service value and repurchase intention (Oliver et al., 1997, Babin and Attaway,
2000). Conversely, a negative emotion will cause dissatisfaction and no loyalty.
2.3.6 Cultural differences on service quality
Cross-cultural studies in the 1970s were gradually globalized and valued in the
1990s. This topic of study is regarded as a recent research direction for international-
based hotels service quality (Weiermair, 2000). The relationship between cultural
differences and the evaluation of service quality have been confirmed (Matilla, 1999). In
cross-cultural studies, nationality is merely deemed to be the basis for profiling the
interviewees (Huang et al., 1996; Hsieh and Tsai, 2008). However, there is little research
on whether the individual cultural background will affect his/her evaluation of service
quality (Weiermair, 2000).
In Kansei studies, service providers and managements should recognize different
Kansei of customers from different cultures. In order to reduce cultural shock and further
diminish the service gaps, service providers and managements must understand how the
needs of their customers differ (Hsieh and Tsai, 2008). This applies to both the present
and future customer Kansei.
Chapter 2 Literature review
43
Similar to other related service quality researches on cultural differences, this
research adopts the Hofstede‟s cultural perspectives (Hofstede and Bond, 1988) as the
main basis for the analysis and deduction. This is a nationality-based evaluation.
According to Hofstede and Bond (1988), there are five dimensions to explain national
culture values: i) “individualism”, ii) “power distance”, iii) “uncertainty avoidance”, iv)
“masculinity” and v) “long-term orientation”. Each dimension has a score range of 1 to
100. The higher the score, the greater is the dimension characteristic.
There is a close relationship between the Hofstede‟s cultural perspectives and the
Parasuraman‟s SERVQUAL dimensions. According to Hsieh and Tsai (2008), people
with high scores on “individualism” tend to value “assurance” and not to value
“empathy”. People with more “power distance” will pay more attention upon “tangible”,
“reliability”, “responsiveness” and “empathy”. The higher “uncertainty avoidance” and
“masculinity”, the higher is the value of “tangible” and “empathy”, respectively. High
value of “long-term orientation” demands low value of “assurance”.
Research on the effects of cultural differences on Kansei is still at the stage of
exploration. Its empirical studies are quite few and far between. Schütte (2002) points
out that there is lack of KE studies incorporating cultural differences.

Chapter 3 Research gaps, objectives and questions
44
3 Research gaps, objectives and questions
This chapter discusses three potential research gaps as formulized according to what is
discussed in Chapter 2. It is then followed by the research objectives and questions.
3.1 Research Gaps
3.1.1 Gap 1: Lack KE methodology to services
KE has been developed over the last more than 30 years in Japan. Nowadays, this
methodology is growing in some Asian countries (e.g., Korea, Taiwan). As previously
reviewed, KE was intensively applied to the development and evaluation of tangible
(physical) products. The development of products, however, has becomes more and more
complex. The tangible and intangible parts of products are mixed up. Thus, it brings a
great opportunity to extend the application of KE to intangible parts of products, i.e.,
services (Schütte, 2002; 2005). Service is the fastest growing sector in today‟s business.
Only a few researches of KE in services have been internationally published.
Actually, Nagamachi has initiated and expanded the application of KE on services (e.g.,
hotel, department store and restaurant) in the 1980s (Nagamachi and Lokman, 2011).
Recently, this issue has been published in the Kansei International Journal with a special
topic on „emotion and sensibility applications to the businesses‟. It indicates that KE
research in service industries is still of interest and growing. According to Nagamachi
and Lokman (2011), Kansei in service quality (known as KQM) is potentially grown.
This is a recent development of KE application.
However, a limited number of international publications of KE in services may be
due to culture and country-specific issues. International publications are quite related to

Chapter 3 Research gaps, objectives and questions
45
formal English mastery. Asians are non-English speaking countries. Many Asian
countries do not use English as their main language for daily communication and formal
business. This would be of great challenge since international published journal papers
must be well written in formal English.
Asian countries with low English proficiency, generally, have low rates of
international publications which are independent of research fundings (Man et al., 2004).
This condition is supported by the reticence and passivity of Asian people (especially
East Asians) when they are in English courses (Cheng, 2000).
In academic studies, high scores of Test of English as a Foreign Language
(TOEFL), International English Language Testing System (IELTS) and oral
communication skills reflect the English proficiency. Average Computer-Based TOEFL
(CBT) and IELTS scores for Asian countries are consistently lower than those of
European countries. In 2004 and 2005, the Asians achieved a mean CBT score of 215.3,
whereas the European examinees obtained 238.4 out of 300 (Kim and Lee, 2006). On
July 1997 to June 1998, the paper-based TOEFL scores for Asian and European
examinees were 529.5 and 563.1, respectively. At the same period, the national means for
China and Japan were 560 and 498, respectively. Six years after, the Chinese people
obtained a score of 215 whereas the Japanese people obtained a score of 191 on CBT. A
study indicates that submissions from non-English speaking countries are less likely to be
accepted for international publications (Man et al., 2004).
KE in services lacks of its formal methodology. Fortunately, referring to the
superiority of KE, this method can be developed, added and integrated with relevant
methods and tools (Schütte, 2005). Common service methods related to customer

Chapter 3 Research gaps, objectives and questions
46
preference characteristics such as SERVQUAL, the Kano model and QFD have the
potentials to be combined with KE methodology.
KE-type I “category classification” has a potential to be applied to service
research. It starts with a marketing survey (e.g., interview or questionnaire) by asking
customers about their emotional needs (Kansei) to certain services. Since services are
activities and interaction between clients, contact personnel and service organizations
(Drury, 2003), any feedback from customers can be captured as value creation for Kansei
words. According to Nagamachi and Lokman (2011), this is called Kansei quality.
In service research, customer emotions are influenced by expectation and
perceived performance. This cognitive evaluation on perceived service quality items has
been shown by Ladhari (2009) using the SERVQUAL model (Parasuraman et al., 1991).
Although the debate about the relationship between cognition and affect still remains
unresolved (Lin, 2004), this study is proposed in line with KE methodology (Nagamachi,
1995).
Cognitive state is the antecedence of emotional state as argued by some
researchers (Lazarus, 1999; Oliver, 1980). Likewise, Kansei is a function of external
stimuli (Nagamachi, 1995; Schütte et al., 2004, 2008; Schütte, 2005). According to the
concept of Gestalt psychology, Lin (2004) argues that when customers evaluate a
servicescape, their individual perception serves as a cognitive experience which
stimulates their emotional responses (e.g., pleasure, arousal and dominance). Clearly,
cognition antedates emotion when individuals are appraising the servicescape as noted by
Lazarus (1999).

Chapter 3 Research gaps, objectives and questions
47
This study extends the expectation-disconfirmation theory (Oliver, 1980) among
cognition, emotion, satisfaction and behavioral intention to build KE framework applied
to services (see Figure 3-1).
Figure 3-1 Modified framework of KE in service encounter
3.1.2 Gap 2: Very little attention paid to the dynamics of customer preferences in
the steady-state condition
Different types of everyday experiences may directly trigger different types of
emotions (Oliver, 1993). For instance, a loss of money would cause sadness, while
pleasantly product performance would cause delight and happiness relatively at the same
time. How to design products and services according to changes of customer preference
is a challenge for KE (Nagamachi, 1999). Since the likelihood of customer dynamics is
high, there is a need to provide a systematic approach to address the right and fast
interpretation of customer needs.
It is not easy to evaluate how the dynamics of product and service features elicit
customers‟ Kansei. In many cases, Kansei depends not only on one product or service
feature, but also on the composition and interaction among product and service elements
(Schütte, 2002).
Nevertheless, very little attention has been paid in investigating the dynamics of
customer needs and preferences. An empirical study to investigate the dynamics of
customer needs has been shown by Wittel and Fundin (2005). They investigate the
variance of customer perceptions of e-service attributes by taking a case in cinema e-

Chapter 3 Research gaps, objectives and questions
48
ticket. Another similar study has been done by Raharjo (2007) which highlights the Kano
model dynamics modeling by providing a quantitative technique of compositional data
analysis. Both studies highlight how quality attributes of customers change over time.
Woodruff (1997) also argues that the attributes important to the customers will change
over time. Likewise, this condition has been addressed by Kano et al. (1984). Their
approach proposes that what now excites the customer will be a common thing in the
future.
In KE, most of the relationship between Kansei and physical properties is
described by a regression model (Schütte, 2005; Schütte et al., 2004). However, this
method does not have the property to describe the dynamics of customer preferences.
This study utilizes Markov chain model to investigate the dynamics of customer
preferences in the steady-state condition. It is useful for a decision maker to make a better
strategy based upon the most updated customer survey.
3.1.3 Gap 3: Very little attention paid to cultural differences on Kansei
A lot of researches on KE are documented in Japanese papers. Schütte (2002)
conducted several pilot studies in Sweden investigating Kansei words used in some
industries. It has been found that many Kansei words collected in Japanese papers may
not be applied in other countries apart from Japan and vice versa. It can be speculated
that the cultures may be too different, but the proof for this condition is still missing
(Schütte, 2002). Different cultural backgrounds, such as different custom, ethnic,
tradition and even nationality as a whole may contribute to the different findings in
various researches on KE. However, research on the effect of cultural differences on
Kansei is relatively unexplored.

Chapter 3 Research gaps, objectives and questions
49
An empirical study by Chen et al. (2007) was conducted to explore the cross
cultural perspectives toward Kansei design using mobile phone as an object of the study.
Their research aims to investigate user emotions evoked by mobile phone features in
Taiwan, China, Japan and Korea. Their results show that the Chinese regards a mobile
phone is not only a communication gadget, but also a sign of maturity. In majority, the
Taiwanese uses a mobile phone as a conversation device rather than other functions.
While the Japanese and the Korean share a similarity of slogan “everything over mobile”.
These findings can be used as reference for designing cross-culture products.
Likewise, in the same service encounters, customers from one particular country
(e.g., Singapore) may have different Kansei impressions from other nationalities (e.g.,
Indonesia and Japan). In dealing with this, this current study discusses an exploration of
customer experiences and impressions of services among different cultural backgrounds
and differences.
In reducing potential bias, the use of emoticons attached in a survey paper is
considered. Emoticons are language-independent and graphical icons that can express
emotions and feelings. Emoticons may eliminate some difficulties in expressing feelings
using words.
These emoticons are a valuable addition to communication methods (Huang et al.,
2008). They represent individual identity, awareness, evaluation and emotions. They are
able to convey voice inflections, facial expressions and bodily gestures without language
distractions. The use of emoticons correlates with personal interaction directly (i.e., it
allows people express their emotions easily and freely) and information richness

Chapter 3 Research gaps, objectives and questions
50
indirectly (i.e., an ability to carry information and thus change a user‟s perception)
(Huang et al., 2008).
Desmet (2004) introduces „Product Emotion Measurement (PrEmo)‟ to overcome
the weaknesses of non-verbal and verbal instruments in measuring human emotions.
According to his findings, several non-verbal instruments have been introduced in
measuring emotions, such as facial expression instruments (e.g., Facial Action Coding
System, Maximally Discriminative Facial Moving Coding System and Facial Expression
Analysis Tool) and vocal instruments (e.g., effects of emotion in multiple vocal cues,
such as average pitch, pitch changes, intensity color, speaking rate, voice quality and
articulation). All these non-verbal instruments are language-independent so that they can
be used among different cultures.
3.2 Research objectives and questions
3.2.1 Research objectives
Based on the research gaps, KE has the potential to be applied to services. The
contributions of relevant service quality tools such as the Kano model, QFD and also
Markov chain are considered. All these concerns are summarized in an integrative
framework of KE in services.
This study aims to build an integrative framework of KE applied to services and
to test it by doing some empirical studies. Preliminary case studies on services in
Indonesia were conducted. It is found that design elements and service attributes
influence customer Kansei significantly (see Chapter 4).
3.2.2 Research questions
Some research questions are formulated as follows:

Chapter 3 Research gaps, objectives and questions
51
(1) What is the interrelationship among constructs of KE methodology during service
encounter?
(2) How to incorporate service quality tools (e.g., the Kano model, QFD and Markov
chain) into the KE methodology in services?
(3) How does cultural difference influence customers‟ Kansei in services?
(4) How to deal with dynamics of customer preferences in the steady-state condition and
any implications for marketing strategy?

Chapter 4 Preliminary study
52
4 Preliminary study
Some studies to evaluate customer emotional needs/Kansei in services have been carried
out. These studies involved final year student projects in Indonesia and were supervised
by the author. Some case studies were taken, including beauty salon (Winoto et al.,
2007), fitness centre/gym (Dewi et al., 2007), multiplayer game/game center (Hutomo et
al., 2007), café (Hertati et al., 2007), home theater service (Husin et al., 2007) and
policlinic for minor surgery (Rahardjo et al., 2007). The main objective of that study is to
apply KE methodology to services and to collect common Kansei words experienced.
4.1 Research methodology
These studies follow a common set of procedures (see Figure 4-1). First, a service
domain is defined and the problem is formulized. It is related to the lack of customer
emotional needs consideration in services. Second, the literature review takes place.
The third is data collection. There are two main activities involved: i) to collect
and structure Kansei words and ii) to collect and structure service attributes/design
elements. Interviews and paper surveys (questionnaires) are used to probe Kansei words.
Service attributes/design elements are collected from magazines, brochures, related
services, interviews with management and information in websites.
Fourth, data analysis is conducted. Kansei words are structured and finalized by
frequency analysis. They are then linked into engineering characteristics through the
house of quality (HOQ) and followed by a proposed design (paper prototype). The HOQ
serves as a product planning matrix which consists of customer requirements, technical
measures, target values, and competitive analyses. Through the HOQ, it gives useful

Chapter 4 Preliminary study
53
information to organisations in setting their targets and determining the priority of actions
that need to be taken (Pawitra and Tan, 2001).
Fifth, a survey is conducted to evaluate the proposed design as compared to the
current design. Sixth, at the the final step, conclusion and recommendation for further
research are discussed.
4.2 Summary of findings on several case studies
4.2.1 Services in beauty salon
A beauty salon for youngsters was chosen. Initially, the study investigated the
customer emotional needs/Kansei by interviewing potential customers. Ten potential
customers were involved. The adjective words that represent Kansei and belong to the
service domain (i.e., beauty salon) were collected. By using an affinity diagram, seven
general Kansei words have been structured, such as bright, cool, clean, spacious, sunny,
informative and soft.
Afterwards, the importance of Kansei words was measured involving another ten
potential participants. The Kansei words that are important and very important were
retained. These words were chosen by at least 50% of respondents.
A new design of beauty salon was then proposed and evaluated by involving
another ten potential customers. The participants analyzed the paper prototypes of current
condition and proposed design (see Appendix A). Their emotional satisfaction scores
were then measured and compared with the existing condition scores through t-test for
mean differences (see Table 4-1). The findings show that the proposed design is able to
increase customer satisfaction.

Chapter 4 Preliminary study
54
Figure 4-1 A general research methodology for KE in services
Table 4-1 Customer satisfaction scores for beauty salon services
Kansei words 1
st floor design
p-value#
2nd
floor design p-value
#
A* B** A* B**
Bright 2.18 4.67 < 0.001 3.52 4.53 < 0.001 Cool 2.34 4.50 < 0.001 3.48 4.63 < 0.001 Spacious 3.44 4.38 < 0.001 3.04 4.47 < 0.001 Clean 2.34 4.43 < 0.001 3.36 4.42 < 0.001 Sunny 2.84 4.62 < 0.001 2.78 4.74 < 0.001 Informative 2.76 4.38 < 0.001 3.60 4.37 < 0.001 Soft 3.60 4.33 < 0.005 3.12 4.42 < 0.001
* = current condition; ** = proposed design;# =significant at p<0.05
4.2.2 Services in fitness centre/gym
Initially, this study investigated the weaknesses of the current fitness centre
involving ten potential customers. The study covered cleanliness of waiting and exercise
rooms, comfort of room temperature, convenience of waiting room, comfort of seats and

Chapter 4 Preliminary study
55
overall current condition. It was then followed by exploring and structuring Kansei
words. By using affinity diagram, six main Kansei words were structured such as
comfortable, modern, excited, clean, spacious and cool.
A subsequent survey involving another forty potential participants was conducted.
The objective of this survey was to link the Kansei words with the designated design
elements/service attributes. The design elements were obtained from current facilities
provided in the fitness centre and from relevant literature on general requirements of
fitness centres. By using a frequency analysis, the relevant design elements were defined
(see Table 4-2).
Table 4-2 Selected Kansei words and related design elements for fitness centre
No Kansei words Related design elements/service attributes*
1 Comfortable Seat (80%), entertainment (70%), room atmosphere (50%)
2 Excited Music (68%)
3 Modern Color of wall and floor (85%), interior design (63%)
4 Clean Floor (90%), wall (85%), changing room (90%)
5 Spacious Color of wall (75%), interior design (88%)
6 Cool Room temperature (100%), color of wall (50%)
* = only those with at least 50% score were chosen
The proposed designs of fitness centre covered waiting room and exercise room.
An HOQ was used to meet Kansei words (“Whats”) with technical responses (“Hows”)
(see Appendix B). The findings show that the proposed design increases customer
satisfaction.
4.2.3 Services in multiplayer game/game centre
This study was a preliminary section on feasibility study of multiplayer game in
Surabaya (Indonesia). Similar to the previous studies, this study investigated the
customer emotional needs/Kansei involving ten potential customers. By using affinity
diagram, seven main Kansei words were structured, i.e., interesting, comfortable, cool,
clean, spacious, safe and sophisticated.

Chapter 4 Preliminary study
56
Each of the Kansei words was then linked to the relevant design elements
involving twenty potential participants. By using a frequency analysis, the relevant
design elements were defined (see Table 4-3).
Table 4-3 Selected Kansei words and related design elements for game center
No Kansei words Related design elements/service attributes*
1 Interesting Color of wall (50%), room decoration (70%)
2 Comfortable Color & type of lighting (70%), ergonomic seat & table (60%)
3 Cool Number & arrangement of Air Conditioner (70%), color of wall (60%),
attachment of air ventilation (80%)
4 Spacious Room dimension (80%), space allowance between computers sets (70%)
5 Clean Cleanliness of room (100%), cleanliness of seat and table (80%), attachment of
air refresher (50%), cleanliness of toilet (50%)
6 Safe Safety of parking lots (50%)
7 Sophisticated Up to date/upgraded computer (50%), internet connection performance (80%),
game server performance (90%) * = only those with at least 50% score were chosen
4.2.4 Services in café
By interviewing twenty potential customers, this study collected Kansei words in
café services. Through affinity diagram, nine main Kansei words were structured. They
include bright, calm, attractive, convenient, clean, spacious, organized, cool and relax.
Another survey involving fifty potential customers was then conducted to link the
Kansei words to the relevant design elements (see Table 4-4). A new design of café was
then proposed and evaluated by involving another thirty potential customers. The
participants analyzed the paper prototypes of current condition and proposed design (see
Appendix C). The finding shows that the proposed design was preferable to the current
condition.
Table 4-4 Selected Kansei words and related design elements for café
Section Kansei words Related design elements/service attributes*
Lighting design
Bright Type, number and color of lighting (80%)
Comfortable Type and number of lighting (60%)
Interesting Color of lighting (70%)
Room temperature Cool Number of air conditioner/AC (90%)
Comfortable Number of AC (80%), arrangement and position of AC (64%)
Music Calm Type of music (60%), music sound volume (90%), arrangement and
position of sound system (60%)

Chapter 4 Preliminary study
57
Comfortable Music sound volume (90%), arrangement and position of sound system
(80%)
Relax Type of music (92%), arrangement and position of sound system (80%)
Interesting Music performance (60%)
Room design
Comfortable Room design (70%), color of room wall (80%), number of chair and table
(72%), type of chair and table (70%)
Interesting Room design (50%), mini stage (82%), color of room wall (72%), and
indoor plant (70%)
Organized Room design (70%)
Bright Color of room wall (82%)
Spacious Number of chair and table (70%), room partition (52%) * = only those with at least 50% score were chosen
4.2.5 Services in home theatre
Ten potential customers were interviewed to collect Kansei words. There were
seven main Kansei words structured and selected, i.e., comfortable, cool, spacious, clean,
easy, relax and private.
Another survey of twenty potential customers was conducted to rate the
importance of each Kansei word and to link each of Kansei words to the relevant design
elements/service attributes of home theater system (see Table 4-5). Design
elements/service attributes have been collected from relevant facilities of home theater
system and from any literatures about home theater design.
Table 4-5 Selected Kansei words and related design elements for home theater
No Kansei words Related design elements/service attributes*
1 Comfortable Soft chair/sofa, color of chair/sofa (75%)
2 Cool Attached air conditioner/AC (90%)
3 Spacious Dimension of room (90%), dimension of table (75%)
4 Clean Daily room cleaning (90%), color of wall (90%), color of lighting (80%)
5 Easy Drinking bottle attached in chair (55%)
6 Relax Relaxing chair with adjustable lumbar support (80%), leg support under the chair
(50%), adjustable arm support (60%)
7 Private Wall with sound absorber (70%) * = only those with at least 50% score were chosen
HOQ was then used to link the Kansei words (“Whats”) into technical responses
(“Hows”) (see Appendix D). Another survey involving ten potential customers was
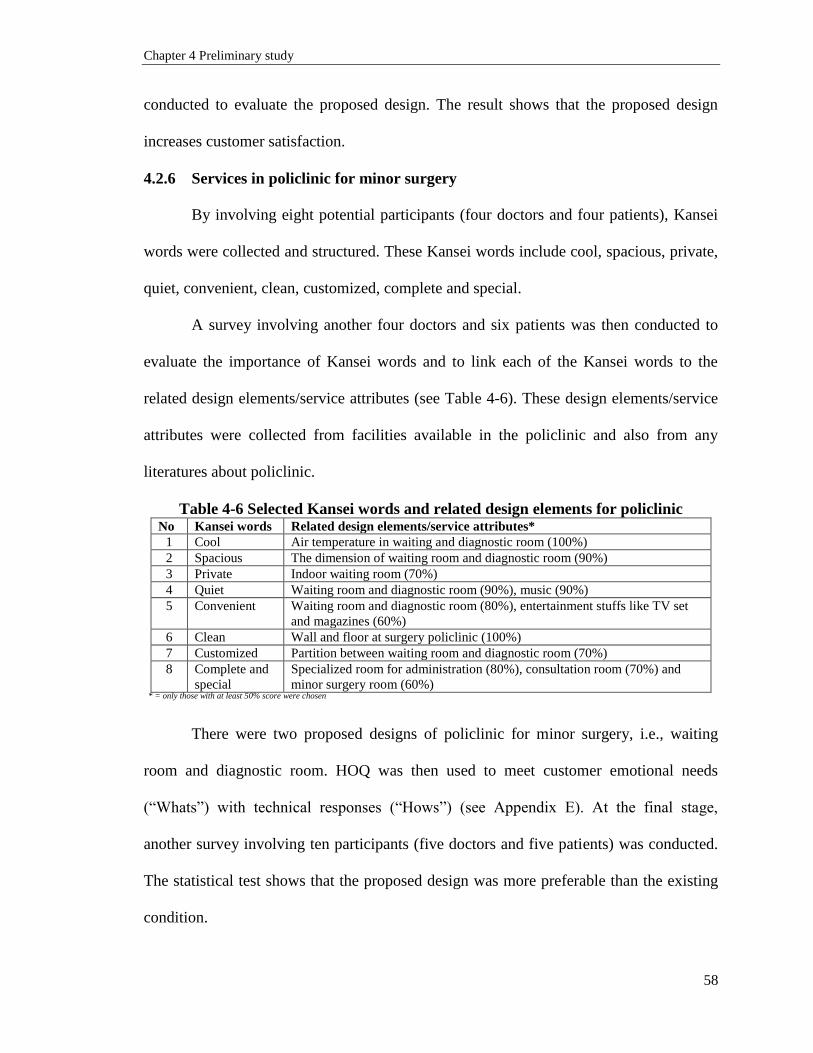
Chapter 4 Preliminary study
58
conducted to evaluate the proposed design. The result shows that the proposed design
increases customer satisfaction.
4.2.6 Services in policlinic for minor surgery
By involving eight potential participants (four doctors and four patients), Kansei
words were collected and structured. These Kansei words include cool, spacious, private,
quiet, convenient, clean, customized, complete and special.
A survey involving another four doctors and six patients was then conducted to
evaluate the importance of Kansei words and to link each of the Kansei words to the
related design elements/service attributes (see Table 4-6). These design elements/service
attributes were collected from facilities available in the policlinic and also from any
literatures about policlinic.
Table 4-6 Selected Kansei words and related design elements for policlinic No Kansei words Related design elements/service attributes*
1 Cool Air temperature in waiting and diagnostic room (100%)
2 Spacious The dimension of waiting room and diagnostic room (90%)
3 Private Indoor waiting room (70%)
4 Quiet Waiting room and diagnostic room (90%), music (90%)
5 Convenient Waiting room and diagnostic room (80%), entertainment stuffs like TV set
and magazines (60%)
6 Clean Wall and floor at surgery policlinic (100%)
7 Customized Partition between waiting room and diagnostic room (70%)
8 Complete and
special
Specialized room for administration (80%), consultation room (70%) and
minor surgery room (60%) * = only those with at least 50% score were chosen
There were two proposed designs of policlinic for minor surgery, i.e., waiting
room and diagnostic room. HOQ was then used to meet customer emotional needs
(“Whats”) with technical responses (“Hows”) (see Appendix E). At the final stage,
another survey involving ten participants (five doctors and five patients) was conducted.
The statistical test shows that the proposed design was more preferable than the existing
condition.

Chapter 4 Preliminary study
59
Table 4-7 Customer satisfaction scores for policlinic services
Kansei words Satisfaction score
p-value#
Current condition Proposed design
Cool 1.1 3.9 < 0.001 Spacious 1.4 3.8 < 0.001 Private 1.1 3.7 < 0.001 Quiet 1.2 4.1 < 0.001 Convenient 1.4 4.1 < 0.001 Clean 2.0 3.9 < 0.001 Customized 1.9 3.8 < 0.001 Complete and special 2.0 3.5 < 0.005
* = current condition; ** = proposed design; # = significant at p<0.05
4.3 Conclusion
According to the preliminary studies on six service settings, it is found that the
proposed design elements/service attributes influence customer Kansei and increase
customer satisfaction. Interview and affinity diagram are the common tools to capture
and structure customer Kansei.
Several common Kansei words that influence customer satisfaction are identified.
They include convenient, comfortable, clean, cool and spacious. These common Kansei
words are highly considered as the main voice of customer of source of delight.
According to Lovelock and Wirtz (2007), the affect-creating medium such as colors,
textures, sounds, music and spatial design enhance the desired service experience and
interaction. These findings are then further verified by taking a more complex case study
(see the subsequent chapters).

Chapter 5 Development and testing of the survey instrument
60
5 Development and testing of the survey instrument
5.1 Introduction
In the previous chapters, a set of research gaps and a preliminary study of six different
service settings have been discussed. This chapter aims to explain and discuss the
methodology used to apply KE in luxury hotel services as a more complex quantitative
study.
5.2 Data collection strategy
This chapter presents a process of preparing and collecting data. The collected
data are used to obtain important and desired information, and to make decisions about
important issues. In order to collect useful and relevant data, an appropriate research
strategy is required.
There are several conditions considered in determining a research strategy.
According to Yin (2003), there are three main conditions required: i) how to define the
case, ii) how to determine the relevant data to be collected and iii) what should be done
with the collected data. Yin (2003) categorizes these three conditions to five major
research strategies in social science (see Table 5-1).
Table 5-1 Relevant situations for research strategies
Research
Strategy
Form of research
question
Does it require control over
behavioral events?
Does it focus on
contemporary events?
Experiment How, why Yes Yes
Survey Who, what, where,
how many, how much
No Yes
Archival analysis Who, what, where,
how many, how much
No Yes/No
History How, why No No
Case study How, why No Yes

Chapter 5 Development and testing of the survey instrument
61
This current study uses case study and survey. The review of these two strategies
is presented in the following.
5.2.1 Case study research strategy
Case study is commonly used when a „how‟ or „why‟ question is being asked
about a contemporary set of events over which the investigator has little control. This
type of research strategy is found to be the most powerful research method in the
exploration phase and theory building, testing and extension (Voss et al., 2002).
In conducting case study for postgraduates‟ studies, it is suggested that the
number of cases for PhD theses should fall between two to four as the minimum and ten
to fifteen as the maximum (Perry, 1988). Multiple-case study is considered as a
comparative study using the same methodological framework as a single case study.
According to Yin (2003), multiple-case studies follow the „replication‟ approach (see
Figure 5-1).
Figure 5-1 Replication approach to case study method (Yin, 2003)
In this current study, several case studies in Indonesia have been conducted. In the
following chapters, a comprehensive case study with consideration of different
characteristics of respondent is discussed. It takes into account Singaporean, Indonesian
and Japanese perspectives.
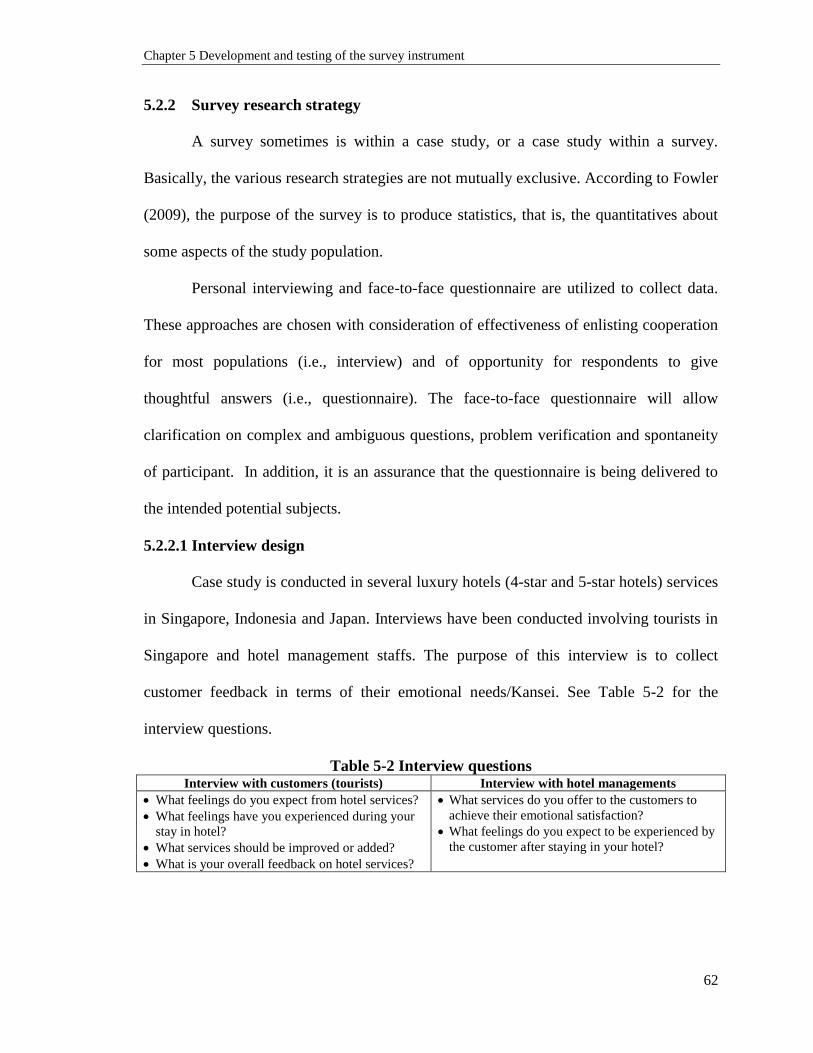
Chapter 5 Development and testing of the survey instrument
62
5.2.2 Survey research strategy
A survey sometimes is within a case study, or a case study within a survey.
Basically, the various research strategies are not mutually exclusive. According to Fowler
(2009), the purpose of the survey is to produce statistics, that is, the quantitatives about
some aspects of the study population.
Personal interviewing and face-to-face questionnaire are utilized to collect data.
These approaches are chosen with consideration of effectiveness of enlisting cooperation
for most populations (i.e., interview) and of opportunity for respondents to give
thoughtful answers (i.e., questionnaire). The face-to-face questionnaire will allow
clarification on complex and ambiguous questions, problem verification and spontaneity
of participant. In addition, it is an assurance that the questionnaire is being delivered to
the intended potential subjects.
5.2.2.1 Interview design
Case study is conducted in several luxury hotels (4-star and 5-star hotels) services
in Singapore, Indonesia and Japan. Interviews have been conducted involving tourists in
Singapore and hotel management staffs. The purpose of this interview is to collect
customer feedback in terms of their emotional needs/Kansei. See Table 5-2 for the
interview questions.
Table 5-2 Interview questions Interview with customers (tourists) Interview with hotel managements
What feelings do you expect from hotel services?
What feelings have you experienced during your
stay in hotel?
What services should be improved or added?
What is your overall feedback on hotel services?
What services do you offer to the customers to
achieve their emotional satisfaction?
What feelings do you expect to be experienced by
the customer after staying in your hotel?

Chapter 5 Development and testing of the survey instrument
63
5.2.2.2 Questionnaire design
Based on the interview findings, literature study on Kansei research papers (see
Yun et al., 2004) and hotel services, three separate questionnaires are designed.
The first questionnaire is called “service quality and emotional needs evaluation
survey”. It is composed of five sections. The first section consists of customer
demographic attributes such as gender, monthly income, age group and education level.
The second section comprises three sub-sections: survey on hotel service quality,
importance of Kansei and response of Kansei. The first sub-section of survey on hotel
service quality consists of a set of attitudinal statements designed to measure level of
importance, customer expectation and perception of service quality. There are 39 service
items categorized into five dimensions (tangible, reliability, responsiveness, empathy and
assurance). These service items are structured by referring to the SERVQUAL‟s five
dimensions of 22-item scale by Parasuraman et al. (1988) and 26-item scale of hotel
service quality by Ladhari (2009). These service items had been empirically tested by
scientific research techniques and showed acceptable and tolerable validity. Each service
item statement is measured by a 5-point Likert-type scale (1 = not at all important, 5 =
absolutely important for level of importance; 1 = not at all essential, 5 = absolutely
essential for level of expectation; and 1 = strongly disagree, 5 = strongly agree for level
of perception). The second sub-section measures the importance of customer emotional
needs/Kansei. There are 16 Kansei words used. These Kansei words were collected from
interviews with seven tourists who stayed in luxury hotels and two management staffs,
literature reviews and finalized by using affinity diagram, involving five participants. All
these volunteers had been past occupants of luxury hotels. Each Kansei word statement is

Chapter 5 Development and testing of the survey instrument
64
measured by a 5-point Likert-type scale (1 = not at all important, 5 = absolutely
important). The third sub-section is designed to rate the response on Kansei words.
Unlike the first two sub-sections, here each Kansei word is measured by a 5-point
semantic differential scale by Osgood et al. (1957) (1 = absolutely to negative Kansei, 5
= absolutely to positive Kansei). The third section of the first questionnaire is designed to
measure customer overall satisfaction. The fourth section of the first questionnaire
measures customer behavioral intention and consists of 3-item scale rated by a 5-point
Likert-type scale (1 = strongly disagree, 5 = strongly agree). While the last section of the
first questionnaire is open-ended questions asking customer feedbacks on hotel services.
The second questionnaire is called “The Kano survey”. It is composed of two
sections. The first section is about customer demographic attributes. The second section
evaluates the Kano categorization of each service attribute. For each service attribute, a
pair of questions is formulated to which the respondent can answer in one of 5-different
way (1 = I enjoy it that way, 2 = I expect it that way, 3 = I am neutral, 4 = I dislike it but
I can live with it that way, 5 = I dislike it and I cannot accept it).
The third questionnaire is called “past and present customer choices survey”. It
consists of two sections. The first section is about customer demography; while the
second section measures the importance of service attributes based on the past and
present customer choices. For each service attribute, a pair of questions (past and present
choices) is formulated to which the customer can answer in one of three different ways (1
= low, 3 = medium, 5 = high). The past choice refers to the condition when the customer
stayed in luxury hotels two years ago, whereas the present choice refers to the current
experience of stay in luxury hotel. The three questionnaires are available in Appendix F.

Chapter 5 Development and testing of the survey instrument
65
5.3 Result of interview
The interview was conducted involving seven tourists and two hotel management
staff. All tourists stayed in luxury hotels in Singapore. For common studies, according to
Steinar (2007), the number of interviews is usually around 15±10. This process follows
“free association technique” that is commonly used in qualitative research for conducting
psychoanalysis. Here, participants are expected to speak what they think without any
restrictions. They are asked to relate whatever comes into their thought and express it
without any censor.
By adopting the concept of “contextual inquiry”, on-site interviews were carried
out. It was an interview at a place nearby the hotels where the tourists stayed since this
allows for a valuable customer-touch opportunity. The tourists were from Indonesia (four
people), Japan (one person) and the Philippines (two people). This session was done by
taking a venue in Orchard road as it is one of the major tourist attraction places in
Singapore. See table 5-3 for examples of customer feedback during the interviews.
Table 5-3 Interpretation of customer statements Customer statements Kansei words interpreted
“…it has nice staffs, foods, and excellent service. I felt comfortable and
cherish staying here. But it‟s very surprised that the room is very small for
a deluxe type…”
Nice, excellent,
comfortable, cherish,
surprised and spacious
“…during my business trip in Singapore, I always choose a nice and cozy
hotel with very convenient place so that I can get to my business destination
without wasting my precious time. Nice restaurant and standard room.
Unfortunately the room service was terrible and slow…”
Nice, cozy, convenient and
fast
“…very convenient for shopping and feasting. The atmosphere is full of
coziness and warm. Overall, this hotel is good, and I will definitely come
again…”
Convenient, warm and good
“… I feel safe, secure, and welcome. It‟s very good location and the room
is clean. The service is excellent. But, it‟s a bit noisy; I can hear the people
next to my room talking…”
Safe, secure, welcome,
good, clean, excellent and
quiet
“… Comfortable, warm, and efficient. I was expecting a lot from this hotel,
and surprisingly I was not so disappointed. The receptionist was warm and
efficient. The suggestion is more on the selection & quality of breakfast
buffet. It has a poor service…”
Comfortable, warm and
efficient
“… Incredibly this is an amazing hotel, and a very comfortable place to
stay overnight. The shopping malls at the first and second floors make a
perfect match ... “
Comfortable, incredible,
amazing and spacious

Chapter 5 Development and testing of the survey instrument
66
“… The hotel is just a walking distance to the shopping centres. Yet, it has
a sophisticated lobby. However, the staffs less friendly …”
Friendly, sophisticated and
warm
In addition, the statements from hotel management staffs are (1) “…we are
encouraged to provide services to achieve unforgettable hospitality experience. It is a
blend of Asian hospitality and contemporary Western elegance. We hope our guests
experience warmth and care…”, (2) “…this hotel is famous in its secure, exciting,
premier and strategic location, and resort-like feel filled with tropical greenery and
spacious outdoor space. We expect the customers feel warm, satisfied, pleasant and relax
staying in our hotel.” In general, the Kansei words interpreted are friendly, elegant,
warm, caring, secure, spacious, satisfied, pleasant and relax.
By combining the results from those interviews, several positive Kansei words
were collected, i.e., nice, excellent, comfortable, cherish, surprised, spacious, cozy, fast,
warm, good, safe, secure, welcome, clean, quiet, efficient, friendly, elegant, caring,
satisfied, relaxed, attractive, supportive, incredible, amazing, happy, confident, excited,
peaceful, soft, contented, classy, modern, pleased, stylish, natural, private, cool, pleasant
and beautiful. According to Schütte et al. (2004), this process was also integrated with
the findings from other relevant information (e.g., journals, magazines and web pages of
luxury hotels). As a result, forty Kansei words that describe the emotional engagement
between the customers and the hotel services were chosen.
In order to obtain more structured Kansei words, these chosen Kansei words were
reduced to sixteen by using affinity diagrams. The result was a set of Kansei words
attached to the first questionnaire form. In order to reduce the bias/misinterpretation
caused potentially by language barrier, graphical emoticons representing each Kansei
word are attached to the survey form. This current study utilized emoticons adopted from

Chapter 5 Development and testing of the survey instrument
67
Yahoo! Messenger® as used in study by Huang et al. (2008), msn® messenger (Windows
Live™
Messenger) and also findings from internet browsings. These emoticons only
cover eleven out of sixteen Kansei words due to the appropriateness of expression (see
Figure 5-2).
5.4 Pilot test of the survey instrument
The main purpose of the pilot testing is to investigate any potential problems
before they become costly mistake. Since these instruments (questionnaires) are used by
different subjects with different cultural backgrounds, this pilot testing provides a
preview of how difficult all items will be understood and gives information on how long
data collection can be expected. Thus, the questions may be modified.
Figure 5-2 Emoticons used and attached in survey paper

Chapter 5 Development and testing of the survey instrument
68
5.4.1 Translation of questionnaires
All three types of questionnaire are available in English. The first questionnaire
was translated into Bahasa Indonesia and Japanese. Questionnaires in Bahasa Indonesia
and Japanese versions are provided in Appendix F. Expert opinion and translation using
dictionaries (i.e., online electronic dictionary via GoogleTM translate and manual
dictionary) were used to validate the trilingual version of these questionnaires. This
activity involved one academic staff of a private university in Indonesia (for Bahasa
Indonesia-based questionnaire) and one KE professor of a private university in Japan (for
Japanese-based questionnaire). Both of the academic staffs have been working in their
institution for more than fifteen years and familiar with KE research. In terms of Kansei
words used, these original words were translated and adjusted to the local cultures
without reducing the true meaning of them. In other words, the translation was done
based on the availability of local vocabularies.
The second and third survey questionnaires were translated into Bahasa
Indonesia. It was done by considering an opinion from an expert who is a professor at a
private university in Indonesia. He is an expert in research methodology and quality
management research area. Some minor changes have been done to make the
questionnaires more understandable.
5.4.2 Testing of questionnaires
All three questionnaires were pre-tested on five PhD research scholars of a
university in Singapore. They were third- and fourth-year students in the Department of
Industrial and Systems Engineering. Their reviews led to minor changes in the wording
of the questions due to grammatical problems.

Chapter 5 Development and testing of the survey instrument
69
5.4.3 Testing of translated questionnaires
To check whether there is any difference of interpretation of questionnaire in
Bahasa Indonesia and English, these three questionnaires were distributed and tested.
Five Indonesian tourists were subjected to each questionnaire type. Each tourist was
asked to fill up one out of three different types of questionnaire provided (both in Bahasa
Indonesia and English). The interviewer had to ensure that the targeted respondents have
sufficient basic knowledge of English. Then, the interviewer distributed the
questionnaires according to the defined assignment list (see Table 5-4).
Table 5-4 Matrix for chosen subject for pilot study Questionnaire Type
I II III
SUBJECT
NUMBER
1 2 3
4 5 6
7 8 9
10 11 12
13 14 15
In order to see which questionnaire version (in Bahasa Indonesia or English) was
given first, an interviewer flipped a coin. This was for randomization purpose. A simple
assignment of coin was set (see Table 5-5).
Table 5-5 Assignment of coin sides to questionnaire version HEAD TAIL
Questionnaire in Bahasa Indonesia Questionnaire in English
In this study, double translation approach was not adopted due to the limitation of
experts. Double translation approach needs at least 3 experts (i.e., two independent
translations from the source language(s), and reconciliation by a third person) (Grisay et
al., 2003).

Chapter 5 Development and testing of the survey instrument
70
This study utilizes a modified translation approach with qualitative and
quantitative verification. A pilot test is used for verification purpose. The objective is to
check and recheck the final target version (i.e., questionnaire in Bahasa Indonesia) for
accuracy, linguistic quality and equivalence against the international source version (i.e.,
questionnaire in English). According to Grisay et al. (2003), quantitative verification is
needed. The verification statistics by item and by unit yield information on translation
and adaptation difficulties encountered for specific items in specific languages or groups
of languages. Thus, a pilot test involving respondents to answer the same questionnaire in
two difference languages (i.e., English and Bahasa Indonesia) was conducted.
After filling up the questionnaires, the respondents were asked to confirm and
recheck their final responses. The Wilcoxon signed rank-sum test was used to test
whether there is a difference of interpretation between English and Bahasa Indonesia
versions. This test is also called Wilcoxon matched-pairs signed-ranks test for two related
samples (Cramer, 1994). It is a non-parametric or distribution free test to test the null
hypothesis that the median of a distribution is equal to some value.
In this pilot test, at null hypothesis, the median difference (M) is set to zero (i.e.,
they are samples from populations with the same medians and the same continuous
distributions). The null and alternate hypotheses are defined as follows:
H0: θ = 0 (There is no difference of interpretation between English and Bahasa Indonesia
versions)
H1: θ ≠ 0 (There is a difference of interpretation between English and Bahasa Indonesia
versions)
Statistically, there was no significant difference of interpretation between English and
Bahasa Indonesia versions (see Table 5-6).

Chapter 5 Development and testing of the survey instrument
71
Table 5-6 Summary of statistical test for pilot test Type I Service quality and emotional needs evaluation
Sub-part Level of importance
Expected service
Perceived service
Importance of Kansei
Kansei response
Overall satisfaction
Behavioral intention
Result Do not reject H0 for all variables
Type II Kano survey
Sub-part Kano survey
Result Do not reject H0 for all variables
Type III Past and present customer choices
Sub-part Past Choice Present Choice
Result Do not reject H0 for all variables Do not reject H0 for all variables
The questionnaire in Japanese version has not been pretested involving any
potential subjects/tourists since its translation was done by a professor who is an expert in
Kansei Engineering (KE). He has been doing research on KE since 1990s. Japanese
Professor who is the KE expert is also language-expert since he has many journal
publications in many top tier international journals, such as Ergonomics, International
Journal of Industrial Ergonomics, International Journal of Human Factors and
Ergonomics, Acta Psychologica, Neural Networks and many more. Thus, the Japanese
translation of the questionnaire was deemed valid.
5.5 Surveyed population
The target included all potential tourists from Indonesia, Singapore and Japanese
who stayed in luxury hotel (4-star and 5-star hotels). Survey was conducted in some
tourism places, shopping centers, departure and arrival halls of international airports and
some places at the targeted hotel areas (contextual inquiry).
This study applied convenience sampling. It is a non-probability sampling
technique where subjects are selected because of their convenient accessibility and
proximity to the researcher. This method was considered since it is fast, inexpensive, easy
and the respondents are readily available. As for randomization purpose, there were three
different data collection times applied, i.e., 7 – 9 am, 1 – 3 pm and 7 - 9 pm. Any

Chapter 5 Development and testing of the survey instrument
72
potential respondents were approached and asked whether they would like to participate.
The interviewer briefly introduced the self identity, purpose and procedure of the survey.
The Indonesian tourists were offered an option of which mode of questionnaire they were
comfortable with, either in Bahasa Indonesia or English. As for Singaporean tourists,
only questionnaires in English were provided. Questionnaires in English and Japanese
versions were offered to Japanese tourists.
This study targeted only one copy of the questionnaire for one group of
participants. One group can be one single respondent, one family or one couple. This
approach will give more reasonable and accurate responses to the questions since the
tourists usually stay at the same hotel/room and share the same experiences during the
service encounters. It took approximately 20 minutes to complete one questionnaire. A
token of appreciation was given to each group of participant.
All together, forty and twenty five relevant responses were collected in a one-year
period (January 2010 – December 2010). The distribution of subjects per each
questionnaire and the profile of respondents are provided in Tables 5-7 and 5-8.
Table 5-7 Number of participants
Questionnaire type
Number of subjects participated
Indonesian Singaporean Japanese
Male Female Male Female Male Female
First questionnaire 41 40 36 39 36 38
Second questionnaire 29 32 31 29 N/A
Third questionnaire 21 18 18 17 N/A
Total 181 170 74
Table 5-8 Profile of respondents
Variable Indonesian Singaporean Japanese
Freq. % of total Freq. % of total Freq. % of total
Hotel category
4-star hotel 72 39.8 54 31.8 29 39.2
5-star hotel 109 60.2 116 68.2 45 60.8
Gender
Male 91 50.3 85 50 36 48.6
Female 90 49.7 85 50 38 51.4
Age (years)
<=20 10 5.5 7 4.1 - -

Chapter 5 Development and testing of the survey instrument
73
21-30 55 30.4 42 24.7 - -
31-40 45 24.9 49 28.8 19 25.7
41-50 55 30.4 51 30 22 29.7
>50 16 8.8 21 12.4 33 44.6
Frequency of travel
Once a year or less 41 22.7 41 24.1 14 18.9
Every 6 month 53 29.3 52 30.6 26 35.1
Every 3 month 42 23.2 39 22.9 18 24.3
Every month 28 15.5 22 12.9 16 21.6
>=once a month 17 9.4 16 9.4 - -
Purpose
Vacation 85 47 56 32.9 16 21.6
Business trip 49 27.1 52 30.6 29 39.2
Conference 28 15.5 38 22.4 14 18.9
Social visit 19 10.5 24 14.1 14 20.3
Amount of time spent (days)
<=3 78 43.1 56 32.9 39 52.7
4-7 64 35.4 67 39.4 20 27
8-11 39 21.5 43 25.3 15 20.3
>11 - - 4 2.4 - -
Monthly income
<=US$2000 66 36.5 38 22.4 - -
US$2001-3000 59 32.6 54 31.8 18 24.3
US$3001-4000 32 17.7 52 30.6 20 27
>US$4000 24 13.3 26 15.3 36 48.6
Frequency of stay
Less than once a year 36 19.9 25 14.7 - -
Once a year 43 23.8 43 25.3 20 27
Twice a year 36 19.9 46 27.1 12 16.2
Three times a year 41 22.7 34 20 10 13.5
Four times a year 19 10.5 12 7.1 20 27
Five times or more a year 6 3.3 10 5.9 12 16.2
Highest education
Junior high or equivalent 12 6.6 1 0.6 - -
High school or equivalent 76 42 38 22.4 21 28.4
College or university degree 71 39.2 85 50 23 31.1
Post graduate 22 12.2 46 27.1 30 40.5
Occupation
Clerical/office 6 3.3 12 7.1 - -
Engineering 23 12.7 22 12.9 - -
Entrepreneur/self-employed 48 26.5 35 20.6 13 17.6
Management 19 10.5 26 15.3 9 12.2
Education 26 14.4 25 14.7 20 27
Finance 25 13.8 34 20 12 16.2
Marketing 27 14.9 16 9.4 10 13.5
Student 6 3.3 - - - -
The participants were composed of 181 Indonesians (91 males and 90 females),
170 Singaporeans (85 males and 85 females) and 74 Japanese tourists (36 males and 38
females). The survey captured a balanced percentage of male and female respondents for
each population group. The gender split was 50.3% male and 49.7% female in
Indonesian, 50% male and 50% female in Singaporean and 48.6% male and 51.4%

Chapter 5 Development and testing of the survey instrument
74
female in Japanese. Tourists of age between 21 to 30 and 41 to 50 were the first two
largest groups (in Indonesia and Singapore), while the Japanese group had the biggest
portion at the age above 50. In majority, their monthly incomes ranged from less than
US$2000 (36.5% in Indonesian) to over US$4000 (48.6% in Japanese). In terms of the
purpose of stay, most of the Indonesian and Singaporean tourists indicated that they were
on vacation (47% and 32.9%, respectively), while the Japanese were on business trip
(39.2%). Regarding the frequency of travel, majority traveled in every six month. The
longest amount of time spent was four to seven days (39.4% in Singaporean), while most
Indonesian and Japanese tourists spent less than three days (43.1% and 52.7%,
respectively). In terms of education level, both Singaporean and Indonesian were mostly
bachelor degree holders (39.2% and 50%, respectively), while the Japanese were post
graduates (40.5%). Most Indonesian and Singaporean subjects were entrepreneurs/self-
employed (26.5% and 20.6%, consecutively), whereas the Japanese were working in the
education sector (27%).
5.6 Conclusion
The findings of the preliminary study and literature review are utilized as a
foundation for designing the survey instruments. This chapter discusses the data
collection strategy and survey instrument construction. The core of this study, how to
collect and structure Kansei words, is discussed as well. In addition, the profile of
respondents is discussed.
Next chapters discuss some works related to the data analysis and the integrative
KE application framework including constructs reliability and validity assessments.

Chapter 6 Preliminary study of Kansei Engineering general framework in services
75
6 Preliminary study of Kansei Engineering general framework in
services
6.1 Introduction
This chapter presents a general framework of Kansei Engineering (KE) applied to
services. It shows the preliminary result of constructs interdependence during service
encounters. The data collected from the first questionnaire is utilized to build a
correlation analysis among the KE constructs. The findings and their implications are
discussed.
6.2 Problem description
Kansei Engineering (KE) has been widely and broadly known as a powerful
method of ergonomics which takes into account user emotions. Still, it is of great interest
to investigate the role of KE to service quality. Service quality has created good positive
differences and potentials in the long run. Without any doubt, it has affected successful
business competition. Although the focus of many studies of service quality has been
mainly on cognition (Liljander and Strandvik, 1997; Yu and Dean, 2001; Wong, 2004;
Ladhari, 2009), this study was proposed to bring a role of KE into the service sectors.
6.3 Framework development and empirical study
At the initial phase, this framework starts with defining a service area/domain
which is of interest and highly expected by customers (see Figure 6-1). The hospitality
and hotel business was chosen for this study. Hotel types may influence customer
decision, leading to different dimensions of service quality.
This study discusses the impact of 4- and 5-star hotels services (called luxury
hotels) on Indonesian and Singaporean tourists‟ general overall experiences. Luxury hotel

Chapter 6 Preliminary study of Kansei Engineering general framework in services
76
was chosen since it has relatively complete services which affect all human senses.
According to Barsky and Nash (2002), luxury hotel was reported to have greater strength
of emotions than any other hotel segment. In KE studies, all human senses are important
to be experienced (Nagamachi, 2002). For instance, when entering a hotel lobby and
doing a check-in process, peoples‟ hearing and vision are the relevant sensory systems.
Moreover, taste and smell will evaluate the quality of meals.
This study utilized a modified SERVQUAL model with 39-service attributes
which deployed into five dimensions. For example, “the receptionist and information
desk is visually appealing”, “the bill is charged accurately” … “the employees have
knowledge in answering your enquiries”. A five-point Likert scale that ranged from “1 =
strongly disagree” to “5 = strongly agree” was used to rate the customer expectation and
perception on each hotel attribute.
The cognition as a comparison of perceived quality and service expectations was
taken into consideration and deemed to be a driver of emotion/affect/Kansei (Russell,
1980). Referring to the concept of Gestalt psychology, Lin (2004) argues that when
customers evaluate a servicescape, their individual perception serves as a cognitive
experience and stimulates their emotional responses (e.g., pleasure, arousal and
dominance). Hence, the cognition antedates the emotions when individuals are appraising
the servicescape as noted by Lazarus (1999).
It was then continued to span the semantic space, i.e., to collect and select Kansei
words. Due to complexity, this study used the evaluation of words (spoken) and their
emotional impact on the human mind. The evaluation of Kansei words is also called
affective process, which is deemed as the main focus of this study. It shows that affective

Chapter 6 Preliminary study of Kansei Engineering general framework in services
77
process sets its position as a mediate role in the relationships between perceived service
attributes, cognitive process, customer overall satisfaction and behavioral intention
during service encounter. The final collection of Kansei words include “convenience”,
“attractiveness”, “cleanliness”, “welcomeness”, et cetera (see Chapter 5.3). The
evaluation of these Kansei words referred to the ratings of emotions rated by the tourists
after experiencing certain services. The five-point SD scale which ranged from “1 =
absolutely negative Kansei” to “5 = absolutely positive Kansei” was applied.
Thereafter, it was to evaluate overall satisfaction and behavioral intention. As
reviewed, overall satisfaction is the result of cognitive and affective processes. At the
final stage, overall satisfaction is related to behavioral intention as a form of internal-
external interaction. Behavioral intention defines how the customers behave in the future
after experiencing services for a certain period of time. According to Ladhari (2009),
there were three different items used for assessing behavioral intention: i) “I will
certainly recommend hotel XYZ to my friends, relatives and acquaintances”, ii) “I would
pay a higher price than the competitors charge for the benefits that I received from hotel
XYZ” and iii) “Hotel XYZ is always my first choice”.
In this preliminary study, a correlation analysis involving 50 Indonesians and 75
Singaporeans is reported (as collected from January 2010 – June 2010). These data are a
subset of overall data collected (see Tables 5.7 and 5.8). Those who stayed in any luxury
hotel at least for two days were the target of survey. It was assumed that the tourists
should have had experienced sufficient services. As discussed earlier, this survey utilized
face-to-face questionnaire (see Chapter 5.5 for details). The descriptive of constructs and
significant results of correlation analysis are summarized in Tables 6-1 and 6-2.

Chapter 6 Preliminary study of Kansei Engineering general framework in services
78
Figure 6-1 Framework of KE in services
Table 6-1 Descriptive statistics of constructs
Constructs and examples of items Indonesian Singaporean
*M **SD Min Max M SD Min Max
Service Quality (39 items) 3.40 1.12 1 5 3.32 1.19 1 5
Cognitive Process (39 items)*** - 0.87 1.27 - 4 2 - 0.91 1.43 - 4 2
Affective Process (16 items) 2.86 1.28 1 5 2.895 1.04 1 5
Overall Satisfaction (1 item) 3.34 1.15 1 5 2.80 1.06 1 5
Behavioral Intentions (3 items) 3.27 1.07 1 5 2.97 1.07 1 5 * = grand mean, ** = standard deviation, *** =service gap, i.e., perception score – expectation score
Table 6-2 Significant coefficient and p-value of correlation among constructs in KE
services
Construct Service
quality
Cognitive
process
Affective
process
Overall
satisfaction
Behavioral
intention
Service quality 0.918; p<0.01
0.859; p<0.01
0.492; p<0.01
0.585; p<0.01 - -
Cognitive
process
0.492; p<0.01
0.618; p<0.01
0.355; p=0.012
0.451; p<0.01 -
Affective
process
0.576; p<0.01
0.456; p<0.01 -
Overall
satisfaction
0.694; p<0.01
0.497; p<0.01
Behavioral
intention
*Texts in blue and red indicate parameter values for Singaporean and Indonesian, respectively
6.4 Discussion
This chapter shows an empirical finding involving two different subject groups
(i.e., Indonesian and Singaporean). Similar to the previous findings by Hartono and Tan
(2010), there are six significant relationships among constructs according to the statistical
test results (see Table 6-2). All estimates are at acceptable levels (p-values < 0.05) on

Chapter 6 Preliminary study of Kansei Engineering general framework in services
79
both Indonesian and Singapore subjects (see Table 6-2). All hypothesized relationships
(see Figure 6-1) are supported and confirmed.
There is a significant relationship between perceived service quality and cognitive
process. A very high coefficient of correlation of 0.918 (in Indonesian) and 0.859 (in
Singaporean) explain that the perception of service quality determines cognitive
evaluation/judgment. During service encounter, what the tourists perceive linearly
determines what they decide by recalling their expectation.
Another interesting finding is that a significant correlation between cognitive
process and affective process/Kansei. Cognitive process is better to a case which is
associated with logic, science and calculation. This process needs analytical and rational
abilities. It provides a preliminary evidence to support the hypothesis that cognition
precedes affect as argued by Bagozzi et al. (2002). The finding also shows that cognitive
and affective processes have significant correlation on customer overall satisfaction. In
other words, the overall satisfaction is impacted by both customer evaluation process and
emotional impression. Based on the correlation coefficients on two population groups,
this study reports that affective process (ρSingapore = 0.576 with p < 0.01, ρIndonesia = 0.456
with p < 0.01) is more important than the cognitive process (ρSingapore = 0.451 with p <
0.01, ρIndonesia = 0.355 with p = 0.012) in influencing customer overall satisfaction. Thus,
it is advised to put more attention and stress on the importance of affective
process/Kansei as the complement of cognitive process in investigating the value of
customer overall satisfaction.

Chapter 6 Preliminary study of Kansei Engineering general framework in services
80
The finding of this study also provides a direct relationship between perceived
service quality and affective process/Kansei. This confirms that Kansei is a function of
service attributes/product elements evaluation (Nagamachi, 1995; Schutte, 2005).
Lastly, overall satisfaction which is significantly correlated with cognitive and
affective processes exhibites a strong impact with a significant coefficient of correlation
of 0.694 (in Singaporean) and 0.497 (in Indonesian) on behavioral intention. The higher
the satisfaction, the more loyal the tourists are. Singaporean is found to be more loyal
than Indonesian.
6.5 Conclusion
This study highlights the importance of affective process and its relationships
with other constructs during the service delivery processes and activities (service
encounters). By taking into account the empirical data from two different population
groups (Indonesian and Singaporean), there is one interesting common finding. It
emphasizes the importance of affective process as a complement of cognitive process in
impacting overall satisfaction.
Yu and Dean (2001) showed that affective state serves as a better predictor of
customer loyalty than cognitive state. Emotions play a central role in the customer-
employee interaction (Mattila and Enz, 2002).
Customer satisfaction might be related to cognitive and affective process.
According to Oliver (1994), affect and cognition are parallel affecting customer
satisfaction. Oliver‟s study shows that customer satisfaction is a function of the affects,
attribute satisfaction/dissatisfaction and disconfirmation (i.e., cognitive process). In other
words, it is clearly shown that satisfaction is a function of the affects and the evaluations

Chapter 6 Preliminary study of Kansei Engineering general framework in services
81
of quality and disconfirmation. In general, both affective and cognitive processes produce
significant and independent contributions to customer satisfaction. Furthermore, Oliver
(1994) argues that quality is more performance / cognitive-oriented, whereas satisfaction
is more on consumption judgment.
Emotional states such as the happiness and delight (pleasant-surprise) were
correlated with high levels of satisfaction (Westbrook and Oliver, 1991). Due to weak
attribute of bipolar satisfied/dissatisfied scale, a more affectively and emotionally
enriched satisfaction scale (e.g., delighted-terrible scale) is enforced (Westbrook and
Oliver, 1991).
Chitturi et al. (2008) found that there are two important customer impressions,
i.e., feelings of satisfaction and feelings of delight. Satisfaction relates to confidence and
security provided by utilitarian attributes, while delight influenced by cheerfulness and
excitement. Their research confirms and highlights that delighted customer influences
customer loyalty which is measured by word of mouth and repurchase intentions. Yu and
Dean (2001) showed that positive emotions serve as the best predictor of overall loyalty.
Surely, for managerial implication, this research shows that if product/service designers
and marketers want to delight customers, they should provide higher levels of hedonic
attributes that lead to excitement and cheerfulness. Thus, product development process
should be made by incorporating more benefits-experience-emotion centric than purely
attribute centric (Chitturi et al., 2008). Managers should provide sufficient opportunity
for comments with an affective base (Yu and Dean, 2001).

Chapter 6 Preliminary study of Kansei Engineering general framework in services
82
In general, the dimensionality of consumption emotion/affective state and its
correlation with satisfaction and customer delight should be studied and verified across
multiple service/consumption contexts (Westbrook and Oliver, 1991).
Actually this finding is in accordance with what KE concerns. The role of
affective process/Kansei in hospitality sectors should be of interesting attention to service
providers/managers. This research finding is regarded as an essential foundation for
further analyses in the next chapters by incorporating more samples.

Chapter 7 Testing the hypotheses of KE application to services using PLS method
83
7 Testing the hypotheses of KE application to services using PLS
method
7.1 Introduction
This chapter discusses the extension of study as discussed in Chapter 6. An integrative
framework of KE applied to services is proposed (see Figure 7-1). Data collected through
the first questionnaire involving Indonesian, Singaporean and Japanese tourists are
discussed. There are three main steps discussed as follows. First, reliability and validity
tests on the survey items are conducted. Second, the structural equation modeling results
to verify the proposed hypotheses are discussed. Third, is the analysis of Kansei.
* Details of identifying and classifying service attributes using the Kano model are discussed in Chapter 8
Figure 7-1 Integrative framework of KE in service encounter
7.2 Analytical approach: the use of SEM technique
This study applies a structural equation modeling (SEM) as the analytical
approach. SEM is a multivariate method to examine the relationships among the
exogenous and endogenous latent variables simultaneously within a model. SEM is
considered since all the variables of the study model are latent rather than observed
variables. Thus, there is a need for a methodology that recognizes the latent variables in

Chapter 7 Testing the hypotheses of KE application to services using PLS method
84
their theoretical networks and gains meaning from their definition, the specific theoretical
context in which they are embedded and their manifest variables (Chin, 1998). In
addition, the methodology of SEM is expected to be able to handle errors in measurement
and to recognize errors in theory such as surplus meaning in latent variables and
unexplained variance.
7.2.1 Superiority of SEM technique
According to Aibinu and Al-Lawati (2010) and Barclay et al. (1995), SEM allows
a simultaneous assessment of the reliability and the validity of the measurement items of
each latent variable of the model. Then, it can estimate the relationships among the latent
and the dependent variables.
In this study, SEM is considered more suitable against other similar techniques
such as factor analysis (FA), multiple regression (MR) and path analysis (PA). There are
some considerations as follows. MR deals with the relationship between many
independent variables and single dependent variable. MR and PA deal with observed
variable rather than latent variable and assume that the data used are normally distributed.
In addition, MR does not provide any validity and reliability tests for measuring latent
variables. Referring to FA, though this technique can detect underlying latent variables
from manifest variables and can provide loadings between the detected latent variables
and their corresponding observed variables, FA would provide no information about the
relationship among the detected latent variables (in the form of structural model) (Aibinu
and Al-Lawati, 2010).

Chapter 7 Testing the hypotheses of KE application to services using PLS method
85
7.2.2 Use of partial least square (PLS) estimation approach
There are two approaches available for SEM analysis: i) covariance-based
structure analysis, as implemented by the LISREL® and IBM
® SPSS
® AMOS software
programs and ii) component-based structure using partial least square estimation, as
implemented by PLS-Graph 2.0/SmartPLS software programs (known as PLS-SEM).
The covariance-based SEM analysis assumes multivariate normality. On the other
hand, the component-based PLS-SEM does not assume any distributional form of
measured variables (Chin, 1998). This requirement of PLS-SEM fits to the data used in
this current study since the current data consist of perceptive rating which are of
unknown distribution. In other words, PLS-SEM is distribution-free, thus, it is suitable
enough for data from non-normal or unknown distributions (Falk and Miller, 1992).
PLS has a virtue of good estimation of weights under small sample size (i.e., the
number of samples is smaller than the number of explanatory variables). In addition, PLS
has a feature of resampling method (known as bootstrapping). Bootstrapping is a method
of validating models by utilizing random subsets of data. It is a robust alternative to
statistical inference based on parametric assumptions (e.g., normally distributed) when
they are in doubt (Chin, 1998; Mooney and Duval, 1993). Hence, PLS is good for small
sample size situation. By incorporating a resampling method, PLS can perform stable
result. In fact, Aibinu and Al-Lawati (2010) present a model with 17 indicators and 64
samples which is suitable enough for PLS-SEM.
7.3 Description of latent variable and its measurement items
PLS-SEM assumes that the explanation of all observed measure variances is
useful. This technique uses a combination of principal component analysis, path analysis

Chapter 7 Testing the hypotheses of KE application to services using PLS method
86
and regression to simultaneously evaluate the theory and data (Pedhazur, 1982). At the
first stage of PLS estimation, an iterative scheme of simple or multiple regressions
contingent on the particular model is performed until a solution converges on a set of
weights. It is then used for estimating the latent variables scores. For instance, the
component scores for latent variable „Service Quality‟ (see Table 7-1) is formed based on
the weighted sum of the five measurement items (Tangible, Reliability, Responsiveness,
Assurance and Empathy). The component score for „Tangible‟ is based on the weighted
sum of the 14 measurement items (SQA1 … SQA14). This approach allows latent
constructs to be modeled as either formative or reflective indicators.
Reflective constructs are used in this study. It is when a construct is deemed to
exist before it is measured. These construct indicators are viewed as affected by the same
underlying concept (Chin, 1998). While formative measures are those that form or cause
the creation or change in a construct. The structure of independent latent variables
attached with their corresponding measurement items is provided (see Table 7-1).
Table 7-1 Description of latent variables Latent variables (LV) Item code Description of measurement items (indicators)* Response
Service Quality
Tangible (Tan_SQ) SQA1 The receptionist and information desk is visually appealing
1-5; where 1 =
very low to 5 =
very high
SQA2 The employees‟ uniforms are clean, nice, and neat
… …
SQA13 The scent in hotel‟s room and lobby is refreshing
SQA14 The meals served at the hotel are delicious
Reliability (Rel_SQ) SQB1 Your hotel reservation is handled efficiently and effectively
SQB2 Your booked guestroom is ready as promised
… …
SQB7 AC, TV, radio, lights, mini bar, & other equipment work
properly
SQB8 Overall, you got what you paid for
Responsiveness
(Resp_SQ)
SQC1 The employees tell you exactly when services will be performed
SQC2 The employees give you prompt service
… …
SQC4 The employees are never too busy to respond to your requests
SQC5 Informative literature about the hotel facilities is provided
Assurance (Assu_SQ) SQD1 The employees have knowledge in answering your enquiries
SQD2 The behavior of employees instills confidence in you
… …
SQD5 The employees are consistently courteous with you

Chapter 7 Testing the hypotheses of KE application to services using PLS method
87
SQD6 The staff explains clearly charges on your account
Empathy (Emp_SQ) SQE1 The employees are helpful, friendly, and respectful
SQE2 The hotel gives you individual full attention
… …
SQE5 The hotel has your best interests at heart
SQE6 The hotel has operating hours convenient to you
Cognitive Process**
Tangible (Tan_CG) CGA1 The receptionist and information desk is visually appealing
(-4) to (+4);
where
-4 = very low to
+4 = very high
CGA2 The employees‟ uniforms are clean, nice, and neat
… …
CGA13 The scent in hotel‟s room and lobby is refreshing
CGA14 The meals served at the hotel are delicious
Reliability (Rel_CG) CGB1 Your hotel reservation is handled efficiently and effectively
CGB2 Your booked guestroom is ready as promised
… …
CGB7 AC, TV, radio, lights, mini bar, & other equipment work
properly
CGB8 Overall, you got what you paid for
Responsiveness
(Resp_CG)
CGC1 The employees tell you exactly when services will be performed
CGC2 The employees give you prompt service
… …
CGC4 The employees are never too busy to respond to your requests
CGC5 Informative literature about the hotel facilities is provided
Assurance (Assu_CG) CGD1 The employees have knowledge in answering your enquiries
CGD2 The behavior of employees instills confidence in you
… …
CGD5 The employees are consistently courteous with you
CGD6 The staff explains clearly charges on your account
Empathy (Emp_CG) CGE1 The employees are helpful, friendly, and respectful
CGE2 The hotel gives you individual full attention
… …
CGE5 The hotel has your best interests at heart
CGE6 The hotel has operating hours convenient to you
Affective Process K1 Convenient 1-5; where 1 =
negative Kansei
to 5 = positive
Kansei
K2 Attractive
… …
K15 Relieved
K16 Quiet
Overall satisfaction OS Your overall satisfaction of hotel services
1-5; where 1 =
strongly
dissatisfied to 5
= strongly
satisfied
Behavioral intention BI1 I will certainly recommend hotel XYZ to my friends, relatives,
and acquaintances 1-5; where 1 =
strongly
disagree to 5 =
strongly agree
BI2 I would pay a higher price than the competitors charge for the
benefits that I received from hotel XYZ
BI3 Hotel XYZ is always my first choice *the full version of measurement items is available in Appendix F; **cognitive process is derived from the service gap (i.e., perception score-expectation score)
7.3.1 Descriptive statistics
The mean and standard deviation of each measure are reported (see Table 7-2).
This section reports the empirical data collected from Indonesian, Singaporean and

Chapter 7 Testing the hypotheses of KE application to services using PLS method
88
Japanese (see Chapter 5.5). In terms of mean-values, both Indonesian and Singaporean
have more stable rates than their Japanese counterpart.
At the service quality construct, the highest rates are SQA5 “the outdoor
environment is visually clean” (3.605) and SQA8 “the hotel‟s lobby is comfortable”
(3.507) at Indonesian and Singaporean groups, respectively. Interestingly, Japanese group
has scores above 4 for two measurement items, i.e., SQB3 “the bill is charged accurately”
(4.176) and SQB8 “overall, you got what you paid for” (4.351). Both items are
categorized under “reliability” dimension.
At the cognitive process (service gap) construct, Indonesian and Singaporean
groups share the same measurement as the smallest negative gap, i.e., CGA8 “overall, you
got what you paid for”. The Japanese group shows positive service gap scores at two
items under “reliability” dimension, i.e., CGB3 “the bill is charged accurately” and CGB8
“overall, you got what you paid for”. It shows that Japanese tourists are concerned and
satisfied with the precised hotel charges.
In terms of affective process, among the three population groups, the result shows
that they have the highest score on the same Kansei, i.e., “quiet”. It is clear and
understandable since most respondents are entrepreneur/self-employed. They stay in
hotels for business trip so that they expect a calm and quiet atmosphere.
At the overall satisfaction construct, it shows that both Indonesian and Japanese
groups are more satisfied than Singaporean groups. Overall, their overall satisfaction
scores are above the average (> 2.5). Related to the behavioral intention construct, among
the three population groups, Japanese has the highest score for all 3 measures; whereas

Chapter 7 Testing the hypotheses of KE application to services using PLS method
89
Singaporean has the lowest score for these measures. Overall, their behavioral intention
scores are above the average (> 2.5).
Table 7-2 Descriptive statistics of measurement items Items
code
Indonesian Singaporean Japanese Items
code
Indonesian Singaporean Japanese
M* SD** M SD M SD M SD M SD M SD
SQA1 3.457 1.119 3.400 1.139 3.311 1.249 CGA11 -0.85 1.324 -1.05 1.365 -0.45 1.305
SQA2 3.395 1.057 3.373 1.250 3.608 1.018 CGA12 -0.95 1.350 -0.97 1.533 -0.53 1.357
SQA3 3.222 1.118 3.227 1.060 3.419 1.194 CGA13 -0.90 1.384 -1.03 1.551 -0.27 1.529
SQA4 3.395 1.126 3.133 1.234 3.581 1.147 CGA14 -1.01 1.419 -1.04 1.380 -0.53 1.367
SQA5 3.605 1.092 3.227 1.192 3.392 1.280 CGB1 -0.68 1.283 -0.80 1.461 -0.32 1.304
SQA6 3.407 1.160 3.347 1.214 3.419 1.147 CGB2 -0.88 1.298 -1.08 1.617 -0.27 1.102
SQA7 3.395 1.148 3.240 1.125 2.662 0.832 CGB3 -0.78 1.440 -1.11 1.476 0.31 1.227
SQA8 3.432 1.193 3.507 1.107 3.324 1.195 CGB4 -0.89 1.313 -1.01 1.520 -0.45 1.294
SQA9 3.370 1.145 3.427 1.243 3.946 0.874 CGB5 -0.98 1.294 -0.93 1.319 -0.11 1.513
SQA10 3.444 1.061 3.253 1.187 3.392 1.096 CGB6 -0.80 1.346 -0.75 1.425 -0.20 1.508
SQA11 3.395 1.069 3.240 0.970 2.581 0.936 CGB7 -0.89 1.255 -0.95 1.365 -0.46 1.196
SQA12 3.407 1.116 3.307 1.262 3.392 1.191 CGB8 -0.96 1.444 -0.81 1.402 0.46 1.196
SQA13 3.407 1.149 3.307 1.252 3.486 1.230 CGC1 -0.96 1.249 -0.63 1.353 -0.24 1.403
SQA14 3.309 1.056 3.267 1.155 3.378 1.119 CGC2 -0.94 1.248 -0.93 1.379 -0.11 1.549
SQB1 3.420 1.023 3.413 1.152 3.568 1.171 CGC3 -0.77 1.425 -0.77 1.512 -0.45 1.545
SQB2 3.432 1.106 3.227 1.258 3.743 1.206 CGC4 -1.04 1.279 -0.88 1.414 -0.49 1.436
SQB3 3.407 1.104 3.187 1.216 4.176 0.881 CGC5 -0.80 1.279 -1.13 1.277 -0.42 1.303
SQB4 3.383 1.168 3.293 1.112 3.500 1.185 CGD1 -0.77 1.277 -0.96 1.484 -0.45 1.491
SQB5 3.309 1.125 3.280 1.146 3.797 1.170 CGD2 -0.54 1.351 -0.88 1.315 -0.15 1.401
SQB6 3.519 1.085 3.493 1.212 3.554 1.294 CGD3 -0.86 1.311 -0.71 1.496 -0.32 1.589
SQB7 3.457 1.119 3.293 1.136 3.568 1.183 CGD4 -0.81 1.305 -0.89 1.429 -0.28 1.188
SQB8 3.222 1.173 3.413 1.175 4.351 0.691 CGD5 -1.01 1.260 -0.79 1.464 0.08 1.342
SQC1 3.173 1.116 3.467 1.095 3.541 1.062 CGD6 -0.86 1.282 -0.68 1.499 -0.28 1.298
SQC2 3.309 1.136 3.200 1.230 3.676 1.112 CGE1 -0.96 1.355 -0.99 1.511 -0.32 1.346
SQC3 3.370 1.198 3.453 1.211 3.432 1.160 CGE2 -0.63 1.269 -0.73 1.427 -0.20 1.282
SQC4 3.222 1.072 3.307 1.252 3.446 1.207 CGE3 -0.64 1.363 -0.89 1.439 -0.30 1.321
SQC5 3.346 1.074 3.173 1.155 3.446 1.195 CGE4 -0.88 1.279 -1.01 1.300 -0.15 1.430
SQD1 3.531 1.062 3.213 1.233 3.351 1.116 CGE5 -0.85 1.370 -1.01 1.438 -0.55 1.273
SQD2 3.580 1.035 3.320 1.042 3.770 1.092 CGE6 -0.89 1.255 -0.75 1.543 -0.20 1.271
SQD3 3.333 1.151 3.413 1.175 3.514 1.113 K1 2.815 1.276 3.000 1.078 4.027 0.921
SQD4 3.506 1.131 3.333 1.044 3.635 1.093 K2 2.840 1.289 2.800 1.040 3.716 1.092
SQD5 3.222 1.265 3.400 1.230 3.892 1.130 K3 2.914 1.380 2.760 1.113 3.932 0.941
SQD6 3.469 1.108 3.480 1.223 3.581 1.123 K4 3.012 1.188 2.853 0.982 3.378 1.143
SQE1 3.309 1.169 3.333 1.178 3.608 1.191 K5 2.728 1.314 2.933 0.977 3.338 1.126
SQE2 3.432 0.999 3.400 1.263 3.568 1.111 K6 2.765 1.258 3.093 1.153 3.892 0.885
SQE3 3.494 1.085 3.333 1.256 3.473 1.063 K7 2.963 1.259 2.867 1.082 3.446 1.087
SQE4 3.395 1.126 3.160 1.091 3.500 1.089 K8 2.926 1.330 2.933 1.004 3.500 1.101
SQE5 3.284 1.154 3.293 1.228 3.216 1.174 K9 2.728 1.369 2.840 1.115 3.419 1.147
SQE6 3.309 0.983 3.453 1.298 3.649 1.175 K10 2.901 1.281 2.907 1.042 3.459 1.088
CGA1 -0.77 1.381 -0.91 1.435 -0.50 1.455 K11 2.938 1.176 2.853 1.036 2.824 1.052
CGA2 -0.93 1.282 -0.80 1.395 -0.23 1.267 K12 2.963 1.279 2.813 0.982 3.500 1.126
CGA3 -1.11 1.265 -1.08 1.412 -0.50 1.492 K13 2.889 1.183 2.707 1.037 3.284 1.288
CGA4 -0.85 1.256 -1.00 1.480 -0.36 1.278 K14 2.691 1.384 2.880 1.115 3.635 0.821
CGA5 -0.78 1.255 -1.11 1.410 -0.57 1.605 K15 2.642 1.110 2.920 1.062 2.297 0.840
CGA6 -0.95 1.293 -0.91 1.517 -0.34 1.446 K16 3.185 1.276 3.160 0.839 4.081 0.824
CGA7 -0.79 1.180 -1.04 1.360 -0.62 1.290 OS 3.358 1.076 2.800 1.065 3.946 0.978
CGA8 -0.67 1.285 -0.63 1.383 -0.55 1.376 BI1 3.296 1.030 3.040 1.144 3.797 0.906
CGA9 -0.94 1.363 -0.72 1.564 -0.47 0.848 BI2 3.111 1.095 2.960 1.058 3.865 0.896
CGA10 -0.73 1.294 -1.15 1.259 -0.42 1.314 BI3 3.247 1.101 2.907 1.016 3.730 0.926 * mean; ** standard deviation; bolded figures indicate the biggest figure

Chapter 7 Testing the hypotheses of KE application to services using PLS method
90
7.4 Model testing and results
Initially, face validity and content validity tests were done. Data were then
standardized using SPSS® version 13 for Windows. The proposed properties of the
constructs in this study were tested using confirmatory factor analysis (CFA). The
adequacy of relationship model between the latent variables and the measurement items
was evaluated by convergent validity of the measurement items associated with
individual constructs, discriminant validity of the research instruments and reliability
analysis (see Figure 7-2; Tables 7-3 and 7-4).
This CFA technique is used to verify the factor structure of a set of observed
measures and to test the hypothesis that a relationship between observed variables and
their principal latent constructs presents (Suhr, 2006). Since the items under “cognitive
process” construct were derived from the “service quality” construct (i.e., the gap
between perceived and expected services), it was skipped for instrument validation.
According to Bagozzi (1994), it is argued that construct validity (convergent validity and
discriminant validity) will not be meaningful if the indexes formed as linear sums of
measurement. The structure of “cognitive process” construct was then assumed to follow
the result of validity and reliability tests for “service quality” construct.
7.4.1 Face validity and content validity
Before doing some statistical analyses, face validity and content validity tests
were carried out. At the initial stage, potential participants were approached and
explained about the purpose of the study. Thereafter, the questions and survey procedures
were explained. If the participants were comfortable and convinced enough, survey

Chapter 7 Testing the hypotheses of KE application to services using PLS method
91
began. Otherwise, it was postponed or cancelled. It is called face validity to motivate
people to participate in a study (Sanders and Cormick, 1993).
The question items (service attributes) were designed based on the relevant
theories and significant research findings proposed by previous scholars. These questions
considered and adapted the SERVQUAL 22-item scale by Parasuraman et al. (1988) and
the 26-item scale of hotel service quality by Ladhari (2009). These items were previously
empirically tested by scientific research techniques and have shown good tolerable
validity. It explains that an acceptable content validity has been showed in this study and
helpful to common sense the interpretation of the scale scores (Lai and Wu, 2011).
7.4.2 Convergent validity
There are three criteria recommended by Fornell and Larcker (1981): i) all item
factor loadings should be significant and exceed 0.7, ii) construct reliabilities should
exceed 0.7 and iii) average variance extracted (AVE) by each construct should exceed
0.5.
The factor loadings of items of 0.7 or more are highly expected (Nunnally, 1978).
This condition implies that there is more shared variance between the latent variable and
its measures, than the error variance. Barclay et al. (1995), however, opine that in a case
where the instruments are developed under a specific context and applied to a different
setting, the loadings cutoff point may become lower. Hulland (1999) and Chin (1998)
argue that the items with loadings of less than 0.5 should be dropped.
Construct/composite reliability measures how well a set of items (or variables)
measures a single one-dimensional latent construct. While AVE is used to measure the

Chapter 7 Testing the hypotheses of KE application to services using PLS method
92
amount of variance that a latent variable captures from its measurement items relative to
the amount of variance due to measurement error (Aibinu and Al-Lawati, 2010).
Regarding convergent validity evaluation, all items of the “service quality”
construct have loadings above 0.5 which are significant at p-value = 0.001, except for
three items at the Japanese group (i.e., SQA7, SQA9 and SQA11). As a consequence, these
three items are removed. Furthermore, this construct produces acceptable composite
reliability and AVE scores for all three population groups.
As for “affective process” construct, in Indonesian group, based on the output
from PLS-Graph 2.0, all items of “affective process” construct have loadings above 0.5
(in a range between 0.62 and 0.76) except for “passionate” (0.23). In Singaporean group,
all items have loadings above 0.5 (in a range between 0.55 and 0.69). However, in
Japanese group, the items “convenient” and “relaxed” have loadings below 0.5, while the
remaining items are above 0.5. As a consequence, the items with loadings below 0.5 are
deleted. Furthermore, this construct has acceptable composite reliability and AVE scores
for all three population groups.
As for “behavioral intention” construct, its items have satisfied loadings,
composite reliability and AVE scores for all three population groups.
There is only one item in overall satisfaction construct. Hence, it is assumed to be
valid and reliable.
7.4.3 Discriminant validity
According to Hulland (1999), a construct should share more variance with its
measures than other constructs in a given PLS model. In other words, the average
variance shared between a construct and its measures should be greater than the variance

Chapter 7 Testing the hypotheses of KE application to services using PLS method
93
shared between the construct and other constructs in the model. Two options of
assessment are recommended (Gefen and Straub, 2005): i) the square root of AVE of a
construct must be greater than its corresponding inter-construct correlation coefficients
and ii) the loadings for the within-construct must exceed the inter-construct cross
loadings by at least 0.1.
The result shows that all square roots of the AVEs (see Table 7-3, figures in
greyed area) for the “service quality”, “affective process” and “behavioral intention”
constructs are greater than the corresponding inter-construct correlations (see Table 7-3,
figures in non-greyed area) for all three different population groups.
7.4.4 Reliability
Reliability test is used to evaluate the internal consistency of a construct.
According to Gorla et al. (2010), Cronbach‟s alpha and composite reliability are used to
measure how well a set of items (or variables) measures a single one-dimensional latent
construct. Nunnally (1978) suggests 0.7 as a benchmark for „modest‟ reliability, while
Churchill (1979) suggests that Cronbach‟s alpha and composite reliability value of 0.6
are acceptable. This study shows that all values of composite reliability and Cronbach‟s
alpha for all constructs fulfill and satisfy the minimum cutoff (see Table 7-4).
In conclusion, based on the results above, all constructs have adequate convergent
and discriminant validity and satisfied reliability. Thus, they are eligible for the path
analysis.

Chapter 7 Testing the hypotheses of KE application to services using PLS method
94
SQA1
SQA2
SQA3
SQA4
SQA5
SQA6
SQA7
SQA8
SQA9
SQA10
SQA11
SQA12
SQA13
SQA14
SQB1
SQB2
SQB3
SQB4
SQB5
SQB6
SQB7
SQB8
SQC1
SQC2
SQC3
SQC4
SQC5
SQD1
SQD2
SQD3
SQD4
SQD5
SQD6
SQE1
SQE2
SQE3
SQE4
SQE5
SQE6
Reliability
Responsiveness
Assurance
Empathy
Tangible
SERVICE
QUALITY
CGA1
CGA2
CGA3
CGA4
CGA5
CGA6
CGA7
CGA8
CGA9
CGA10
CGA11
CGA12
CGA13
CGA14
CGB1
CGB2
CGB3
CGB4
CGB5
CGB6
CGB7
CGB8
CGC1
CGC2
CGC3
CGC4
CGC5
CGD1
CGD2
CGD3
CGD4
CGD5
CGD6
CGE1
CGE2
CGE3
CGE4
CGE5
CGE6
Reliability
Responsiveness
Assurance
Empathy
Tangible
COGNITIVE
PROCESS
AFFECTIVE
PROCESS
K1
K2
K3
K4
K5
K6
K7
K8
K9
K10
K11
K12
K13
K14
OVERALL
SATISFACTION
OS
BEHAVIORAL
INTENTION
BI1
BI2
BI3
*(0.77, 0.5, 0.67)
(0.64, 0.63, 0.5)
(0.68, 0.55, 0.65)
(0.74, 0.67, 0.55)
(0.69, 0.6, 0.64)
(0.72, 0.6, 0.61)
(0.63, 0.63, 0.11)
(0.76, 0.67, 0.59)
(0.67, 0.68, 0.23 )
(0.72, 0.6, 0.5)
(0.75, 0.53, 0.26 )
(0.71, 0.68, 0.57)
(0.72, 0.63, 0.64)
(0.73, 0.64, 0.55)
(0.67, 0.68, 0.64)
(0.77, 0.75, 0.65)
(0.71, 0.64, 0.67)
(0.72, 0.53, 0.63)
(0.73, 0.51, 0.6)
(0.75, 0.58, 0.7)
(0.77, 0.71, 0.63)
(0.74, 0.5, 0.57)
(0.8, 0.5, 0.6)
(0.76, 0.63, 0.53)
(0.7, 0.75, 0.68)
(0.77, 0.74, 0.76)
(0.73, 0.77, 0.57)
(0.77, 0.69, 0.57)
(0.69, 0.63, 0.58)
(0.75, 0.7, 0.54)
(0.78, 0.7, 0.73)
(0.79, 0.69, 0.57)
(0.71, 0.64, 0.68)
(0.76, 0.62, 0.74)
(0.74, 0.72, 0.55)
(0.76, 0.66, 0.56)
(0.78, 0.67, 0.51)
(0.75, 0.6, 0.73)
(0.6, 0.68, 0.72)
(0.68, 0.64, 0.09)
(0.62, 0.62, 0.59)
(0.74, 0.68, 0.51)
(0.69, 0.6, 0.64)
(0.72, 0.59, 0.62)
(0.63, 0.63, 0.77)
(0.75, 0.55, 0.44)
(0.76, 0.65, 0.51)
(0.69, 0.69, 0.66)
(0.7, 0.68, 0.64)
(0.69, 0.56, 0.73)
K16
K15
(0.69, 0.61, 0.54)
(0.69, 0.6, 0.62)
(0.75, 0.66, 0.56)
(0.23, 0.62, 0.63)
(0.76, 0.62, 0.66)
(0.86, 0.83, 0.87)
(0.84, 0.8, 0.85)
(0.84, 0.66, 0.7)
* It indicates loadings for (Indonesian, Singaporean, and Japanese). Figures in „red‟ indicate insufficient loadings.
Figure 7-2 Proposed structural model of KE application in services
Table 7-3 Assessment of discriminant validity Construct Service quality Affective process Behavioral intention
Service quality 0.71
Affective process 0.33 0.71
Behavioral intention 0.29 0.23 0.84 (a) Indonesian group
Construct Service quality Affective process Behavioral intention
Service quality 0.7
Affective process 0.67 0.7
Behavioral intention 0.68 0.64 0.81 (b) Singaporean group

Chapter 7 Testing the hypotheses of KE application to services using PLS method
95
Construct Service quality Affective process Behavioral intention
Service quality 0.69
Affective process 0.66 0.7
Behavioral intention 0.67 0.61 0.81 (c) Japanese group
Table 7-4 Assessment of convergent validity
Construct No. of items Composite reliability Cronbach‟s alpha AVE
Indo Sin Jpn Indo Sin Jpn Indo Sin Jpn
Service quality 39*; 39
**; 36
*** 0.97 0.95 0.93 0.97 0.94 0.92 0.51 0.49 0.48
Tan_SQ 14; 14; 11 0.94 0.89 0.85 0.93 0.86 0.81 0.5 0.45 0.47
Rel_SQ 8; 8; 8 0.9 0.83 0.82 0.88 0.77 0.75 0.54 0.5 0.48
Resp_SQ 5; 5; 5 0.87 0.81 0.77 0.81 0.71 0.62 0.57 0.47 0.49
Assu_SQ 6; 6; 6 0.88 0.82 0.75 0.84 0.73 0.59 0.56 0.48 0.48
Emp_SQ 6; 6; 6 0.87 0.82 0.8 0.82 0.74 0.7 0.54 0.43 0.49
Affective process 15; 16; 14 0.94 0.91 0.86 0.91 0.86 0.78 0.5 0.49 0.49
Behavioral intention 3; 3; 3 0.88 0.81 0.85 0.8 0.66 0.74 0.71 0.59 0.65 *Indonesian, **Singaporean, ***Japanese
7.5 Analysis of the structural model
This is to assess a structural model by looking at the explanatory power of a
structural model and its path coefficients. The explanatory power of a structural model
can be evaluated by examining the amount of variance in the dependent variable (R2).
Each path coefficient corresponds to a hypothesis. The higher the path coefficient, the
stronger is the effect of a latent predictor variable on the dependent variable (Aibinu and
Al-Lawati, 2010).
In this study, the significance of the path coefficients is tested by evaluating the
significance of t-value for the path coefficients as the output of bootstrap function of the
SmartPLS 2.0 with 200 resample. The hypotheses tests are performed by examining the
size, the sign and the significance of the path coefficients (see Figure 7-3, Table 7-5 and
Figure 7-4). All statistical tests are assessed using one-tailed t-test since the hypotheses
are unidirectional in nature.

Chapter 7 Testing the hypotheses of KE application to services using PLS method
96
Path coefficients and R2: *Indonesian, **Singaporean, ***Japanese
Figure 7-3 Structural model with path coefficients
Table 7-5 Results of structural model Path Indonesian Singaporean Japanese
Coeff. t-val. Inference* Coeff. t-val. Inference* Coeff. t-val. Inference*
Service Quality Tan_SQ 0.96 78.76 Supported 0.92 56.37 Supported 0.87 31.39 Supported
Service Quality Rel_SQ 0.94 107.4 Supported 0.88 34.15 Supported 0.83 16.38 Supported
Service Quality Resp_SQ 0.92 69.77 Supported 0.86 28.79 Supported 0.78 14.68 Supported
Service Quality Assu_SQ 0.92 58.55 Supported 0.84 26.34 Supported 0.84 26.34 Supported
Service Quality Emp_SQ 0.9 51.85 Supported 0.86 36.75 Supported 0.87 34.01 Supported
Cognitive Process Tan_CG 0.95 55.76 Supported 0.88 40.7 Supported 0.87 19.46 Supported
Cognitive Process Rel_CG 0.9 53.88 Supported 0.82 28.12 Supported 0.57 5.09 Supported
Cognitive Process Resp_CG 0.88 37.25 Supported 0.84 23.87 Supported 0.58 4.64 Supported
Cognitive Process Assu_CG 0.86 33.23 Supported 0.89 38.37 Supported 0.75 14.21 Supported
Cognitive Process Emp_CG 0.85 26.89 Supported 0.85 34.65 Supported 0.44 2.93 Supported
Service Quality Cognitive Process 0.91 62.86 Supported 0.91 51.66 Supported 0.33 3.04 Supported
Service Quality Affective Process 0.3 2.11 Supported 0.73 3.11 Supported 0.76 12.41 Supported
Cognitive Process Affective Process 0.34 2.14 Supported 0.3 2.27 Supported 0.01 0.14 Not
supported
Cognitive Process Overall Satisfaction 0.24 2.26 Supported 0.19 1.68 Supported -0.15 1.86 Supported
Affective Process Overall Satisfaction 0.39 4.73 Supported 0.43 4.81 Supported 0.56 8.42 Supported
Overall Satisfaction Behavioral Intention 0.46 5.61 Supported 0.57 8.93 Supported 0.48 5.67 Supported *it is checked with Z0.05 = 1.645

Chapter 7 Testing the hypotheses of KE application to services using PLS method
97
Figure 7-4 Structural model of constructs
The findings of path analysis among the five major latent variables/constructs are
as follows:
(1) The path leading from “service quality” to “cognitive process”.
Hypothesis 1: Perceived service quality is positively related to cognitive process. The
path for all three groups is significant, which supports hypothesis 1. Both Indonesian and
Singaporean rate a larger effect of perceived service quality on cognitive process than
Japanese.
(2) The path leading from “service quality” to “affective process”.
Hypothesis 2: Perceived service quality is positively related to affective process.
Affective process refers to the response of customer emotions/Kansei. What the
customers perceive on luxury hotel services determines their emotional responses. All
paths in the three population groups are supported. The largest effect of perceived service
quality on the affective process is shown by Japanese (path coefficient = 0.76).
(3) The path leading from “cognitive process” to “affective process”.
Hypothesis 3: The higher the cognitive process, the higher the affective process. This
hypothesis is only not supported by Japanese group. This may be due to the relatively

Chapter 7 Testing the hypotheses of KE application to services using PLS method
98
high average scores on expectation with low average scores on perception. Thus, the
service gap scores are not significantly and positively correlated with perceived Kansei
scores. Singaporean and Indonesian have relatively the same pattern of average scores on
expectation and perception.
(4) The path leading from “cognitive process” to “overall satisfaction”.
Hypothesis 4: Cognitive process is positively related to overall satisfaction. This
hypothesis is supported by the Indonesian and Singaporean groups. However, it has a
reverse outcome for the Japanese group, i.e., cognitive process has a negative correlation
with overall satisfaction. It shows that the Japanese‟s overall satisfaction is not positively
influenced by the total evaluation on services (see Figure 7-5).
Figure 7-5 The relationship between overall satisfaction and evaluation

Chapter 7 Testing the hypotheses of KE application to services using PLS method
99
(5) The path leading from “affective process” to “overall satisfaction”.
Hypothesis 5: Affective process is positively related to overall satisfaction. The path for
all three groups is significant that supports hypothesis 5. This is the main hypothesis of
KE study applied to services. The Japanese group has the highest effect of affective
process on overall satisfaction, while Indonesian and Singaporean groups relatively rate
the same. This confirms that Japanese tend to rely their overall satisfaction on
affect/emotion/Kansei rather than cognition. The more their emotions influenced, the
more satisfied they are.
(6) The path leading from “overall satisfaction” to “behavioral intention”.
Hypothesis 6: Overall satisfaction is positively related to behavioral intention. All paths
for three groups are supported. All groups relatively show the same effect of overall
satisfaction on behavioral intention. This finding confirms that the inclusion of affective
process, as a complement of cognitive process, enhances the variation explained in
customer loyalty. As emphasized by Yu and Dean (2001), an emotional component is
more important than a cognitive component in influencing customer overall satisfaction
and loyalty. According to Ladhari (2009), direct impact of emotional satisfaction on
behavioral intentions is more significant than direct effect of other constructs on
behavioral intentions.
Previous studies on hotel services tend to focus on cognitive approach (Ladhari,
2009). Few studies have reported data on customer emotions of hotel services (Barsky
and Nash, 2002). This study highlights empirical evidence that affective process (Kansei)
plays an important role in service experiences. Though affective and cognitive processes

Chapter 7 Testing the hypotheses of KE application to services using PLS method
100
are independent, direct impact of affective process on overall satisfaction in this present
study is more significant than direct effect of cognitive process on overall satisfaction. It
is apparent that the role of affective process during service encounter should be of the
utmost interest to researchers and practitioners.
7.6 Analysis of Kansei
Analysis of Kansei consists of two parts, i.e., Kansei importance and Kansei response.
7.6.1 Importance of Kansei
In general, Singaporean and Indonesian groups have a similar pattern (see Figure
7-4). The highest and lowest Kansei importance scores are rated by the Singaporean and
Japanese, respectively. The highest score was for “spacious” (4.28), while the lowest one
was for “satisfied” (3.5). In order to test whether there is a significant difference in
distributions of the importance scores among three different population groups, Kruskal-
Wallis test is used. The assumptions are independent, random samples and no normal
distribution. It is a nonparametric alternative to one-way analysis of variance. The
hypotheses are defined as follows:
Null hypothesis (H0): Mi1 = Mi2 = Mi3 (The medians of importance scores of Kansei-i
among 3 different groups are equal in each gender), where i = relieved, modern, friendly
… attractive.
Alternative hypothesis (H1): Not all the medians are equal.
There are thirteen Kansei eligible for this test, i.e., “relieved”, “modern”,
“friendly”, “satisfied”, “peaceful”, “relaxed”, “happy”, “welcoming”, “clean” and
“attractive”. By using a significance level of 0.05 and rejection area if p-value ≤ 0.05, the
results are provided (see Table 7-6). For the male group, the significant Kansei words are
“satisfied”, “modern”, “elegant” and “spacious” in which Japanese rates them as the
lowest. For the female group, the significant Kansei words are “satisfied” and “spacious”.

Chapter 7 Testing the hypotheses of KE application to services using PLS method
101
It is shown that Indonesian (both female and male) has higher expectation on Kansei
“satisfied” than Singaporean and Japanese. Singaporean (both female and male) is found
to have higher expectation on Kansei “spacious” than its two counterparts.
Figure 7-6 Scores of Kansei importance
Table 7-6 Comparison of Kansei importance scores among 3 groups
Kansei-i Male Female
aMIndo
bMSin
cMJap p-value MIndo MSin MJap p-value
Attractive 57.3 62.83 50.82 0.262 62.53 57.69 56.63 0.678
Clean 55.2 53.33 62.72 0.385 52.84 55.85 68.72 0.067
Welcoming 56.65 61.32 53.08 0.531 61.5 57.71 57.7 0.833
Happy 64.79 55.81 49.32 0.088 63.4 58.76 54.62 0.481
Peaceful 62.1 53.75 54.44 0.415 60.85 54.85 61.32 0.608
Satisfied 65.35 62.96 41.53 0.001* 73.43 56.31 46.58 0.001*
Friendly 59.98 54.06 56.56 0.702 64.89 59.13 52.67 0.243
Modern 61.63 62.67 46.06 0.038* 61.8 54.23 60.95 0.52
Relieved 57.73 53.22 59.94 0.644 65.11 54.69 56.99 0.312
Quiet 58.01 63.54 49.31 0.148 64.91 58.37 53.42 0.286
Elegant 64.83 63.46 41.63 0.002* 64.66 53.24 58.95 0.284
Spacious 59.82 68.08 42.71 0.002* 63.01 65 48.62 0.049*
Confident 54.16 55.54 61.69 0.535 63.66 54.42 58.79 0.438 *Significant at p < 0.05; a, b, c: mean rank of Indonesian, Singaporean and Japanese samples, respectively

Chapter 7 Testing the hypotheses of KE application to services using PLS method
102
7.6.2 Kansei response
The evaluation of Kansei/affective process response begins with the analysis of its
structure (see Table 7-7 and Figure 7-5). The exploratory factor analysis (EFA) is
performed using SPSS® 13 for Windows. It aims to identify the number of underlying
factor structure without imposing any preconceived structure on the outcome (Child,
1990). The finding shows that there are 2 main latent variables (factors) formed in
affective process construct: i) servicescape-based Kansei (it refers to emotions caused by
physical surroundings, such as happy, clean and elegant) and ii) interaction-based Kansei
(emotions influenced by the interaction between customer and employee, such as
welcome, satisfied and friendly).
Table 7-7 Factor structure of affective process/Kansei
Subject KMO * Factor Item Indonesian 0.885 Servicescape-based Kansei Elegant(K11), modern(K13), attractive(K2), relaxed(K7), clean(K3),
quiet(K15), spacious(K10), peaceful(K8), happy(K6) Interaction-based Kansei Welcome(K4), friendly(K12), confident(K5), relieved(K14),
convenient(K1), satisfied(K9) Singaporean 0.872 Luxury-based Kansei Happy(K6), modern(K13), convenient(K1), clean(K3), quiet(K15)
Interaction-based Kansei Confident(K5), welcome(K4), spacious(K10), passionate(K2),
elegant(K16), satisfied(K11), relieved(K14), attractive(K9) Peacefulness-based Kansei Friendly(K12), relaxed(K7), peaceful(K8)
Japanese 0.765 Interaction-based Kansei Friendly(K12), satisfied(K9), spacious(K10), modern(K13),
attractive(K2), peaceful(K8) Servicescape-based Kansei Clean(K3), confident(K5), relieved(K14), happy(K6), elegant(K11),
welcome(K4) Passion Passionate(K16) Quietness Quiet(K15)
*KMO=Kaiser-Meyer-Olkin. Its value > 0.5 indicates that the sample is adequate

Chapter 7 Testing the hypotheses of KE application to services using PLS method
103
Figure 7-7 The visualization of Kansei structure among 3 population groups
The Kansei response among Indonesian, Singaporean and Japanese are compared
(see Figure 7-6). The result shows that Singaporean and Indonesian tend to have the same
results. In general, their Kansei responses lie on scores between 2.50 and 4.00. The
highest score is Kansei “quiet” rated by the Japanese group (4.09), while the lowest was
given by the Indonesian counterpart on Kansei “relieved” (2.69). In order to validate any
differences on Kansei responses among three groups, the Kruskal-Wallis test is used. The
hypotheses are defined as follows:
Null hypothesis (H0): Mi1 = Mi2 = Mi3 (The medians of response scores of Kansei-i
among 3 different groups are equal in each gender), where i = attractive, clean,
welcoming … quiet.
Alternative hypothesis (H1): Not all the medians are equal.
For the male group, there are 11 out of 13 Kansei words significantly different
among three populations; whereas for the female counterpart, 8 out of 13 Kansei words
are significantly different (see Table 7-8). For the male group, the most significant
Kansei words are “clean”, “relieved”, “quiet” and “confident” in which the Japanese
males perceive them at the most. For the female group, “attractive”, “clean” and “quiet”
are the most significant Kansei words. In general, Japanese tourists (both males and
females) perceived luxury hotels where they stayed as a very clean and quiet place.

Chapter 7 Testing the hypotheses of KE application to services using PLS method
104
Figure 7-8 Scores of Kansei response
Table 7-8 Comparison of Kansei response scores among 3 groups
Kansei-i Male Female
aMIndo
bMSin
cMJap p-value MIndo MSin MJap p-value
Attractive 47.06 56.79 68.53 0.013* 55.86 42.44 79.3 0*
Clean 46.74 48.76 76.92 0* 55.91 44.59 77.04 0*
Welcoming 51.24 56.86 63.69 0.22* 61.33 47.38 68.47 0.017*
Happy 43.3 62.07 67.53 0.002* 59.16 50.49 67.57 0.074
Peaceful 47.48 54.13 70.72 0.005* 60.28 50.76 66.12 0.115
Satisfied 47.93 54.69 69.64 0.01* 55.41 52.92 69.01 0.072
Friendly 51.55 50.86 69.35 0.018* 58.59 50.08 68.59 0.048*
Modern 54.15 54.85 62.4 0.464 58.86 48.06 70.37 0.011*
Relieved 41.59 58.01 73.54 0* 56.28 47.97 73.18 0.003*
Quiet 44.73 51.96 76.03 0* 58.05 42.78 76.64 0*
Elegant 53.18 60.28 58.07 0.598 66.93 53.47 56.33 0.158
Spacious 47.83 52.40 72.04 0.002* 59.54 53.17 64.42 0.323
Confident 45.3 49.99 77.33 0* 47.48 57.44 72.74 0.003* *Significant at p < 0.05; a, b, c: mean rank of Indonesian, Singaporean, and Japanese samples, respectively
According to Hofstede and Bond (1988), the characteristics of nations can be
defined by the scores of national cultural dimension (see Table 7-9). Japanese have the
greatest scores among all subjects on “uncertainty avoidance” (92/100), “masculinity”

Chapter 7 Testing the hypotheses of KE application to services using PLS method
105
(95/100) and “long-term orientation” (80/100). In terms of uncertainty avoidance,
Japanese people tend to be easily worried, nervous and irritable. They need a more stable
environment to guard against the occurrence of any uncertainty. With high scores on
masculinity, Japanese tend not to value the empathy perspective of service quality. In
addition, based on long-term relationship value, Japanese people are more patient with
time and demand efficiency upon everything. Resting and a peaceful environment are
desirable and expected. Thus, Japanese tourists tend to value luxury hotels as clean and
quiet places to stay.
Table 7-9 The scores of national cultural dimension (Hofstede and Bond, 1988) Nation Power distance Individualism Masculinity Uncertainty avoidance Long-term orientation
Indonesia 78 14 46 48 -
Singapore 74 20 48 8 48
Japan 54 46 95 92 80
America 40 91 62 46 29
Basically, each population group has a different response to Kansei. By
identifying the three highest responses on luxury hotel services, for the male group,
Indonesian perceive “modern”, “friendly” and “elegant”; Singaporean perceive “happy”,
“relieved” and “elegant”; Japanese perceive “clean”, “quiet” and “confident”. For the
female group, Indonesian perceive “welcoming”, “peaceful” and “elegant”; Singaporean
perceive “elegant”, “spacious” and “confident”; Japanese perceive “attractive”, “clean”
and “quiet”.
Both Indonesian and Singaporean (males and females) share a common Kansei
“elegant”. This finding is supported by the same cultural value of Singapore and
Indonesia, i.e., power distance. According to Hofstede and Bond (1988), both Singapore
and Indonesia have high scores on power distance (78/100 for Indonesia; 74/100 for
Singapore). A high value of power distance explains that people believe in the unequal

Chapter 7 Testing the hypotheses of KE application to services using PLS method
106
distribution of power and tend to easily obey authority (Hofstede and Bond, 1988).
According to Furrer et al. (2000), in a society with very strong power distance, customers
with their superior power would expect service providers to have less power. According
to Hofstede and Bond (1988), “power distances” refers to the extent to which the less
powerful members of organizations and institutions (e.g., family) accept and expect that
power is distributed unequally. This definition explains inequality that is defined from
below, not from above. It suggests that a level of inequality is endorsed by its followers
as much as by its leaders. The grandeur of luxury hotels is perceived as tangible goods
which reveal the extent to which the service providers respect the power of the
superiority. The magnificence of luxury hotels may represent the customers‟ high statuses
(Hsieh and Tsai, 2008). Thus, it is confirmed that “elegant” is perceived as a common
Kansei for Indonesian and Singaporean tourists.
7.7 Conclusion
The findings as discussed in this chapter will contribute to the research
methodology in Kansei Engineering (KE) applied to services. By incorporating an
empirical study involving Indonesian, Singaporean and Japanese tourists, this chapter has
shown the rationale and the application of partial least square (PLS) estimation approach
to structural equation modeling.
The finding emphasizes that affective process/Kansei plays an important role
during service encounter. Though affective and cognitive processes are independent,
direct impact of affective process on overall satisfaction in the present study is more
significant than direct effect of cognitive process on overall satisfaction.

Chapter 7 Testing the hypotheses of KE application to services using PLS method
107
It is hoped that the study can provide a useful framework for other researchers
who may conduct a similar research in different service settings and domains. As
different cultural differences have been considered and analyzed, this study can provide
an idea on how to understand customer Kansei. Thereafter, it may come out with
appropriate operational strategies in fulfilling different customer Kansei. For example,
according to the findings, Japanese will be emotionally satisfied if luxury hotels provide
very clean and quiet environment and atmosphere. Apart from that, elegant looks can
fulfill and satisfy Indonesian and Singaporean tourists.
To understand which service items/attributes are sensitive to customer emotional
needs, next chapter will discuss the relationship of service attributes and Kansei by
incorporating the Kano model.

Chapter 8 Integrating the effects of Kano model in Kansei Engineering
108
8 Integrating the effects of Kano model in Kansei Engineering
8.1 Introduction
This chapter presents an analysis of the effects of the Kano model in Kansei
Engineering (KE) methodology. The Kano model is used and inserted into KE to exhibit
the relationship between service attribute performances and customer emotional
responses.
Essentially, the Kano model categorizes service attribute quality into three groups
(Must-be [M], One-dimensional [O] and Attractive [A]). Through a focus on attractive
qualities of service attributes, this study enables service providers and managers to
establish the extent to which they prioritize their improvement efforts and to always
satisfy their customer emotions beyond expectation. Data collected from Indonesian and
Singaporean tourists were reported.
8.2 Problem description
Humans exhibit strong interest in products through emotions. Despite emotion
being highly subjective and individualistic, Desmet (2004) is able to identify the
relationship between product elements and customer expression. Products advantageous
to consumers evoke pleasant emotions. As products and services are of equivalent quality
in the market, a subjective evaluation of aesthetics becomes a critical precursor to
customer satisfaction.
In many cases, the voice of customer is a valuable input for new product and
service development and innovation. In this process, a great deal of resources (working
hours, methods and tools) is involved. Since a few decades ago, the focus of business
management and research has been intensively on customer satisfaction. In today‟s

Chapter 8 Integrating the effects of Kano model in Kansei Engineering
109
competitive business, however, to satisfy customers is not sufficient. Rather, how to
delight our customers becomes a prominent issue for long-term business success (Yang,
2011). Hence, companies must intensively strive for total customer satisfaction and
loyalty to win over the competition. There would be a competitive advantage for a
company which always focuses on desired attributes with the fulfillment of unexpected
and memorable experiences to customers (Yang, 2011).
The question is asked “What design features really do have great impact on
customer emotions and evoke a great deal of delight?” Logically, customer impression is
positively and linearly related to the improved product and service features. However, in
some cases, the relationship between product quality and customer impression is no
longer linear (Kano et al., 1984; Chen and Chuang, 2008). As a consequence, continuous
or even radical improvement on certain product and service attributes without intensively
considering what customers desire, may not be sufficient. Contrast this to a situation
where only a little innovation may lead to a large amount of customer delight. The Kano
model has the potential to eke out the unspoken and latent human needs, the satisfaction
of which may lead to customer delight. Delighted customers will remain loyal and refer
favorably to others about the company and its services and products.
The Kano model provides a unique way of distinguishing the impact of different
customer needs (voice of customer) on total customer satisfaction in the early stage of
product and service development (Raharjo, 2007). In highly competitive business,
companies should create and offer product and service attributes targeted specifically at
exciting customers and over-satisfying them (Tan and Pawitra, 2001). Not only does the
Kano model promotes understanding of product and service requirements, but also it

Chapter 8 Integrating the effects of Kano model in Kansei Engineering
110
provides valuable guidance in trade-off situation due to technical and financial reasons
(Matzler and Hinterhuber, 1998). In this situation, the attractive attributes should be
treated carefully as they are the key to beat the competition in the market place (Tan and
Pawitra, 2001).
The Kano model has shown its contribution to the quality fields, such as the
integration of Kano model and quality function deployment (QFD) (Tan and Pawitra,
2001), the dynamics of Kano model in design for six sigma (Raharjo, 2007) and the role
of Kano model in robust design (Chen and Chuang, 2008). In line with the development
of Kano model, KE has also a strong ability to integrate with other statistical and quality
tools (Schütte, 2002).
A recent study by Lanzotti and Tarantino (2008) addresses the issue of KE and
other methods in the field of quality design. There is no formal methodology, however, to
investigate the contribution of Kano model on the KE methodology. Therefore, to fill in
this niche, this study proposes two objectives. The first is to develop an integrative
framework of the contribution of Kano model to KE in services. This research will show
the applicability of modified KE in services, apart from products. The second objective is
to conduct a preliminary test of this proposed framework by taking a case study on luxury
hotel services by involving Singaporean and Indonesian tourists.
Basically, the Kano model is incorporated into the KE methodology as an
enhancement tool to determine the performance level of service attributes. Specifically,
the proposed integrative framework will provide insights to service designers to not only
be able to classify the service attributes, but to also prioritize the improvement of service
attributes taking into account the impact on customer emotional needs/Kansei.

Chapter 8 Integrating the effects of Kano model in Kansei Engineering
111
8.3 The Kano model and its potential benefits
The Kano model categorizes customer attributes into three different types,
namely, Must-be (M), One-dimensional (O) and Attractive (A). The characteristics of
each of Kano categories have been reviewed in Chapter 2. Five different approaches are
valid and reliable in categorizing product and service attributes in the Kano model
(Mikulic and Prebezac, 2011). They include “Kano‟s model”, “penalty-reward contrast
analysis”, “importance grid”, “qualitative data methods” and “direct classification”.
According to their study, only the Kano questionnaire and direct classification methods
are capable of classifying Kano‟s attributes in the product and service development
phases.
Inherently, the Kano model is similar to the Herzberg‟s motivation-hygiene
theory (Herzberg, 1968). This motivation-hygiene theory is inspired by the Maslow‟s
theory of a need hierarchy (Maslow, 1943). The potential of Kano‟s and Herzberg‟s
models is that a reminder that in working to satisfy customers, it is highly required to
minimize customer dissatisfaction. According to a study by Herzberg (1968) that
involves 1685 employees, there are two major classifications of employee satisfaction
generator. They include: i) motivator (satisfier) which refers to achievement, recognition,
work itself, responsibility, advancement and growth, and ii) hygiene factor
(dissatisfaction-avoidance) that concerns company policy, supervision, relationship with
boss, work conditions, salary and relationship with peers.
Job characteristics related to Herzberg‟s motivator factors will lead to employee
satisfaction and happiness. However, similar to Kano‟s attractive category, the absence of
such gratifying jobs will not appear to lead to dissatisfaction. Instead, the unfavorable

Chapter 8 Integrating the effects of Kano model in Kansei Engineering
112
assessments of jobs concerning the hygiene factor will cause dissatisfaction. Clearly, the
improved hygiene factors will not lead to any significant increase in employee
satisfaction. Thus, a company should promote self-enhancement jobs rather than
administration-related jobs in order to achieve a high level of employee satisfaction.
There are differences between the Kano model and the Herzberg‟s motivation-
hygiene theory. The Kano model concerns the quality for customer, whereas Herzberg
focuses more on the relationship between the employer and the employees within an
organization. Kano named the Herzberg‟s motivation-hygiene theory as the quality‟s M-
H theory and redefined it as attractive and must-be qualities (Lee and Chen, 2006).
Basically, Kano has three main satisfaction drivers (attractive [A], must-be [M] and one-
dimensional [O]), whereas Herzberg has two main satisfaction drivers (hygiene and
motivator). Kano typically completed the Herzberg model by incorporating a diagonal
line moving from southwest to northeast that refers to the linearity of satisfaction level
(known as one-dimensional).
In general, the Kano model provides a formal methodology as a unique way of
distinguishing the impact of different customer needs (i.e., the voice of customer) on total
customer satisfaction in the very early stage of product and service development.
Moreover, this method has been incorporated into an existing quality tool (such as QFD)
in fitting accurate customer needs (Tan and Pawitra, 2001). This Kano method has a
wider scope than Herzberg‟s model since it has been applied intensively and widely in
products and services (see Tan and Pawitra, 2001; Shen et al., 2000). According to Witell
and Fundin (2005), the Kano model is potentially used to determine the dynamics of
customer needs. Raharjo (2007) proposed a study to quantitatively model the limited

Chapter 8 Integrating the effects of Kano model in Kansei Engineering
113
historical data which are derived from the results of Kano questionnaires, in order to
forecast the future Kano‟s category for each of the quality attributes.
In identifying which Kano category a particular service attribute falls under, the
Kano questionnaire is used (Kano et al., 1984). A subject is faced with two Kano
situations. The first is where the quality of the service attribute is present or functional.
The second situation is where the quality of the service attribute is absent or
dysfunctional. In either situation, the subject must choose one of the responses to express
her/his feelings of satisfaction (Kano et al., 1984; Chen and Chuang, 2008) (see Table 8-
1). By integrating these two responses, the service attribute criterion can be identified as
Attractive (A), Must-be (M) or One-dimensional (O).
There are two potential benefits of incorporating the Kano model into product or
service development. First, it gives a better understanding of customer requirements as
classified into several categories (A, O, M or I). Second, it can be used as a prioritization
tool if a trade-off needs to be made. If the improvement of certain product or service
attributes cannot be effected (due to, for example, financial, technical or operational
reasons), the attributes in the higher categories (e.g., attractive qualification [A]) would
be given higher priority. As argued by Matzler and Hinterhuber (1998), it is not very
beneficial to invest in improving must-be qualifications (M) which have already attained
a satisfactory outcome.
Table 8-1 Kano evaluation table
Service criteria/attributes Dysfunctional
Satisfied It should be that way I am indifferent I can live with it Dissatisfied
Functional Satisfied Q A A A O
It should be that way R I I I M
I am indifferent R I I I M
I can live with it R I I I M
Dissatisfied R R R R Q Note: A = Attractive, O = One-dimensional, M = Must-be, I = Indifferent, R = Reverse, Q = Questionable

Chapter 8 Integrating the effects of Kano model in Kansei Engineering
114
8.4 A proposed integrative framework of the Kano model and KE
The idea of integrating Kano‟s model and KE was first investigated by Lanzotti
and Tarantino (2008) who conduct a case study of designing the interior of a train. Their
study look at the quality of product features. A recent study by Llinares and Page (2011)
reveals the use of the Kano model in analyzing the impact of emotional attributes on
customer purchase decision. Another similar study on investigating customer delight for
quality attributes was conducted by Yang (2011). Her study develops a critical delight-
driver model known as the customer-delight barometer (CDB). There is little research,
however, that analyzes the relationship between the category of product performance and
customer emotional needs/Kansei.
This chapter discusses an integrative framework explaining the impact of service
attributes categorized as attractive quality (A) on customer emotional needs in services.
The motivations include: i) it will create little damage if there is any discrepancy, ii) it
will bring source of differentiation when it performs well, iii) potentially, it will drive
customer loyalty and „wow‟ instead of eliminating problems and iv) it will obtain total
customer satisfaction (Yang, 2011).
According to Collins and Porras (2004), it is essential to invest in proactive and
generative markets which are reflected by customer-delight based. Due to today‟s
complexity, it is worth noting to invest our resources (e.g., financial and technical
constraints) in a proportional way to create the best event possible (Senge, 2006).
The integrative framework of Kano‟s model and KE consists of four phases, and
is inspired by the work of Schütte et al. (2004) (see Figure 8-1).

Chapter 8 Integrating the effects of Kano model in Kansei Engineering
115
8.4.1 Initial phase
The first phase is to identify a service domain in which emotions and customer
satisfaction play a large role. One would then need to identify the target group of users to
survey.
8.4.2 Span the semantic space
Referring to what is discussed in Chapter 6.3, “spanning the semantic space” is
also known as affective processing. This consists of three activities. The first is the
collection of Kansei words. Due to the complexity of emotions interpretation, this study
uses the evaluation of words (spoken) as the sources of emotional impact on the human
mind (i.e., Kansei words). Words can describe emotions evoked by products or services
(Desmet, 2004). The second activity is the selection/structure of the Kansei words. The
purpose is to find high level Kansei words (the main category of Kansei words) that
represent the service domain in question. This step can be done either manually (using,
for example, affinity diagram or interview) or statistically (using, for example, factor
analysis). The third activity is the measurement of the importance and response of Kansei
words. This may be accomplished by using a 5-point semantic differential (SD) scale as
proposed by Osgood et al. (1957).
8.4.3 Span the service attributes space and the Kano model application
It is also known as cognitive processing (see Chapter 6.3). Three activities are
involved here. The first one is the collection of service attributes through technical
documents, comparisons of competing services, pertinent literature, experienced users,
related Kansei studies, concept studies, analysis of the usage of existing services and
related service groups (Schütte et al., 2008). A frequency analysis or Pareto diagram can

Chapter 8 Integrating the effects of Kano model in Kansei Engineering
116
be used for obtaining the most relevant service attributes. The second activity is that the
evaluation of current service quality that includes the measurement of importance,
expectation, perception and gap of the service attributes. In the third activity, the Kano
model is inserted. This is in order to give a better understanding of service attribute
performance. The Kano questionnaire is used to classify each of service attributes into
attractive, one-dimensional, must-be, indifferent, questionable or reverse.
8.4.4 Modeling and analysis
At this stage, the semantic space is linked with the service attributes space. The
selected Kansei words and the attractive service attributes (A) are met and linked
together. This can be facilitated by using multiple linear regression (Schütte, 2002) or
ordinal logistic regression (Lanzotti and Tarantino, 2008).
Afterwards, it proceeds to the analysis stage by engaging the significant models
only. Analysis is firstly done by checking for negative service gaps (i.e., a negative
difference between perceived and expected service quality mean values). For each
negative gap, it is then checked whether the number of affected Kansei words among
significant service attributes is the same. If it is the same, then the action is to choose
service attributes with the most negative service gap as the first priority for improvement.
Otherwise, we choose service attributes with the higher number of Kansei words.
Following the similar steps, if the gap is positive, then it also checks whether the number
of Kansei words among significant service attributes is the same. If it is the same, the
next step is to choose service attributes with the lower gap as the first priority for
enhancement/maintenance; otherwise, we choose service attributes with the higher
number of Kansei words.

Chapter 8 Integrating the effects of Kano model in Kansei Engineering
117
8.5 Empirical Study: A case in luxury hotel services
The selection of service domain, and the collection and selection of Kansei words
are discussed in Chapter 6.3. There are 16 and 15 Kansei words valid and reliable for
Singaporean and Indonesian subjects, respectively (see Chapter 7.5).
Figure 8-1 A proposed integrative framework of the Kano model and KE in services
Related to the “importance” scores of Kansei, “satisfaction” has the biggest mean
score ( = 4.26) and “happiness” has the lowest mean score ( = 3.95) for Indonesian.
Compared to Singaporean, they have “spaciousness” ( = 4.28) and “peacefulness” ( =
3.83) as the highest and lowest mean scores, respectively. Since all Kansei words have
importance scores above 3.75, all are assumed to be equally highly important.
For the “response” criterion, “welcomeness” and “happiness” have the greatest
mean scores, whereas “confidence and satisfaction” and “modernization” have the lowest

Chapter 8 Integrating the effects of Kano model in Kansei Engineering
118
scores for Indonesian and Singaporean, respectively. The descriptive statistics of each
Kansei word are reported in Table 8-2.
Table 8-2 Descriptive statistics of Kansei words Kansei word Indonesian Singaporean
Importance Response Importance Response
* s** Min Max s Min Max s Min Max s Min Max
Convenience 4.16 0.83 3 5 2.81 1.28 1 5 4.17 0.83 3 5 3.00 1.08 1 5
Attractiveness 4.09 0.82 3 5 2.84 1.29 1 5 4.11 0.83 3 5 2.80 1.04 1 5
Cleanliness 3.96 0.80 3 5 2.91 1.38 1 5 3.96 0.86 3 5 2.76 1.11 1 5
Welcomeness 3.98 0.84 3 5 3.01 1.19 1 5 3.99 0.83 3 5 2.85 0.98 1 5
Confidence 4.19 0.81 3 5 2.73 1.31 1 5 4.00 0.81 3 5 2.93 0.98 1 5
Happiness 3.95 0.79 3 5 2.77 1.26 1 5 3.85 0.87 3 5 3.09 1.15 1 5
Relaxedness 4.02 0.72 3 5 2.96 1.26 1 5 3.93 0.81 3 5 2.87 1.08 1 5
Peacefulness 4.01 0.78 3 5 2.93 1.33 1 5 3.83 0.78 3 5 2.93 1.00 1 5
Satisfaction 4.26 0.82 3 5 2.73 1.37 1 5 4.00 0.81 3 5 2.84 1.12 1 5
Spaciousness 4.14 0.83 3 5 2.90 1.28 1 5 4.28 0.78 3 5 2.91 1.04 1 5
Elegance 4.10 0.72 3 5 2.94 1.18 1 5 3.93 0.84 3 5 2.85 1.04 1 5
Friendliness 4.07 0.83 3 5 2.96 1.28 1 5 3.92 0.73 3 5 2.81 0.98 1 5
Modernization 4.12 0.78 3 5 2.89 1.18 1 5 4.03 0.84 3 5 2.71 1.04 1 5
Relief N/A 3.95 0.79 3 5 2.88 1.11 1 5
Quietness 3.99 0.80 3 5 3.19 1.28 1 5 3.97 0.82 3 5 3.16 0.84 1 5
Grand mean 4.08 2.88 3.99 2.89
* = mean;** s = standard deviation
8.5.1 Collection and evaluation of service attributes incorporated the Kano model
How to collect and evaluate the service attributes is discussed in Chapter 6.3.
Respondents were asked to rate the importance, expectation and perception of the hotel
services with respect to the 39 service quality items using a five-point Likert scale.
Validity and reliability tests for service attributes have been done and reported (see
Chapter 7.4).
The Kano questionnaire was used to rate the service attributes performance. In
each of service attributes a pair of questions is formulated to which the customer should
answer in one of five different ways. The first question deals with the response of the
customer due to the availability of services, whereas the second question concerns his/her
reaction due to the absence of services (see Figure 8-2). Those questions describe the
provision and non-provision of the benefits to be expected through the provision of a
service or product attribute (Mikulic and Prebezac, 2011).

Chapter 8 Integrating the effects of Kano model in Kansei Engineering
119
The Kano questions utilized the 39 service quality items as the representative of
the voice of customer (Sauerwein et al., 1996). After having combined all answers from
the participants to each functional and dysfunctional question, the results of each service
attribute are listed. Thereafter, the evaluation and interpretation of Kano category was
done by using a frequency analysis (Sauerwein et al., 1996). A frequency analysis is the
easiest and the most common method to evaluate and interpret which Kano category falls
under a certain service attribute. The descriptive statistics are provided (see Tables 8-3
and 8-4).
Figure 8-2Kano evaluation process
Table 8-3 An overview of recapitulation of Kano result (unit in frequency
percentage)
Service attribute A O M I R Q Total Category
Singaporean
SQA7.The shops are attractive 15.00 36.67 20.00 28.33 0 0 100 O
SQA8.The hotel‟s lobby is comfortable 18.33 13.33 25.00 43.33 0 0 100 I
SQA9.The bedroom and bathroom are clean and convenient 36.67 15.00 15.00 33.33 0 0 100 A
…
Indonesian
SQA1.The receptionist and information desk is visually
appealing
22.95 39.35 18.03 19.67 0 0 100 O
SQA2.The employees‟ uniforms are clean, nice, and neat 29.51 32.79 19.67 18.03 0 0 100 O
SQA3.The hotel has modern-looking equipment 21.31 26.23 32.79 19.67 0 0 100 M
…

Chapter 8 Integrating the effects of Kano model in Kansei Engineering
120
Table 8-4 Descriptive statistics of service quality incorporated with Kano category Service attribute Indonesian Singaporean
I* E** P# Gap
## Cat+ I E P Gap Cat
TANGIBLE
SQA1.The receptionist and information desk is visually appealing 4.00 4.22 3.46 -0.76 O 4.03 4.31 3.40 -0.91 A
SQA2.The employees‟ uniforms are clean, nice, and neat 3.86 4.32 3.40 -0.92 O 3.95 4.17 3.37 -0.80 O
SQA3.The hotel has modern-looking equipment 3.98 4.33 3.22 -1.11 M 4.16 4.31 3.23 -1.08 I
SQA4.The hotel‟s interior and exterior are well managed & maintained 4.21 4.25 3.40 -0.85 I 4.04 4.13 3.13 -1.00 M
SQA5.The outdoor environment is visually clean 4.08 4.38 3.60 -0.78 O 3.97 4.33 3.23 -1.10 I
SQA6.The atmosphere of restaurant is inviting appetite 3.93 4.36 3.41 -0.95 I 3.89 4.25 3.35 -0.90 M
SQA7.The shops are attractive 3.94 4.19 3.40 -0.79 A 4.07 4.28 3.24 -1.04 O
SQA8.The hotel‟s lobby is comfortable 4.15 4.10 3.43 -0.67 A 3.97 4.13 3.51 -0.62 I
SQA9.The bedroom and bathroom are clean and convenient 4.25 4.31 3.37 -0.94 M 4.04 4.15 3.43 -0.72 A
SQA10.The hotel is well lighted 3.96 4.17 3.44 -0.73 I 3.99 4.40 3.25 -1.15 M
SQA11.The sports facilities are well maintained, clean, and convenient 4.10 4.25 3.40 -0.85 M 4.07 4.29 3.24 -1.05 I
SQA12.The music in hotel‟s lobby is soft and nice 4.10 4.36 3.41 -0.95 M 4.03 4.28 3.31 -0.97 M
SQA13.The scent in hotel‟s room and lobby is refreshing 4.01 4.31 3.41 -0.90 A 4.09 4.33 3.31 -1.02 O
SQA14.The meals served at the hotel are delicious 3.91 4.32 3.31 -1.01 I 4.00 4.31 3.27 -1.04 I
Mean score -0.87 -0.95
RELIABILITY
SQB1.Your hotel reservation is handled efficiently and effectively 4.09 4.10 3.42 -0.68 M 4.03 4.21 3.41 -0.80 A
SQB2.Your booked guestroom is ready as promised 4.05 4.31 3.43 -0.88 O 4.12 4.31 3.23 -1.08 M
SQB3.The bill is charged accurately 3.94 4.19 3.41 -0.78 A 3.97 4.29 3.19 -1.10 I
SQB4.All size of servings are given correctly the first time 4.05 4.27 3.38 -0.89 A 4.16 4.31 3.29 -1.02 M
SQB5.The employees show a sincere interest in solving your problem 4.00 4.28 3.31 -0.97 A 4.11 4.21 3.28 -0.93 A
SQB6.The hotel insists on error-free records 3.89 4.32 3.52 -0.80 I 4.00 4.24 3.49 -0.75 M
SQB7.AC, TV, radio, lights, mini bar, & other equipment work properly
4.08 4.35 3.46 -0.89 O 3.96 4.24 3.29 -0.95 O
SQB8.Overall, you got what you paid for 4.26 4.19 3.22 -0.97 M 3.97 4.23 3.41 -0.82 M
Mean score -0.86 -0.93
RESPONSIVENESS
SQC1.The employees tell you exactly when services will be performed 4.14 4.14 3.17 -0.97 I 3.99 4.09 3.47 -0.62 I
SQC2.The employees give you prompt service 4.05 4.25 3.31 -0.94 M 3.93 4.13 3.20 -0.93 A
SQC3.The employees are always willing to help you 4.13 4.14 3.37 -0.77 A 3.97 4.23 3.45 -0.78 A
SQC4.The employees are never too busy to respond to your requests 4.04 4.26 3.22 -1.04 A 4.07 4.19 3.31 -0.88 A
SQC5.Informative literature about the hotel facilities is provided 4.04 4.15 3.35 -0.80 A 4.08 4.31 3.17 -1.14 I
Mean score -0.90 -0.87
ASSURANCE
SQD1.The employees have knowledge in answering your enquiries 4.16 4.30 3.53 -0.77 O 3.99 4.17 3.21 -0.96 A
SQD2.The behavior of employees instills confidence in you 3.90 4.12 3.58 -0.54 I 3.87 4.20 3.32 -0.88 M
SQD3.The employees know well about local places of interest 4.04 4.20 3.33 -0.87 A 4.03 4.12 3.41 -0.71 A
SQD4.The hotel provides a safe environment 4.00 4.32 3.51 -0.81 O 4.03 4.23 3.33 -0.90 M
SQD5.The employees are consistently courteous with you 4.06 4.23 3.22 -1.01 M 3.91 4.19 3.40 -0.79 O
SQD6.The staff explains clearly charges on your account 4.06 4.33 3.47 -0.86 O 4.13 4.16 3.48 -0.68 M
Mean score -0.81 -0.81
EMPATHY
SQE1.The employees are helpful, friendly, and respectful 4.11 4.27 3.31 -0.96 M 4.01 4.32 3.33 -0.99 M
SQE2.The hotel gives you individual full attention 4.09 4.06 3.43 -0.63 A 4.17 4.13 3.40 -0.73 A
SQE3.The hotel has employees who give you personal attention 4.04 4.14 3.49 -0.65 A 3.95 4.23 3.33 -0.90 A
SQE4.The employees understand your specific needs 4.10 4.27 3.40 -0.87 I 4.19 4.17 3.16 -1.01 O
SQE5.The hotel has your best interests at heart 4.01 4.14 3.28 -0.86 O 3.91 4.31 3.29 -1.02 M
SQE6.The hotel has operating hours convenient to you 4.13 4.20 3.31 -0.89 A 3.99 4.20 3.45 -0.75 M
Mean score -0.81 -0.90
GRAND MEAN 4.24 3.39 -0.85 4.23 3.32 -0.91
*I = importance; **E = expectation; #P = perception; ##Gap = perception – expectation; +Cat = Kano category
It shows that the customers have high expectation where all service quality items
receive mean score above 4 (see the „expectation‟ column, in Table 8-4). The highest
mean scores are 4.38 for an item “the outdoor environment is visually clean” and 4.40 for

Chapter 8 Integrating the effects of Kano model in Kansei Engineering
121
an item “the hotel is well lighted” in Indonesian and Singaporean, respectively. Both are
classified in “tangible” dimension. At the customer perception, the highest mean score for
Indonesian is 3.60 (i.e., “the outdoor environment is visually clean”), whereas for
Singaporean is 3.51 (i.e., “the hotel‟s lobby is comfortable”). The findings also show that
the customers tend to have low perception on “responsiveness” dimension. Overall, their
expectation is greater than their perception.
Regarding Kano‟s categorization, the result shows that up to 30 percent of the
service attributes are categorized as attractive quality (A), i.e., 13 out of 39 for
Indonesians and 11 out of 37 for Singaporeans.
At Indonesian group, there are three items categorized as attractive quality (A)
within “reliability” dimension. They discusss and share a common issue, i.e., correctness
and sureness. Since most of tourists were on vacation, it is highly understood that they
need a secure and certain place and surrounding. Reliability is able to give the customers
great surprise, positive impression and sense of complete delight. This condition is
supported by the Herzberg principle of responsibility and recognition motivator, i.e.,
increasing the accountability of individuals for own work. It implies that employees‟
accountability has a positive impact on customer emotions. Hence, most of items in
“reliability” dimension are categorized as attractive attribute.
8.5.2 Model fitting: link and evaluation
The perceived service quality and Kansei responses are met, linked and analyzed
by using stepwise linear regression (Efroymson, 1960). This method has an automatic
procedure in cases where there are a large number of potential independent/explanatory

Chapter 8 Integrating the effects of Kano model in Kansei Engineering
122
variables. In this study, there are 37 and 39 service attributes and no underlying theory on
which to base the model selection.
Basically, at each iteration process of stepwise linear regression, after a new
independent variable is added in the model, a test will be made to check whether if other
variables can be deleted without increasing the residual sum of squares (RSS).
Afterwards, it will be terminated when the measure is locally maximized (Efroymson,
1960).
In each model, the five-scale Likert based scores given by respondents to each
Kansei word (i.e., Kansei response scores) and perceived service attribute are used as
dependent and independent variables, respectively. The data are then analyzed by SPSS®
version 13 for Windows. The statistical output is presented (see Table 8-4).
The most significant model is for Kansei words “welcomeness” (p-value ≤ 0, R2 =
0.293) and “cleanliness” (p-value ≤ 0, R2 = 0.277) for Indonesian and Singaporean,
respectively. By observing the model coefficients, in Indonesian group, it is concluded
that the service attribute “the employees are consistently courteous with you” (coefficient
= 0.599) has a slightly greater effect on the Kansei word “welcomeness” than other
Kansei words. Whereas, in Singaporean group, the attribute “the bedroom and bathroom
are clean and convenient” is shown to have a greater effect on the Kansei “cleanliness”
(coefficient = 0.348).
Table 8-5 Significant regression model for each Kansei word Kansei word Indonesian Singaporean
Linear model p R2 Linear model p R2
Convenience (K1) K1 = 1.542+0.368SQA1 0.003 0.104 K1 = 1.285+0.261SQC4+0.25SQA1 0.000 0.197
Attractiveness (K2) K2 = 1.583+0.373SQC3 0.002 0.120 K2 = 1.791+0.296SQD3 0.003 0.112
Cleanliness (K3) K3 = 1.618+0.38SQA12 0.005 0.094 K3 = 0.762+0.348SQA9+0.241SQE3 0.000 0.277
Welcomeness (K4) K4 = 2.23+0.599SQD5-
0.329SQD1+0.339SQA11-
0.343SQE1
0.000 0.293 K4 = 1.868+0.285SQC3 0.002 0.112
Confidence (K5) K5 = 1.674+0.406SQB5-
0.386SQD1+0.326SQB1
0.000 0.237 K5 = 1.887+0.353SQD3 0.002 0.130

Chapter 8 Integrating the effects of Kano model in Kansei Engineering
123
Happiness (K6) K6 = 1.6+0.331SQA13 0.009 0.084 K6 = 2.034+0.272SQC4 0.002 0.121
Relaxedness (K7) K7 = 1.575+0.361SQD2+
0.412SQC4-0.352SQE3
0.000 0.242 K7 = 1.176+0.32SQC2+0.201SQC4 0.000 0.232
Peacefulness (K8) K8 = 1.749+0.634SQC4-
0.375SQB3+0.435SQA5-
0.359SQA3
0.000 0.288 K8 = 1.821+0.325SQA9 0.000 0.162
Satisfaction (K9) K9 = 1.84+0.557SQB5-
0.297SQA3
0.001 0.159 K9 = 0.95+0.312SQC2+0.277SQD1 0.000 0.263
Spaciousness (K10) K10 = 1.433+0.407SQA5 0.001 0.121 K10 = 1.47+0.239SQD1+0.196SQE2 0.000 0.194
Elegance (K11) N/A K11 = 2.113+0.216SQA9 0.025 0.067
Friendliness (K12) K12 = 1.822+0.345SQB5 0.006 0.092 K12 = 1.409+0.224SQD1+0.201SQA1 0.002 0.163
Modernization (K13) K13 = 1.953+0.271SQA1 0.021 0.066 K13 = 1.676+0.301SQA9 0.001 0.130
Relief (K14) K14 = 1.468+0.354SQA1 0.010 0.082 K14 = 0.999+0.303SQE2+0.258SQC4 0.000 0.219
Quietness (K15) K15 = 2.195+0.292SQA2 0.030 0.058 K15 = 2.2+0.3SQC2 0.000 0.194
Passionate (K16) N/A K16 = 0.515+0.314SQC4+0.253SQA9+
0.25SQC2-0.312SQB2+0.215SQB7
0.000 0.372
8.5.3 Analysis of action
This refers to the reverse of the significant models, to see the extent to which
service attribute influences particular emotions/Kansei. By referring to the significant
models (see Table 8-4), the reversed models are provided (see Table 8-5).
Table 8-6 The significant relationship between service attribute and Kansei word
along with prioritized continuous improvement Significant service attribute with A category Related significant Kansei word* Gap** Priority
INDONESIAN SAMPLE
SQA7.The shops are attractive - -0.79
SQA8.The hotel‟s lobby is comfortable - -0.67
SQA13.The scent in hotel‟s room and lobby is refreshing Happiness -0.9 3
SQB3.The bill is charged accurately Peacefulness -0.78
SQB4.All size of servings are given correctly the first time - -0.89
SQB5.The employees show a sincere interest in solving your problem Confidence, friendliness -0.97 2
SQC3.The employees are always willing to help you Attractiveness -0.77 4
SQC4.The employees are never too busy to respond to your requests Relaxedness, peacefulness -1.04 1
SQC5.Informative literature about the hotel facilities is provided - -0.8
SQD3.The employees know well about local places of interest - -0.87
SQE2.The hotel gives you individual full attention - -0.63
SQE3.The hotel has employees who give you personal attention Relaxedness -0.65
SQE6.The hotel has operating hours convenient to you - -0.89
SINGAPOREAN SAMPLE
SQA1. The receptionist and information desk is visually appealing Convenience, friendliness -0.91 5
SQA9. The bedroom and bathroom are clean and convenient Cleanliness, peacefulness,
passion, elegance, modernization
-0.72 2
SQB1. Your hotel reservation is handled efficiently and effectively - -0.8
SQB5. The employees show a sincere interest in solving your problem - -0.93
SQC2. The employees give you prompt service Relaxedness, passion,
satisfaction, quietness
-0.93 3
SQC3. The employees are always willing to help you Welcomeness -0.77 9
SQC4. The employees are never too busy to respond to your requests Convenience, happiness,
relaxedness, passion, relief
-0.88 1
SQD1. The employees have knowledge in answering your enquiries Satisfaction, spaciousness,
friendliness
-0.96 4
SQD3. The employees know well about local places of interest Attractiveness, confidence -0.71 7

Chapter 8 Integrating the effects of Kano model in Kansei Engineering
124
SQE2. The hotel gives you individual full attention Spaciousness, relief -0.73 6
SQE3. The hotel has employees who give you personal attention Cleanliness -0.89 8 *Kansei words with italic texts have significant negative relationship with service attributes; ** Gap = perception score – expectation score
By engaging the attractive service attributes (A) only and taking into account the
service gap, the next step is to decide an action whether to proceed with continuous
improvement or enhancement/maintenance. There are six (in Indonesian) and nine (in
Singaporean) attractive service attributes (A) having the significant relationship with
several Kansei words (see Table 8-5). It shows that the “reliability” dimension is the
common attractive attributes in both sample groups. There are two common items (SQC3
and SQC4) correlated significantly with some Kansei words.
Since all service gaps are negative, the proposed actions are directed to the
prioritized continuous improvement (see the „priority‟ column, in Table 8-5). Both
groups share the same significant service attribute to take care of as the first priority, i.e.
“the employees are never too busy to respond your requests”. This service item is
significantly related to two Kansei words (in Indonesian group) and five Kansei words (in
Singaporean group). Relaxedness seems to be a common emotional need on two
population groups.
8.6 Discussion and implication
The Kano model helps to identify different categories of service attribute quality.
The Attractive (A) category is of interest to fulfill customer emotional needs/Kansei and
to maximize customer overall satisfaction. This is the service quality category which
neither taken for granted nor expressed by the customers. Consequently, service attributes
with attractive category (A) are chosen to be the main focus for modeling and analysis in
this chapter.

Chapter 8 Integrating the effects of Kano model in Kansei Engineering
125
The other two common Kano categories (i.e., one-dimensional [O] and must-be
[M]) are considered as primary features to be satisfied on a regular basis. According to
Maslow (1943), one-dimensional and must-be qualities are positioned below the self-
actualization level. These two qualities are mostly covered in the hygiene factors
(Herzberg, 1968). Yang (2011) argues that these qualities are less sensitive and
satisfaction-driving attributes, apart from delight-driving attributes. As a consequence,
these attributes are unlikely to be associated with a strong emotion such as delight. Thus,
they are regarded as compulsory qualities to be well performed in daily basis.
The integrative framework of the Kano model and KE has been proposed and
tested through an empirical study on luxury hotel services. This study postulates that the
perceived service attributes/qualities impact on emotions/Kansei response. This
proposition is significantly supported. By using stepwise linear regression, what
emotions/Kansei words elicited and impacted by particular perceived service attributes
are investigated, modeled and evaluated. It explains that a certain Kansei word is
significantly influenced by one or more service attributes. In other words, a service
attribute may have impact on one or more Kansei words. The more the Kansei words are
significantly influenced, the more important is the services attribute.
As a practical implication, this study gives a useful insight to the service
designers. This study helps them identify what efforts in terms of continuous
improvement or enhancement/maintenance should be directed toward the attractive
attributes (A) which have significant impact on Kansei words. According to the research
findings, the attribute “the employees are never too busy to respond to your requests”
should be given the first priority for continuous improvement. Intensive regular training

Chapter 8 Integrating the effects of Kano model in Kansei Engineering
126
in areas such as character building, leaderships, communication skills and customer focus
are encouraged. In addition, the hotel management should assure a sufficient number of
staffs and employees equipped with relevant knowledge and professionalism. In order to
be customer conscious, a campaign slogan (such as „always there for customer‟) may be
useful for daily awareness to all hotel staffs and employees.
Totally, as for Indonesian, there are four prioritized service attributes to be taken
care of by the hotel service providers. Two service attributes are neglected for
prioritization of improvement (i.e. “the bill is charged accurately” and “the hotel has
employees who give you personal attention”) since they have negative relationships with
particular Kansei words. As for Singaporean, it shows that there are nine prioritized
service attributes discussed (see Table 8-5).
8.7 Conclusion
The trends of the 21st century are hedonism and pleasure. Delighting customers is
an essential key for achieving customer retention and total emotional satisfaction. It
requires a positive surprise of customers beyond their expectation. Kansei Engineering
(KE) shows its ability to deal with customer emotional needs. This method is able to
capture and translate those emotional needs and to build a mathematical model that
represents the relationships between emotions and product elements/service attributes.
Traditional KE methodology has been applied intensively and successfully in
product design and development. As quality control has been introduced in the service
industry, it is a great opportunity to apply KE to services. This newly KE applied in
hospitality services is called Kansei Quality Management (KQM) (Nagamachi and
Lokman, 2011).

Chapter 8 Integrating the effects of Kano model in Kansei Engineering
127
As reviewed, recent research in KE lacks of relationship between product/service
performance and customer emotional needs/Kansei. This chapter presents and discusses
an integrative framework of the Kano model and KE. It promotes the Kano model
incorporated into the systematic KE methodology with a focus on delighting quality of
service attribute only. An attractive attribute is found to have the greatest influence on
customer Kansei. In addition, it is the first step of prioritization of service quality
improvement with regard to limited resources (e.g., budget, time, workforce and other
technical reasons).
Since the domain of this study is luxury hotels which having potential impacts on
customer feelings, appropriate strategies should be applied to win the business
competition. They include how to always stand out and focus on attractive requirements
and fulfill all basic/must-be and proportional/one-dimensional requirements in regular
basis.
Essentially, KQM focuses on something beyond usability and functionality, thus,
it fits the attractive attributes which are neither explicitly expressed nor expected by the
customer. Therefore, business mindset should be directed to delight and excite the
customers immediately. In other words, the focus for improvement should be not only on
minimizing dissatisfaction, but also on customer loyalty and total satisfaction. The
categorization of service attributes incorporated in the proposed integrative framework
offer competitive benefits in terms of prioritized improvement and efficiency.
This chapter provides a theoretical contribution to the academic literature on
Kansei ergonomics, service science and quality management by proposing an integrated
conceptual framework and methodology of KE and the Kano model. A case study that

Chapter 8 Integrating the effects of Kano model in Kansei Engineering
128
involving two different groups of tourist (Indonesian and Singaporean) was conducted.
The objective was to show that Kansei may be influenced by cultural differences.
In addition, a practical contribution is presented by giving a guideline for service
managers in investigating which service attributes are significantly sensitive to customer
delights and given a priority for improvement or maintenance. Its practical potential
benefits and impacts can be large as service is the fastest growing sector in today‟s
businesses.

Chapter 9 Using Markov chain model to analyze future customer preferences
129
9 Using Markov chain model to analyze future customer preferences
This chapter discusses how Markov chain model is used to analyze customer preference
(i.e., the importance rating of service attribute) from probabilities viewpoints. Both initial
and transition probabilities are computed based on the data collected using the third
questionnaire (i.e., a survey on the past and present customer preference).
9.1 Introduction
Traditional approach of product and service designs has focused on present
customer needs. However, in order to compete effectively in the long-term period a
company should take into account future customer needs as well. Future voice of
customer (VOC) may enable companies to provide better services and products so that
they can delight customers effectively (Wu and Shieh, 2006).
Currently there is no specific method used to predict future customer needs in
hotel services. Practically, the use of Markov chain can provide valuable information for
manager/decision maker to understand how the dynamics of customer needs (i.e., service
attributes) as time goes by from a probability viewpoint. According to Wu and Shieh
(2006), the advantage of this approach is that the collected information in a daily basis is
relatively uncertain, thus, by using a Markov chain model might be more appropriate to
analyze customer needs and investigate the importance trends of technical measures from
a probabilities viewpoint. This approach is quite flexible since if new customers‟ surveys
are conducted to have most updated information, new transition probabilities can be
computed and available promptly. Potentially, the survey by using this approach can be
linked to the dynamics of customer Kansei and preference. Kansei and customer

Chapter 9 Using Markov chain model to analyze future customer preferences
130
preference as measured tend to be short lived. Hence, Kansei should be captured and
utilized as quickly as possible under the best possible condition during product and
service experiences (Schütte et al., 2004).
With respect to predicting future customer needs, Shen et al. (2001) have
developed fuzzy trend analysis to analyse future customer needs by monitoring the
importance trend for each customer requirement. Its application may not mainly for
customer needs in hotel services. The scope of this method covers five dimensions of
preference importance, such as significant increase of importance, moderate increase of
importance, small increase or decrease of importance, moderate decrease of importance
and significant decrease of importance. However, their work has no further discussion on
how this proposed method could be integrated with other possible potential methods (Wu
and Shieh, 2006). Another proposed method that be used to predict future customer
preference is that grey theory (Wu et al., 2005). This method is to analyze customer
needs in the HOQ when a very small amount of data is used. It has basic assumption of
deterministic and precise data. Indirectly, CRM systems may provide database of
customer transaction such that behavioral customer loyalty can be predicted (Stringfellow
et al., 2004). This CRM method can be proposed to understand and predict the dynamics
of customers‟ emotional needs/Kansei since the understanding of customers‟ emotional
needs is vital for predicting and influencing their purchasing behavior (Tehrani, 2002).
The challenge of this Markov chain approach may relate to the available time to
conduct survey. According to Wu and Shieh (2006), when the surveyor needs to update
customer preference dynamics, he/she needs to prepare another set of surveys with a new

Chapter 9 Using Markov chain model to analyze future customer preferences
131
set of customer group. Surely, as a result, this approach provides a decision maker to
analyse and then satisfy both present and future customer needs.
Study on future VOC has been done by several scholars, such as developing fuzzy
trend analysis (Shen et al., 2000) and applying grey theory to analyze VOC combined
with HOQ (Wu et al., 2005). Their studies have been extended by Wu and Shieh (2006)
incorporating Markov chain in the HOQ.
The use of Markov chain in this study is to analyze customer needs (VOC) from a
probability viewpoint due to uncertain information in daily basis. By using Markov chain,
the importance of customer requirements can be further adjusted based on the newly
information to better monitor the dynamics of customer needs (Wu and Shieh, 2006).
9.2 The Markov chain model in customer preference
This model is useful for monitoring the evolution of systems over repeated trials
where the state of a system in any particular period is uncertain. The Markov process
assumes that a system starts in an initial state, but the initial state will change over time.
A special model of Markov process, Markov chain, is then used to study the short- and
long-run behaviors of certain stochastic systems (Taha, 1997).
Markov chain is a model with a regular transition probability matrix. It is
introduced as a model of customers‟ performances and preferences in the long-term
period or steady-state such that a better strategy can be made based upon the most
updated customers‟ surveys.
In order to promote the long-term behavior of a system like customers‟
preferences to certain services, a limiting distribution and a stationary distribution are
used. Let define n step transition probability n
ijP to be the process in state i (e.g.,
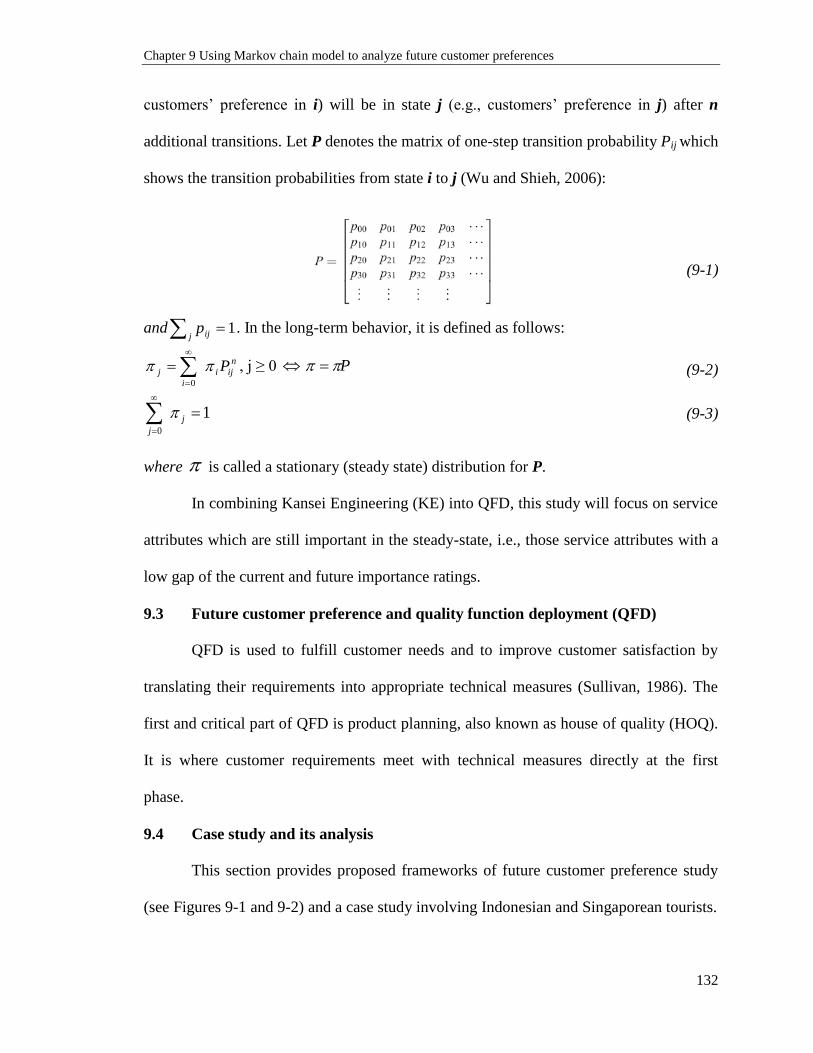
Chapter 9 Using Markov chain model to analyze future customer preferences
132
customers‟ preference in i) will be in state j (e.g., customers‟ preference in j) after n
additional transitions. Let P denotes the matrix of one-step transition probability Pij which
shows the transition probabilities from state i to j (Wu and Shieh, 2006):
(9-1)
and j ijp 1. In the long-term behavior, it is defined as follows:
n
iji
i
j P
0
, j ≥ 0 P (9-2)
10
j
j
(9-3)
where is called a stationary (steady state) distribution for P.
In combining Kansei Engineering (KE) into QFD, this study will focus on service
attributes which are still important in the steady-state, i.e., those service attributes with a
low gap of the current and future importance ratings.
9.3 Future customer preference and quality function deployment (QFD)
QFD is used to fulfill customer needs and to improve customer satisfaction by
translating their requirements into appropriate technical measures (Sullivan, 1986). The
first and critical part of QFD is product planning, also known as house of quality (HOQ).
It is where customer requirements meet with technical measures directly at the first
phase.
9.4 Case study and its analysis
This section provides proposed frameworks of future customer preference study
(see Figures 9-1 and 9-2) and a case study involving Indonesian and Singaporean tourists.

Chapter 9 Using Markov chain model to analyze future customer preferences
133
Figure 9-1 Dynamics of customer needs/service attributes
9.4.1 Initial and transition probabilities
Given thirty nine service attributes/items (denoted as SQA1, SQA2 … SQE6, see
Appendix F), the potential participants were asked to evaluate the importance of each
service attribute. This shows how each item will be changed in the near future by a
survey.
According to Wu and Shieh (2006), the importance/preference level is classified
into high (H) with a weight of 5, medium (M) with a weight of 3 and low (L) with a
weight of 1. The initial probability is determined by the past choice of customer
preference, while the transition/conditional probability is derived from both the past and
present customer preferences. For an illustration, given that ni = the number of times that
the choice is in state i, and nij = the number of transitions from state i to state j, then
estimate the transition probability (pij) by ij = nij / ni and the initial probability by i

Chapter 9 Using Markov chain model to analyze future customer preferences
134
= ni / i. The initial and transition probabilities, and the initial expected importance
weight for each service attribute are provided (see Table 9-1).
Figure 9-1 Integrative framework of future customer preference study
Table 9-1 The initial and conditional probabilities of service attribute
Item
Initial exp. weight
Initial prob. Conditional prob.*
Indo Sin Indo Sin Indo Sin
SQA1 3.21 2.83
P(H)=0.23 P(H)=0.2 P(H|H)=0.13 P(M|H)=0.74 P(L|H)=0.13 P(H|H)=0 P(M|H)=0.83 P(L|H)=0.17
P(M)=0.64 P(M)=0.51 P(H|M)=0.35 P(M|M)=0.53 P(L|M)=0.12 P(H|M)=0.29 P(M|M)=0.57 P(L|M)=0.14
P(L)=0.13 P(L)=0.29 P(H|L)=0.5 P(M|L)=0.25 P(L|L)=0.25 P(H|L)=0.4 P(M|L)=0.4 P(L|L)=0.2
SQA2 3.77 3.23
P(H)=0.54 P(H)=0.37 P(H|H)=0.38 P(M|H)=0.38 P(L|H)=0.24 P(H|H)=0.25 P(M|H)=0.33 P(L|H)=0.42
P(M)=0.31 P(M)=0.37 P(H|M)=0.13 P(M|M)=0.62 P(L|M)=0.25 P(H|M)=0.43 P(M|M)=0.43 P(L|M)=0.14
P(L)=0.15 P(L)=0.26 P(H|L)=0.2 P(M|L)=0.2 P(L|L)=0.6 P(H|L)=0.17 P(M|L)=0.66 P(L|L)=0.17
SQA3 3.26 3.43
P(H)=0.28 P(H)=0.34 P(H|H)=0.38 P(M|H)=0.38 P(L|H)=0.24 P(H|H)=0.44 P(M|H)=0.33 P(L|H)=0.23
P(M)=0.56 P(M)=0.52 P(H|M)=0.29 P(M|M)=0.53 P(L|M)=0.18 P(H|M)=0.33 P(M|M)=0.5 P(L|M)=0.17
P(L)=0.15 P(L)=0.14 P(H|L)=0.25 P(M|L)=0.75 P(L|L)=0 P(H|L)=0 P(M|L)=1 P(L|L)=0
SQA4 3.36 3.29
P(H)=0.31 P(H)=0.31 P(H|H)=0.67 P(M|H)=0.33 P(L|H)=0 P(H|H)=0.4 P(M|H)=0.6 P(L|H)=0
P(M)=0.56 P(M)=0.51 P(H|M)=0.43 P(M|M)=0.38 P(L|M)=0.19 P(H|M)=0.38 P(M|M)=0.31 P(L|M)=0.31
P(L)=0.13 P(L)=0.17 P(H|L)=0 P(M|L)=0.5 P(L|L)=0.5 P(H|L)=0 P(M|L)=1 P(L|L)=0
SQA5 3.51 3.17 P(H)=0.41 P(H)=0.2 P(H|H)=0.55 P(M|H)=0.36 P(L|H)=0.09 P(H|H)=0.5 P(M|H)=0.33 P(L|H)=0.17

Chapter 9 Using Markov chain model to analyze future customer preferences
135
P(M)=0.44 P(M)=0.69 P(H|M)=0.36 P(M|M)=0.5 P(L|M)=0.14 P(H|M)=0.35 P(M|M)=0.47 P(L|M)=0.18
P(L)=0.15 P(L)=0.11 P(H|L)=0.25 P(M|L)=0.5 P(L|L)=0.25 P(H|L)=0 P(M|L)=1 P(L|L)=0
SQA6 3.56 3.11
P(H)=0.46 P(H)=0.31 P(H|H)=0.38 P(M|H)=0.62 P(L|H)=0 P(H|H)=0.57 P(M|H)=0.43 P(L|H)=0
P(M)=0.36 P(M)=0.43 P(H|M)=0.45 P(M|M)=0.55 P(L|M)=0 P(H|M)=0.31 P(M|M)=0.69 P(L|M)=0
P(L)=0.18 P(L)=0.26 P(H|L)=0.4 P(M|L)=0.4 P(L|L)=0.2 P(H|L)=0.2 P(M|L)=0.6 P(L|L)=0.2
SQA7 3.21 2.89
P(H)=0.33 P(H)=0.2 P(H|H)=0.22 P(M|H)=0.56 P(L|H)=0.22 P(H|H)=0.2 P(M|H)=0.4 P(L|H)=0.4
P(M)=0.44 P(M)=0.54 P(H|M)=0.38 P(M|M)=0.54 P(L|M)=0.08 P(H|M)=0.43 P(M|M)=0.5 P(L|M)=0.07
P(L)=0.23 P(L)=0.26 P(H|L)=0.57 P(M|L)=0.29 P(L|L)=0.14 P(H|L)=0.33 P(M|L)=0.67 P(L|L)=0
SQA8 3.67 3.11
P(H)=0.49 P(H)=0.29 P(H|H)=0.5 P(M|H)=0.36 P(L|H)=0.14 P(H|H)=0.33 P(M|H)=0.56 P(L|H)=0.11
P(M)=0.36 P(M)=0.49 P(H|M)=0.6 P(M|M)=0.4 P(L|M)=0 P(H|M)=0.4 P(M|M)=0.5 P(L|M)=0.1
P(L)=0.15 P(L)=0.22 P(H|L)=0.2 P(M|L)=0.6 P(L|L)=0.2 P(H|L)=0.5 P(M|L)=0.33 P(L|L)=0.17
SQA9 3.77 3.40
P(H)=0.54 P(H)=0.4 P(H|H)=0.46 P(M|H)=0.46 P(L|H)=0.08 P(H|H)=0.25 P(M|H)=0.5 P(L|H)=0.25
P(M)=0.31 P(M)=0.4 P(H|M)=0.18 P(M|M)=0.55 P(L|M)=0.27 P(H|M)=0.18 P(M|M)=0.64 P(L|M)=0.18
P(L)=0.15 P(L)=0.2 P(H|L)=0.2 P(M|L)=0.6 P(L|L)=0.2 P(H|L)=0.33 P(M|L)=0.67 P(L|L)=0
SQA10 3.31 3.11
P(H)=0.31 P(H)=0.31 P(H|H)=0.11 P(M|H)=0.56 P(L|H)=0.33 P(H|H)=0.1 P(M|H)=0.6 P(L|H)=0.3
P(M)=0.54 P(M)=0.43 P(H|M)=0.27 P(M|M)=0.6 P(L|M)=0.13 P(H|M)=0.33 P(M|M)=0.56 P(L|M)=0.11
P(L)=0.15 P(L)=0.26 P(H|L)=0.6 P(M|L)=0 P(L|L)=0.4 P(H|L)=0.5 P(M|L)=0.5 P(L|L)=0
SQA11 3.21 3.29
P(H)=0.31 P(H)=0.34 P(H|H)=0.44 P(M|H)=0.33 P(L|H)=0.23 P(H|H)=0.2 P(M|H)=0.6 P(L|H)=0.2
P(M)=0.49 P(M)=0.46 P(H|M)=0.31 P(M|M)=0.54 P(L|M)=0.15 P(H|M)=0.44 P(M|M)=0.44 P(L|M)=0.12
P(L)=0.21 P(L)=0.2 P(H|L)=0.14 P(M|L)=0.43 P(L|L)=0.43 P(H|L)=0.17 P(M|L)=0.33 P(L|L)=0.5
SQA12 3.36 3.57
P(H)=0.31 P(H)=0.43 P(H|H)=0.33 P(M|H)=0.33 P(L|H)=0.33 P(H|H)=0.27 P(M|H)=0.55 P(L|H)=0.18
P(M)=0.56 P(M)=0.43 P(H|M)=0.33 P(M|M)=0.56 P(L|M)=0.11 P(H|M)=0.4 P(M|M)=0.3 P(L|M)=0.3
P(L)=0.13 P(L)=0.14 P(H|L)=0.2 P(M|L)=0.4 P(L|L)=0.4 P(H|L)=0 P(M|L)=0.5 P(L|L)=0.5
SQA13 3.36 3.8
P(H)=0.33 P(H)=0.49 P(H|H)=0.56 P(M|H)=0.44 P(L|H)=0 P(H|H)=0.18 P(M|H)=0.73 P(L|H)=0.09
P(M)=0.51 P(M)=0.43 P(H|M)=0.2 P(M|M)=0.6 P(L|M)=0.2 P(H|M)=0.09 P(M|M)=0.55 P(L|M)=0.36
P(L)=0.15 P(L)=0.08 P(H|L)=0 P(M|L)=0.6 P(L|L)=0.4 P(H|L)=0.33 P(M|L)=0.67 P(L|L)=0
SQA14 3.82 3.69
P(H)=0.54 P(H)=0.46 P(H|H)=0.62 P(M|H)=0.15 P(L|H)=0.23 P(H|H)=0.29 P(M|H)=0.42 P(L|H)=0.29
P(M)=0.33 P(M)=0.43 P(H|M)=0.58 P(M|M)=0.34 P(L|M)=0.08 P(H|M)=0.5 P(M|M)=0.29 P(L|M)=0.21
P(L)=0.13 P(L)=0.11 P(H|L)=0.5 P(M|L)=0.25 P(L|L)=0.25 P(H|L)=0.5 P(M|L)=0.25 P(L|L)=0.25
SQB1 3.77 3.57
P(H)=0.51 P(H)=0.46 P(H|H)=0.44 P(M|H)=0.44 P(L|H)=0.12 P(H|H)=0.33 P(M|H)=0.56 P(L|H)=0.11
P(M)=0.36 P(M)=0.37 P(H|M)=0.24 P(M|M)=0.63 P(L|M)=0.13 P(H|M)=0.4 P(M|M)=0.5 P(L|M)=0.1
P(L)=0.13 P(L)=0.17 P(H|L)=0.8 P(M|L)=0 P(L|L)=0.2 P(H|L)=0.67 P(M|L)=0 P(L|L)=0.33
SQB2 3.62 2.84
P(H)=0.44 P(H)=0.22 P(H|H)=0.55 P(M|H)=0.27 P(L|H)=0.18 P(H|H)=0.29 P(M|H)=0.42 P(L|H)=0.29
P(M)=0.44 P(M)=0.49 P(H|M)=0.54 P(M|M)=0.31 P(L|M)=0.15 P(H|M)=0.64 P(M|M)=0.21 P(L|M)=0.15
P(L)=0.12 P(L)=0.29 P(H|L)=0 P(M|L)=0.8 P(L|L)=0.2 P(H|L)=0.25 P(M|L)=0.5 P(L|L)=0.25
SQB3 3.56 3.51
P(H)=0.41 P(H)=0.4 P(H|H)=0.5 P(M|H)=0.33 P(L|H)=0.17 P(H|H)=0.37 P(M|H)=0.63 P(L|H)=0
P(M)=0.46 P(M)=0.46 P(H|M)=0.43 P(M|M)=0.36 P(L|M)=0.21 P(H|M)=0.46 P(M|M)=0.31 P(L|M)=0.23
P(L)=0.13 P(L)=0.14 P(H|L)=0 P(M|L)=0.67 P(L|L)=0.33 P(H|L)=0.5 P(M|L)=0 P(L|L)=0.5
SQB4 3.41 3.47
P(H)=0.41 P(H)=0.34 P(H|H)=0.7 P(M|H)=0.3 P(L|H)=0 P(H|H)=0.5 P(M|H)=0.25 P(L|H)=0.25
P(M)=0.38 P(M)=0.54 P(H|M)=0.46 P(M|M)=0.31 P(L|M)=0.23 P(H|M)=0.62 P(M|M)=0.31 P(L|M)=0.07
P(L)=0.21 P(L)=0.12 P(H|L)=0.33 P(M|L)=0.17 P(L|L)=0.5 P(H|L)=0.25 P(M|L)=0.25 P(L|L)=0.5
SQB5 3.67 3.57
P(H)=0.44 P(H)=0.49 P(H|H)=0.23 P(M|H)=0.54 P(L|H)=0.23 P(H|H)=0.08 P(M|H)=0.67 P(L|H)=0.25
P(M)=0.46 P(M)=0.31 P(H|M)=0.31 P(M|M)=0.54 P(L|M)=0.15 P(H|M)=0.25 P(M|M)=0.63 P(L|M)=0.12
P(L)=0.10 P(L)=0.2 P(H|L)=0 P(M|L)=1 P(L|L)=0 P(H|L)=0.2 P(M|L)=0.8 P(L|L)=0
SQB6 3.62 2.97
P(H)=0.46 P(H)=0.26 P(H|H)=0.45 P(M|H)=0.36 P(L|H)=0.18 P(H|H)=0.29 P(M|H)=0.29 P(L|H)=0.42
P(M)=0.38 P(M)=0.48 P(H|M)=0.08 P(M|M)=0.92 P(L|M)=0 P(H|M)=0.45 P(M|M)=0.55 P(L|M)=0
P(L)=0.15 P(L)=0.26 P(H|L)=0.4 P(M|L)=0 P(L|L)=0.6 P(H|L)=0.14 P(M|L)=0.57 P(L|L)=0.29
SQB7 3.82 3.29
P(H)=0.46 P(H)=0.34 P(H|H)=0.36 P(M|H)=0.36 P(L|H)=0.28 P(H|H)=0.33 P(M|H)=0.33 P(L|H)=0.33
P(M)=0.49 P(M)=0.46 Piv=0.23 P(M|M)=0.62 P(L|M)=0.15 P(H|M)=0.3 P(M|M)=0.6 P(L|M)=0.1
P(L)=0.05 P(L)=0.2 P(H|L)=0.5 P(M|L)=0 P(L|L)=0.5 P(H|L)=0.33 P(M|L)=0.33 P(L|L)=0.33
SQB8 3.77 3.34
P(H)=0.49 P(H)=0.37 P(H|H)=0.56 P(M|H)=0.13 P(L|H)=0.31 P(H|H)=0.11 P(M|H)=0.33 P(L|H)=0.56
P(M)=0.41 P(M)=0.43 P(H|M)=0.1 P(M|M)=0.7 P(L|M)=0.2 P(H|M)=0.3 P(M|M)=0.5 P(L|M)=0.2
P(L)=0.10 P(L)=0.2 P(H|L)=0 P(M|L)=1 P(L|L)=0 P(H|L)=0.33 P(M|L)=0.67 P(L|L)=0
SQC1 3.56 3.3
P(H)=0.41 P(H)=0.31 P(H|H)=0.23 P(M|H)=0.44 P(L|H)=0.33 P(H|H)=0.22 P(M|H)=0.33 P(L|H)=0.45
P(M)=0.46 P(M)=0.51 P(H|M)=0.2 P(M|M)=0.6 P(L|M)=0.2 P(H|M)=0.25 P(M|M)=0.58 P(L|M)=0.17
P(L)=0.13 P(L)=0.18 P(H|L)=0.2 P(M|L)=0.4 P(L|L)=0.4 P(H|L)=0.25 P(M|L)=0.25 P(L|L)=0.5
SQC2 3.72 3.83
P(H)=0.51 P(H)=0.54 P(H|H)=0.39 P(M|H)=0.33 P(L|H)=0.28 P(H|H)=0.21 P(M|H)=0.58 P(L|H)=0.21
P(M)=0.33 P(M)=0.32 P(H|M)=0.12 P(M|M)=0.63 P(L|M)=0.25 P(H|M)=0.33 P(M|M)=0.5 P(L|M)=0.17
P(L)=0.15 P(L)=0.14 P(H|L)=0.67 P(M|L)=0.33 P(L|L)=0 P(H|L)=0.6 P(M|L)=0.2 P(L|L)=0.2
SQC3 3.82 3.34
P(H)=0.51 P(H)=0.37 P(H|H)=0.57 P(M|H)=0.21 P(L|H)=0.22 P(H|H)=0.3 P(M|H)=0.3 P(L|H)=0.4
P(M)=0.38 P(M)=0.43 P(H|M)=0.18 P(M|M)=0.55 P(L|M)=0.27 P(H|M)=0.27 P(M|M)=0.55 P(L|M)=0.18
P(L)=0.10 P(L)=0.2 P(H|L)=0.25 P(M|L)=0.25 P(L|L)=0.5 P(H|L)=0.5 P(M|L)=0.25 P(L|L)=0.25
SQC4 3.51 3.17
P(H)=0.46 P(H)=0.34 P(H|H)=0.36 P(M|H)=0.36 P(L|H)=0.28 P(H|H)=0.5 P(M|H)=0.1 P(L|H)=0.4
P(M)=0.33 P(M)=0.4 P(H|M)=0.6 P(M|M)=0.4 P(L|M)=0 P(H|M)=0.55 P(M|M)=0.36 P(L|M)=0.09
P(L)=0.21 P(L)=0.26 P(H|L)=0.6 P(M|L)=0.2 P(L|L)=0.2 P(H|L)=0.25 P(M|L)=0.5 P(L|L)=0.25
SQC5 3.31 3.29 P(H)=0.41 P(H)=0.4 P(H|H)=0.5 P(M|H)=0.25 P(L|H)=0.25 P(H|H)=0.2 P(M|H)=0.4 P(L|H)=0.4

Chapter 9 Using Markov chain model to analyze future customer preferences
136
P(M)=0.33 P(M)=0.34 P(H|M)=0.22 P(M|M)=0.67 P(L|M)=0.11 P(H|M)=0.63 P(M|M)=0.25 P(L|M)=0.12
P(L)=0.26 P(L)=0.26 P(H|L)=0.38 P(M|L)=0.38 P(L|L)=0.24 P(H|L)=0.42 P(M|L)=0.29 P(L|L)=0.29
SQD1 3.72 3.23
P(H)=0.51 P(H)=0.34 P(H|H)=0.62 P(M|H)=0.19 P(L|H)=0.19 P(H|H)=0.5 P(M|H)=0.25 P(L|H)=0.25
P(M)=0.33 P(M)=0.43 P(H|M)=0.38 P(M|M)=0.24 P(L|M)=0.38 P(H|M)=0.46 P(M|M)=0.27 P(L|M)=0.27
P(L)=0.15 P(L)=0.23 P(H|L)=0.4 P(M|L)=0.4 P(L|L)=0.2 P(H|L)=0.17 P(M|L)=0.5 P(L|L)=0.33
SQD2 3.56 3.23
P(H)=0.44 P(H)=0.34 P(H|H)=0.33 P(M|H)=0.42 P(L|H)=0.25 P(H|H)=0.43 P(M|H)=0.43 P(L|H)=0.14
P(M)=0.41 P(M)=0.43 P(H|M)=0.15 P(M|M)=0.7 P(L|M)=0.15 P(H|M)=0.36 P(M|M)=0.55 P(L|M)=0.09
P(L)=0.15 P(L)=0.23 P(H|L)=0.75 P(M|L)=0.25 P(L|L)=0 P(H|L)=0.29 P(M|L)=0.42 P(L|L)=0.29
SQD3 4.13 3.23
P(H)=0.62 P(H)=0.34 P(H|H)=0.23 P(M|H)=0.59 P(L|H)=0.18 P(H|H)=0.11 P(M|H)=0.67 P(L|H)=0.22
P(M)=0.33 P(M)=0.43 P(H|M)=0.18 P(M|M)=0.55 P(L|M)=0.27 P(H|M)=0.36 P(M|M)=0.36 P(L|M)=0.28
P(L)=0.05 P(L)=0.23 P(H|L)=0 P(M|L)=1 P(L|L)=0 P(H|L)=0 P(M|L)=1 P(L|L)=0
SQD4 4.08 3.63
P(H)=0.67 P(H)=0.51 P(H|H)=0.53 P(M|H)=0.33 P(L|H)=0.14 P(H|H)=0.54 P(M|H)=0.38 P(L|H)=0.08
P(M)=0.21 P(M)=0.29 P(H|M)=0.2 P(M|M)=0.4 P(L|M)=0.4 P(H|M)=0.71 P(M|M)=0.29 P(L|M)=0
P(L)=0.13 P(L)=0.2 P(H|L)=0.33 P(M|L)=0.67 P(L|L)=0 P(H|L)=0 P(M|L)=0.8 P(L|L)=0.2
SQD5 3.51 3.06
P(H)=0.44 P(H)=0.34 P(H|H)=0.64 P(M|H)=0.29 P(L|H)=0.07 P(H|H)=0.5 P(M|H)=0.25 P(L|H)=0.25
P(M)=0.38 P(M)=0.34 P(H|M)=0.25 P(M|M)=0.5 P(L|M)=0.25 P(H|M)=0.33 P(M|M)=0.56 P(L|M)=0.11
P(L)=0.18 P(L)=0.32 P(H|L)=0.33 P(M|L)=0.67 P(L|L)=0 P(H|L)=0.5 P(M|L)=0.5 P(L|L)=0
SQD6 3.82 3.11
P(H)=0.54 P(H)=0.29 P(H|H)=0.47 P(M|H)=0.47 P(L|H)=0.06 P(H|H)=0.5 P(M|H)=0.38 P(L|H)=0.12
P(M)=0.33 P(M)=0.49 P(H|M)=0.27 P(M|M)=0.55 P(L|M)=0.18 P(H|M)=0.27 P(M|M)=0.55 P(L|M)=0.18
P(L)=0.13 P(L)=0.22 P(H|L)=0 P(M|L)=0.67 P(L|L)=0.33 P(H|L)=0.33 P(M|L)=0.5 P(L|L)=0.17
SQE1 4.13 3.4
P(H)=0.67 P(H)=0.43 P(H|H)=0.45 P(M|H)=0.35 P(L|H)=0.2 P(H|H)=0.54 P(M|H)=0.38 P(L|H)=0.08
P(M)=0.23 P(M)=0.34 P(H|M)=0.14 P(M|M)=0.57 P(L|M)=0.29 P(H|M)=0.25 P(M|M)=0.5 P(L|M)=0.25
P(L)=0.10 P(L)=0.23 P(H|L)=0.5 P(M|L)=0.5 P(L|L)=0 P(H|L)=0.5 P(M|L)=0.25 P(L|L)=0.25
SQE2 3.97 3.37
P(H)=0.56 P(H)=0.46 P(H|H)=0.56 P(M|H)=0.25 P(L|H)=0.19 P(H|H)=0.46 P(M|H)=0.31 P(L|H)=0.23
P(M)=0.36 P(M)=0.28 P(H|M)=0.2 P(M|M)=0.6 P(L|M)=0.2 P(H|M)=0.14 P(M|M)=0.43 P(L|M)=0.43
P(L)=0.08 P(L)=0.26 P(H|L)=0 P(M|L)=0.67 P(L|L)=0.33 P(H|L)=0.2 P(M|L)=0.8 P(L|L)=0
SQE3 3.82 3.63
P(H)=0.54 P(H)=0.43 P(H|H)=0.53 P(M|H)=0.35 P(L|H)=0.12 P(H|H)=0.55 P(M|H)=0.36 P(L|H)=0.09
P(M)=0.33 P(M)=0.46 P(H|M)=0.44 P(M|M)=0.56 P(L|M)=0 P(H|M)=0.45 P(M|M)=0.36 P(L|M)=0.19
P(L)=0.13 P(L)=0.11 P(H|L)=0.33 P(M|L)=0.33 P(L|L)=0.33 P(H|L)=0.33 P(M|L)=0.67 P(L|L)=0
SQE4 3.82 3.74
P(H)=0.54 P(H)=0.54 P(H|H)=0.46 P(M|H)=0.27 P(L|H)=0.27 P(H|H)=0.47 P(M|H)=0.33 P(L|H)=0.2
P(M)=0.33 P(M)=0.29 P(H|M)=0.36 P(M|M)=0.55 P(L|M)=0.09 P(H|M)=0.25 P(M|M)=0.5 P(L|M)=0.25
P(L)=0.13 P(L)=0.17 P(H|L)=1 P(M|L)=0 P(L|L)=0 P(H|L)=0.5 P(M|L)=0.5 P(L|L)=0
SQE5 3.77 3.24
P(H)=0.54 P(H)=0.42 P(H|H)=0.27 P(M|H)=0.46 P(L|H)=0.27 P(H|H)=0.36 P(M|H)=0.36 P(L|H)=0.28
P(M)=0.31 P(M)=0.29 P(H|M)=0.14 P(M|M)=0.57 P(L|M)=0.29 P(H|M)=0.17 P(M|M)=0.83 P(L|M)=0
P(L)=0.15 P(L)=0.29 P(H|L)=0.5 P(M|L)=0.33 P(L|L)=0.17 P(H|L)=0.25 P(M|L)=0.25 P(L|L)=0.5
SQE6 3.87 3.63
P(H)=0.56 P(H)=0.43 P(H|H)=0.6 P(M|H)=0.33 P(L|H)=0.07 P(H|H)=0.58 P(M|H)=0.25 P(L|H)=0.17
P(M)=0.31 P(M)=0.46 P(H|M)=0.45 P(M|M)=0.33 P(L|M)=0.22 P(H|M)=0.45 P(M|M)=0.36 P(L|M)=0.19
P(L)=0.13 P(L)=0.11 P(H|L)=0.6 P(M|L)=0.2 P(L|L)=0.2 P(H|L)=0.5 P(M|L)=0.5 P(L|L)=0
9.4.2 Steady-state probability and expected weight of customer preference
Given the preference level and the initial and transition probabilities for both
groups (Indonesia and Singapore), the expected weight of preference of each attribute
changed in the next few periods is computed. For instance, for SQA1 (in Indonesian), the
transition probabilities are:
,
where, for instance, p21=0.35 represents the 1-step transition probability of shifting from
M (medium) to H (high). It is assumed that these probabilities are stationary over time.
According to Anderson et al. (2007), in order to give an illustration of how the

Chapter 9 Using Markov chain model to analyze future customer preferences
137
expected weight (EW) of customer preference changed over time, a 5-step computation
representating the dynamics of customer preference is given as follows:
EW of SQA1 (step-1) = 3.37
EW of SQA1 (step-2) = 3.32
EW of SQA1 (step-3) = 3.33
EW of SQA1 (step-4) = 3.33
EW of SQA1 (step-4) = 3.33
Using the similar procedure, a complete 5-step expected weight for all thirty nine service
attributes is provided (see Table 9-2).
Table 9-2 Expected weight in 5 steps for each service attribute
Item Indonesia Singapore
Step-1 Step-2 Step-3 Step-4 Step-5 … Step-1 Step-2 Step-3 Step-4 Step-5 …
SQA1 3.37 3.32 3.33 3.33 3.33 … 3.19 3.14 3.16 3.16 3.16 … SQA2 2.93 2.72 2.66 2.65 2.64 … 3.09 3.16 3.16 3.15 3.16 … SQA3 3.28 3.28 3.28 3.28 3.28 … 3.36 3.36 3.37 3.38 3.39 … SQA4 3.56 3.62 3.66 3.67 3.68 … 3.32 3.32 3.32 3.32 3.32 … SQA5 3.56 3.57 3.57 3.57 3.57 … 3.38 3.41 3.41 3.41 3.41 … SQA6 3.75 3.83 3.85 3.85 3.85 … 3.62 3.78 3.82 3.83 3.83 … SQA7 3.47 3.42 3.43 3.43 3.43 … 3.48 3.31 3.33 3.33 3.33 … SQA8 3.78 3.84 3.84 3.84 3.84 … 3.57 3.55 3.55 3.55 3.55 … SQA9 3.36 3.17 3.12 3.11 3.10 … 3.13 3.12 3.11 3.11 3.11 … SQA10 3.07 3.11 3.08 3.09 3.08 … 3.32 3.27 3.29 3.28 3.28 … SQA11 3.17 3.15 3.14 3.14 3.14 … 3.18 3.19 3.19 3.20 3.22 … SQA12 3.21 3.15 3.14 3.14 3.15 … 3.02 2.86 2.81 2.79 2.79 … SQA13 3.25 3.19 3.16 3.14 3.14 … 2.91 2.81 2.87 2.86 2.86 … SQA14 3.82 3.79 3.79 3.80 3.81 … 3.29 3.30 3.28 3.26 3.25 … SQB1 3.56 3.51 3.49 3.47 3.46 … 3.54 3.55 3.55 3.55 3.55 … SQB2 3.60 3.55 3.55 3.55 3.55 … 3.46 3.32 3.34 3.34 3.33 … SQB3 3.39 3.29 3.27 3.27 3.27 … 3.50 3.48 3.46 3.45 3.43 … SQB4 3.68 3.81 3.86 3.89 3.90 … 3.70 3.48 3.40 3.37 3.36 … SQB5 3.14 3.18 3.19 3.19 3.19 … 2.99 3.16 3.10 3.09 3.07 … SQB6 3.25 3.19 3.19 3.19 3.20 … 3.25 3.25 3.22 3.20 3.19 … SQB7 3.14 3.10 3.08 3.07 3.06 … 3.21 3.23 3.24 3.26 3.28 … SQB8 3.16 3.07 2.99 2.97 2.95 … 2.89 3.08 3.02 3.04 3.03 … SQC1 2.86 2.85 2.86 2.87 2.87 … 2.90 2.86 2.85 2.85 2.85 … SQC2 3.23 3.25 3.21 3.20 3.19 … 3.27 3.38 3.38 3.39 3.40 … SQC3 3.27 3.12 3.08 3.08 3.09 … 3.10 3.14 3.14 3.14 3.14 …

Chapter 9 Using Markov chain model to analyze future customer preferences
138
SQC4 3.63 3.59 3.58 3.56 3.55 … 3.43 3.37 3.34 3.34 3.35 … SQC5 3.34 3.32 3.31 3.30 3.29 … 3.24 3.20 3.19 3.17 3.15 … SQD1 3.49 3.50 3.48 3.46 3.45 … 3.27 3.26 3.26 3.27 3.28 … SQD2 3.32 3.34 3.33 3.35 3.37 … 3.42 3.46 3.46 3.46 3.45 … SQD3 2.99 2.89 2.87 2.87 2.86 … 3.01 3.09 3.08 3.11 3.12 … SQD4 3.52 3.32 3.29 3.29 3.30 … 3.80 4.04 4.04 4.04 4.04 … SQD5 3.62 3.58 3.59 3.58 3.58 … 3.64 3.54 3.56 3.55 3.55 … SQD6 3.40 3.26 3.20 3.18 3.16 … 3.38 3.39 3.39 3.38 3.36 … SQE1 3.37 3.27 3.23 3.22 3.22 … 3.51 3.49 3.47 3.47 3.47 … SQE2 3.37 3.16 3.08 3.05 3.04 … 3.13 2.93 2.92 2.90 2.90 … SQE3 3.74 3.77 3.79 3.79 3.80 … 3.74 3.77 3.79 3.80 3.82 … SQE4 3.63 3.68 3.64 3.63 3.61 … 3.46 3.40 3.39 3.39 3.39 … SQE5 3.00 3.01 3.00 2.99 2.98 … 2.98 3.02 3.06 3.08 3.10 … SQE6 3.84 3.85 3.86 3.87 3.89 … 3.73 3.79 3.80 3.81 3.82 …
Finally, the steady-state probability and expected weight for each service attribute are
computed and shown (see Table 9-3). They were done by applying Gauss-Jordan method
(see Eqs. 9-2 and 9-3) and solved by MS Excel solver. For instance, the steady-state
probabilities of SQA1 for Indonesian group are V1 = 0.32, V2 = 0.57 and V3 = 0.11.
Hence, its expected weight becomes 5(0.32) + 3(0.57) + 1(0.11) = 3.41. To visualize the
transition between the initial and expected steady-state weights, an illustration involving
the first five service items is given (see Figure 9-3).
Table 9-3 Steady-state probability and expected weight
Item Indonesia Singapore
Probability Exp. weight Probability Exp. weight
SQA1 V1=0.32, V2=0.57, V3=0.11 3.41 V1=0.24, V2=0.61, V3=0.15 3.16
SQA2 V1=0.21, V2=0.41, V3=0.38 2.64 V1=0.31, V2=0.45, V3=0.24 3.16
SQA3 V1=0.31, V2=0.52, V3=0.17 3.28 V1=0.32, V2=0.53, V3=0.15 3.32
SQA4 V1=0.49, V2=0.37, V3=0.14 3.70 V1=0.32, V2=0.52, V3=0.16 3.32
SQA5 V1=0.42, V2=0.44, V3=0.14 3.57 V1=0.35, V2=0.50, V3=0.15 3.41
SQA6 V1=0.42, V2=0.58, V3=0.00 3.85 V1=0.42, V2=0.58, V3=0.00 3.84
SQA7 V1=0.35, V2=0.51, V3=0.14 3.43 V1=0.34, V2=0.49, V3=0.17 3.33
SQA8 V1=0.51, V2=0.40, V3=0.09 3.84 V1=0.39, V2=0.50, V3=0.11 3.55
SQA9 V1=0.26, V2=0.54, V3=0.21 3.10 V1=0.22, V2=0.61, V3=0.17 3.11
SQA10 V1=0.31, V2=0.43, V3=0.27 3.08 V1=0.29, V2=0.56, V3=0.15 3.28
SQA11 V1=0.31, V2=0.45, V3=0.24 3.14 V1=0.31, V2=0.47, V3=0.22 3.16
SQA12 V1=0.30, V2=0.45, V3=0.25 3.10 V1=0.23, V2=0.43, V3=0.34 2.79
SQA13 V1=0.25, V2=0.56, V3=0.19 3.13 V1=0.16, V2=0.60, V3=0.24 2.86
SQA14 V1=0.59, V2=0.21, V3=0.20 3.76 V1=0.41, V2=0.34, V3=0.25 3.32
SQB1 V1=0.40, V2=0.47, V3=0.14 3.53 V1=0.41, V2=0.45, V3=0.14 3.55
SQB2 V1=0.45, V2=0.38, V3=0.17 3.55 V1=0.41, V2=0.37, V3=0.22 3.37
SQB3 V1=0.36, V2=0.42, V3=0.22 3.27 V1=0.43, V2=0.39, V3=0.18 3.50
SQB4 V1=0.58, V2=0.28, V3=0.13 3.91 V1=0.46, V2=0.27, V3=0.27 3.38
SQB5 V1=0.24, V2=0.61, V3=0.15 3.19 V1=0.21, V2=0.66, V3=0.13 3.15

Chapter 9 Using Markov chain model to analyze future customer preferences
139
SQB6 V1=0.16, V2=0.76, V3=0.07 3.18 V1=0.34, V2=0.46, V3=0.20 3.27
SQB7 V1=0.36, V2=0.33, V3=0.31 3.10 V1=0.32, V2=0.45, V3=0.23 3.18
SQB8 V1=0.15, V2=0.67, V3=0.18 2.94 V1=0.26, V2=0.50, V3=0.24 3.03
SQC1 V1=0.20, V2=0.51, V3=0.28 2.84 V1=0.24, V2=0.41, V3=0.35 2.78
SQC2 V1=0.32, V2=0.47, V3=0.21 3.23 V1=0.34, V2=0.47, V3=0.19 3.31
SQC3 V1=0.33, V2=0.34, V3=0.33 3.01 V1=0.34, V2=0.38, V3=0.28 3.14
SQC4 V1=0.48, V2=0.34, V3=0.18 3.62 V1=0.44, V2=0.28, V3=0.28 3.35
SQC5 V1=0.35, V2=0.47, V3=0.18 3.32 V1=0.40, V2=0.32, V3=0.28 3.24
SQD1 V1=0.51, V2=0.25, V3=0.24 3.54 V1=0.39, V2=0.33, V3=0.28 3.22
SQD2 V1=0.30, V2=0.54, V3=0.16 3.29 V1=0.38, V2=0.49, V3=0.13 3.48
SQD3 V1=0.15, V2=0.65, V3=0.20 2.90 V1=0.23, V2=0.56, V3=0.21 3.05
SQD4 V1=0.34, V2=0.44, V3=0.22 3.23 V1=0.57, V2=0.37, V3=0.06 4.04
SQD5 V1=0.43, V2=0.43, V3=0.14 3.58 V1=0.43, V2=0.42, V3=0.15 3.55
SQD6 V1=0.28, V2=0.54, V3=0.18 3.20 V1=0.37, V2=0.48, V3=0.15 3.41
SQE1 V1=0.31, V2=0.49, V3=0.20 3.21 V1=0.41, V2=0.41, V3=0.18 3.47
SQE2 V1=0.24, V2=0.53, V3=0.23 3.03 V1=0.23, V2=0.50, V3=0.27 2.93
SQE3 V1=0.48, V2=0.44, V3=0.08 3.78 V1=0.48, V2=0.40, V3=0.12 3.74
SQE4 V1=0.52, V2=0.31, V3=0.17 3.71 V1=0.38, V2=0.44, V3=0.18 3.39
SQE5 V1=0.27, V2=0.48, V3=0.25 3.03 V1=0.22, V2=0.66, V3=0.12 3.19
SQE6 V1=0.55, V2=0.32, V3=0.13 3.83 V1=0.53, V2=0.32, V3=0.15 3.76
Grand average 3.34 3.31
Figure 9-2 Illustration of the trends for each service attribute
9.4.3 Analysis of predicted weight by incorporating the Kano categorization and
Kansei
Thereafter, to analyze whether particular service attributes are still important in
the steady-state, their predicted steady-state weight values are compared to the current
importance values obtained from a survey (see Table 8-3, column “I”) in order to obtain
weight gap. A value of 0.5 is assumed to be the threshold for the weight gap to determine

Chapter 9 Using Markov chain model to analyze future customer preferences
140
whether a certain service attribute is still important in the steady-state. Hence, a service
attribute is considered important and interesting if the gap is below 0.5. In addition, a
medium level of importance (i.e., a score of 3 out of 5) is used for a complementary
threshold.
For Indonesian group, there are eleven service attributes considered still important
(i.e., SQA5, SQA6, SQA8, SQA14, SQB2, SQB4, SQC4, SQD5, SQE3, SQE4 and SQE6);
whereas for Singaporean counterpart, there are nine service attributes considered still
important (i.e., SQA6, SQA8, SQB1, SQB3, SQD2, SQD4, SQD5, SQE3 and SQE6) (see
Table 9-4). Based on the values computed, the most preferred service item in the steady-
state is SQA6 “the atmosphere of restaurant is inviting appetite” (for Indonesia) and
SQD4 “the hotel provides a safe environment” (for Singapore).
Table 9-4 Comparison between the current and future weight
Item Indonesia Singapore
Current weight Future weight Gap* Current weight Future weight Gap*
SQA1 4.00 3.41 0.59 4.03 3.16 0.87
SQA2 3.86 2.64 1.22 3.95 3.16 0.79
SQA3 3.98 3.28 0.69 4.16 3.32 0.84
SQA4 4.21 3.70 0.51 4.04 3.32 0.72
SQA5 4.08 3.57 0.50 3.97 3.41 0.56
SQA6 3.93 3.85 0.08 3.89 3.84 0.06
SQA7 3.94 3.43 0.51 4.07 3.33 0.73
SQA8 4.15 3.84 0.31 3.97 3.55 0.43
SQA9 4.25 3.10 1.15 4.04 3.11 0.93
SQA10 3.96 3.08 0.88 3.99 3.28 0.70
SQA11 4.10 3.14 0.96 4.07 3.16 0.91
SQA12 4.10 3.10 1.00 4.03 2.79 1.24
SQA13 4.01 3.13 0.88 4.09 2.86 1.24
SQA14 3.91 3.76 0.15 4.00 3.32 0.68
SQB1 4.09 3.53 0.56 4.03 3.55 0.48
SQB2 4.05 3.55 0.50 4.12 3.37 0.75
SQB3 3.94 3.27 0.67 3.97 3.50 0.47
SQB4 4.05 3.91 0.14 4.16 3.38 0.78
SQB5 4.00 3.19 0.81 4.11 3.15 0.96
SQB6 3.89 3.18 0.71 4.00 3.27 0.73
SQB7 4.08 3.10 0.97 3.96 3.18 0.78
SQB8 4.26 2.94 1.32 3.97 3.03 0.94
SQC1 4.14 2.84 1.30 3.99 2.78 1.20
SQC2 4.05 3.23 0.82 3.93 3.31 0.63
SQC3 4.13 3.01 1.11 3.97 3.14 0.84

Chapter 9 Using Markov chain model to analyze future customer preferences
141
SQC4 4.04 3.62 0.42 4.07 3.35 0.72
SQC5 4.04 3.32 0.71 4.08 3.24 0.84
SQD1 4.16 3.54 0.62 3.99 3.22 0.77
SQD2 3.90 3.29 0.61 3.87 3.48 0.39
SQD3 4.04 2.90 1.14 4.03 3.05 0.98
SQD4 4.00 3.23 0.77 4.03 4.04 -0.01
SQD5 4.06 3.58 0.48 3.91 3.55 0.35
SQD6 4.06 3.20 0.86 4.13 3.41 0.72
SQE1 4.11 3.22 0.90 4.01 3.47 0.54
SQE2 4.09 3.03 1.06 4.17 2.93 1.24
SQE3 4.04 3.78 0.25 3.95 3.74 0.21
SQE4 4.10 3.71 0.39 4.19 3.39 0.80
SQE5 4.01 3.03 0.98 3.91 3.19 0.72
SQE6 4.13 3.83 0.29 3.99 3.76 0.22
* gap = current weight – future weight. Bolded figures indicate interesting service items in the steady-state.
By taking into account the interesting service attributes only, their adjusted
importance level is analyzed by incorporating the Kano categorization and significant
Kansei model. It is hoped that this approach will give a better picture of how to treat
these important service attributes in the present time to satisfy the customers in the future
time. By referring to the Kansei model and Kano categorization as done and discussed
(see Chapter 8), the predicted weights of these important service attributes are
summarized (see Table 9-5).
Table 9-5 Future weight of service attribute incorporated Kano‟s category and
Kansei Indonesia Singapore
Item Gap* Kano Kansei related Item Gap* Kano Kansei related
SQA5 0.5 O Peacefulness,
spaciousness
SQA6 0.06 M -
SQA6 0.08 I - SQA8 0.43 I -
SQA8 0.31 A - SQB1 0.48 A -
SQA14 0.15 I - SQB3 0.47 I -
SQB2 0.5 O - SQD2 0.39 n/a n/a
SQB4 0.14 A - SQD4 -0.01 M -
SQC4 0.42 A Relaxedness,
peacefulness
SQD5 0.35 O -
SQD5 0.48 M Welcomeness SQE3 0.21 A Cleanliness
SQE3 0.25 A Relaxedness SQE6 0.22 M -
SQE4 0.39 I -
SQE6 0.29 A - * gap = current weight – future weight

Chapter 9 Using Markov chain model to analyze future customer preferences
142
For the Indonesian group, there are four important Kansei words related to the
future customer preferences, i.e., peacefulness, spaciousness, relaxedness and
welcomeness. By incorporating the Kano categorization, the most preferred service
attribute in the steady-state (SQA6 - the atmosphere of restaurant is inviting appetite) is of
indifferent (I). In the steady-state, this service attribute may possibly be a required
attribute (O) or attractive attribute (A) as the customer begins to realize the importance of
it (IO or IA).
For the Singaporean group, there is one important Kansei taken care of for the
future customer preference, i.e., cleanliness. Incorporating the Kano categorization, the
most important service attribute (SQD4 - the hotel provides a safe environment) is of
must-be (M). Due to the dynamics of customer preference, it may be changed to be one
dimensional (O) or attractive (A) in the steady-state (MO or MA).
Lastly, the service attributes that have no significant difference between the
current level of importance and the future expected weight are incorporated into house of
quality (HOQ) (see Figures 9-4 and 9-5). It is then followed by the relevant technical
responses. Since this case study is on luxury hotel services, the technical responses are
determined by the standards of hotel/tourism accommodation services (e.g.,
ISO18513:2003). In this study, these technical responses are adapted from a study on
luxury hotels by Chen and Chuang (2008).
Regarding the incorporation of the Kano categorization and Kansei into HOQ,
there are two steps applied. First, it is to identify and choose the important service
attributes which have significant relationship with particular Kansei. Second, it is to
determine the scores for each service attribute (it is called “adjusted future weight

Chapter 9 Using Markov chain model to analyze future customer preferences
143
scores”) by incorporating the future importance weight, the Kano score and the number
of Kansei words involved. The greater the adjusted future weight scores, the more
important is the item.
According to Tan and Pawitra (2001), values of “4”, “2” and “1” are assigned to
the Kano‟s attractive (A), one-dimensional (O) and must-be (M), respectively. For
example, “the employees are never too busy to respond to your requests” is given the
greatest priority for improvement since it has the highest score (28.96) (see Figure 9-4).
In line with the adjustment of the importance scores of the “Whats”, the importance
scores of the “Hows” are updated as well. The importance scores of the “Hows” are
defined as the sum of the product of the adjusted future weight and the value of
relationship matrix. It can be expressed as follows. Importance of “Hows”i
= , where j = index for
“Whats” = 1, 2 … n; and i = index for “Hows” = 1, 2 … m.
Referring to the proposed managerial strategies (see Figures 9-4 and 9-5), for the
Indonesian group, it shows that in order to achieve total customer satisfaction in the
future, intensive training to all employees is given the greatest priority.

Chapter 9 Using Markov chain model to analyze future customer preferences
144
Figure 9-3 HOQ for Indonesian group
Figure 9-4 HOQ for Singaporean group
9.5 Conclusion
The objective of this chapter is to provide a framework followed by a case study
describing how Markov chain utilized to predict the steady-state customer preferences on

Chapter 9 Using Markov chain model to analyze future customer preferences
145
service attributes. This approach is formulized to maintain a good long-term relationship
between service providers and customers.
Practically, the use of Markov chain can provide valuable information for a
manager or a decision maker to understand how the dynamics of customer needs (i.e.,
service attributes) as time goes by from a probability viewpoint. This approach is quite
flexible since if new customers‟ surveys are conducted to have most updated information,
new transition probabilities can be computed and available promptly.
To strengthen the study methodology, the Kano categorization and Kansei model
are incorporated into the integrative framework. It will help a decision maker focus only
on which service attributes need to be improved that have significant impacts on Kansei.
To give a clear picture on how Kansei and the Kano categorization taken into account
holistically, an HOQ is incorporated in the integrative framework.

Chapter 10 Discussion
146
10 Discussion
10.1 Introduction
This chapter highlights a summary of findings as discussed in the previous chapters. It
presents the relationship between affective and cognitive processes and their impact on
overall satisfaction. Then, it is followed by the usefulness of service quality tools such as
the Kano model, QFD and also Markov chain in the KE methodology.
10.2 Research findings
KE was invented in the 1970s when there was the necessity for a methodology
capturing hidden feelings about products. KE methodology is based on the semantic
differentials and enhanced by adding different mathematical and quality tools. This
combined service quality tools in KE is important to deal with cases in many different
purposes and contexts. This current study evaluated the existing services instead of a new
service design. A focus on attractive attributes gives a deeper understanding on how to
capture customers‟ emotions/feelings and always to delight the customers through
continuous improvements.
KE has been extensively implemented to the design of physical products (see
Nagamachi and Imada, 1995; Nagamachi, 1995; Ishihara et al., 1996; Schütte, 2005;
Horiguchi and Suetomi, 1995; Hsu et al., 2000; Nagamachi, 2002; Schütte et al., 2004;
Schütte et al., 2008). In accordance with the extent of product scope, KE has been
applied to services and quality management in the 1980s (Nagamachi and Lokman,
2011). Up to today, however, the application in services is still relatively unexplored.
This study identifies three main research gaps. The first gap is the lack of KE
application in services. KE in services lacks of its formal methodology. Fortunately,

Chapter 10 Discussion
147
referring to the superiority of KE, this method can be developed, added and integrated
with relevant methods and tools (Schütte, 2005). Common tools in service research
related to customer preference characteristics such as SERVQUAL model, the Kano
model and QFD have the potentials to be combined with KE methodology. Only a few
researches of KE in services have been internationally published. Actually, Nagamachi
has initiated and expanded the application of KE on services (e.g., hotel, department store
and restaurant) in the 1980s (Nagamachi and Lokman, 2011). A very limited number of
international publications of KE in services may be due to culture and country-specific
issues in which international publications are quite related to formal English mastery.
Many Asian countries do not use English as their main language for daily communication
and formal business. This would be of great challenge since international published
journal papers must be well written in formal English. The second research gap is related
to the customer preference changes in the future. According to Schütte (2002), it is not
easy to evaluate how the dynamics of product and service features elicit customers‟
Kansei. In many cases, Kansei depends not only on one product or service feature, but
also on the composition and interaction among product and service elements. This study
utilizes Markov chain model to investigate the dynamics of customer preferences in the
steady-state condition. It is useful for a decision maker to make a better strategy based
upon the most updated customer survey. The third research gap is about how the cultural
differences influence Kansei need and response. Different cultural backgrounds, such as
different custom, ethnic, tradition and even nationality as a whole may contribute to the
different findings in various researches on KE. However, research on the effect of
cultural differences on Kansei is relatively unexplored. This study discusses an

Chapter 10 Discussion
148
exploration of customer experiences and impressions of services among different
nationalities (i.e., Indonesian, Singaporean and Japanese).
During service encounters, customers experience both physical and non-physical
elements of services. Physical form of a service is found as “servicescape” and it may
serve as building, decoration and the physical attributes of an employee. Non physical
elements of a service are related to process, activity and interaction between employees
and customers. They may include the responsiveness of employee, the ability of
employee in answering all doubts raised by the customers and et cetera. Several
preliminary case studies in Indonesia were conducted, including beauty salon (Winoto et
al., 2007), fitness centre/gym (Dewi et al., 2007), multiplayer game/game center
(Hutomo et al., 2007), café (Hertati et al., 2007), home theater service (Husin et al.,
2007) and policlinic for minor surgery (Rahardjo et al., 2007). The main objective of that
study is to conduct small survey/pre-data gathering in order to test the importance of
emotional needs (Kansei). Then, general Kansei words were extracted and translated into
design characteristics. This experience provided the way for the main study on more
complex services, i.e., luxury hotels. The findings show that the proposed design
elements/service attributes influence customer Kansei and increase customer satisfaction.
Interview and affinity diagram are found as the common tools to capture and structure
customer Kansei.
In more complex case study (i.e., luxury hotel services), this research explains and
discusses the methodology used to apply KE with more complex quantitative analysis.
This current study uses case study and survey. Face-to-face questionnaire and interview
are utilized to collect data. This approach can achieve the effectiveness of enlisting

Chapter 10 Discussion
149
cooperation for most populations (i.e., interview) and of opportunity for respondents to
give thoughtful answers (i.e., questionnaire). In addition, it allows clarification on
complex and ambiguous questions, problem verification and spontaneity of participant.
Case study has been conducted in several luxury hotels (4-star and 5-star hotels) services
in Singapore, Indonesia and Japan. In the main questionnaire, there are 39 service
items/attributes categorized into five dimensions (tangible, reliability, responsiveness,
empathy and assurance). These service items are structured by referring to the
SERVQUAL‟s five dimensions of 22-item scale by Parasuraman et al. (1988) and 26-
item scale of hotel service quality by Ladhari (2009). In addition, 16 Kansei words are
used as the representative of customer emotional needs/feelings. These Kansei words
were collected from interviews with seven tourists who stayed in luxury hotels and two
management staffs, literature reviews and finalized by using affinity diagram, involving
five potential participants. Since these instruments (questionnaires) are used by different
subjects with different cultural backgrounds (nationalities), the translation of
questionnaire was conducted. Also, pilot test was done to see any potential doubts or
gramatical errors in wordings. In total, forty and twenty five relevant responses were
collected in a one-year period (January 2010 – December 2010).
During service encounter, the relationship among perceived service quality,
cognitive process and affective process is formulated as “internal interaction”. There is
also “external interaction” that refers to customer overall satisfaction and behavioral
intention. The finding shows that cognitive process and affective process have a
significant correlation with customers‟ overall satisfaction.

Chapter 10 Discussion
150
In KE framework for hotel services, customer experiences are manifested in two
different forms, i.e., cognitive and affective processes. Customer individual perception
and evaluation on service quality serves as cognitive process which stimulates customers‟
emotional response and overall satisfaction. Affective process/affect/Kansei, however,
refers to the emotional responses/impressions given by the customers due to service
encounter. Even though the debate regarding whether cognition precedes affect or affect
antecedes cognition still remains unresolved (Lin, 2004), this study proceeds to what KE
models, i.e., cognition will determine affect/emotions/feelings. According to this current
study, it is empirically proven that cognition has a significant correlation with affect and
satisfaction. It confirms the hypothesis that cognition precedes affect as argued by
Bagozzi (1992). Cognitive state tends to precede emotional state as argued by some
researchers (Lazarus, 1999; Oliver, 1980). In other words, cognition is likely to be the
driver of emotions/affect (Russell, 1980). The preliminary study provides a correlation
analysis involving 50 Indonesians and 75 Singaporeans (as collected from January 2010 –
June 2010) as shown in Chapter 6. This study reports that affect/affective process
(ρSingapore = 0.576 with p < 0.01, ρIndonesia = 0.456 with p < 0.01) is more important than
cognition/cognitive process (ρSingapore = 0.451 with p < 0.01, ρIndonesia = 0.355 with p =
0.012) in influencing customer overall satisfaction. A direct relationship between
perceived service quality and affective process/Kansei is also demonstrated. This finding
confirms that Kansei is a function of service attributes/product elements evaluation
(Nagamachi, 1995; Schutte, 2005).
Affective process/affect/Kansei is the function of external stimuli (Nagamachi,
1995; Schütte et al., 2004, 2008; Schütte, 2005). In this current study, it shows that

Chapter 10 Discussion
151
perceived service quality is found to have a direct relationship with Kansei. By referring
to the concept of Gestalt psychology, Lin (2004) argues that when customers evaluate a
servicescape, their individual perception serves a cognitive experience and stimulates
their emotional responses (e.g., pleasure, arousal and dominance).
A more in-depth analysis of constructs of KE application in services was
conducted. The proposed properties of the constructs in this study were tested using
confirmatory factor analysis (CFA) of PLS-Graph 2.0/SmartPLS software programs
(known as PLS-SEM, see Ringle et al., 2005). The main six hypotheses tests were
performed by examining the size, the sign and the significance of the path coefficients. In
this study, the significance of the path coefficients is tested by evaluating the significance
of t-value for the path coefficients as the output of bootstrap function of the SmartPLS
2.0 with 200 resample. The 1st hypothesis “perceived service quality is positively related
to cognitive process” was significant for all three groups (i.e., Singaporean, Indonesian
and Japanese) since the path coefficients for all three groups were significant (t-
valIndonesian = 62.86; t-valSingaporean = 51.66; t-valJapanese = 3.04). Both Indonesian and
Singaporean (coeffIndonesian = 0.91; coeffSingaporean = 0.91) rate a larger effect of perceived
service quality on cognitive process than Japanese (coeffJapanese = 0.33). In the 2nd
hypothesis “perceived service quality is positively related to affective process”, it
explains that what the customers have perceived on luxury hotel services determines their
emotional response. All paths in the three population groups are supported (t-valIndonesian =
2.11; t-valSingaporean = 3.11; t-valJapanese = 12.41). The largest effect of perceived service
quality on the affective process is shown by Japanese (coeffJapanese = 0.76). The 3rd
hypothesis, “the higher the cognitive process, the higher the affective process”, is only

Chapter 10 Discussion
152
not supported by Japanese group (t-valIndonesian = 2.14; t-valSingaporean = 2.77; t-valJapanese =
0.14). This may be due to the relatively high average scores on expectation with low
average scores on perception. Singaporean and Indonesian have relatively the same
pattern of average scores on expectation and perception (coeffIndonesian = 0.34;
coeffSingaporean = 0.3; coeffJapanese = 0.01). Next hypothesis “cognitive process is positively
related to overall satisfaction” is supported by the Indonesian and Singaporean groups.
However, for the Japanese group, it shows that the Japanese‟s overall satisfaction is not
positively influenced by the total evaluation on services (coeffIndonesian = 0.24;
coeffSingaporean = 0.19; coeffJapanese = -0.15). The main hypothesis in this study, i.e.,
“affective process is positively related to overall satisfaction” shows that the Japanese
group (t-valJapanese = 8.42; coeffJapanese = 0.56) has the highest effect of affective process on
overall satisfaction, while Indonesian and Singaporean groups relatively rate the same (t-
valIndonesian = 4.73 & coeffIndonesian = 0.39; t-valSingaporean = 4.81 & coeffSingaporean = 0.43).
This confirms that Japanese tend to rely their overall satisfaction on
affect/emotion/Kansei rather than cognition. The more their emotions influenced, the
more satisfied they are. With respect to customer loyalty, the test on 6th
hypothesis
“overall satisfaction is positively related to behavioral intention” shows that all groups
relatively have the same significant effect of overall satisfaction on behavioral intention
(t-valIndonesian = 5.61; t-valSingaporean = 8.93; t-valJapanese = 5.67). This finding confirms that
the inclusion of affective process, as a complement of cognitive process, enhances the
variation explained in customer loyalty (see Yu and Dean (2001), Ladhari (2009)).
Though affective and cognitive processes are independent, direct impact of affective
process on overall satisfaction in this present study is more significant than direct effect

Chapter 10 Discussion
153
of cognitive process on overall satisfaction. It is apparent that the role of affective process
during service encounter should be of the utmost interest to researchers and practitioners.
This study also discusses an integrative framework of KE incorporating service
quality tools. The Kano model with a focus on attractive category (delighter) is utilized.
The Kano‟s attractive category is of interest to fulfill customer emotional needs/Kansei
and to maximize customer overall satisfaction. According to Yang (2011), this attractive
attribute provides several benefits, such as no risk if there is any discrepancy and as a
source of differentiation and customer loyalty driver. Strong attractive attribute should be
further developed as inputs for innovativeness (Tan and Pawitra, 2001). Collins and
Porras (2004) argue that it is essential to invest in proactive and generative markets which
are reflected by customer delight. By using stepwise linear regression, what
emotions/Kansei elicited and impacted by particular perceived service attributes are
investigated, modeled and evaluated. It explains that a certain Kansei word is
significantly influenced by one or more service attributes. In other words, a service
attribute may have impact on one or more Kansei words. The more the Kansei words are
significantly influenced, the more important is the services attribute.
The other two Kano categories (i.e., one-dimensional [O] and must-be [M]) are
considered as the primary features to be satisfied on a regular basis. According to
Maslow (1943), one-dimensional and must-be qualities are positioned under the self-
actualization level. Related to Herzberg (1968), these two common Kano attributes are
mostly categorized as hygiene factors. Yang (2011) argues that these two attributes are
less sensitive and satisfaction-driving attributes, apart from delighter. As a consequence,

Chapter 10 Discussion
154
they are unlikely to be associated with strong emotions such as delight (Hartono and Tan,
2011).
The integration of KE and other methods in the field of quality design has been
initially addressed by Lanzotti and Tarantino (2008). There is no formal methodology,
however, to investigate the contribution of Kano model on the KE methodology. This
current study reports how the Kano model contributes to KE methodology by providing
the finding of case study that involving Singaporean and Indonesian subjects. As
discussed in Chapter 8.5.1, the result shows that up to 30 percent of the service attributes
are categorized as attractive quality (A), i.e., 13 out of 39 for Indonesians and 11 out of
37 for Singaporeans. For Indonesia, there are three items categorized as attractive quality
(A) within “reliability” dimension. They discusss and share a common issue, i.e.,
correctness and sureness. Since most of tourists were on vacation, it is highly understood
that they need a secure and certain place and surrounding.
This study postulates that the perceived service attributes/qualities impact on
emotions/Kansei response. By using multiple regression analysis, Kansei words were
linked to attractive service attributes. The most significant model is for Kansei words
“welcomeness” (p-value ≤ 0, R2 = 0.293) and “cleanliness” (p-value ≤ 0, R
2 = 0.277) for
Indonesian and Singaporean, respectively. By observing the model coefficients, in
Indonesian group, it is concluded that the service attribute “the employees are
consistently courteous with you” (coefficient = 0.599) has a slightly greater effect on the
Kansei word “welcomeness” than other Kansei words. Whereas, in Singaporean group,
the attribute “the bedroom and bathroom are clean and convenient” is shown to have a
greater effect on the Kansei “cleanliness” (coefficient = 0.348). In general, it shows that

Chapter 10 Discussion
155
the attribute “the employees are never too busy to respond to your requests” should be
given the first priority for continuous improvement for Indonesian and Singaporean
tourists. Intensive regular training in areas such as character building, leaderships,
communication skills and customer focus are encouraged. In addition, the hotel
management should assure a sufficient number of staffs and employees equipped with
relevant knowledge and professionalism. In order to be customer conscious, a campaign
slogan (such as „always there for customer‟) may be useful for daily awareness to all
hotel staffs and employees.
In order to engage customer loyalty and satisfaction in the future, Markov chain
model and HOQ are adopted to integrate with the KE framework. This is to investigate
what service attributes are still important in the future. As a result, there is different
strategy to deal with different groups of customer. As discussed in Chapter 9.4.3, it
shows that there are three service attributes still important in the future for Indonesian
tourists, i.e., “the outdoor environment is visually clean”, “the employees are never too
busy to respond to your requests” and “the employees are consistently courteous with
you”. Using HOQ methodology, service item “the employees are never too busy to
respond to your requests” is given the greatest priority for improvement. The proposed
improvement strategy relates to personnel management, general affair management,
employee training, complaint responses and information services. While for Singaporean,
the result shows that the attribute “the hotel has employees who give you personal
attention” was given the most interesting attribute in the future state. It is highly related to
the managerial strategies such as personnel management, employee training and
Customer Relationship Management. It can be concluded that in order to achieve total

Chapter 10 Discussion
156
customer satisfaction in the future, intensive training to all employees is given the
greatest priority in luxury hotel services (see Chapters 9.4.3 and 9.5).
The relationship model between Kansei words, related service attributes and
design elements (as shown in HOQ, see Chapter 9.4.3) have been highlighted. This is to
show how proposed improvements are connected to the specific customer emotional
needs. To support more complete Kansei model, regression model of Kansei and service
attribute for Japanese is provided (see Table 10-1 and Table 10-2). In addition, a small
survey that was involving 15 respondents (i.e., 5 Indonesians, 5 Singaporeans and 5
Japanese) was conducted to confirm and verify the suitable suggested design elements
and improvements. These participants have stayed in luxury hotel in the last 2 year
period.
Table 10-1 Significant regression model for each Kansei word for Japanese tourist
With respect to the future customer preference as discussed in Chapter 9,
additional survey was conducted. The service attributes that have no significant
difference between the current level of importance and the future expected weight are
incorporated into house of quality (HOQ). The additional survey for Singaporean and
Indonesian samples was subjected to the analysis of proposed managerial strategies as

Chapter 10 Discussion
157
shown in HOQ (see Figures 9-4 and 9-5). While the additional survey for Japanese was
based on the Kansei model as shown in Table 9-2. The prioritized managerial strategies
based on the additional survey is provided in Table 9-3. In general, Japanese tourist will
be satisfied by the provision of improved “tangible” service quality, while the Indonesian
and Singaporean tourists are more focused on “employee-related” service quality.
Table 10-2 The significant relationship between service attribute and Kansei word
for Japanese
Through the case study involving three different groups (i.e., Indonesian,
Singaporean and Japanese tourists), it is shown and confirmed that affective
process/Kansei plays important role in service experiences. The direct impact of affective
process on overall satisfaction is found to be more significant than cognitive process on
overall satisfaction. Among three different cultural differences, there is one interesting
common finding. It shows the importance of Kansei/affective process as a complement of
cognitive process in impacting overall satisfaction.

Chapter 10 Discussion
158
Table 10-3 Prioritized managerial strategies in dealing with future customer needs
Under the same services (i.e., luxury hotel services), each group of customers
shares different important Kansei. Japanese tends to dominate all Kansei responses. As
compared to Indonesian and Singaporean counterparts, Japanese tourists are more affect-
oriented/Kansei minded. Japanese (both males and females) perceive luxury hotels
where they stay as a very clean and quiet place (see Chapter 7.6.2). This is supported by
their dominant culture dimension on “uncertainty avoidance” (Hofstede and Bond, 1988).
Whilst Indonesian and Singaporean share a common Kansei “elegant”. According to
Hofstede and Bond (1988), Indonesian and Singaporean have a common culture
dimension of “power distance”. Different cultures may exhibit the greatest influence on

Chapter 10 Discussion
159
perception, information strategies, cognitive structures and the intensity of wants and
needs (Overby et al., 2005).
Based on the discussions above, this study summarizes the connection between
research motivation/research gap, research question/objective, study data, findings and
contributions as shown in Table 10-4.
Table 10-4 The summary of research findings
Motivation/research
gap
Research
question/objective
Study/data Findings Contributions
Gap #1: Lack of
KE methodology to
services
Question #1: What
is the
interrelationship
among constructs of
KE methodology
during service
encounter?
Study #1: Preliminary study in
Indonesia (Chapter
4)
The proposed design
elements/service attributes
influence customer Kansei
and increase customer
satisfaction. Interview and
affinity diagram are found
to be the common tools to
capture and structure
customer Kansei.
The findings of this study
provide and pave the way
for the main study on luxury
hotels (more complex
services) as discussed in
Chapter 5 onwards.
Study #2:
Development and
testing of the survey
instrument (Chapter
5)
Case study and survey
were used as the main
research strategies.
Personal interviewing and
face-to-face questionnaire
were utilized to collect
data.
Kansei words were
developed and integrated
to the questionnaires.
Afterwards, pilot test was
conducted, and its result
was analyzed.
The findings of this study
were utilized as a foundation
for main data collection that
including all potential
tourists from Indonesia,
Singapore and Japanese who
stayed in luxury hotel (4-star
and 5-star hotels).
Study #2:
Preliminary study of
Kansei Engineering
general framework
in services (Chapter
6)
Significant relationships
among six constructs
(hypotheses) of KE
application in services
using correlation analysis.
This study utilized data
from Indonesian and
Singaporean subjects. As a
very interesting finding,
this study reports that
affective process (ρSingapore
= 0.576 with p < 0.01,
ρIndonesia = 0.456 with p <
0.01) is more important
than the cognitive process
(ρSingapore = 0.451 with p <
0.01, ρIndonesia = 0.355 with
The finding of this study is
in line with what KE
concerns. The effect of
affective process/Kansei on
hospitality sectors is of
interesting attention to
service providers/managers.
This study gives a
foundation for further
complex analysis by
incorporating more samples
(i.e., Indonesian,
Singaporean and Japanese)
and sophisticated methods
(i.e., Partial Least Square,
Kano‟s model, Markov
chain and QFD).

Chapter 10 Discussion
160
p = 0.012) in influencing
customer overall
satisfaction. In addition to
the customer loyalty,
Singaporean is found to be
more loyal than
Indonesian.
Study #2: Testing
the hypotheses of
Kansei Engineering
application to
services using PLS
method (Chapter 7)
Six hypotheses described
by SEM were tested by
evaluating the significance
of t-value for the path
coefficients as the output
of bootstrap function of
the SmartPLS 2.0 with
200 resample. This study
highlights empirical
evidence that affective
process (Kansei) plays an
important role in service
experiences. Though
affective and cognitive
processes are independent,
direct impact of affective
process on overall
satisfaction in this present
study is more significant
than direct effect of
cognitive process on
overall satisfaction. It is
apparent that the role of
affective process during
service encounter should
be of the utmost interest to
researchers and
practitioners.
By incorporating an
empirical study involving
three different subjects (i.e.,
Indonesian, Singaporean
and Japanese tourists), this
study shows the rationale
and the application of partial
least square (PLS)
estimation approach to
structural equation
modeling. It is hoped that
the study can provide a
useful framework for other
researchers who may
conduct a similar research in
different service settings and
domains.
Question #2: How
to incorporate
service quality tools
(e.g., the Kano
model, QFD and
Markov chain) into
the KE methodology
in services?
Study #3:
Integrating the
effects of Kano
model in Kansei
Engineering
(Chapter 8)
Since KE is able to be
integrated with other
innovative method, the
Kano model is considered.
It is one of methods to
understand product/service
performance based on
customer evaluation. The
Kano model helps to
identify different
categories of service
attribute quality. The
Kano‟s attractive (A)
category is of interest to
fulfill customer emotional
needs/Kansei and to
maximize customer
overall satisfaction. More
specifically, the attribute
“the employees are never
This study provides a
theoretical contribution to
the academic literature on
Kansei ergonomics and
service quality, i.e., how
Kano‟s model contributes to
KE methodology.
Practically, it provides a
guideline for service
managers/providers in
investigating which service
attributes are significantly
sensitive to customer
delights and given a priority
for improvement or
maintenance.

Chapter 10 Discussion
161
too busy to respond to
your requests” should be
given the first priority for
continuous improvement.
Intensive regular training
in areas such as character
building, leaderships,
communication skills and
customer focus are
encouraged.
Gap #2: Very little
attention paid to the
dynamics of
customer
preferences in the
steady-state
condition
Question #4: How
to deal with
dynamics of
customer
preferences in the
steady-state
condition and any
implications for
marketing strategy?
Study #4: Using
Markov chain model
to analyze future
customer
preferences
(Chapter 9)
In order to promote the
long-term behavior of
customers‟ preferences to
certain services, a limiting
distribution and a
stationary distribution are
used. By incorporating
Kano‟s categorization,
Kansei model and Markov
chain that involving
Indonesian and
Singaporean subjects,
the most preferred service
item in the steady-state
was “the atmosphere of
restaurant is inviting
appetite” (for Indonesia)
and “the hotel provides a
safe environment” (for
Singapore). By
considering managerial
strategy using HOQ, this
finding was justified. The
attribute “the employees
are never too busy to
respond to your request”
(for Indonesian) and “the
hotel has employees who
give you personal
attention” (for
Singaporean) were rated to
be the most interesting and
important in the future.
Thus, intensive training to
all employees is given the
greatest priority.
Practically, the use of
Markov chain can provide
valuable information for a
manager or a decision maker
to understand how the
dynamics of customer needs
(i.e., service attributes) as
time goes by from a
probability viewpoint. It is
expected to provide a
valuable guideline for a
manager in setting up an
appropriate business or
managerial strategy in the
early stage.
Gap #3: Very little
attention paid to
cultural differences
on Kansei
Question #3: How
does cultural
difference influence
customers‟ Kansei in
services?
Study #2: Testing
the hypotheses of
Kansei Engineering
application to
services using PLS
method (Chapter 7)
In general, Japanese
tourists (both males and
females) were more
Kansei-oriented.
Specifically, they
perceived luxury hotels
where they stayed as a
very clean and quiet place.
While Indonesian and
Singaporean perceived it
As different cultural
differences have been
considered and analyzed,
this study can provide an
idea on how to understand
customer emotional
needs/Kansei better.
Performing a Kansei
evaluation to understanding
cultural differences (i.e.,

Chapter 10 Discussion
162
as a very elegant place.
Their view are influenced
by cultural dimension. In
general, Japanese‟s view
on luxury hotel was
affected by the dimensions
of “uncertainty
avoidance”, “masculinity”
and “long-term
orientation”. While,
Singaporean and
Indonesian were
influenced by cultural
dimension “power
distance”.
different nationalities
involving Indonesian,
Singaporean and Japanese)
may yield valuable insights
for international tourist
marketing strategies.

Chapter 11 Conclusion and recommendation
163
11 Conclusion and recommendation
In this chapter, theoretical, methodological and managerial implications are presented. In
addition, the limitations of this study and future research recommendations are discussed.
11.1 Introduction
Trends in the 21st century are hedonisms, pleasures and emotions of delights.
Delighting customers is an essential key for achieving total emotional satisfaction and
customer retention. It requires positive impressions and delights beyond customer
expectation.
Kansei Engineering (KE) has shown its superiority to deal with customer Kansei.
This method is able to capture customer emotional needs and to translate them into
product elements. It is then continued to build a mathematical model that represents the
relationships between Kansei and product elements/service attributes.
As quality control has been intensively introduced in the service industries, it is a
great opportunity to apply KE to services, apart from physical products. The application
of KE to hospitality services is recognized as Kansei quality management (KQM)
(Nagamachi and Lokman, 2011).
Cost constraint is highly considered in providing services according to what the
customers need. It is a trade-off (compromise) for the companies/service providers while
providing demanded/expected services. Realistic cost for Kansei design is expected.
What should be focused is the existing service attributes with attractive/delightful (A)
Kano category. For continuous improvement purpose, they should follow realistic cost.
What may be abandoned or postponed is that additional unrealistic service attributes due
to unrealistic demands from customers. These needs may not in line with company‟s

Chapter 11 Conclusion and recommendation
164
vision and mission. The managerial implication is given as follows. All customer
demands should be checked and confirmed with service providers/decision makers in
terms of costing/budget.
11.2 Contribution to theory
This study provides a well grounded theoretical contribution to the academic
literature on Kansei ergonomics, service science, quality management and cultures. This
study is hoped to be the pioneer of research that incorporating customer emotional
needs/Kansei into services. Evaluation of service experience and encounter should
include reference to the affective process of the service experience in addition to the
traditional cognitive evaluation. This study enriches the understanding of antecedences of
customer emotions during pre- and post-service encounters.
By utilizing relevant service quality tools into KE methodology, it will strengthen
the usefulness of KE in dealing with customer emotional needs. For instance, the use of
Kano model in KE will support a function of improvement strategy with regard to service
quality performance. A case study that involved several different population groups
shows that Kansei is influenced significantly by cultural differences and backgrounds.
The expectation and perception of service quality are highly influenced by culture values
as well.
11.3 Contribution to methodology
As one of the powerful consumer-oriented tools in product development, the
future growth of KE makes it necessary to identify suitable tools and to embrace
methodology how different tools can work together to quantify the impact a certain
product property has on the users‟ emotional needs (Schütte et al., 2004).

Chapter 11 Conclusion and recommendation
165
First, this study presents the integration of Kano‟s model and KE. As reviewed,
recent research in KE lacks of relationship between product/service performance and
customer emotional needs/Kansei. This integrative framework promotes the Kano model
incorporated into the systematic KE methodology with a focus on
attractive/delighting/exciting quality of service attribute. An attractive attribute is found
to have the greatest influence on customer Kansei. In addition, it is the first step of
prioritization of service quality improvement with regard to limited resources (e.g.,
budget, time, workforce and other technical reasons). Since the domain of study is luxury
hotel which potentially gives more influence on customer emotions, the appropriate
strategies should be applied to win the business competition. They include how to always
stand out and focus on attractive requirements, and to fulfill all basic/must-be and
proportional/one-dimensional requirements in regular basis.
Second, this study also proposes the integration of Markov chain and QFD into
KE for future improvement strategy. In order to give a clearer picture of how Kansei
model and the Kano categorization taken into account holistically, HOQ is incorporated
in the integrative framework. Hence, some supporting tools and techniques are involved
to strengthen and enhance the robustness of KE methodology due to market and system
dynamics.
11.4 Contribution to practice
The proposed integrative framework of KE in this study can be utilized as a
guidance to explore, capture and translate customer emotional needs in many services in
order to achieve customer satisfaction and loyalty. As a result, it may generate more
profits for service providers. Service as one of the fastest growing sectors in today‟s

Chapter 11 Conclusion and recommendation
166
competitive business will be more benefited by adopting such framework. The success
stories of KE application on products (e.g., Mazda Miata, Wacoal, LCD Sharp
(Nagamachi, 1995) may be potentially followed by the success on services.
Specifically, in the Kano and KE model, a practical contribution is presented by
giving a guideline for service managers in investigating which service attributes are
significantly sensitive to customer delights and in giving a priority for improvement or
maintenance. Its practical impacts can be large as service is the fastest growing sector in
today‟s businesses.
In addition, by incorporating Markov Chain and QFD, it provides valuable
information for managers/decision makers to understand how the dynamics of customer
needs (i.e., the importance of service attributes) as time goes by, so that an appropriate
strategy can be prepared at the early stage. More importantly, service managers should
understand different needs of customers from different cultural backgrounds so that they
can offer various operational strategies.
11.5 Limitations of this study
This research is subject to limitations. The main study covers only services on
luxury hotels. In order to achieve common findings, other rapid growing and propective
service industries should be considered. Another limitation is that this study sampled only
Indonesian, Singaporean and Japanese tourists. These samples only represent most Asian
population perspectives.
11.6 Recommendation for future research
Though a comparative finding is presented in this current study, future research
may take into account in-depth study of the effect of cultural dimension on Kansei and

Chapter 11 Conclusion and recommendation
167
perceived service performance. The future study may include many sources of
information by involving potential stakeholders (such as customers, managers,
government and employees).
Apart from Kansei words, further study may consider more sophisticated tools in
capturing and measuring customer Kansei such as Electroencephalography (EEG),
Electromyography (EMG) or other relevant psychological measurement methods.
Another potential hospitality sector can be considered in analyzing customer
Kansei, such as educations, food industries and high-end tourism industries. These
considerations of service settings are essential to verify the validity of the proposed
integrative framework in services.
During customer-employee interaction in Kansei study, inherently, customer
satisfaction is quite related to the employee satisfaction. The focus of customer
satisfaction requires the interactions between front-line employees and customers in order
to be a pleasant experience, especially for the customers. Empowered, satisfied and
highly motivated employees can perform such things depend on the quality of
organization and working places.
Cook et al. (2002) highlight the importance of the role of service employees‟
well-being in determining service quality which is perceived by the customers (see Figure
11-1).
Figure 11-1 Service profit chain

Chapter 11 Conclusion and recommendation
168
Tasks that fit employees‟ mental or cognitive workload and physical abilities can produce
a more productive service. Hence, employee perception of organizational climate and
work content determine customer satisfaction.
Stressful workplace leads to job dissatisfaction. In hotel environments,
workplaces may refer to the dimension of working desk and seat for receptionists, the
height of bed, the dimension of cleaning stuffs and the dimension of pantry, et cetera.
Any physical discomfort is closely related to the anthropometric consideration of
employees‟ body segments and environmental factors (see Figure 11-2).
Traditional interventions alone (e.g., training, awareness, ergonomics, technical
safety programs) are insufficient to reduce injuries and accidents (Imada, 2002). Systemic
performance that includes employees‟ safety and satisfaction should be addressed
holistically.
In Macroergonomics, body movement and thinking during work and complicated
jobs enrich employee‟s skill, motivation and satisfaction (Nagamachi, 2002). Referring to
Maslow (1943), when people‟s basic physical and security needs are met, they want to
achieve self-development and self-actualization. They want to challenge their
organizational problems. In other words, they want to create self-organizing behavior
which focuses on solving problems originating both inside and outside the organization.
Nagamachi (2002) provides a good example of an adaptive self-organizing work system.
In a case study on Suntory Whisky Corporation, the company allows all workers to
discuss ways to settle each person‟s multiple roles and train themselves for improving
productivity in their multiple roles. It promoted a new organizational structure called as
“amoeba-type organization” which implies an autonomous problem-solving group and

Chapter 11 Conclusion and recommendation
169
brings satisfaction to all workers. As a result, the company achieves higher efficiency,
productivity, personnel savings, and increased employee satisfaction.
Related to reducing work-related injuries, Macroergonomics approach suggests
that accidents are the result of an interface between workers and their environment
(Imada, 2002). These might include: (i) situation-based factors (e.g., a wet work surface,
complicated work station et cetera), (ii) management-based factors (e.g., failures in
communication, leadership et cetera) and (iii) human-based factors (e.g., emotional
states, attention, distractions et cetera). A macroergonomics approach to improving
safety needs to address more than one set of factors.
In regard to anthropometric research, employee involvement takes place. Many of
the ergonomic improvements come from employees‟ ideas for reducing injuries.
According to Imada (2002), some improved changes may include improving equipment
and plant reliability, redesign the equipment, implementing a participatory ergonomic
redesign strategy to make modifications, and et cetera.
The current anthropometric data for Singaporean and Indonesian populations (see
Tan and Hartono, 2010) can be utilized to analyze the current condition of workplace
dimensions (see Table 11-1). Thus, further research on analysis of factors that influence
employee/job satisfaction can be taken into consideration. It may cover task analysis,
macro-ergonomics (e.g., balance work theory and participative ergonomics) and other
HFE topics such as interface design, function allocation and workplace design.

Chapter 11 Conclusion and recommendation
170
Figure 11-2 Framework of employee comfort, job satisfaction, and customer
satisfaction
Table 11-1 Anthropometric data for Singaporean males (Tan and Hartono, 2010)
Dimension** Overall Citizens Chinese Only
5th 50th 95th SD* 5th 50th 95th SD* 5th 50th 95th SD*
Stature 165 174 183 5.75 166 174 182 5.17 165 173 181 5.45
Eye height 153 163 172 6.67 153 163 169 5.03 153 162 169 5.25
Shoulder height 136 145 153 5.36 136 144 151 4.78 136 143 151 4.88
Elbow height 103 110 116 4.05 104 110 114 3.55 103 109 114 3.54
Hip height 86 97 106 5.42 85 97 104 5.32 85 96 104 5.57
Knuckel height 69 75 81 3.47 70 75 81 3.24 70 75 81 3.37
Fingertip height 61 65 71 3 61 65 68 2.69 61 65 68 2.82
Sitting height 84 90 96 4.38 84 90 96 3.43 85 90 97 3.37
Sitting eye height 73 78 83 4.9 73 77 83 4.24 73 78 83 4.53
Sitting shoulder height 55 61 67 4.49 55 61 66 3.34 55 61 67 3.42
Sitting elbow height 18 24 30 5.43 17 24 30 6.12 17 25 30 6.82
Thigh thickness 12 15 19 2.54 12 15 19 1.79 12 15 18 1.8
Buttock-knee length 53 57 63 3.34 53 57 63 2.85 53 57 61 2.52
Buttock-popliteal length 41 46 51 3.36 41 46 51 3.29 40 46 51 3.54
Knee height 49 54 58 2.89 50 54 58 2.93 50 54 57 3.05
Popliteal height 39 43 46 2.94 39 43 46 3.18 39 43 46 3
Shoulder breadth (bideltoid) 41 45 48 2.54 41 45 48 1.97 41 44 48 2.1
Shoulder breadth (biacromial) 31 37 43 3.59 31 37 42 3.5 31 37 41 3.26
Hip breadth 32 35 39 2.33 32 35 38 2 32 35 38 1.89
Chest (bust) depth 18 21 25 2.46 18 21 25 2.19 18 20 25 2.21
Abdominal depth 19 22 27 2.76 19 22 27 2.65 19 22 27 2.78
Shoulder-elbow length 33 37 43 5.99 33 37 43 7 32 37 43 7.85
Elbow-fingertip length 43 47 51 3.22 43 47 51 2.41 43 47 50 2.34
Upper limb length 70 76 82 3.55 71 76 81 3.17 71 76 80 3.01
Shoulder-grip length 60 66 72 3.37 61 66 71 3.01 61 66 71 2.95
Head length 18 19 21 1.08 18 19 21 1.03 18 19 21 1.08
Head breadth 15 17 19 1.03 15 17 18 0.99 15 17 18 1.02
Hand length 16 19 24 2.88 15 19 26 3.34 17 19 24 2.73
Hand breadth 8 9 10 0.67 8 9 10 0.58 8 9 10 0.57
Foot length 23 26 28 1.39 23 26 28 1.4 22 26 28 1.51
Foot breadth 9 10 11 0.55 9 10 11 0.53 9 10 11 0.57
Span 162 175 186 7.43 165 175 185 6.6 164 174 183 6.36
Elbow span 82 91 98 5.91 82 91 98 6.29 82 91 98 6.81
Vertical grip reach (standing) 194 208 224 15.28 196 208 223 15.1 195 207 221 16.46
Vertical grip reach (sitting) 117 124 132 5.39 117 124 131 4.39 117 123 131 4.5
Forward grip reach 70 75 80 3.25 70 75 80 3.16 70 74 79 3.21
Body weight (kg) 55.00 68.50 80.32 7.77 55.00 68.00 79.00 6.89 55.00 67.60 79.00 7.34 *standard deviation, **all dimensions in cm except for body weight

171
References
Aibinu, A.A., and Al-Lawati, A.M., 2010. Using PLS-SEM technique to model construction
organization‟s willingness to participate in e-bidding. Automation in Construction 19, 714-
724.
Akao, Y. and Mazur, G.H., 2003. The Leading Edge in QFD: past, present, and future.
International Journal of Quality & Reliability Management, 20(1), 20-35.
Anderson, D.R., Sweeney, D.J., Williams, T.A. and Martin, R.K., 2007. An introduction to
management science: quantitative approaches to decision making. UK: South-Western
College.
Arnold, K. and Burkhard, D., 2001. Kansei Engineering-From the Customers Point of View.
Special Report LiTH-IKP-R-1226, IKP, Linkoping.
Ashforth, B.E. and Humphrey, R.H. (1993), “Emotional labor in service roles: the influence of
identity”, Academy of Management Review, Vol. 18, No. 1, pp. 88-115.
Babakus, E. and Boller, G.W. (1992) “An empirical assessment of the SERVQUAL scale”,
Journal of Business Research, Vol. 24, pp. 253-268.
Babin, B.J., and Attaway, J.S., 2000. Atmospheric Affect as a Tool for Creating Value and
Gaining Share of Customer. Journal of Business Research 49, 91-99.
Barsky, J. and Nash, L., 2002. Evoking emotion: affective keys to hotel loyalty. Cornell Hotel
and Restaurant Administration Quarterly, 43, 39-46.
Bagozzi, R., 1994. Structural equation models in marketing research: basic principles. Principles
of Marketing Research 3, 1-7.
Bagozzi, R.P., Gurhan-Canli, Z., and Priester, J.R., 2002. The Social Psychology of Consumer
Behaviour. Philadelphia: Open University Press.
Barclay, D., Thompson, R., and Higgins, C., 1995. The Partial Least Squares (PLS) approach to
causal modeling: personal computer adoption and use as an illustration. Technology Studies 2
(2), 285-309.
Bergman, B. and Klefsjo, B., 1994. Quality from Customer Needs to Customer Satisfaction. New
York, McGraw-Hill.
Bitner, M.J., 1990. Evaluating service encounters: the effects of physical surroundings and
employee responses. Journal of Marketing 54, 69-82.
Bitner, M.J., 1992. Servicescapes: The Impact of Physical Surroundings on Customers and
Employees. Journal of Marketing 56, 57-71.
Block, R., 2007. Steve Jobs live – Apple‟s “The beat goes on” special event‟, available at:
http://www.engadget.com/2007/09/05/steve-jobs-live-apples-the-beat-goes-on-special-
event/17, access on: 6th August 2008.
Bolton, R.N. and Drew, J.H., 1991. A multistage model of customer‟s assessments of service
quality and value. Journal of Consumer Research 17, 375-384.
Boulding, W., Kalra, A., Staelin, R., and Zeithaml, V.A., 1993. A Dynamic Process Model of
Service Quality: From Expectations to Behavioral Intentions. Journal of Marketing Research
30, 7-27.
Bowen, J.T. and Shoemaker, S., 1998. Loyalty: a strategic commitment. Cornell and Hotel
Restaurant Administration Quarterly 39(1), 12-25.
Bowen, D.E. and Schneider, B., 1999. Understanding customer delight and outrage. Sloan
Management Review 41(1), 35.
Brady, M.K. and Cronin, J., 2001. Some new thoughts on conceptualizing perceived service
quality: a hierarchical approach. Journal of Marketing 65(2), 34-49.
Chen, K-S, Chiu, S-C, and Lin, F-C., 2007. Kansei Design with Cross Cultural Perspective.
Lecture Notes in Computer Science, Usability and Internationalization, HCI and Culture
4559, 47-56.

172
Chen, C.-C. and Chuang, M.-C., 2008. Integrating the Kano model into a robust design approach
to enhance customer satisfaction with product design. International Journal of Production
Economics 114, 667-681.
Cheng, X., 2000. Asian students‟ reticence revisited. System 28, 435-446.
Child, D., 1990. The essentials of factor analysis, second edition. London: Cassel Educational
Limited.
Chin, W.W., 1998. The partial least squares approach to structural equation modeling. In:
Marcoulides, G.A. (Ed.), Modern methods for business research. Erlbaum, Mahwah, NJ.,
295-336.
Chitturi, R., Raghunathan, R., Mahajan, V. (2008), “Delight by design: the role of hedonic versus
utilitarian benefits”, Journal of Marketing, Vol. 72, pp. 48-63.
Churchill, G., 1979. A paradigm for developing better measures for marketing constructs. Journal
of Marketing Research 16 (1), 64-73.
Collins, J. and Porras, J., 2004. Built to last: successful habits of visionary companies. New
York: Harper Collins Publishers.
Cook, L.S., Bowen, D.E., Chase, R.B., Dasu, S., Stewart, D.M., and Tansik, D.A., 2002. Human
issues in service design. Journal of Operations Management 20(2), 159-174.
Derbaix, C.M., 1995. The impact of affective reactions on attitudes toward the advertisement and
the brand: a step toward ecological validity. Journal of Marketing Research 32(4), 470-479.
Derbaix, C.M. and Vanhamme, J., 2003. Inducing word-of-mouth by eliciting surprise – a pilot
investigation. Journal of Economic Psychology 24(1), 99-116.
Desmet, P.M.A., 2004. Measuring emotions: Development and application of an instrument to
measure emotional responses to products. In: Blythe, M.A., Monk, A.F., Overbeeke, K., and
Wright, P.C. (Eds), Funology: from usability to enjoyment. Kluwers Academic Publisher.
Dewi, C., Hartono, M., and Goutama, B., 2007. Application of Kansei Engineering to increase
the comfort for members: case study at Warehouse Gym. Thesis (in Bahasa Indonesia),
Department of Industrial Engineering, University of Surabaya.
Drury, C.G., 1984. Emergency medical services: human and system reliability. Trav Hum 47(1),
75-88.
Drury, C.G., 2003. Service, quality, and human factors. AI & Society 17(2), 78-96.
Dube, L., and Morgan, M.S., 1998. Capturing the dynamics of in-process consumption emotions
and satisfaction in extended service transactions. International Journal of Research
Marketing 15, 309-320.
Dube, L., Cervellon M.-C., and Jingyuan, H., 2003. Should consumer attitudes be reduced to their
affective and cognitive bases? Validation of a hierarchical model. International Journal of
Research Marketing 20, 259-272.
Edell, J.A. and Burke, M.C., 1987. The power of feelings in understanding advertising effects.
Journal of Consumer Research 14(4), 421-433.
Edvardsson, B., 1997. Quality in new service development-key concepts and a frame of
reference. International Journal of Production Economics 52, 31-46.
Edvardsson, B., Gustafsson, A., and Roos, I., 2005. Service portraits in service research: a critical
review. International Journal of Service Industry Management 16(1), 107-121.
Efroymson, M.A., 1960. Multiple regression analysis. In: Ralston, A., Wilf, H.S. (eds.).
Mathematical Methods for Digital Computers. New York: Wiley, 191-203.
Falk, R.F. and Miller, N.B., 1992. A primer for soft modeling. The University of Akron Press,
Akron.
Falzon, P., 2000. Ergonomics and customer-operator interactions. Proceedings of the IEA
Congress. San Diego, 30 July – 4 August, 2000.
Fornell, C. and Larcker, D.F., 1981. Evaluating structural equation models with unobservable
variables and measurement error. Journal of Marketing Research, 18 (1), 39-50.

173
Fowler, Jr, F.J., 2009. Survey Research Methods. Applied Social Research Methods Series. 4th
edition, SAGE Publication, Inc.
Fukushima, K., Kawata, H., Fujiwara, Y., and Genno, H., 1995. Human sensory perception
oriented image processing in a color copy system. International Journal of Industrial
Ergonomics 15, 63-74.
Furrer, O., Liu, B., and Sudharshan, D., 2000. The relationships between culture and service
quality perceptions. Journal of Service Research 2(4), 355-371.
Gefen, D. and Straub, D., 2005. A practical guide to factorial validity using PLS-graph: tutorial
and annotated example. Communications of the AIS 16, 91-109.
Gorla, N., Somers, T.M., and Wong, B., 2010. Organizational impact of system quality,
information quality, and service quality. Journal of Strategic Information Systems 19, 207-
228.
Gronroos, C., 2001. Service Management and Marketing: A Customer Relationship Management
Approach. 2nd
edition, Willey, New York, NY.
Hall, E.T., 1969. The Hidden Dimension. Doubleday, Garden City, New York.
Hartono, M. and Tan, K.C., 2010. The role of Kansei Engineering in influencing overall
satisfaction and behavioral intention in service encounters. Proceedings of The 1st Southeast
Asian Network of Ergonomics Societies (SEANES) Conference. Cebu City, Philippines.
Hartono, M. and Tan, K.C., 2011. A proposed integrative framework of Kansei Engineering and
Kano model applied to services. Paper presented at the 2nd
International Research
Symposium on Service Management (IRSSM-2). July 26-30, 2011. Yogyakarta, Indonesia.
Helander, M. G., 2003. Hedonomics-affective human factors design. Ergonomics 46 (13/14),
1269-1272.
Helander, M. G. and Khalid, H. M., 2006. Affective and Pleasurable Design. In: Salvendy, G.
(ed.), Handbook of Human Factors and Ergonomics. 3rd
edition, New York: Wiley
Interscience, 543 – 572.
Hendrick, H., 1997. Organizational design and macroergonomics. In: Salvendy G (ed), Handbook
of Human Factors. Wiley, New York, 594-636.
Herzberg, F., 1968. One more time: How do you motivate employees? Harvard Business Review,
Jan-Feb 1968, 53-62.
Hertati, M., Hartono, M., and Gunawan, L.H., 2007. Designing Café in Surabaya using
application of Kansei Engineering. Thesis (in Bahasa Indonesia), Department of Industrial
Engineering, University of Surabaya.
Hofstede, G. and Bond, M.H., 1988. The Confucius connection: from cultural roots to economic
growth. Organizational Dynamics, 16(4), 4-21.
Holbrook, M.B. and Batra, R., 1987. Assessing the role of emotions as mediators of consumer
responses to advertising. Journal of Consumer Research 14(3), 404-420.
Holbrook, M.B. and Gardner, M.P., 1993. An approach to investigating the emotional
determinants of consumption durations: why do people consume what they consume for as
long as they consume it? Journal of Consumer Psychology 2(2), 123-142.
Hollins, B. and Shinkins, S., 2006. Managing Service Operations: Design and Implementation.
London: SAGE Publications Ltd.
Horiguchi, A. and Suetomi, T., 1995. A Kansei Engineering approach to a driver/vehicle
system. International Journal of Industrial Ergonomics 15, 25-37.
Hsieh, A.-H. and Tsai, C.-W., 2008. Does national culture really matter? Hotel service
perceptions by Taiwan and American tourists. International Journal of Culture, Tourism and
Hospitality Research, 3(1), 54-69.
Hsu, S.H., Chuang, M.C., and Chang, C.C., 2000. A semantic differential study of designers‟ and
users‟ product form perception. International Journal of Industrial Ergonomics 25, 375-391.
Huang, J.H., Huang, C.T., and Wu, S., 1996. National character and response to unsatisfactory
hotel service. International Journal of Hospitality Management, 15(3), 229-243.

174
Huang, A.H., Yen, D.C., and Zhang, X., 2008. Exploring the potential effects on emoticons.
Information & Management 45, 466-473.
Hulland, J., 1999. Use of partial least squares (PLS) in strategic management research: a review
of four recent studies. Strategic Management Journal 20, 195-204.
Husin, A., Hartono, M., and Arlianto, J.A., 2008. Application of Kansei Engineering in designing
home theater service. Thesis (in Bahasa Indonesia), Department of Industrial Engineering,
University of Surabaya.
Hutomo, W., Aryo, D., and Hartono, M., 2007. Feasibility study on Multiplayer Game/Game
Center using Kansei Engineering method. Thesis (in Bahasa Indonesia), Department of
Industrial Engineering, University of Surabaya.
Iglesias, V., 2004. Preconceptions about service – how much do they influence quality
evaluations? Journal of Service Research 7(1), 90-103.
Imada, A.S. (2002) “A Macroergonomic approach to reducing work-related injuries”, in
Hendrick, H.W. and Kleiner, B.M. (Eds) “Macroergonomics: Theory, Methods, and
Applications”, pp. 151-172.
Ishihara, S., Ishihara, K., Nagamachi, M. and Matsubara, Y., 1996. Neural network approach for
Kansei analysis on milk carton design. Proceedings of Human Factors in Organizational
Design and Management V. Breckenridge, USA: Elsevier Science B.V., 7–12.
Ishihara, S., 2001. Kansei Engineering Procedure and Statistical Analysis. Workshop at
International Conference on Affective Human Factors Design, Singapore.
Ishihara, S., Tsuchiya, T., Nagamachi, M., Nishino, T. and Ishihara, K., 2005. Catalytic effect of
Kansei Engineering system at collaborative design process. Paper presented at the 8th
International Symposium on Human Factors in Organizational Design and Management,
June 22-25, 2005, Maui, Hawaii, USA. North-Holland, 401-406.
Ishihara, S., Tsuchiya, T., Nagamachi, M., Ishihara, K. and Nishino, T., 2007. Kansei
Engineering system as a catalyst – an international empirical study. Paper presented at the 1st
European Conference on Affective Design and Kansei Engineering (ADKE‟07), June 18-20,
2007, Helsingborg, Sweden. Lund University Press (CD-ROM), 8 pages.
Izard, C, 1977. Human emotions. New York: Plenum.
Khalid, H. M. and Helander, M. G., 2006. Customer Emotional Needs in Product Design.
Concurrent Engineering: Research and Applications 14(3), 197-206.
Kano, N., Seraku, N., and Takahashi, F., 1984. Attractive quality and must be quality. Quality
14(2), 39-44.
Kim, M.-H. and Lee, H.-H., 2006. Determinants of TOEFL Score: A Comparison of Linguistic
and Economic Factors. Korea and the World Economy V Conference.
Komazawa, T. and Hayashi, C., 1976. A statistical method for quantification of categorical data
and its applications to medical science. In F. T. de Dombal and F. Gremy (Eds), Decision
Making and Medical Care. North-Holland Publishing Company.
Kotler, P., Bowen, J.T., and Makens, J.C., 2003. Marketing for hospitality and tourism. Prentice-
Hall, Inc., Upper Saddle River, NJ.
Krippendorff, K., 1995. On the essential contexts of artifacts or on the proposition that „design is
making sense (of things). In: Margolin, V. and Buchanan, R. (Eds.), The Idea of Design. MIT
Press, Cambridge, 156-184.
Ladhari, R., 2009. Service quality, emotional satisfaction, and behavioral intentions: A study in
the hotel industry. Managing Service Quality 19(3), 308-331.
Lai, H.-J. and Wu, H.-H., 2011. A case study of applying Kano‟s model and Anova technique in
evaluating service quality. Information Technology Journal 10 (1), 89-97.
Lanzotti, A. and Tarantino, P., 2008. Kansei engineering approach for total quality design and
continuous innovation. The TQM Journal 20, 324-337.

175
Laros, F.J.M. and Steenkamp, J.-B.E.M., 2005. Emotions in consumer behavior: a hierarchical
approach. Journal of Business Research 58, 1437-1445.
Lazarus, R.S., 1999. Emotions and Adaptation. Oxford University Press, New York, Oxford.
Lee, S.F., Lo, K.K., Leung, R.F. and Sai, A.O.K., 2000. Strategy formulation framework for
vocational education: integrating SWOT analysis, balanced scorecard, QFD methodology and
MBNA education criteria. Managerial Auditing Journal 15(8), 407-423.
Lee, Y.-H. and Chen, T.-L., 2006. A Kano two-dimensional quality model in Taiwan‟s hot spring
hotels service quality evaluations. Journal of American Academy of Business 8 (2), 301-306.
Liljander, V. and Strandvik, T., 1997. Emotions in service satisfaction. International Journal of
Service Industry Management 8(2), 148-169.
Lin, I.Y., 2004. Evaluating a servicescape: the effect of cognition and emotion. Hospitality
Management 23, 163-178.
Lin, J-S. C., and Lin, C-Y. (2011), “What makes service employees and customers smile:
antecedents and consequences of the employees‟ affective delivery in the service encounter”,
Journal of Service Management, Vol. 22, No. 2, pp. 183-121.
Llinares, C. and Page, A.F., 2011. Kano‟s model in Kansei Engineering to evaluate subjective
real estate consumer preferences. International Journal of Industrial Ergonomics, 41, 233-
246.
Lottum, C.V., Pearce, K., and Coleman, S., 2006. Features of Kansei engineering characterizing
its use in two studies: men‟s everyday footwear and historic footwear. Quality and Reliability
Engineering International 22, 629-650.
Lovelock, C., 1991. Services Marketing. Prentice-Hall, Englewood Cliffs, NJ.
Lovelock, C. and Wirtz, J., 2007. Services marketing: people, technology, strategy. Upper Saddle
River, N.J.: Pearson/Prentice Hall, 6th edition.
Man, J.P., Weinkauf, J.G., Tsang, M., and Sin, D.D., 2004. Why do some countries publish more
than others? An international comparison of research funding, English proficiency and
publication output in highly ranked general medical journals. European Journal of
Epidemiology 19, 811-817.
Mano, H., 1991. The structure and intensity of emotional experiences: method and context
convergence. Multivariate Behavioral Research 26(3), 389-411.
Mano, H. and Oliver, R. L., 1993. Assessing the dimensionality and structure of the consumption
experience: evaluation, feeling, and satisfaction. Journal of Consumer Research 20(3), 451–
466.
Maslow, A.H., 1943. A theory of human motivation. Psychological Review 50, 370-396.
Mattila, A.S., 1999. The role of culture in the service evaluation process. Journal of Service
Research, 1(3), 250-261.
Mattila, A.S. and Enz, C.A. (2002), “The role of emotions in service encounters”, Journal of
Service Research, Vol. 4, No. 4, pp. 268-277.
Matzler, K. and Hinterhuber, H.H., 1998. How to make product development projects more
successful by integrating Kano‟s model of customer satisfaction into Quality Function
Deployment. Technovation 18(1), 25-38.
Mazur, G.H., 2005. Lifestyle QFD: Incorporating emotional appeal in product development. The
17th Symposium on Quality Function Deployment 2005, Portland.
Mehrabian A. and Russell, J.A., 1974. An approach to environmental psychology. Cambridge,
MA: MIT Press.
Mikulić, J. and Prebežac, D., 2011. A critical review of techniques for classifying quality
attributes in the Kano model. Managing Service Quality 21 (1), 46-66.
Mooney, C.Z. and Duval, R.D., 1993. Bootstrapping: a non parametric approach to statistical
inference. Sage university paper series on quantitative applications in the social sciences, 07-
095. Sage, Newbury Park, CA.

176
Nagamachi, M., 1991. An image technology expert system and its application to design
consultation. International Journal of Human-Computer Interaction 3(3), 267-279.
Nagamachi, M., 1995. Kansei Engineering: a new ergonomic consumer-oriented technology for
product development. International Journal of Industrial Ergonomics 15, 3–11.
Nagamachi. M. and Imada, A.S., 1995. Kansei Engineering: an ergonomic technology for product
development. International Journal of Industrial Ergonomics 15, 1.
Nagamachi, M., 1997. Kansei Engineering: the framework and methods. In: M. Nagamachi (Ed.),
Kansei Engineering 1. Kure: Kaibundo Publishing, 1–9.
Nagamachi, M., 1999. Kansei engineering: the implication and applications to product
development. IEEE Systems, Man, and Cybernetics (SMC) International Conference
Proceedings 6, 273-278.
Nagamachi, M., 2001. Kansei Engineering. Workshop on International Conference on Affective
Human Factors Design, Singapore.
Nagamachi, M., 2002a. Kansei engineering in consumer product design. Ergonomics in Design -
The Quarterly of Human Factors Applications, 10(2), 5-9.
Nagamachi, M., 2002b. Kansei engineering as a powerful consumer-oriented technology for
product development. Applied Ergonomics 33, 289-294.
Nagamachi, M., 2002c. Job Design, Macroergonomics and Productivity, in Hendrick, H.W. and
Kleiner, B.M. (Eds) “Macroergonomics: Theory, Methods, and Applications”, pp. 111-131.
Nagamachi, M., Ishihara, S., and Nakamura, M., Morishima, K., 2009. Kansei engineering and its
application to developing new preventing bedsore mattress. Proceedings of 17th IEA 2009
Ergonomics World Congress, Beijing, China.
Nagamachi, M. and Lokman, A.M., 2011. Innovation of Kansei Engineering. CRC Press, Taylor
& Francis Group.
Nagasawa, S. Y., 2002. Kansei and Business. International Journal of Kansei Engineering 3, 2-
12.
Norman, D. A., 2004. Emotional Design: Why Do We Love (or Hate) Everyday Things. New
York: Basic Books.
Nunnally, J.C., 1978. Psychometric theory. McGraw-Hill, New York.
Nyer, P.U., 1997. A study of the relationships between cognitive appraisals and consumption
emotions. Journal of the Academy of Marketing Science 25(4), 296-304.
Oliver, R.L., 1980. A cognitive model of the antecedents and consequences of satisfaction
decisions. Journal of Marketing Research 17, 460-469.
Oliver, R.L., 1993. Cognitive, affective, and attribute bases of the satisfaction response. Journal
of Consumer Research 20, 418-430.
Oliver R.L. (1994), “Conceptual Issues in the Structural Analysis of Consumption Emotion,
Satisfaction, and Quality: Evidence in a Service Setting”, Advances in Consumer Research,
Vol. 21, pp. 16-22.
Oliver, R.L. and Westbrook, R.A., 1993. Profiles of consumer emotions and satisfaction in
ownership and usage. Journal of Consumer Satisfaction, Dissatisfaction and Complaining
Behavior 6, 12-27.
Oliver, R.L., Rust, R.T., and Varki, S., 1997. Customer delight: foundations, findings, and
managerial insight. Journal of Retailing 73(3), 311-336.
Olney, T.J., Holbrook, M.B., and Batra, R., 1991. Consumer responses to advertising: the effects
of ad content, emotions, and attitude toward the ad on viewing time. Journal of Consumer
Research 17(4), 440-453.
Osgood, C.E., Suci, G.J., and Tannenbaum, P.H., 1957. The measurement of meaning. Illinois:
University of Illinois Press.
Osgood, C. E. and Suci, G. J., 1969. Factor analysis of meaning. In C. E. Osgood and J. G. Snider
(Eds), Semantic differential technique. Chicago: Aldine publishing company, 42–55.

177
Overby, J.W., Woodruff, R.B., and Gardial, S.F., 2005. The influence of culture upon consumers‟
desired value perceptions: a research agenda. Marketing Theory 5(2), 139-163.
Parasuraman, A., Berry, L.L., and Zeithaml, V.A., 1988. SERVQUAL: A multiple-item scale for
measuring consumer perceptions of service quality. Journal of Retailing 64(1), 12-40.
Parasuraman, A., Berry, L.L., and Zeithaml, V.A., 1991. Refinement and reassessment of the
SERVQUAL scale. Journal of Retailing 67(4), 420-450.
Pawitra, T.A. and Tan, K.C., 2003. Tourist satisfaction in Singapore – a perspective from
Indonesian tourists. Managing Service Quality 13(5), 399-411.
Pedhazur, E.J., 1982. Multiple regression in behavioral research: explanation and prediction. 2nd
ed. Harcourt Brace, Fort Worth, TX.
Perry, B., Woodland, C.L., Miller, C.W. (2004) “Creating the customer connection:
Anthropological/Ethnographic Needs Discovery”, in Belliveau, P., Griffin, A., and
Somermeyer, S. (Eds), “The PDMA ToolBook 2 for New Product Development”, New
Jersey: John Wiley & Sons, Inc.
Philips, D.M. and Baumgartner, H., 2002. The role of consumption emotions in the satisfaction
response. Journal of Consumer Psychology 12(3), 243-352.
Picard, R., 1997. Affective computing. Cambridge: The MIT Press.
Plutchik, R., 1991. The emotions. Lanham: University Press of America.
Pugh, S.D. (2001), “Service with a smile: emotional contagion in the service encounter”,
Academy of Management Journal, Vol. 44 No. 5, pp. 1018-1027.
Rahardjo, O.P., Suryani, R.M., and Hartono, M., 2007. Designing an ergonomic room using
Kansei Engineering method: case study at Poly for Surgery, Public Hospital, Jombang.
Thesis (in Bahasa Indonesia), Department of Industrial Engineering, University of Surabaya.
Raharjo, H., 2007. Dealing with Kano Model Dynamics: strengthening the Quality Function
Deployment as a Design for Six Sigma tool. Jurnal Teknik Industri, Jurnal Keilmuan dan
Aplikasi Teknik Industri 9(1), 15-26.
Revelle, J.B., Moran, J.W., and Cox, C.A., 1998. The QFD Handbook. John Wiley & Sons, Inc.
Richins, M., 1997. Measuring emotions in the consumption experience. Journal of Consumer
Research 24(2), 127-146.
Russell, J.A., 1980. A circumflex model of affect. Journal of Personality and Social Psychology
39(6), 1161-1178.
Russell, J.A., Weiss, A., and Mendelsohn, G.A., 1989. Affect grid - A single-item scale of
pleasure and arousal. Journal of Personality and Social Psychology 57(3), 493-502.
Rust, R.T. and Oliver, R.L. (2000), “Should we delight the customer?”, Academy of Marketing
Science Journal, Vol. 28 No. 1, pp. 86-92.
Ruth, J.A., Brunel, F.F., and Otnes, C.C., 2002. Linking thoughts to feelings: investigating
cognitive appraisals and consumption emotions in a mixed-emotions context. Journal of the
Academy of Marketing Science 30(1), 44-58.
Sauerwein, E., Bailom, F., Matzler, K., and Hinterhuber, H.H., 1996. The Kano model: how to
delight your customers. In: Preprints Volume I of the IX., International Working Seminar on
Production Economics. Innsbruck, 313-327. Schifferstein, H.N.J. and Hekkert, P., 2008. Product Experience. 1
st edition, Elsevier Ltd, Oxford,
UK.
Schutte, S., 2002. Designing Feeling into Products: Integrating Kansei Engineering Methodology
in Product Development. Thesis. Quality and Human-Systems Engineering, Department of
Mechanical Engineering, Linkopings Universitet, Sweden.
Schütte, S., Eklund, J., Axelsson, J. R. C., and Nagamachi, M., 2004. Concepts, methods and
tools in Kansei Engineering. Theoretical Issues in Ergonomics Science 5, 214-232.
Schütte, S., 2005. Engineering emotional values in product design. Kansei Engineering in
development. Thesis. Linkoping University, Linkoping.

178
Schütte, S., Eklund, J., Ishihara, S., and Nagamachi, M., 2008. Affective Meaning: The Kansei
Engineering Approach. In Schifferstein, H.N.J. and Hekkert, P. (Eds), Product Experience. 1st
edition, Elsevier Ltd, Oxford, UK, 477- 496.
Senge, P., 2006. The fifth discipline: the art and practice of the learning organisation. New York:
Doubleday.
Shaver, P., Schwartz, J., Kirson, D., and O‟Conner, C., 1987. Emotion knowledge: further
exploration of a prototype approach. Journal of Personality and Social Psychology 52, 1061-
1086.
Shaw C. and Ivens J., 2002. Building Great Customer Experiences. Palgrave Macmillan.
Shen, X.X., Tan, K.C., and Xie, M., 2000. An integrated approach to innovative product
development using Kano‟s model and QFD. European Journal of Innovation Management
3(2), 91-99.
Shimizu, Y., Sadoyama, T., Kamijo, M., Hosoya, S., Hashimoto, M., Otani, T., Yokoi, K.,
Horiba, Y., Takatera, M., Honywood, M., and Inui, S., 2004. On-demand production system
of apparel on basis of Kansei Engineering. International Journal of Clothing Science and
Technology 16, 32-42.
Shostack, L.G., 1985. Planning the service encounter. In Czepiel, J.A., Solomon, M.R., and
Surprenant, C.F. (Eds), The Service Encounter. Lexington Books, Lexington, MA.
Smith, A.K. and Bolton, R.N., 2002. The effects of customers‟ emotional reseponses to service
failures on their recovery effort evaluations and satisfaction judgments. Journal of the
Academy of Marketing Science 30(1), 5-23.
Solomon, M.R., Surprenant, C.F., Czepiel, J.A., and Gutman, E.G., 1985. A role theory
perspective on dyadic interactions: the service encounter. Journal of Marketing 49(1), 99-
111.
Steenkamp, J.-B.E.M., Baumgartner, H., and Vander, W.E., 1996. The relationships among
arousal potential, arousal and stimulus evaluation, and the moderating role of need for
stimulation. International Journal of Research in Marketing 13, 319-329.
Stein, N.L., Liwag, M.D., and Wade, E., 1996. A goal-based approach to memory for emotional
events: implementations for theories of understanding and socialization. In R.D. Kavanaugh,
B. Zimmerberg, and S. Fein (Eds), Emotion: Interdisciplinary Perspectives. Mahwah, NJ:
Erlbaum.
Steinar, K., 2007. Doing interviews. London: SAGE Publications.
Stephens N. and Gwinner, K.P., 1998. Why don‟t some people complain? A cognitive-emotive
process model of consumer complaint behavior. Journal of the Academy of Marketing
Science 26(4), 172-189.
Strawderman, L. and Koubek, R., 2008. Human factors and usability in service quality
measurement. Human Factors and Ergonomics in Manufacturing and Service Industries
18(4), 454-463.
Stringfellow, A., Nie, W., Bowen, D.E. (2004), “CRM: Profiting from understanding customer
needs”, Business Horizons, Vol. 47, No. 5, pp. 45-52.
Suhr, D.D., 2006. Exploratory or confirmatory factor analysis? Proceedings of the 31st annual
SAS conference (SUGI 31), paper 200-31.
Sullivan, L. P., 1986. Quality function deployment. Quality Progress 19, 39-50.
Taha, H.A., 1997. Operations research: an introduction. 6th edition. Prentice-Hall, New York.
Tan, K.C. and Pawitra, T.A., 2001. Integrating SERVQUAL and Kano‟s Model into QFD for
Service Excellent Development. Managing Service Quality 11(6), 418-430.
Tehrani, N. (2002), “The essence of CRM success: focus on relationships…otherwise there is no
customer to manage”, Customer Interaction Solutions, Vol. 21, No. 1, pp. 2-4.
Tribus, M., 1990. ASQ(C) Statistics Division Newsletter.
Tse, D.K. and Wilton, P.C., 1988. Models of customer satisfaction formation: Anextension.
Journal of Marketing Research 25, 204–212.

179
Vargo, S.L. and Lusch, R.F., 2004. The four service marketing myths-remnants of goods-based
manufacturing model. Journal of Service Research 6(4), 324-335.
Voss, C., Tsikriktsis, N., and Frohlich, M., 2002. Case study research in operations management.
International Journal of Operations and Product Management 22(2), 195-219.
Watson, D., Clark, L.A., and Tellegen, A., 1988. Development and validation of brief measures
of positive and negative affect: the PANAS scales. Journal of Personality and Social
Psychology 54, 1063-1070.
Weiermair, K., 2000. Tourists‟ perceptions towards and satisfaction with service quality in the
cross-cultural service encounter: implications for hospitality and tourism management.
Managing Service Quality, 10(6), 397-409.
Wellner, A.S., 2002. The test drive. An article available at:
http://findarticles.com/p/articles/mi_m4021/is_2002_Oct_1/ai_92087420/, accessed on 20
March 2012.
Westbrook, R.A., 1987. Product/consumption-based affective responses and post purchase
processes. Journal of Marketing Research 24, 258–270.
Westbrook, A., Oliver, R.L. (1991), “The dimensionality of consumption emotion patterns and
consumer satisfaction”, Journal of Consumer Research, Vol. 18, No. 1, pp. 84-91.
Wiener, E.L. and Nagel, D.C., 1988. Human factors in aviation. Academic, San Diego.
Winoto, S., Parung, J., Gunawan, L.H., and Hartono, M, 2007. Application of Kansei Engineering
on designing beauty salon: case study at Shinjuku Salon. Thesis (in Bahasa Indonesia),
Department of Industrial Engineering, University of Surabaya.
Witell, N.L. and Fundin, A., 2005. Dynamics of service attributes: A test of Kano‟s theory of
quality. International Journal of Service Industry Management 16(2), 152-168.
Woodruff, R.B., 1997. Customer value: the next source for competitive advantage. Journal of
Academy of Marketing Science 25(2), 139-153.
Wong, A., 2004. The role of emotional satisfaction in service encounters. Managing Service
Quality 14(5), 365-376.
Wu, H.-H., Liao, A.Y.H., and Wang, P.C., 2005. Using grey theory in quality function
deployment to analyze dynamic customer requirement. International Journal of Advanced
Manufacturing Technology 25, 1241-1247.
Wu, H.-H, and Shieh, J.-I., 2006. Using a Markov chain model in quality function deployment to
analyze customer requirements. International Journal of Advanced Manufacturing
Technology 30, 141-146.
Yamashina, H., Ito, T., Kawada, H. (2002) “Innovative product development process by
integrating QFD and TRIZ” International Journal of Production Research, Vol. 40 (5), pp.
1031-1050.
Yang, C.-C., 2011. Identification of customer delight for quality attributes and its applications.
Total Quality Management & Business Excellence 22(1), 83-98.
Yin, R.K., 2003. Case study research: design and methods. Thousand Oaks, California, Sage
Publications.
Yu, Y.-T. and Dean, A., 2001. The contribution of emotional satisfaction to consumer loyalty.
International Journal of Service Industry Management 12, 234-250.
Yun, M.H., 2008. Engineering of affect: a user-centered design effort for product and service
innovation. Lecture notes on January 27th 2008, Human Interface Systems Laboratory,
Department of Industrial Engineering, Seoul National University, Seoul, Korea.
Yun, C.Z., Tan, K.C., and Chai, K.H., 2004. Case Study of A Systematic Approach to
Determining Customers‟ Emotional Needs in Café Services. Thesis, Department of Industrial
and Systems Engineering, National University of Singapore.
Zeelenberg, M. and Pieters, R., 1999. Comparing service delivery to what may have been.
Journal of Service Research 2(1), 86-97.

180
Zeithaml, V.A., Parasuraman, A., and Berry, L.L., 1985. Problems and Strategies in Service
Marketing. Journal of Marketing 49, 33-46.
Zeithaml, V.A., Berry, L.L., and Parasuraman, A., 1993. The nature and determinants of
customer satisfaction of services. Journal of the Academy of Marketing Science 21(1), 1-12.
http://www.mazda.com.sg/moby/cms/mazda-thinking/kansei-engineering/.

181
Appendix A. Case study of beauty salon services
Kansei domain of beauty salon
Comfortable
Bright
Cool
Spacious
Clean
Sunny
Informative
Soft
Lighting
Color of room
Air Con (AC)
Color of light
Color of wall
Sufficient room
Room cleanliness
Color
Facility
Music
Comfortable color of
light
Sufficient number of
light
Brightness of room
Layout of AC
Sufficient number of
AC
White color
Brightness of wall
Good arrangement
of equipment
Tidiness of
equipment
Daily room cleaning
Fast room cleaning
after haircut
Sufficient number of
rubbish bin
Brightness of room
(light blue & green)
White light
Up to date magazine
Convenient attached
TV set
Slow pop
Light and soft
volume
SIGHT
SIGHT
SIGHT
TOUCH
TOUCH
TOUCH
TOUCH
SIGHT
SIGHT
SIGHT
SIGHT
SIGHT
SIGHT
SIGHT
SIGHT
SIGHT
HEARING
HEARING
LEVEL 0 LEVEL 1 LEVEL 2 LEVEL 3 SENSE

182
Physical Domain of beauty salon
Beauty salon
Lighting
Air Con (AC)
Music
Equipment/facility
Supporting facility
Rubbish bin
Type of lighting
Arrangement of
lighting
Appropriate number
of AC
Arrangement of AC
Sound volume
Type of facility
Arrangement of
supporting facility
Philips Essential 56W
Located at washing,
coloring, cutting, and
cashier areas
Determined by number
of working area
Spreading and
arranging within a
space of 5m x 9m
Instrumental and pop
musics
Volume of level 7 (soft
sound)
Steamer, ozone, hair
curler
Spacious arrangement
DESIGN
ELEMENT
QUALITY
CHARACTERISTICSSPECIFICATION
Appropriate number
of lighting
Type of music
3 units @0.75 ton
capacity
Arrangement of
facility
Type of supporting
facilityMagazines, TV set
Reachable and seeable
locations
Arrangement of
rubbish bin
Frequency of
cleaning
Reachable from
cutting, coloring, and
cashier areas
Daily cleaning after
haircut

183
Paper prototype of beauty salon
This is a comparison between current and proposed designs of beauty salon.
Current condition
Proposed design

184
Appendix B. Case study of fitness centre/gym services
House of quality (HOQ) of proposed waiting room design

185
House of quality (HOQ) of proposed exercise/fitness room design

186
Paper prototype of fitness centre
This is a comparison between current and proposed designs of fitness centre.
Current condition
Proposed design

187
Appendix C. Case study of café services

188
Appendix D. Case study of home theater services
House of quality (HOQ) of home theater

189
Proposed design of home theater

190
Appendix E. Case study of policlinic for surgery services
House of quality (HOQ) of proposed waiting room for policlinic design

191
House of quality (HOQ) of proposed diagnostic room for policlinic services

192
Appendix F. Questionnaires in hotel services
The first questionnaire in English
Questionnaire for Hotel Services: SERVICE QUALITY, EMOTIONAL NEEDS, OVERALL SATISFACTION, AND
BEHAVIORAL INTENTION
The purpose of this survey is to collect information on your experience in hotel services. The questionnaire would take less than
20 minutes to accomplish. All the information provided is kept strictly confidential. There are 5 main sections in this
questionnaire. Please try to give your best estimate rather than leaving the answers blank. Your time is highly appreciated.
SECTION A GENERAL INFORMATION This section asks questions about your demographic attributes. It will be
helpful in making comparisons between categories, such as monthly incomes, educational levels, etc.
1. Name of the hotel you stayed in: ______________________
2. Gender : ❏ Male ❏ Female
3. Age (years) : ❏ ≤ 20 ❏ 21 – 30 ❏ 31 – 40 ❏ 41 – 50 ❏ > 50
4. Country of residence: ________________________
5. Frequency of travel:
❏ Once a year or less ❏ Every 3 months ❏ ≥ Once a month
❏ Every 6 months ❏ Every month
6. Purpose of stay:
❏ Vacation ❏ Conference ❏ Others: ___________________
❏ Business trip ❏ Social Visit
7. Amount of time spent at the hotel (days):
❏ ≤ 3 ❏ 4 – 7 ❏ 8 – 11 ❏ > 11
8. Monthly income:
❏ ≤ US$ 2000 ❏ US$ 2001-3000 ❏ US$ 3001-4000 ❏ >US$ 4000
9. Frequency of stay at the hotels during year 2008 to 2009:
❏ Less than once a year ❏ Twice a year ❏ Four times a year
❏ Once a year ❏ Three times a year ❏ Five times or more a year
10. Highest education achieved:
❏ Elementary school or equivalent ❏ High school or equivalent ❏ Post-graduate
❏ Junior high or equivalent ❏ College or University Degree ❏ Other: _______________
11. Occupation:
❏ Clerical/Office ❏ Engineering ❏ Entrepreneur/Self Employed ❏ Management
❏ Education ❏ Finance ❏ Marketing ❏ Student
❏ Unemployed ❏ Others: _________________
SECTION B KANSEI SURVEY This section asks your responses on the hotel‟s services emotional encounter. This
section consists of 3 parts: survey on hotel‟s service quality, importance of kansei, and kansei responses.
Part B1. SURVEY ON HOTEL‟S SERVICE QUALITY
DIRECTIONS:
Level of Importance Section: Based on your experiences as a customer of hotel services, please think about the importance of
services provided. If you feel a service item is not at all important, circle “1”; if you feel a service item is absolutely important,
circle “5”
Expected Service Section: Based on your experiences as a customer of hotel services, please think about the kind of hotel that
would deliver excellent quality of service. Please show the extent to which you think such a hotel would possess the service items
described by each statement. If you feel a service item is not at all essential, circle “1”; if you feel a service item is absolutely
essential, circle “5”
Perceived Service Section: Based on your experiences as a customer of XYZ hotel services, please show the extent to which you
believe XYZ has the service items described by the statement. If you strongly disagree, circle “1”; if you strongly agree, circle
“5”

193
No Service Items Level of
Importance
Expected
Service
Perceived
Service
A TANGIBLE ELEMENTS/PHYSICAL SURROUNDINGS
1 The receptionist and information desk is visually appealing 1 2 3 4 5 1 2 3 4 5 1 2 3 4 5
2 The employees‟ uniforms are clean, nice, and neat 1 2 3 4 5 1 2 3 4 5 1 2 3 4 5
3 The hotel has modern-looking equipment 1 2 3 4 5 1 2 3 4 5 1 2 3 4 5
4 The hotel‟s interior and exterior are well managed and maintained 1 2 3 4 5 1 2 3 4 5 1 2 3 4 5
5 The outdoor environment is visually clean 1 2 3 4 5 1 2 3 4 5 1 2 3 4 5
6 The atmosphere of restaurant is inviting appetite 1 2 3 4 5 1 2 3 4 5 1 2 3 4 5
7 The shops are attractive 1 2 3 4 5 1 2 3 4 5 1 2 3 4 5
8 The hotel‟s lobby is comfortable 1 2 3 4 5 1 2 3 4 5 1 2 3 4 5
9 The bedroom and bathroom are clean and convenient 1 2 3 4 5 1 2 3 4 5 1 2 3 4 5
10 The hotel is well lighted 1 2 3 4 5 1 2 3 4 5 1 2 3 4 5
11 The sports facilities are well maintained, clean, and convenient 1 2 3 4 5 1 2 3 4 5 1 2 3 4 5
12 The music in hotel‟s lobby is soft and nice 1 2 3 4 5 1 2 3 4 5 1 2 3 4 5
13 The scent in hotel‟s room and lobby is refreshing 1 2 3 4 5 1 2 3 4 5 1 2 3 4 5
14 The meals served at the hotel are delicious 1 2 3 4 5 1 2 3 4 5 1 2 3 4 5
B RELIABILITY
1 Your hotel reservation is handled efficiently and effectively 1 2 3 4 5 1 2 3 4 5 1 2 3 4 5
2 Your booked guestroom is ready as promised 1 2 3 4 5 1 2 3 4 5 1 2 3 4 5
3 The bill is charged accurately 1 2 3 4 5 1 2 3 4 5 1 2 3 4 5
4 All size of servings are given correctly the first time 1 2 3 4 5 1 2 3 4 5 1 2 3 4 5
5 The employees show a sincere interest in solving your problem 1 2 3 4 5 1 2 3 4 5 1 2 3 4 5
6 The hotel insists on error-free records 1 2 3 4 5 1 2 3 4 5 1 2 3 4 5
7 AC, TV, radio, lights, mini bar, & other equipment work properly 1 2 3 4 5 1 2 3 4 5 1 2 3 4 5
8 Overall, you got what you paid for 1 2 3 4 5 1 2 3 4 5 1 2 3 4 5
C RESPONSIVENESS
1 The employees tell you exactly when services will be performed 1 2 3 4 5 1 2 3 4 5 1 2 3 4 5
2 The employees give you prompt service 1 2 3 4 5 1 2 3 4 5 1 2 3 4 5
3 The employees are always willing to help you 1 2 3 4 5 1 2 3 4 5 1 2 3 4 5
4 The employees are never too busy to respond to your requests 1 2 3 4 5 1 2 3 4 5 1 2 3 4 5
5 Informative literature about the hotel facilities is provided 1 2 3 4 5 1 2 3 4 5 1 2 3 4 5
D ASSURANCE
1 The employees have knowledge in answering your enquiries 1 2 3 4 5 1 2 3 4 5 1 2 3 4 5
2 The behavior of employees instills confidence in you 1 2 3 4 5 1 2 3 4 5 1 2 3 4 5
3 The employees know well about local places of interest 1 2 3 4 5 1 2 3 4 5 1 2 3 4 5
4 The hotel provides a safe environment 1 2 3 4 5 1 2 3 4 5 1 2 3 4 5
5 The employees are consistently courteous with you 1 2 3 4 5 1 2 3 4 5 1 2 3 4 5
6 The staff explains clearly charges on your account 1 2 3 4 5 1 2 3 4 5 1 2 3 4 5
E EMPATHY
1 The employees are helpful, friendly, and respectful 1 2 3 4 5 1 2 3 4 5 1 2 3 4 5
2 The hotel gives you individual full attention 1 2 3 4 5 1 2 3 4 5 1 2 3 4 5
3 The hotel has employees who give you personal attention 1 2 3 4 5 1 2 3 4 5 1 2 3 4 5
4 The employees understand your specific needs 1 2 3 4 5 1 2 3 4 5 1 2 3 4 5
5 The hotel has your best interests at heart 1 2 3 4 5 1 2 3 4 5 1 2 3 4 5
6 The hotel has operating hours convenient to you 1 2 3 4 5 1 2 3 4 5 1 2 3 4 5
Part B2. SURVEY ON THE IMPORTANCE OF CUSTOMER EMOTIONAL NEEDS/KANSEI
Please kindly see the visualization of Kansei words as follows:

194
Please rate the importance of emotional needs/kansei when you are experiencing hotel services by circling the rating. If you feel
an item is not at all important, circle “1”; if you feel an item is absolutely important, circle “5”
Customer Emotional Need Importance Rating
I like a hotel environment that is WELCOMING 1 2 3 4 5 I like to feel HAPPY when I stay in a hotel 1 2 3 4 5
I like to stay in a hotel that makes me feel CONFIDENT 1 2 3 4 5
I like to feel RELAXED when I stay in a hotel 1 2 3 4 5
I like a hotel environment that is PEACEFUL 1 2 3 4 5
I like to feel SATISFIED when I stay in a hotel 1 2 3 4 5
I like a hotel environment that is ELEGANT 1 2 3 4 5
I like a hotel environment that is FRIENDLY 1 2 3 4 5
I like to feel RELIEVED when I stay in a hotel 1 2 3 4 5
I like to feel PASSIONATE when I stay in a hotel 1 2 3 4 5
I like a hotel environment that is QUIET 1 2 3 4 5
I like to stay in a hotel that is CONVENIENT 1 2 3 4 5
I like a hotel environment that is ATTRACTIVE 1 2 3 4 5
I like a hotel environment that is CLEAN 1 2 3 4 5
I like a hotel environment that is SPACIOUS 1 2 3 4 5
I like a hotel environment that is MODERN 1 2 3 4 5
Part B3. SURVEY ON THE EMOTIONAL NEEDS/KANSEI RESPONSE
Based on your experience in hotel services, please rate the fulfillment of your emotional need/kansei by circling the rating (on a
likert scale of 1 to 5). If you feel absolutely to negative KANSEI, please circle “1”; if you feel absolutely to positive KANSEI,
please circle “5”
Negative KANSEI Experience rating Positive KANSEI
UNWELCOME 1 2 3 4 5 WELCOME
UNHAPPY 1 2 3 4 5 HAPPY
DIFFIDENT 1 2 3 4 5 CONFIDENT
TENSED 1 2 3 4 5 RELAXED
UNPEACEFUL 1 2 3 4 5 PEACEFUL

195
UNSATISFIED 1 2 3 4 5 SATISFIED
INELEGANT 1 2 3 4 5 ELEGANT
UNFRIENDLY 1 2 3 4 5 FRIENDLY
WORRIED 1 2 3 4 5 RELIEVED
PASSIONLESS 1 2 3 4 5 PASSIONATE
NOISY 1 2 3 4 5 QUIET
INCONVENIENT 1 2 3 4 5 CONVENIENT
REPULSIVE 1 2 3 4 5 ATTRACTIVE
DIRTY 1 2 3 4 5 CLEAN
CROWDED 1 2 3 4 5 SPACIOUS
CLASSIC 1 2 3 4 5 MODERN
SECTION C OVERALL SATISFACTION
Your overall satisfaction level of hotel services is …
Strongly dissatisfied ❏
Slightly dissatisfied ❏
Neutral ❏
Slightly satisfied ❏
Strongly satisfied ❏
SECTION D BEHAVIORAL INTENTION
Based on your experiences as a customer of XYZ hotel services, please show your intention level through below statements. If
you strongly disagree, circle “1”; if you strongly agree, circle “5”
No Behavioral Intention Rating
1 I will certainly recommend hotel XYZ to my friends, relatives, and acquaintances 1 2 3 4 5
2 I would pay a higher price than the competitors charge for the benefits that I received from hotel XYZ 1 2 3 4 5
3 Hotel XYZ is always my first choice 1 2 3 4 5
SECTION E CUSTOMER FEEDBACK ON HOTEL SERVICES
Based on your experience in hotel services, please give feedback about:
- What services should be improved and/or added:
____________________________________________________________________________________________________
________________________________________________________________________________________
- What emotional needs/feelings/kansei you want to experience:
____________________________________________________________________________________________________
________________________________________________________________________________________
Thank You very much for your great participation!

196
The first questionnaire in Bahasa Indonesia
Kuesioner Layanan Hotel: KUALITAS LAYANAN, KEBUTUHAN EMOSIONAL, KEPUASAN, DAN INTENSI
PERILAKU KONSUMEN
Survei ini bertujuan untuk memperoleh informasi terkait pengalaman yang Anda dapatkan di layanan hotel. Diperlukan waktu
kurang dari 20 menit untuk mengisi kuesioner ini. Semua informasi yang diberikan akan dijaga kerahasiaannya. Ada 5 bagian
umum dalam kuesioner ini. Silakan memberi tanggapan sejauh yang Anda bisa daripada membiarkan halaman jawaban tidak
terisi. Kami sangat menghargai waktu Anda.
BAGIAN A INFORMASI UMUM Bagian ini berisi pertanyaan tentang demografi responden. Informasi tersebut sangat
berguna untuk perbandingan antar kategori, misalnya penghasilan per bulan, tingkat pendidikan, dan lain-lain.
1. Nama hotel tempat Anda menginap: ______________________
2. Jenis kelamin : ❏ Laki-laki ❏ Perempuan
3. Usia (tahun) : ❏ ≤ 20 ❏ 21 – 30 ❏ 31 – 40 ❏ 41 – 50 ❏ > 50
4. Negara tempat Anda tinggal: ________________________
5. Frekuensi bepergian:
❏ ≤ 1 dalam setahun ❏ Setiap 3 bulan ❏ ≥ 1 dalam sebulan
❏ Setiap 6 bulan ❏ Setiap bulan
6. Tujuan menginap:
❏ Liburan ❏ Seminar/konferensi ❏ Lainnya: ___________________
❏ Perjalanan bisnis ❏ Kunjungan sosial
7. Waktu yang dihabiskan untuk tinggal di hotel (dalam satuan hari):
❏ ≤ 3 ❏ 4 – 7 ❏ 8 – 11 ❏ > 11
8. Penghasilan perbulan:
❏ ≤ US$ 2000 ❏ US$ 2001-3000 ❏ US$ 3001-4000 ❏ > US$ 4000
9. Frekuensi tinggal di hotel selama tahun 2008 dan 2009:
❏ < 1 dalam setahun ❏ Dua kali dalam setahun ❏ Empat kali dalam setahun
❏ Satu kali dalam setahun ❏ Tiga kali dalam setahun ❏ Lima kali atau lebih dalam setahun
10. Level pendidikan tertinggi yang dicapai:
❏ SD ❏ SMA ❏ S2/S3
❏ SMP ❏ D1/D2/D3/S1 ❏ Lainnya: ____________________
11. Pekerjaan:
❏ Karyawan Toko ❏ Teknisi ❏ Pengusaha ❏ Manajer
❏ Pendidik ❏ Staf Keuangan ❏ Staf Pemasaran ❏ Pelajar/Mahasiswa
❏ Tidak bekerja ❏ Lainnya: _________________
BAGIAN B SURVEI KANSEI Bagian ini menggali informasi tentang respon emosional (kansei) Anda terhadap layanan hotel.
Survei ini terdiri dari 3 sub bagian, yaitu: survei kualitas layanan hotel, tingkat kepentingan kansei, dan respon kansei
Sub-bagian B1. SURVEI KUALITAS LAYANAN HOTEL
PETUNJUK:
Tingkat Kepentingan: Berdasarkan pengalaman Anda sebagai konsumen layanan hotel selama ini, silakan memberi perhatian
terhadap tingkat kepentingan layanan hotel yang disediakan. Jika menurut Anda layanan di hotel tersebut „sangat tidak penting‟,
silakan lingkari angka „1‟; namun jika layanan tersebut sangat penting, silakan lingkari angkat „5‟.
Ekspektasi: Berdasarkan pengalaman Anda sebagai konsumen layanan hotel selama ini, silakan memberi perhatian terhadap
hotel yang memberikan kualitas layanan istimewa. Silakan tunjukkan sejauh mana sebuah hotel seharusnya memiliki item
layanan seperti yang dijelaskan oleh setiap pernyataan. Jika Anda merasa item layanan tersebut „sangat tidak esensiil’,
lingkarilah angka „1‟; jika merasa item layanan tersebut „sangat esensiil‟, lingkarilah angka „5‟.
Persepsi: Berdasarkan pengalaman Anda sebagai konsumen layanan hotel XYZ, silakan tunjukkan sejauh mana Anda yakin
bahwa hotel XYZ memiliki item layanan seperti yang dijelaskan di setiap pernyataan. Jika Anda ‘sangat tidak setuju’,
lingkarilah angka „1‟; jika Anda „sangat setuju’, lingkarilah angka ‘5’.

197
No Item Layanan Tingkat
Kepentingan Ekspektasi Persepsi
A TANGIBLE ELEMENTS/PHYSICAL SURROUNDINGS
1 Resepsionis dan meja informasi menarik untuk dilihat 1 2 3 4 5 1 2 3 4 5 1 2 3 4 5
2 Karyawan hotel berseragam bersih, bagus, dan rapi 1 2 3 4 5 1 2 3 4 5 1 2 3 4 5
3 Hotel memiliki fasilitas yang moderen 1 2 3 4 5 1 2 3 4 5 1 2 3 4 5
4 Interior dan eksterior di hotel terkelola dan terawat dengan baik 1 2 3 4 5 1 2 3 4 5 1 2 3 4 5
5 Lingkungan luar tampak bersih 1 2 3 4 5 1 2 3 4 5 1 2 3 4 5
6 Suasana restauran mampu mengundang selera makan 1 2 3 4 5 1 2 3 4 5 1 2 3 4 5
7 Toko di dalam hotel cukup atraktif 1 2 3 4 5 1 2 3 4 5 1 2 3 4 5
8 Lobi hotel nyaman 1 2 3 4 5 1 2 3 4 5 1 2 3 4 5
9 Kamar tidur dan kamar mandi bersih dan nyaman 1 2 3 4 5 1 2 3 4 5 1 2 3 4 5
10 Penerangan di hotel sangat baik 1 2 3 4 5 1 2 3 4 5 1 2 3 4 5
11 Fasilitas olahraga terpelihara dengan baik, bersih, dan nyaman 1 2 3 4 5 1 2 3 4 5 1 2 3 4 5
12 Musik di lobi hotel lembut dan enak 1 2 3 4 5 1 2 3 4 5 1 2 3 4 5
13 Wangi di kamar hotel dan lobi yang menyegarkan 1 2 3 4 5 1 2 3 4 5 1 2 3 4 5
14 Makanan yang disajikan di hotel lezat 1 2 3 4 5 1 2 3 4 5 1 2 3 4 5
B RELIABILITY
1 Pemesanan hotel Anda ditangani secara efisien dan efektif 1 2 3 4 5 1 2 3 4 5 1 2 3 4 5
2 Kamar tamu tersedia sesuai dengan yang dipesan dan dijanjikan 1 2 3 4 5 1 2 3 4 5 1 2 3 4 5
3 Tagihan dikenakan secara akurat 1 2 3 4 5 1 2 3 4 5 1 2 3 4 5
4 Semua ukuran layanan diberikan secara benar di saat pertama kali di hotel 1 2 3 4 5 1 2 3 4 5 1 2 3 4 5
5 Karyawan menunjukkan minat yang tulus dalam memecahkan masalah Anda 1 2 3 4 5 1 2 3 4 5 1 2 3 4 5
6 Hotel berkeinginan keras untuk mencapai catatan bebas error 1 2 3 4 5 1 2 3 4 5 1 2 3 4 5
7 AC, TV, radio, lampu, mini-bar, & peralatan lainnya berfungsi dengan baik 1 2 3 4 5 1 2 3 4 5 1 2 3 4 5
8 Secara keseluruhan, Anda mendapatkan apa yang Anda bayar 1 2 3 4 5 1 2 3 4 5 1 2 3 4 5
C RESPONSIVENESS
1 Karyawan memberitahu Anda kapan tepatnya layanan akan dilakukan 1 2 3 4 5 1 2 3 4 5 1 2 3 4 5
2 Karyawan memberikan layanan yang cepat 1 2 3 4 5 1 2 3 4 5 1 2 3 4 5
3 Karyawan selalu bersedia membantu Anda 1 2 3 4 5 1 2 3 4 5 1 2 3 4 5
4 Karyawan tidak pernah terlalu sibuk untuk menanggapi permintaan Anda 1 2 3 4 5 1 2 3 4 5 1 2 3 4 5
5 Informasi tentang fasilitas hotel disediakan 1 2 3 4 5 1 2 3 4 5 1 2 3 4 5
D ASSURANCE
1 Karyawan memiliki pengetahuan dalam menjawab pertanyaan Anda 1 2 3 4 5 1 2 3 4 5 1 2 3 4 5
2 Perilaku karyawan menanamkan kepercayaan pada Anda 1 2 3 4 5 1 2 3 4 5 1 2 3 4 5
3 Karyawan mengetahui dengan baik mengenai tempat-tempat menarik 1 2 3 4 5 1 2 3 4 5 1 2 3 4 5
4 Hotel ini menyediakan lingkungan yang aman 1 2 3 4 5 1 2 3 4 5 1 2 3 4 5
5 Karyawan secara konsisten berlaku sopan dengan Anda 1 2 3 4 5 1 2 3 4 5 1 2 3 4 5
6 Karyawan menjelaskan secara rinci biaya pada tagihan Anda 1 2 3 4 5 1 2 3 4 5 1 2 3 4 5
E EMPATHY
1 Karyawan di hotel sangat ringan tangan, ramah, dan hormat 1 2 3 4 5 1 2 3 4 5 1 2 3 4 5
2 Hotel ini memberikan perhatian penuh secara individu 1 2 3 4 5 1 2 3 4 5 1 2 3 4 5
3 Hotel ini memiliki karyawan yang memberikan perhatian pribadi 1 2 3 4 5 1 2 3 4 5 1 2 3 4 5
4 Karyawan memahami kebutuhan khusus Anda 1 2 3 4 5 1 2 3 4 5 1 2 3 4 5
5 Hotel ini mampu menarik hati Anda 1 2 3 4 5 1 2 3 4 5 1 2 3 4 5
6 Hotel ini memiliki jam operasi yang nyaman untuk Anda 1 2 3 4 5 1 2 3 4 5 1 2 3 4 5
Sub-bagian B2. SURVEI TINGKAT KEPENTINGAN TERHADAP KEBUTUHAN EMOSIONAL
KONSUMEN/KANSEI
Silakan perhatikan ikon emosi berikut:

198
Silakan menilai tingkat kepentingan dari kebutuhan emosional/kansei ketika Anda memperoleh layanan hotel dengan cara
melingkari angka yang telah disediakan. Jika Anda menilai item tersebut sangat tidak penting, lingkarilah angka „1‟; jika Anda
menilai item tersebut sangat penting, lingkarilah angka ‘5’.
Kebutuhan Emosional Tingkat Kepentingan
Saya suka lingkungan hotel yang MENYAMBUT 1 2 3 4 5
Saya ingin merasa BAHAGIA ketika tinggal di hotel 1 2 3 4 5
Saya suka tinggal di hotel yang membuat saya PERCAYA DIRI 1 2 3 4 5
Saya ingin merasa SANTAI ketika tinggal di hotel 1 2 3 4 5
Saya suka lingkungan hotel yang DAMAI 1 2 3 4 5
Saya ingin merasa TERPUASKAN ketika tinggal di hotel 1 2 3 4 5
Saya suka lingkungan hotel yang ELEGAN 1 2 3 4 5
Saya suka lingkungan hotel yang RAMAH 1 2 3 4 5
Saya ingin merasa LEGA ketika tinggal di hotel 1 2 3 4 5
Saya ingin merasa BERNAFSU ketika tinggal di hotel 1 2 3 4 5
Saya suka lingkungan hotel yang TENANG 1 2 3 4 5
Saya suka tinggal di hotel yang NYAMAN 1 2 3 4 5
Saya suka lingkungan hotel yang ATRAKTIF 1 2 3 4 5
Saya suka lingkungan hotel yang BERSIH 1 2 3 4 5
Saya suka lingkungan hotel yang LUAS 1 2 3 4 5
Saya suka lingkungan hotel yang MODEREN 1 2 3 4 5
Sub-bagian B3. SURVEI TERHADAP RESPON KEBUTUHAN EMOSIONAL/KANSEI
Berdasarkan pengalaman Anda dalam pelayanan hotel, silahkan menilai pemenuhan kebutuhan emosional/kansei Anda dengan
melingkari angka yang disediakan (pada skala likert 1 sampai dengan 5). Jika Anda benar-benar merasakan KANSEI negatif,
silakan lingkari angka “1”; jika Anda benar-benar merasakan KANSEI positif, silakan lingkari angka “5”.
KANSEI negatif Penilaian KANSEI positif
TERTOLAK 1 2 3 4 5 TERSAMBUT
SUSAH 1 2 3 4 5 BAHAGIA
MINDER 1 2 3 4 5 PERCAYA DIRI
TEGANG 1 2 3 4 5 SANTAI
KACAU 1 2 3 4 5 DAMAI

199
TIDAK PUAS 1 2 3 4 5 TERPUASKAN
TIDAK ELEGAN 1 2 3 4 5 ELEGAN
TIDAK RAMAH 1 2 3 4 5 RAMAH
RESAH 1 2 3 4 5 LEGA
TIDAK BERNAFSU 1 2 3 4 5 BERNAFSU
BISING 1 2 3 4 5 TENANG
TIDAK NYAMAN 1 2 3 4 5 NYAMAN
MEMUAKKAN 1 2 3 4 5 ATRAKTIF
KOTOR 1 2 3 4 5 BERSIH
SEMPIT 1 2 3 4 5 LUAS
KLASIK 1 2 3 4 5 MODEREN
BAGIAN C KEPUASAN SECARA MENYELURUH
Tingkat kepuasan Anda secara menyeluruh terhadap layanan hotel …
Sangat tidak puas ❏
Sedikit tidak puas ❏
Netral ❏
Sedikit puas ❏
Sangat puas ❏
BAGIAN D INTENSI PERILAKU KONSUMEN
Berdasarkan pengalaman Anda sebagai pelanggan layanan hotel XYZ, silahkan tunjukkan sejauh mana tingkat intensi Anda
melalui beberapa pernyataan yang diberikan di bawah ini. Jika Anda merasa sangat tidak setuju, lingkarilah angka “1”; jika
sangat setuju, lingkarilah angka “5”.
No Intensi Perilaku Nilai
1 Saya pasti akan merekomendasikan hotel XYZ kepada teman-teman, kerabat, dan
kenalan-kenalan saya 1 2 3 4 5
2 Saya akan membayar dengan harga yang lebih tinggi terhadap biaya hotel pesaing atas
manfaat yang saya terima dari hotel XYZ 1 2 3 4 5
3 Hotel XYZ selalu menjadi pilihan pertama saya 1 2 3 4 5
BAGIAN E UMPAN BALIK KONSUMEN TERHADAP LAYANAN HOTEL
Berdasarkan pengalaman Anda selama tinggal di hotel, silakan memberikan umpan balik terkait dengan:
- Layanan apa yang seharusnya diperbaiki dan/atau ditambah:
____________________________________________________________________________________________________
______________________________________________________________________________
- Kebutuhan emosional/kansei apa yang ingin Anda penuhi:
____________________________________________________________________________________________________
______________________________________________________________________________
Terima kasih atas partisipasi Anda!

200
The first questionnaire in Japanese
National University of Singapore – 広島国際大学 共同研究
ホテルサービスの品質,ニーズ,満足度の調査
NUS: Markus Hartono, 広島国際大学:心理科学部 石原茂和
この質問紙調査は,ホテルのサービスの重要度について調べるものです.回答時間は10分から
20分です.ここで得られた情報については完全に匿名として扱い,個人が特定されることはありません.また研究以
外に使われることも,ホテルに情報が伝わることも一切ありません.
なるべく多くの質問にご回答頂きたいのですが,回答したくない質問があれば飛ばしてももちろん結構です.シンガ
ポールの国立大学との共同研究ですので,日本の事情に若干そぐわない質問も中にはありますことをご了承ください
.
SECTION A 回答者についての,一般的な質問
1. 今回お泊まりになったホテルは ______________________
2. 性別 : ❏ 男性 ❏ 女性
3. 年齢: ❏ 20歳以下 ❏ 21 – 30 ❏ 31 – 40 ❏ 41 – 50 ❏ 51- 60
❏ 61-70 ❏ 71-80 ❏ 80歳以上
4. いま住んでおられる国 (日本) 日本以外________________________
5. ご旅行の頻度(一年あたりの回数)
❏ 一年1度かそれ以下 ❏ 約3ヶ月に1度 ❏ ひと月に1度以上
❏ 半年に1度 ❏ ひと月1度程度
6. 今回のご旅行の目的
❏ バケーション ❏ 会議 ❏ その他 ___________________
❏ 仕事 ❏ 家族・親族を訪問
7. 今回のご旅行での宿泊日数
❏ 3泊以下 ❏ 4 – 7 ❏ 8 – 11 ❏ 11泊以上
8. 差し支えなければ,月ごとの収入は
❏ 20万円以下 ❏ 20〜30万円 ❏ 30〜40万円 ❏ 40万円以上
9. 2008年から2009年の間,どれくらいホテルに宿泊されましたか
❏ 1年に1泊以下 ❏ 年2回程度 ❏ 年4回程度
❏ 1年に1泊程度 ❏ 年3回程度 ❏ 年5回以上
10. 差し支えなければ,最終学歴は
❏ 小学校 ❏ 高校 ❏ 大学 ❏ 大学院
❏ 中学校 ❏ 高専・短大 ・専門学校 ❏ その他 ____________________
11. ご職業
❏ 事務 ❏ エンジニア ❏ 自営業 ❏ 管理職
❏ 教育 ❏ 金融 ❏ マーケティング ❏ 学生
❏ 無職 ❏ 年金生活 ❏ その他: _________________
SECTION B 感性工学調査:ホテルのサービス品質,重要性,感性評価
Part B1. ホテルのサービス品質について
評価の方法:各質問には3つの評価セクションがあります.
重要性のレベル:ホテルの顧客として,さまざまなサービスの重要性についてご自分の基準で評価してください.そ
のサービスの重要性はとても低いとお考えの場合は1,そのサービスは必要不可欠とお考えの場合は5になります.重
要度の程度に応じて○をつけてください.
期待するサービスのレベル:高級ホテルに宿泊すると仮定していただき,そのときに期待するサービスの度合いを評
価してください.そのサービスの重要性はとても低いとお考えの場合は1,そのサービスは必要不可欠とお考えの場
合は5になります.重要度の程度に応じて○をつけてください.
今回ご宿泊のホテルのサービス品質レベルの評価:
今回のご旅行で宿泊されているホテルのサービス品質のレベルについて,評価してください.レベルが高ければ5,
低ければ1になります.

201
No ホテルの各サービス 重要性の
レベル
期待する
サービスレベル
今回ご宿泊
のホテル
A 物理的な環境
1 フロント従業員やフロントデスクの見た目が良い 1 2 3 4 5 1 2 3 4 5 1 2 3 4 5
2 従業員の制服が清潔でデザインが良い 1 2 3 4 5 1 2 3 4 5 1 2 3 4 5
3 ホテルの設備がモダンである 1 2 3 4 5 1 2 3 4 5 1 2 3 4 5
4 ホテルのインテリアや建物がよく管理されている 1 2 3 4 5 1 2 3 4 5 1 2 3 4 5
5 ホテル敷地内の空間が美しい 1 2 3 4 5 1 2 3 4 5 1 2 3 4 5
6 ホテル内レストランの雰囲気が良い 1 2 3 4 5 1 2 3 4 5 1 2 3 4 5
7 ホテル内ショップが魅力的である 1 2 3 4 5 1 2 3 4 5 1 2 3 4 5
8 ホテルのロビーが快適である 1 2 3 4 5 1 2 3 4 5 1 2 3 4 5
9 ベッドルーム,バスルームが清潔で使いやすい 1 2 3 4 5 1 2 3 4 5 1 2 3 4 5
10 ホテル内の照明が明るい 1 2 3 4 5 1 2 3 4 5 1 2 3 4 5
11 スポーツ,フィットネス設備がよく整備されている 1 2 3 4 5 1 2 3 4 5 1 2 3 4 5
12 ホテルのロビーでかかっている音楽が良い 1 2 3 4 5 1 2 3 4 5 1 2 3 4 5
13 客室とロビーの匂い・香料が良い 1 2 3 4 5 1 2 3 4 5 1 2 3 4 5
14 ホテルの食事がおいしい 1 2 3 4 5 1 2 3 4 5 1 2 3 4 5
B 信頼性
1 ホテルの予約は簡単で迅速にできること 1 2 3 4 5 1 2 3 4 5 1 2 3 4 5
2 ホテルの部屋は予約通りに整っていること 1 2 3 4 5 1 2 3 4 5 1 2 3 4 5
3 ホテルの料金は正確に計算されていること 1 2 3 4 5 1 2 3 4 5 1 2 3 4 5
4 タオルや石けんなどの消耗品が最初の日の宿泊から
不足無くそろっていること 1 2 3 4 5 1 2 3 4 5 1 2 3 4 5
5 もしなにか問題があったときに,従業員は
真剣に解決しようとすること 1 2 3 4 5 1 2 3 4 5 1 2 3 4 5
6 ホテルは料金計算について間違いを防ごうと
努力していること 1 2 3 4 5 1 2 3 4 5 1 2 3 4 5
7 エアコン,テレビ,ラジオ,照明,ミニバー
などの設備が完全に稼働すること 1 2 3 4 5 1 2 3 4 5 1 2 3 4 5
8 全体的に,料金に見合う内容であること 1 2 3 4 5 1 2 3 4 5 1 2 3 4 5
C 責任態勢
1 従業員はどのようなサービスが行なわれるかを
正確に伝えている 1 2 3 4 5 1 2 3 4 5 1 2 3 4 5
2 従業員のサービスは迅速である 1 2 3 4 5 1 2 3 4 5 1 2 3 4 5
3 従業員はつねに手助けをしようと望んでいる 1 2 3 4 5 1 2 3 4 5 1 2 3 4 5
4 従業員が忙しすぎて客のリクエストに
答える時間がない,などということがない 1 2 3 4 5 1 2 3 4 5 1 2 3 4 5
5 ホテルの設備についての十分な情報が与えられる 1 2 3 4 5 1 2 3 4 5 1 2 3 4 5
D 保障
1 何か質問したとき,従業員が十分な知識を持っている 1 2 3 4 5 1 2 3 4 5 1 2 3 4 5
2 従業員について信頼できる. 1 2 3 4 5 1 2 3 4 5 1 2 3 4 5
3 従業員が,地元についてよく知っている 1 2 3 4 5 1 2 3 4 5 1 2 3 4 5
4 ホテルが安全な環境を作っている 1 2 3 4 5 1 2 3 4 5 1 2 3 4 5
5 従業員は礼儀正しい 1 2 3 4 5 1 2 3 4 5 1 2 3 4 5
6 従業員は料金について明確に説明すること 1 2 3 4 5 1 2 3 4 5 1 2 3 4 5
E 共感性
1 従業員は親切で礼儀正しい 1 2 3 4 5 1 2 3 4 5 1 2 3 4 5
2 ホテルは顧客一人一人を大事にする 1 2 3 4 5 1 2 3 4 5 1 2 3 4 5
3 従業員は個人としてのつながりを大事にする 1 2 3 4 5 1 2 3 4 5 1 2 3 4 5
4 従業員は顧客個人個人のニーズを理解する 1 2 3 4 5 1 2 3 4 5 1 2 3 4 5
5 ホテルは心から顧客に関心を持っている 1 2 3 4 5 1 2 3 4 5 1 2 3 4 5
6 ホテルの営業時間が便利である 1 2 3 4 5 1 2 3 4 5 1 2 3 4 5

202
Part B2. 顧客の感性における重要性調査
特定のホテルにではなく,一般的にホテルに求めることとして評価してください.その項目の重要性はとても低いと
お考えの場合は1,その項目は大変必要不可欠とお考えの場合は5になります.重要度の程度に応じて○をつけてくだ
さい.
顧客の感性的ニーズ 重要性評価
便利なホテルに泊まりたい 1 2 3 4 5
環境が魅力的なホテルが良い 1 2 3 4 5
清潔なホテルが良い 1 2 3 4 5
歓迎してくれるような環境のホテルが良い 1 2 3 4 5
ホテルに泊まるときにはハッピーになりたい 1 2 3 4 5
信頼感を感じるホテルに泊まりたい 1 2 3 4 5
ホテルに泊まるときにはリラックスしたい 1 2 3 4 5
平和な落ち着いた感じのするホテルが良い 1 2 3 4 5
ホテルでは満足感を得たい 1 2 3 4 5
広々としたホテルが良い 1 2 3 4 5
エレガントなホテルが良い 1 2 3 4 5
フレンドリーな雰囲気のホテルが良い 1 2 3 4 5
モダンな雰囲気のホテルが良い 1 2 3 4 5
くつろぐ雰囲気のホテルが良い 1 2 3 4 5
情熱的な雰囲気のホテルが良い 1 2 3 4 5
静かな雰囲気のホテルが良い 1 2 3 4 5
Part B3. 現在の宿泊ホテルについての感性評価
現在お泊まり,もしくはもっとも最近お泊まりのホテルのサービスについておききします.5段階になっていますの
でもっとも当てはまるところに○をつけてください
感性評価
便利な 5 4 3 2 1 便利でない
魅力的な 5 4 3 2 1 魅力的でない
清潔な 5 4 3 2 1 汚ない
歓迎するような 5 4 3 2 1 歓迎するようでない
ハッピーな 5 4 3 2 1 ハッピーでない
信頼できる 5 4 3 2 1 信頼できない
リラックスできる 5 4 3 2 1 緊張する
落ち着いた 5 4 3 2 1 落ち着かない
満足感のある 5 4 3 2 1 満足感のない
広々とした 5 4 3 2 1 狭い
エレガントな 5 4 3 2 1 エレガントでない
フレンドリーな 5 4 3 2 1 フレンドリーでない
モダンな 5 4 3 2 1 モダンでない
くつろげる 5 4 3 2 1 くつろげない
情熱的な 5 4 3 2 1 情熱的でない
静かな 5 4 3 2 1 騒々しい

203
SECTION C 全体的評価
今回お泊まりのホテルについて,サービスの満足度は
まったく不満 ❏
すこし不満 ❏
どちらでもない ❏
すこし満足 ❏
とても満足 ❏
SECTION D 満足度お勧め度
今回お泊まりのホテルのサービスについて,どのぐらいの満足度お勧め度かを評価してください.評価が高いほうが
5,低い方が1です.
No お勧め 評価
1 このホテルを友人や親族,知人に勧めたい 1 2 3 4 5
2 このホテルに払った代金はそのサービスに比べると安い 1 2 3 4 5
3 このホテルはいつも最初の候補として考える 1 2 3 4 5
SECTION E 今回お泊まりのホテルについて
今回お泊まりになったホテルのサービスについてお書きください
- 改善すべき,あるいは今後実施すべきサービスは
___________________________________________________________________________________________________
_______________________________________________________________
- 感性的,あるいは感覚的な要望として欲しいことは
___________________________________________________________________________________________________
_______________________________________________________________
ご協力大変ありがとうございました

204
The second questionnaire in English
Questionnaire for Hotel Services: KANO SURVEY. This survey is to determine the relationship between customer responses
and attribute performance of hotel services. The questionnaire would take less than 10 minutes to accomplish. All the
information provided is kept strictly confidential. Please try to give your best estimate rather than leaving the answers blank.
Your time is highly appreciated.
SECTION A GENERAL INFORMATION This section asks questions about your demographic attributes. It will be
helpful in making comparisons between categories, such as monthly incomes, educational levels, etc.
1. Name of the hotel you stayed in: ______________________
2. Gender : ❏ Male ❏ Female
3. Age (years) : ❏ ≤ 20 ❏ 21 – 30 ❏ 31 – 40 ❏ 41 – 50 ❏ > 50
4. Country of residence: ________________________
5. Frequency of travel:
❏ Once a year or less ❏ Every 3 months ❏ ≥ Once a month
❏ Every 6 months ❏ Every month
6. Purpose of stay:
❏ Vacation ❏ Conference ❏ Others: ___________________
❏ Business trip ❏ Social Visit
7. Amount of time spent at the hotel (days):
❏ ≤ 3 ❏ 4 – 7 ❏ 8 – 11 ❏ > 11
8. Monthly income:
❏ ≤ US$ 2000 ❏ US$ 2001-3000 ❏ US$ 3001-4000 ❏ >US$ 4000
9. Frequency of stay at the hotels during year 2008 to 2009:
❏ Less than once a year ❏ Twice a year ❏ Four times a year
❏ Once a year ❏ Three times a year ❏ Five times or more a year
10. Highest education achieved:
❏ Elementary school or equivalent ❏ High school or equivalent ❏ Post-graduate
❏ Junior high or equivalent ❏ College or University Degree ❏ Other: ______________
11. Occupation:
❏ Clerical/Office ❏ Engineering ❏ Entrepreneur/Self Employed ❏ Management
❏ Education ❏ Finance ❏ Marketing ❏ Student
❏ Unemployed ❏ Others: _________________
SECTION B KANO SURVEY This section aims to explore how far the customer‟s responses to the
performance of hotel service attributes
Direction: Based on your experiences in the hotel services, please encircle one of the following five choices: 1 = I enjoy it that way 2 = I expect it that way 3 = I am neutral
4 = I dislike it but I can live with it that way 5 = I dislike it and I cannot accept it
No Service Items Choices
A TANGIBLE ELEMENTS/PHYSICAL SURROUNDINGS
1 a. The receptionist and information desk is visually appealing 1 2 3 4 5
b. The receptionist and information desk is not visually appealing 1 2 3 4 5
2 a. The employees‟ uniforms are clean, nice, and neat 1 2 3 4 5
b. The employees‟ uniforms are not clean, nice, and neat 1 2 3 4 5
3 a. The hotel has modern-looking equipment 1 2 3 4 5
b. The hotel doesn‟t have modern-looking equipment 1 2 3 4 5
4 a. The hotel‟s interior and exterior are well managed and maintained 1 2 3 4 5
b. The hotel‟s interior and exterior are not well managed and maintained 1 2 3 4 5
5 a. The outdoor environment is visually clean 1 2 3 4 5
b. The outdoor environment is not visually clean 1 2 3 4 5

205
No Service Items Choices
6 a. The atmosphere of restaurant is inviting appetite 1 2 3 4 5
b. The atmosphere of restaurant is not inviting appetite 1 2 3 4 5
7 a. The shops are attractive 1 2 3 4 5
b. The shops are not attractive 1 2 3 4 5
8 a. The hotel‟s lobby is comfortable 1 2 3 4 5
b. The hotel‟s lobby is not comfortable 1 2 3 4 5
9 a. The bedroom and bathroom are clean and convenient 1 2 3 4 5
b. The bedroom and bathroom are not clean and convenient 1 2 3 4 5
10 a. The hotel is well lighted 1 2 3 4 5
b. The hotel is not well lighted 1 2 3 4 5
11 a. The sports facilities are well maintained, clean, and convenient 1 2 3 4 5
b. The sports facilities are not well maintained, clean, and convenient 1 2 3 4 5
12 a. The music in hotel‟s lobby is soft and nice 1 2 3 4 5
b. The music in hotel‟s lobby is not soft and nice 1 2 3 4 5
13 a. The scent in hotel‟s room and lobby is refreshing 1 2 3 4 5
b. The scent in hotel‟s room and lobby is not refreshing 1 2 3 4 5
14 a. The meals served at the hotel are delicious 1 2 3 4 5
b. The meals served at the hotel are not delicious 1 2 3 4 5
B RELIABILITY
1 a. Your hotel reservation is handled efficiently and effectively 1 2 3 4 5
b. Your hotel reservation is not handled efficiently and effectively 1 2 3 4 5
2 a. Your booked guestroom is ready as promised 1 2 3 4 5
b. Your booked guestroom is not ready as promised 1 2 3 4 5
3 a. The bill is charged accurately 1 2 3 4 5
b. The bill is not charged accurately 1 2 3 4 5
4 a. All size of servings are given correctly the first time 1 2 3 4 5
b. All size of servings are not given correctly the first time 1 2 3 4 5
5 a. The employees show a sincere interest in solving your problem 1 2 3 4 5
b. The employees don‟t show a sincere interest in solving your problem 1 2 3 4 5
6 a. The hotel insists on error-free records 1 2 3 4 5
b. The hotel doesn‟t insist on error-free records 1 2 3 4 5
7 a. AC, TV, radio, lights, mini bar, & other equipment work properly 1 2 3 4 5
b. AC, TV, radio, lights, mini bar, & other equipment don‟t work properly 1 2 3 4 5
8 a. Overall, you get what you pay for 1 2 3 4 5
b. Overall, you don't get what you pay for 1 2 3 4 5
C RESPONSIVENESS
1 a. The employees tell you exactly when services will be performed 1 2 3 4 5
b. The employees don‟t tell you exactly when services will be performed 1 2 3 4 5
2 a. The employees give you prompt service 1 2 3 4 5
b. The employees don‟t give you prompt service 1 2 3 4 5
3 a. The employees are always willing to help you 1 2 3 4 5
b. The employees are not always willing to help you 1 2 3 4 5
4 a. The employees are never too busy to respond to your requests 1 2 3 4 5
b. The employees are not never too busy to respond to your requests 1 2 3 4 5
5 a. Informative literature about the hotel facilities is provided 1 2 3 4 5
b. Informative literature about the hotel facilities is not provided 1 2 3 4 5
D ASSURANCE
1 a. The employees have knowledge in answering your enquiries 1 2 3 4 5
b. The employees don‟t have knowledge in answering your enquiries 1 2 3 4 5
2 a. The behavior of employees instills confidence in you 1 2 3 4 5
b. The behavior of employees doesn‟t instill confidence in you 1 2 3 4 5
3 a. The employees know well about local places of interest 1 2 3 4 5
b. The employees don‟t know well about local places of interest 1 2 3 4 5
4 a. The hotel provides a safe environment 1 2 3 4 5
b. The hotel doesn‟t provide a safe environment 1 2 3 4 5

206
No Service Items Choices
5 a. The employees are consistently courteous with you 1 2 3 4 5
b. The employees are not consistently courteous with you 1 2 3 4 5
6 a. The staff explains clearly charges on your account 1 2 3 4 5
b. The staff doesn‟t explain clearly charges on your account 1 2 3 4 5
E EMPATHY
1 a. The employees are helpful, friendly, and respectful 1 2 3 4 5
b. The employees are not helpful, friendly, and respectful 1 2 3 4 5
2 a. The hotel gives you individual full attention 1 2 3 4 5
b. The hotel doesn‟t give you individual full attention 1 2 3 4 5
3 a. The hotel has employees who give you personal attention 1 2 3 4 5
b. The hotel doesn‟t have employees who give you personal attention 1 2 3 4 5
4 a. The employees understand your specific needs 1 2 3 4 5
b. The employees don‟t understand your specific needs 1 2 3 4 5
5 a. The hotel has your best interests at heart 1 2 3 4 5
b. The hotel doesn‟t have your best interests at heart 1 2 3 4 5
6 a. The hotel has operating hours convenient to you 1 2 3 4 5
b. The hotel doesn‟t have operating hours convenient to you 1 2 3 4 5
Thank You very much for your participation!

207
The third questionnaire in English
Questionnaire for Hotel Services: PAST AND PRESENT CUSTOMER‟S CHOICES
The purpose of this survey is to collect information on your experience in hotel services in the past and present experience. The
questionnaire would take less than 10 minutes to accomplish. All the information provided is kept strictly confidential. Please
try to give your best estimate rather than leaving the answers blank. Your time is highly appreciated.
SECTION A GENERAL INFORMATION This section asks questions about your demographic attributes. It will be
helpful in making comparisons between categories, such as monthly incomes, educational levels, etc.
1. Name of the hotel you stayed in: ______________________
2. Gender : ❏ Male ❏ Female
3. Age (years) : ❏ ≤ 20 ❏ 21 – 30 ❏ 31 – 40 ❏ 41 – 50 ❏ > 50
4. Country of residence: ________________________
5. Frequency of travel:
❏ Once a year or less ❏ Every 3 months ❏ ≥ Once a month
❏ Every 6 months ❏ Every month
6. Purpose of stay:
❏ Vacation ❏ Conference ❏ Others: ___________________
❏ Business trip ❏ Social Visit
7. Amount of time spent at the hotel (days):
❏ ≤ 3 ❏ 4 – 7 ❏ 8 – 11 ❏ > 11
8. Monthly income:
❏ ≤ US$ 2000 ❏ US$ 2001-3000 ❏ US$ 3001-4000 ❏ >US$ 4000
9. Frequency of stay at the hotels during year 2008 to 2009:
❏ Less than once a year ❏ Twice a year ❏ Four times a year
❏ Once a year ❏ Three times a year ❏ Five times or more a year
10. Highest education achieved:
❏ Elementary school or equivalent ❏ High school or equivalent ❏ Post-graduate
❏ Junior high or equivalent ❏ College or University Degree ❏ Other: ________________
11. Occupation:
❏ Clerical/Office ❏ Engineering ❏ Entrepreneur/Self Employed ❏ Management
❏ Education ❏ Finance ❏ Marketing ❏ Student
❏ Unemployed ❏ Others: _________________
SECTION B PAST AND PRESENT CUSTOMER‟S CHOICES SURVEY This section aims to explore the
information about the level of your choice of hotel services in the past and present
Direction:
Based on your experience in hotel services, please rate the appropriate importance of service attributes by giving √ in the boxes
of „Past Choice‟ and „Present Choice‟.
Past Choice: The conditions of your past experience of stay in hotel (in the past 2 years)
Present Choice: The conditions of your current experience of stay in hotel
Note for Importance:
L = Low
M= Medium
H= High (Don‟t forget to rank both choices)
No Service Items
The Importance
Past Choice Present Choice
L M H L M H
A TANGIBLE ELEMENTS/PHYSICAL SURROUNDINGS
1 The receptionist and information desk is visually appealing
2 The employees‟ uniforms are clean, nice, and neat
3 The hotel has modern-looking equipment
4 The hotel‟s interior and exterior are well managed and maintained

208
No Service Items
The Importance
Past Choice Present Choice
L M H L M H
5 The outdoor environment is visually clean
6 The atmosphere of restaurant is inviting appetite
7 The shops are attractive
8 The hotel‟s lobby is comfortable
9 The bedroom and bathroom are clean and convenient
10 The hotel is well lighted
11 The sports facilities are well maintained, clean, and convenient
12 The music in hotel‟s lobby is soft and nice
13 The scent in hotel‟s room and lobby is refreshing
14 The meals served at the hotel are delicious
B RELIABILITY
1 Your hotel reservation is handled efficiently and effectively
2 Your booked guestroom is ready as promised
3 The bill is charged accurately
4 All size of servings are given correctly the first time
5 The employees show a sincere interest in solving your problem
6 The hotel insists on error-free records
7 AC, TV, radio, lights, mini bar, & other equipment work properly
8 Overall, you got what you paid for
C RESPONSIVENESS
1 The employees tell you exactly when services will be performed
2 The employees give you prompt service
3 The employees are always willing to help you
4 The employees are never too busy to respond to your requests
5 Informative literature about the hotel facilities is provided
D ASSURANCE
1 The employees have knowledge in answering your enquiries
2 The behavior of employees instills confidence in you
3 The employees know well about local places of interest
4 The hotel provides a safe environment
5 The employees are consistently courteous with you
6 The staff explains clearly charges on your account
E EMPATHY
1 The employees are helpful, friendly, and respectful
2 The hotel gives you individual full attention
3 The hotel has employees who give you personal attention
4 The employees understand your specific needs
5 The hotel has your best interests at heart
6 The hotel has operating hours convenient to you
Thank You very much for your participation!