k white c tri a /p o a trash fish/low ... - aquaculture.asiaaquaculture.asia/files/online_03/fao...
TRANSCRIPT

Trash fish/low-value fish prepared for feeding to brown-marbled grouper, Bandar Lampung, Indonesia
Co
ur
tesy
of
fAo
/PA
triC
k W
hit
e
1
Annex 2
environmental Impact Study
executIve SummAry The project TCP/RAS/3203 “Reducing the dependence on the utilization of trash fish/low-value fish as an aquaculture feed for marine finfish in the Asian region” involved assessing and comparing the environmental impacts between fish fed pellet or trash fish/low-value fish in trial cage farms across four countries.
Baseline data comprising position, currents and bathymetry were collected from the trial cage farms. Current speed, direction and dispersion data indicate water exchange and mixing at the cages, and represent important factors influencing environmental impacts and production carrying capacities. Water samples were collected on fortnightly/monthly basis from inside and outside the cages, and used to compare water quality between fish fed pellets and trash fish/low-value fish. Sediment quality beneath and close to the cages was assessed for organic loading. A test was made to determine the level of over feeding by the farmers in Viet Nam and Thailand. A series of experiments were undertaken to assess the risk of bacterial pathogen transfer to the cultured fish from feeding trash fish, and the scale of nutrient leaching from trash fish/low-value fish that was stored and then fed after a number of days. Comparative estimates were made of the energy use between the fishing for trash fish and the manufacture of the pelleted feeds. In addition, an estimate was made of the difference between the Fish-in Fish-out (FIFO) ratios derived from feeding either pellets or trash fish.
The results of the study demonstrated that irrespective of culture species, there was no significant difference in the environmental impacts associated with feeding fish either trash fish/low-value fish or commercial pellets. There were however increases in the bacterial loading in the trash fish that was stored on ice before feeding, as well as an increase in the levels of bacteria released to the environment when feeding 2- and 3-day old trash fish/low-value fish. Finally, in contrast to feeding trash fish/low-value fish, higher levels of nutrient leaching into the water column were observed from the use of pellet feeds.
The study also revealed that the energy required to produce a kilogramme of fish using trash fish/low-value fish was significantly lower than that required when using pellet feeds, and that the FIFO ratio for the production of a unit weight of marine fish was approximately three times lower with the use of pellet feeds than with trash fish/low-value fish.
The lack of significant measurable differences in the impacts of feed type on water and sediment quality may have been due to the low stocking densities used in the farm trials. Higher stocking densities and corresponding input levels would likely have led to different results. This conclusion was accepted by the stakeholders at the farmer workshops, and affirms the significance of control measures such as limiting farm numbers, and fish and feed inputs to ensure that effluent loads remain within the assimilative capacity of the environment. Zoning can be applied to limit the number of farms in a culture area to an optimal density, and better environmental management can be achieved by optimising stocking densities and improving feed management practices. Finally, reducing the energy cost and the amount of fish needed to produce

Transition from low-value fish to compound pellets in marine cage farming in Asia-Pacific2
a unit weight of marine fish are issues that can also be addressed at the farm level. This can be achieved by improving general farm management, in particular feed and feed management practices.
1. IntroductIonThe project TCP/RAS/3203 (D) “Reducing the dependence on the utilization of trash fish/low-value fish as feed for aquaculture of marine finfish in the Asian region” is a Technical Cooperation Programme of the Food and Agriculture Organization (FAO) and was coordinated by the Network of Aquaculture Centres in Asia-Pacific (NACA). The project inception workshop was held in September 2008, and involved case studies in 4 countries (China, Indonesia, Thailand and Viet Nam).
The production of high value marine fish in the Asia-Pacific region is dependent on the use of trash fish/low-value fish. As a result of the high food conversion ratios associated with the use of these fish as a feed, the practice remains a contentious issue from both resource use and environmental integrity perspectives.
The continued growth of this sub-sector in the Asia-Pacific region will likely depend on a shift from the direct use of trash/low-value feedfish to formulated feeds. Using case studies based on small-scale farmers in the four countries, the study compared production, economic and environmental differences between different culture practices and finfish species.
2. envIronmentAl ImpActFeed type, quality and feeding strategy have major influences on the environmental impacts between shore-based and open water farming systems. Excess nutrients that are not utilised by the culture fish or shrimp are released into the environment where they accumulate. Whether a nutrient becomes a pollutant in an aquatic system is a function of whether it is a limiting nutrient in a given environment, its concentration, and the carrying capacity of that ecosystem. In freshwater bodies, phosphorus is typically the limiting nutrient (Hudson, Taylor and Schindler, 2000), and thus its addition will dictate the amount of primary production (algal growth). In marine environments, nitrogen is typically the limiting nutrient (Howarth and Marino, 2006), and thus its addition will also dictate primary production.
The excess nutrients are released into the environment in two forms - dissolved and particulate.
dissolved nutrientsSoluble nutrients derived from the digestion processes of farmed animals dissolve in the water column, and their dilution and transport is a function of water current dynamics. Typically, dissolved nutrients are quickly dispersed and utilised by bacteria, phytoplankton and zooplankton. However, under certain hydrodynamic conditions, high levels of nutrients released on a continuous basis can lead to eutrophication and/or algal blooms.
Eutrophication, low oxygen events, and fish kills affecting local fisheries and fish cage production systems are common events in some lakes and reservoirs in Asia. These events can occur when there is a high density of small scale fish cage farms that together produce volumes of excess nutrients in dissolved and particulate forms that are beyond the carrying capacity of the water bodies (Abery et al., 2005).
3
According to Olsen et al. (2006), the most important factors determining the impact of fish farming on water column nutrients, water quality, and pelagic ecosystems are:
•The loading rate of inorganic nutrients, especially nitrogen in marine systemsand phosphorus in freshwater systems and in some marine seas such as the Mediterranean.
•Thelocalhydrodynamicconditionsandthedepthofthecagesites.•Thedegreeofexposureofbaysandthenear-shorecoastalareasintermsofwater
circulation. •Thestockingdensityofthefishandthefeedconversionratios(FCR)attainedat
a local scale, and at a regional scale, the density of the fish farms.
Of these, the hydrodynamics of the system is the most important factor affecting the impacts of the nutrients on the water column. At the local level, a large farm (or a large number of small farms) located in an enclosed water body would have a higher impact on the environment than the same farms being located in more open sites that are exposed to more dynamic hydrodynamic conditions. The impact of the latter would be less severe but more prevalent i.e. the impacts would be spread over a wider area.
Excess inorganic nitrogen and phosphorus derived from fish cages is available immediately for phytoplankton uptake. Sites with low flushing will exhibit increased phytoplankton biomass with peak soluble nutrient loadings occurring during those periods of highest feed input.
Sedimented nutrientsSolid wastes comprising uneaten feed pellets, feed fines (fine particulates caused by poor feed manufacture, pellet damage during transport, or by using automatic feeding systems), and faecal material can accumulate beneath production cages and in the outflows of aquaculture facilities. Particulate nutrients settle and are assimilated by sediment benthos flora and fauna. If particulate nutrients are released in excess of the assimilation capacity, they build up and alter the biodiversity of the area. In extreme cases, the accumulation of nutrients can cause anoxic conditions, kill benthic organisms in the sediment, and smother nearby sea grasses and corals. The accumulation of the nutrients in the sediments depends on the local currents and depth.
Organic sediments can impact sensitive benthic habitats (e.g. sea grasses, corals) close to the farm (Holmer et al., 2008), and these may be important as a food source or habitat for fish.
A high FCR suggests that the fish are using relatively low levels of the dietary nutrients for somatic growth. The unassimilated nutrients will be released into the environment. Improvements in the FCR reduce the level of nutrients released to the environment, and thus reduce the impacts of the farming operation. A reduction in feed losses and improvements in nutrient conversion efficiency would improve FCR. But FCR is also affected by water temperature, fish size and fish status, most notably health.
3. methodology And fIndIngSRoutine water quality parameters were monitored at each of the farm sites, however the parameters that were monitored varied between the trial countries. The details of the water quality monitoring protocols that were adopted in the trial countries, and the results thereof, are provided in Annexure 1. However, as a guide the following parameters were recorded:
•Temperature•pH
small continus

Transition from low-value fish to compound pellets in marine cage farming in Asia-Pacific4
•Salinity•Turbidity(Secchidisk–depth)•Dissolvedoxygen•Ammonia
In some cases, additional parameters were collected and analysed. These included:•Nitrite•Nitrate•Phyto-andzooplankton.
Each parameter was measured both inside and outside the cages, and control samples were collected from un-impacted reference locations during the latter part of the data collection process (Figure 1).
In addition to the regular fortnightly/monthly sampling, an additional survey was carried out to establish:
•Bathymetry•Sedimentcharacteristics–benthicfaunaandqualitativecharacteristicsusingmini
corer and grab samples•Currentspeedsanddirection(drogues)•Currentdispersion(drogues)•Bacterialanalysis(totalbacterialcounts)•GISmappingoftheprojectcagesanddroguedispersion
The above data collection was carried out from selected trial cage farms in Nha Trang, Viet Nam (10 farms), Phuket, Thailand (5 farms) and Bandar Lampung, Indonesia (5 farms).
3.1 gIS mapping of the project cagesCagesweremappedusingaGPS (GarminOregon300), andreadingswere takenatthe corners of each farm using the format N DD° MM.MMM’ E DDD° MM.MMM’ (degrees and decimal minutes). While the farms in Viet Nam were clustered in one area, the farms in Indonesia and Thailand were distributed across a number of locations (Figure 2).
WSWS
WS
WS
Referencesite
Figure 1Water quality sample locations

52. Environmental impact
3.2 current speed, direction and dispersionUnder cage culture conditions, water exchange is one of the most important factors influencing environmental impacts and production carrying capacities. In order to assess water exchange and mixing at the cage sites, current speed, direction and dispersion were measured.
Current DirectionThe current direction was determined using drogues (Figure 3). In deep water areas (greater than 10 meters), the drogues were deployed at a depth of 5 meters, and in the shallower areas (below 5 meters), they were deployed at 2 meters. The drogues were released for a period of between 20 and 40 minutes, and their location was regularly mappedusingGIS.Eightdrogueswere released simultaneously, and the increase insurface area coverage (dispersal) was assessed at regular intervals.
In open waters, the current speed varied between 2.16 cm/sec in Viet Nam to 5.46 cm/sec in Indonesia. In estuarine waters, the water flow was significantly faster at 38 cm/sec (Table 1).
Figure 2the location of the cage farms included in the study
cage sites in viet nam cage farm sites in thailand
cage farm sites in Indonesia

Transition from low-value fish to compound pellets in marine cage farming in Asia-Pacific6
Table 1current speed and direction at the cage sites
date place Average current speed (cm/sec)
current speed range (cm/sec)
11/01/2010 Viet Nam 2.2 1.7 – 2.6
15/01/2010 Thailand - Phuket 4.6 2.2 – 7.7
16/01/2010 Thailand – Krabi estuary 38.3 26.7 – 56.5
20/01/2010 indonesia - Tanjung 5.9 2.2 – 9.6
20/01/2010 indonesia - Pukawan 4.0 3.7 – 4.3
20/01/2010 indonesia - Mitam 4.7 4.7 – 4.8
21/01/2010 indonesia – ringang 5.5
Current dispersionCurrent dispersion is a measure of the mixing of the water column and an indicator of the degree to which nutrients derived from a fish farm are diluted in the receiving water body. Dispersion rates ranged from zero at one site in Indonesia to 33.8 percent per minute in Thailand (Table 2). The estuarine site in Thailand that recorded the highest current speeds also recorded the highest dispersion rate at 1 985 percent per min.
3.3 BathymetryWater depth (bathymetry) was established using a hand held echo sounder (Plastimo Echotest II) at the corner of project farms, reference sample sites, and the location points of the drogue readings.
Figure 3drogues used for the measurement of current dispersion
drogue design deployed drogues
Table 2Water current dispersion rates in the project area
date country Average dispersion (percent/min)
dispersion range (percent/min)
11/01/2010 Viet Nam 11.9 6.5 – 24.8
15/01/2010 Thailand - Phuket 33.9 31 – 36.7
16/01/2010 Thailand - Krabi 1 985 750 – 3 680
20/01/2010 indonesia - Tanjung 5.4 3.3 – 7.5
21/01/2010 indonesia - ringang 0.0 -
21/01/2010 indonesia - Mitam 16.7 5.0 – 28.3
21/01/2010 indonesia - Puhawang 5.0 0 – 10.0
73. Methodology and findings
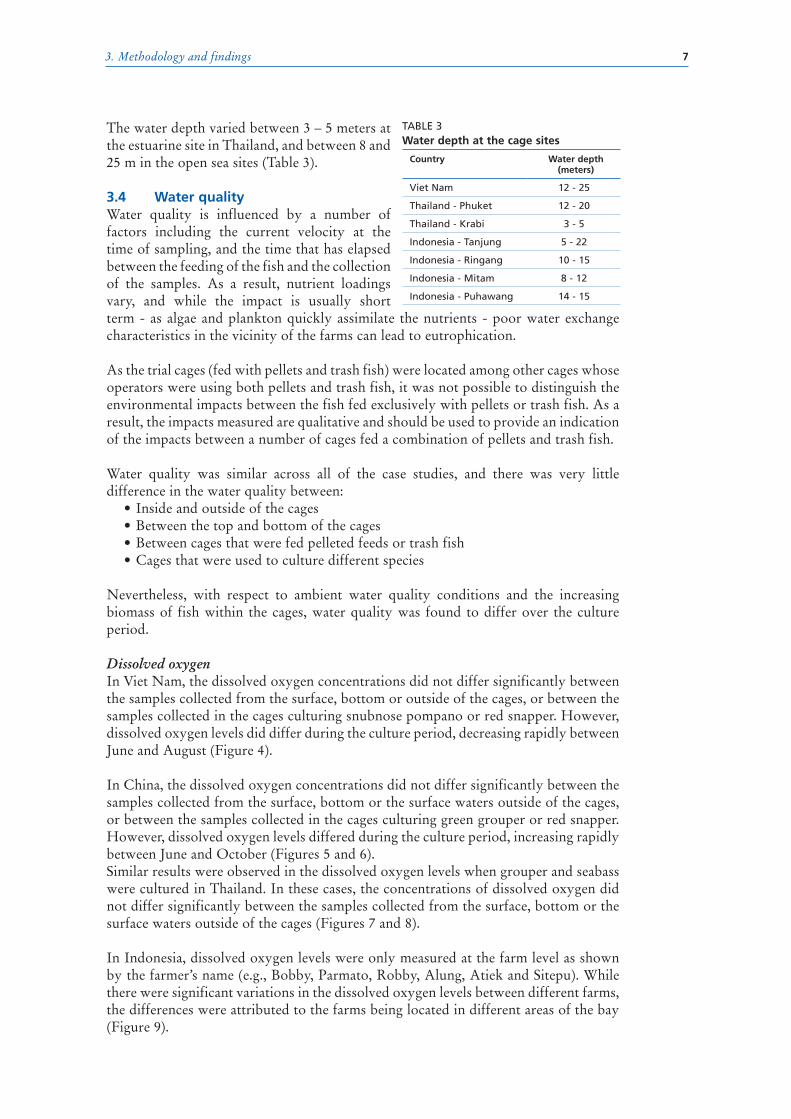
Thewaterdepthvariedbetween3–5metersatthe estuarine site in Thailand, and between 8 and 25 m in the open sea sites (Table 3).
3.4 Water qualityWater quality is influenced by a number of factors including the current velocity at the time of sampling, and the time that has elapsed between the feeding of the fish and the collection of the samples. As a result, nutrient loadings vary, and while the impact is usually short term - as algae and plankton quickly assimilate the nutrients - poor water exchange characteristics in the vicinity of the farms can lead to eutrophication.
As the trial cages (fed with pellets and trash fish) were located among other cages whose operators were using both pellets and trash fish, it was not possible to distinguish the environmental impacts between the fish fed exclusively with pellets or trash fish. As a result, the impacts measured are qualitative and should be used to provide an indication of the impacts between a number of cages fed a combination of pellets and trash fish.
Water quality was similar across all of the case studies, and there was very little difference in the water quality between:
•Insideandoutsideofthecages•Betweenthetopandbottomofthecages•Betweencagesthatwerefedpelletedfeedsortrashfish•Cagesthatwereusedtoculturedifferentspecies
Nevertheless, with respect to ambient water quality conditions and the increasing biomass of fish within the cages, water quality was found to differ over the culture period.
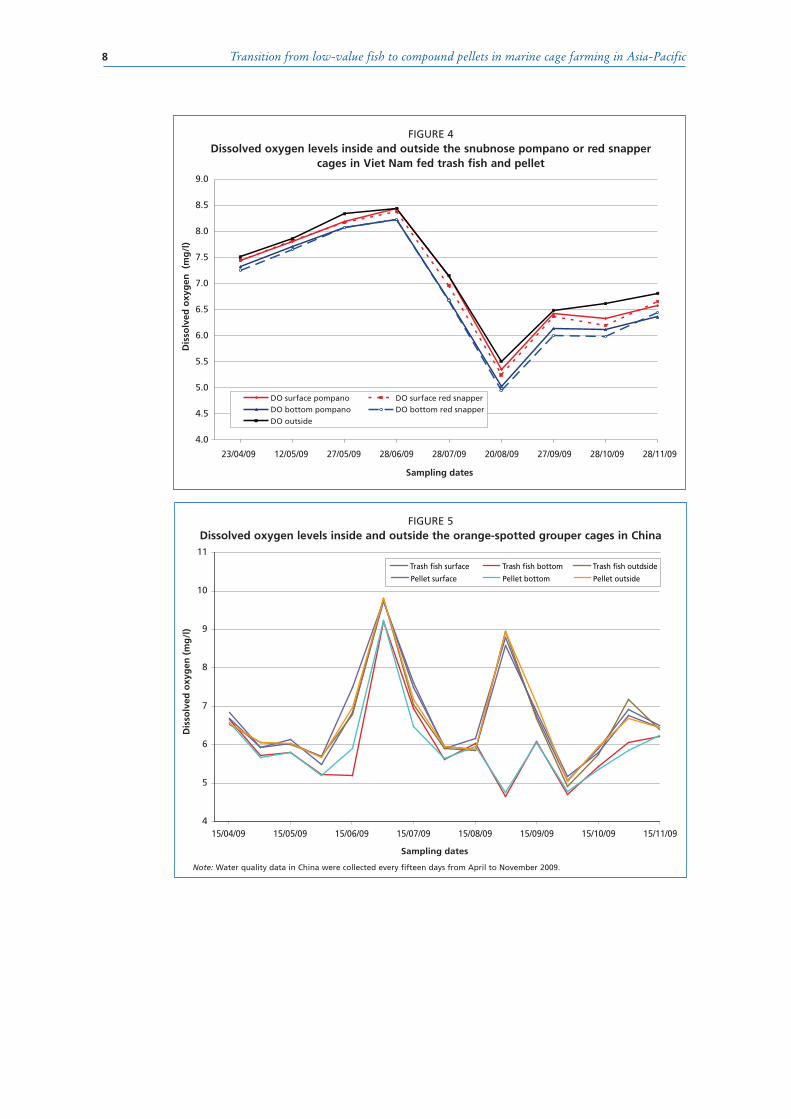
Dissolved oxygenIn Viet Nam, the dissolved oxygen concentrations did not differ significantly between the samples collected from the surface, bottom or outside of the cages, or between the samples collected in the cages culturing snubnose pompano or red snapper. However, dissolved oxygen levels did differ during the culture period, decreasing rapidly between June and August (Figure 4).
In China, the dissolved oxygen concentrations did not differ significantly between the samples collected from the surface, bottom or the surface waters outside of the cages, or between the samples collected in the cages culturing green grouper or red snapper. However, dissolved oxygen levels differed during the culture period, increasing rapidly between June and October (Figures 5 and 6).Similar results were observed in the dissolved oxygen levels when grouper and seabass were cultured in Thailand. In these cases, the concentrations of dissolved oxygen did not differ significantly between the samples collected from the surface, bottom or the surface waters outside of the cages (Figures 7 and 8).
In Indonesia, dissolved oxygen levels were only measured at the farm level as shown by the farmer’s name (e.g., Bobby, Parmato, Robby, Alung, Atiek and Sitepu). While there were significant variations in the dissolved oxygen levels between different farms, the differences were attributed to the farms being located in different areas of the bay (Figure 9).
Table 3Water depth at the cage sites
country Water depth (meters)
Viet Nam 12 - 25
Thailand - Phuket 12 - 20
Thailand - Krabi 3 - 5
indonesia - Tanjung 5 - 22
indonesia - ringang 10 - 15
indonesia - Mitam 8 - 12
indonesia - Puhawang 14 - 15
Transition from low-value fish to compound pellets in marine cage farming in Asia-Pacific8
4.0
4.5
5.0
5.5
6.0
6.5
7.0
7.5
8.0
8.5
9.0
23/04/09 12/05/09 27/05/09 28/06/09 28/07/09 20/08/09 27/09/09 28/10/09 28/11/09
Sampling dates
Dis
solv
ed o
xyg
en (
mg
/l)
DO surface pompano DO surface red snapperDO bottom pompano DO bottom red snapperDO outside
FIGURE 4Dissolved oxygen levels inside and outside the snubnose pompano or red snapper
cages in Viet Nam fed trash fish and pellets
Figure 4dissolved oxygen levels inside and outside the snubnose pompano or red snapper
cages in viet nam fed trash fish and pellet
4
5
6
7
8
9
10
11
15/04/09 15/05/09 15/06/09 15/07/09 15/08/09 15/09/09 15/10/09 15/11/09
Trash fish surface Trash fish bottom Trash fish outdside
Pellet surface Pellet bottom Pellet outside
FIGURE 5Dissolved oxygen levels inside and outside the orange-spotted grouper cages in China
Sampling dates
Dis
solv
ed o
xyg
en (
mg
/l)
Figure 5dissolved oxygen levels inside and outside the orange-spotted grouper cages in china
Note: Water quality data in China were collected every fifteen days from april to November 2009.

93. Methodology and findings
4
5
6
7
8
9
10
15/04/09 15/05/09 15/06/09 15/07/09 15/08/09 15/09/09 15/10/09 15/11/09
FIGURE 6Dissolved oxygen levels inside and outside the red snapper cages in China
Sampling dates
Dis
solv
ed o
xyg
en (
mg
/l)
Surface trash fish Bottom trash fish Outside trash fish
Surface pellet Bottom pellet Outside pellet
Figure 6dissolved oxygen levels inside and outside the red snapper cages in china
3
3.5
4
4.5
5
5.5
6.0
09/04/09 22/04/09 20/05/09 18/06/09 22/07/09 19/08/09 10/11/0909/10/09 16/12/09 18/01/10
FIGURE 7Dissolved oxygen levels inside (surface and bottom) and outside (surface) the
brown-marbled grouper cages in Thailand
Dis
solv
ed o
xyg
en (
mg
/l)
Sampling dates
Surface pellet Surface trash fish Bottom pellet
Bottom trash fish Outside pellet Outside trash fish
Figure 7dissolved oxygen levels inside (surface and bottom) and outside (surface) the brown-
marbled grouper cages in thailand

Transition from low-value fish to compound pellets in marine cage farming in Asia-Pacific10
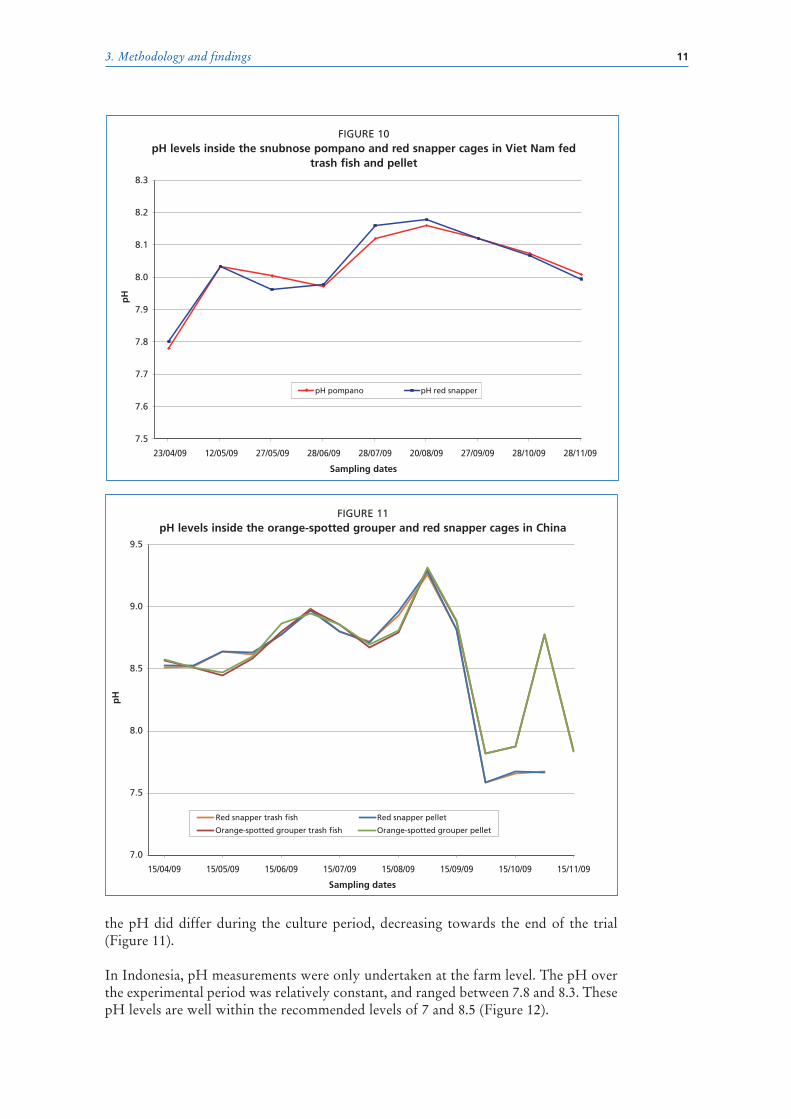
pHIn Viet Nam, the pH concentrations of the samples did not differ significantly between those collected in the cages culturing either pompano or red snapper. However, the pH differed during the culture period, increasing between April and August and decreasing slightly between September and November (Figure 10).
In China, the pH concentrations did not differ significantly between those samples collected in the cages culturing orange-spotted grouper or red snapper - the exception being the penultimate three sampling periods. The reason why significant differences were observed at these sampling periods could not be established. Nevertheless,
3.00
3.50
4.00
4.50
5.00
5.50
6.00
6.50
10/04/09 24/04/09 22/05/09 17/06/09 21/07/09 18/08/09 10/10/09 19/11/09
FIGURE 8Dissolved oxygen levels inside (surface and bottom) and outside (surface) the
barramundi cages in Thailand
Dis
solv
ed o
xyg
en (
mg
/l)
Sampling dates
Surface pellet Surface trash fish Bottom pellet
Bottom trash fish Outside pellet Outside trash fish
Figure 8 dissolved oxygen levels inside (surface and bottom) and outside (surface) the
barramundi cages in thailand
FIGURE 9Dissolved oxygen levels at different farms in Indonesia
Dis
solv
ed o
xyg
en (
mg
/l)
3.0
3.5
4.0
4.5
5.0
5.5
6.0
6.5
7.0
Sampling dates
Bobby Parmanto Robby Alung Atiek Sitepu
08/04/09 08/05/09 08/06/09 08/07/09 08/08/09 08/09/09 08/10/09 08/11/09 08/12/09
Figure 9dissolved oxygen levels at different farms in Indonesia
113. Methodology and findings
the pH did differ during the culture period, decreasing towards the end of the trial (Figure 11).
In Indonesia, pH measurements were only undertaken at the farm level. The pH over the experimental period was relatively constant, and ranged between 7.8 and 8.3. These pH levels are well within the recommended levels of 7 and 8.5 (Figure 12).
FIGURE 10pH levels inside the snubnose pompano and red snapper cages in Viet Nam fed
trash fish and pellets
7.5
7.6
7.7
7.8
7.9
8.0
8.1
8.2
8.3
23/04/09 12/05/09 27/05/09 28/06/09 28/07/09 20/08/09 27/09/09 28/10/09 28/11/09
pH
Sampling dates
pH pompano pH red snapper
Figure 10ph levels inside the snubnose pompano and red snapper cages in viet nam fed
trash fish and pellet
FIGURE 11pH levels inside the orange-spotted grouper and red snapper cages in China
pH
Sampling dates
7.0
15/04/09 15/05/09 15/06/09 15/08/0915/07/09 15/09/09 15/10/09 15/11/09
7.5
8.0
8.5
9.0
9.5
Red snapper trash fish Red snapper pellet
Orange-spotted grouper trash fish Orange-spotted grouper pellet
Figure 11ph levels inside the orange-spotted grouper and red snapper cages in china

Transition from low-value fish to compound pellets in marine cage farming in Asia-Pacific12
Ammonia (NH3)In Viet Nam, the ammonia concentrations recorded inside and outside the cages differed significantly between those samples collected in the cages culturing red snapper and snubnose pompano. A significant increase in the ammonia concentrations was recorded during the last three months of the trial. These increases may be attributable to an increase in biomass, and the increased quantity of feed fed to the fish (Figure 13).
In Thailand, the ammonia concentrations differed in the tiger grouper and barramundi cages (Figures 14 and 15). In the barramundi cages, there was an increase in ammonia concentration prior to harvest, however this increase was not observed in the tiger grouper cages. The ammonia concentrations did not significantly differ between the
FIGURE 12pH levels at different farms in Indonesia
pH
Sampling dates
7.0
7.2
7.4
7.6
7.8
8.0
8.2
8.4
Bobby Parmanto Robby Alung Atiek Sitepu
07/04/09 07/05/09 07/06/09 07/07/09 07/08/09 07/09/09 07/10/09 07/11/09
Figure 12ph levels at different farms in Indonesia
FIGURE 13Ammonia levels inside the snubnose pompano and red snapper cages in Viet Nam
fed trash fish and pellets
0.00
0.05
0.10
0.15
0.20
0.25
0.30
0.35
0.40
0.45
23/04/09 12/05/09 27/05/09 28/06/09 28/07/09 20/08/09 27/09/09 28/10/09 28/11/09
Am
mo
nia
(m
g/l
)
Sampling dates
NH3 inside pompano NH3 inside red snapper Outside cages
Figure 13Ammonia levels inside snubnose pompano and red snapper cages in viet nam fed
trash fish and pellet

133. Methodology and findings
inside and the outside of the cages of the fish fed either the pellet or trash fish diets.
In Indonesia, the ammonia measurements were undertaken at the farm level. Ammonia concentrations peaked during September and October 2010 (Figure 16), when in some cages, the concentrations exceeded the maximum recommended levels (Table 4). These levels were significantly higher than those recorded in the other study countries. The reason why this should have been the case could not be established.
Am
mo
nia
(m
g/l
)
0.00
0.05
0.10
0.15
0.20
0.25
10/04/09 24/04/09 22/05/09 17/06/09 21/07/09 18/08/09 10/10/09 19/11/09
Surface pellet Surface trash fish Outside pellet Outside trash fish
FIGURE 14Ammonia levels inside (surface and bottom) and outside the barramundi cages in Thailand
Sampling dates
Figure 14Ammonia levels inside (surface and bottom) and outside barramundi cages in thailand
Am
mo
nia
(m
g/l
)
FIGURE 15Ammonia levels inside (surface and bottom) and outside the brown-marbled grouper
cages in Thailand
Sampling dates
0.00
0.02
0.04
0.06
0.08
0.10
0.12
0.14
0.16
0.18
09/04/09 22/04/09 20/05/09 18/06/09 22/07/09 19/08/09 9/10/09 10/11/09 16/12/09 18/01/10
Inside pellet Inside trash fish Outside pellet Outside trash fish
Figure 15Ammonia levels inside (surface and bottom) and outside brown-marbled grouper cages
in thailand
Table 4the maximum recommended water quality levels in Indonesia
parameters unit Acceptable range
pH - 7.0 – 8.5
Dissolved Oxygen (DO) mg/l >4
Nitrite (NO2) mg/l 0.05
Nitrate (NO3) mg/l 0.008
ammonia (NH3) mg/l 0.3
Phosphate (PO4) mg/l 0.015
Total organic matter mg/l P <50

Transition from low-value fish to compound pellets in marine cage farming in Asia-Pacific14
In Indonesia, additional water quality parameters were measured. These included the concentration of nitrate, nitrite and phosphate inside the cages. It was established that while the water quality changed over time, and with the exception of the Alung farm, which was located close to the outlets of a large number of shrimp farms, there were no significant differences between the water quality recorded on the farms (Figures 17, 18 and 19).
The data sets from each of the country trials were tested for normality to ensure that thedatafollowedaGaussiandistribution,andforhomogeneity. If both assumptions were met for the water quality variables of interest, a statistical analysis was undertaken using Levene’s Test for Homogeneity of Variance, and ANOVA of Squared Deviations fromGroupMeans.
0
0.05
0.10
0.15
0.20
0.25
0.30
0.35
0.40
0.45 Bobby Parmanto Robby Alung Atiek Sitepu
Am
mo
nia
(m
g/l
)
FIGURE 16Ammonia levels at different farms in Indonesia
Sampling dates
08/04/09 08/05/09 08/06/09 08/07/09 08/08/09 08/09/09 08/10/09 08/11/09 08/12/09
Figure 16Ammonia levels at different farms in Indonesia
FIGURE 17Nitrate levels at different farms in Indonesia
Sampling dates
0
0.1
0.2
0.3
0.4
0.5
0.6
0.7
0.8
0.9
Bobby Parmanto Robby Alung Atiek Sitepu
Nit
rate
(m
g/l
)
08/04/09 08/05/09 08/06/09 08/07/09 08/08/09 08/09/09 08/10/09 08/11/09 08/12/09
Figure 17nitrate levels at different farms in Indonesia

153. Methodology and findings
The significant differences (P<0.05) between the country trials were as follows:• Viet Nam - The two culture species (red snapper and snubnose pompano) differed
only with respect to levels of ammonia recorded inside and outside the cages. These increases may be attributable to an increase in biomass and the increased quantity of feed fed to the fish.
• Thailand - None of the water quality parameters differed significantly with feed types or species.
• China - None of the water quality parameters differed significantly feed types.• Indonesia - None of the water quality parameters differed significantly with feed
types, the exception being the significant differences observed in the nitrate and nitrite levels that were recorded at one of the farms that was located close to the outlets of a large number of shrimp farms.
FIGURE 18Nitrite levels at different farms in Indonesia
Sampling dates
Nit
rite
(m
g/l
)
0
0.05
0.10
0.15
0.20
0.25
0.30
Bobby Parmanto Robby Alung Atiek Sitepu
07/04/09 07/05/09 07/06/09 07/07/09 07/08/09 07/09/09 07/10/09 07/11/09 07/12/09
Figure 18nitrite levels at different farms in Indonesia
FIGURE 19Phosphate levels at different farms in Indonesia
Sampling dates
Pho
sph
ate
(mg
/l)
0
0.02
0.04
0.06
0.08
0.10
0.12
0.14
Bobby Parmanto Robby Alung Atiek Sitepu
08/04/09 08/05/09 08/06/09 08/07/09 08/08/09 08/09/09 08/10/09 08/11/09 08/12/09
Figure 19phosphate levels at different farms in Indonesia
Transition from low-value fish to compound pellets in marine cage farming in Asia-Pacific16
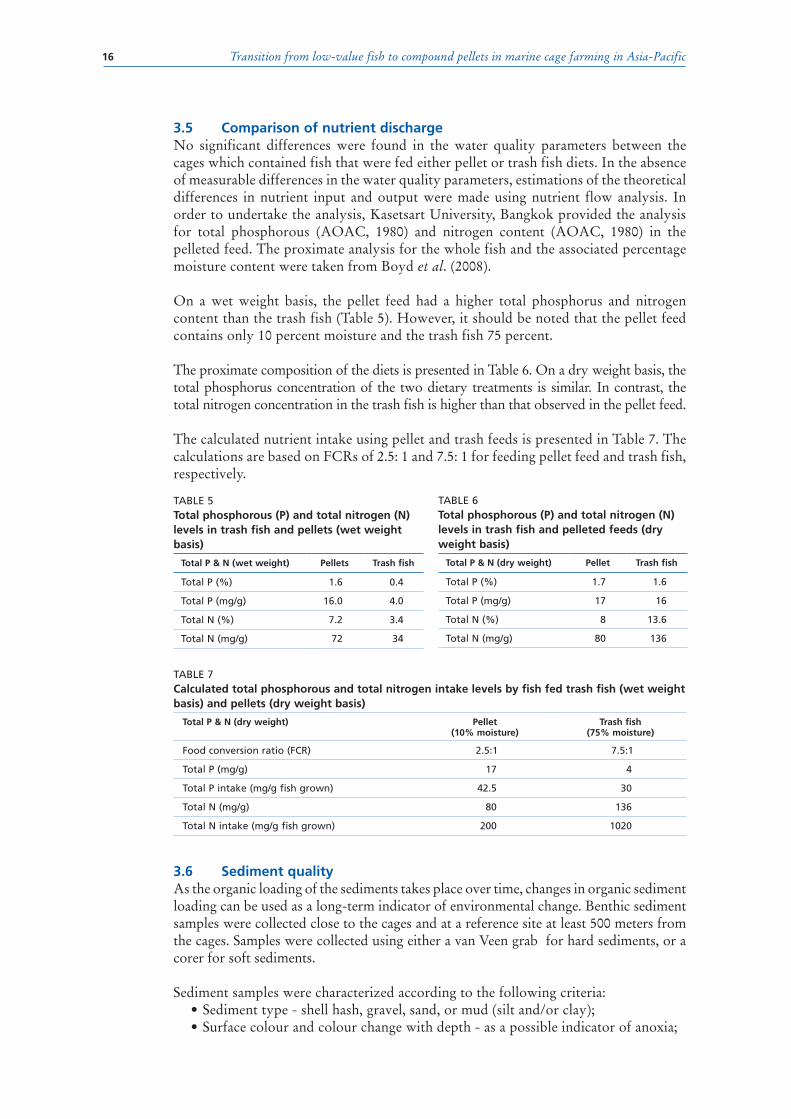
3.5 comparison of nutrient dischargeNo significant differences were found in the water quality parameters between the cages which contained fish that were fed either pellet or trash fish diets. In the absence of measurable differences in the water quality parameters, estimations of the theoretical differences in nutrient input and output were made using nutrient flow analysis. In order to undertake the analysis, Kasetsart University, Bangkok provided the analysis for total phosphorous (AOAC, 1980) and nitrogen content (AOAC, 1980) in the pelleted feed. The proximate analysis for the whole fish and the associated percentage moisture content were taken from Boyd et al. (2008).
On a wet weight basis, the pellet feed had a higher total phosphorus and nitrogen content than the trash fish (Table 5). However, it should be noted that the pellet feed contains only 10 percent moisture and the trash fish 75 percent. The proximate composition of the diets is presented in Table 6. On a dry weight basis, the total phosphorus concentration of the two dietary treatments is similar. In contrast, the total nitrogen concentration in the trash fish is higher than that observed in the pellet feed.
The calculated nutrient intake using pellet and trash feeds is presented in Table 7. The calculations are based on FCRs of 2.5: 1 and 7.5: 1 for feeding pellet feed and trash fish, respectively.
Table 7calculated total phosphorous and total nitrogen intake levels by fish fed trash fish (wet weight basis) and pellets (dry weight basis)
total p & n (dry weight) pellet (10% moisture)
trash fish(75% moisture)
Food conversion ratio (FCr) 2.5:1 7.5:1
Total P (mg/g) 17 4
Total P intake (mg/g fish grown) 42.5 30
Total N (mg/g) 80 136
Total N intake (mg/g fish grown) 200 1020
3.6 Sediment qualityAs the organic loading of the sediments takes place over time, changes in organic sediment loading can be used as a long-term indicator of environmental change. Benthic sediment samples were collected close to the cages and at a reference site at least 500 meters from the cages. Samples were collected using either a van Veen grab for hard sediments, or a corer for soft sediments.
Sediment samples were characterized according to the following criteria:•Sedimenttype-shellhash,gravel,sand,ormud(siltand/orclay);•Surfacecolourandcolourchangewithdepth-asapossibleindicatorofanoxia;
Table 5total phosphorous (p) and total nitrogen (n) levels in trash fish and pellets (wet weight basis)
total p & n (wet weight) pellets trash fish
Total P (%) 1.6 0.4
Total P (mg/g) 16.0 4.0
Total N (%) 7.2 3.4
Total N (mg/g) 72 34
Table 6total phosphorous (p) and total nitrogen (n) levels in trash fish and pelleted feeds (dry weight basis)
total p & n (dry weight) pellet trash fish
Total P (%) 1.7 1.6
Total P (mg/g) 17 16
Total N (%) 8 13.6
Total N (mg/g) 80 136

173. Methodology and findings
•Smell-sulphide(H2S or a rotten egg smell), oily (petroleum tar), or humid (a musty, organicodour).Typically,un-impactedsedimentshavenoparticularodour;
•Generalsedimentcolour-black,green,brown,red,yellowetc.
The sediment samples were sieved in the water until all the fine material had passed through the sieve, and only the particulate matter remained. These particles were then carefully transferred to a plastic sample jar. All the material that was retained on the sieves was transferred to the sample jar, fixed in formalin (4 percent formaldehyde solution), and stained with a Bengal rose stain. The samples were labelled with the date, time, location, and the water depth at which they were taken. During the collection period, the samples were stored on ice, and subsequently refrigerated prior to analysis. Sample sorting was undertaken in a laboratory using a stereo microscope (Figure 20). Samples that were black, had a strong sulphurous smell and were devoid of fauna indicated that they had been collected from highly impacted areas, Samples that showed high levels of indicator species such as polychaetes (e.g. Capitella capitata) also indicated a high levels of impact. Samples that had a wide number of different phyla (mollusc, crustacean, polychaete etc) indicated limited or no impact.
The analysis of the sediment samples showed a wide range of species in the sediments, and that they were not dominated by polychaetes or indicator species (Figure 21). This means there were low impacts associated with the sediments below the cages and, furthermore, that there was no measurable differences in the impacts associated with the cages of fish that were fed either the trash fish or pelleted feeds.
Stocking densityThe absence of observed differences in the water quality data between fish fed the trash fish and those on pellet feeds, and the concomitant lack of impacts on the sediments under the cages can primarily be attributed the low stocking densities of the cages, and low production biomass on the farms.
Figure 20Benthic sedimentary faunal analysis
Figure 21Sediment fauna found in samples below the test cages
thailandIndonesia

Transition from low-value fish to compound pellets in marine cage farming in Asia-Pacific18
Typically the stocking density in the trial cages was low. Cages of 3m x 3m x 3m with a total volume of 27 m3 were stocked at a density of 2.6 kg/m3. This gave a stocking density of 7.7 kg/m2 (cage surface area). At these densities, the environmental impacts between the farming activities would in all likelihood be minimal or low.
However at commercial production levels, 3m x 3m x 3m cages fed pellet feeds would typically have a holding biomass of 10 to 15 kg/m3. This would give a stocking density of 30 to 45 kg/m2 (cage surface area). At these densities, the environmental impacts between the farming activities are likely to be high (White et al., 2007).
Over feedingOne of the greatest influences on the amount of excess nutrients entering the environment is poor feeding strategy, which results in overfeeding. In this regard, farmers can improve their FCRs by providing the correct feed amount, optimising feeding periods, frequency, and timing.
A test was undertaken to determine the level of overfeeding by the farmers in Viet Nam and Thailand. Prior to feeding, a feeding tray (50 cm x 50 cm x 10 cm deep) was placed in the centre of the cage and lowered to the bottom. The farmer was asked to weigh the pellets that would typically be used in a feed round, and subsequently feed the ration normally. After the feed round had been completed, the feeding tray was recovered, the number of uneaten pellets counted, and an estimate of the level of overfeeding was made (Figure 22).
The results of the individual trials indicated an average of 228 uneaten pellets (20.45 g) in the feeding trays (0.25 m2). Taking into consideration the distribution of uneaten pellets at the bottom of the cages, it was estimated that the farmer had been overfeeding the cages by 11.2 percent. It was assumed that the other farmers were also overfeeding at a similar rate.
3.7 pathogen transferBoth cultured and wild fish are susceptible to similar pathogens and parasites. Intensive culture conditions can increase their prevalence in culture populations significantly. As water moves between the farm enclosures and the wider environment, there is a risk of pathogen and parasite transfer between the wild and cultured fish. Disease transmission can also occur when farmed fish escape and mingle with the wild fish, or when whole “infested or infected” fish are used as a feed. In this regard, there is a risk
Figure 22feeding tray and waste feed, viet nam

193. Methodology and findings
of bacterial pathogen transfer to the cultured fish from feeding infected trash fish, and it is recommended that prior to use, trash fish is sampled and screened for diseases.
To establish the potential for feeds to harbour disease vectors, a test was undertaken at the Main Centre for Mariculture Development (MCMD, Bandar Lampung, Indonesia), to analyse the bacterial loadings of trash fish and pellet feed samples that had been stored on ice for three days. The trash fish and pellets were analysed for total bacterial counts per gram of sample. An ANOVA of Squared Deviations showed significantly (P<0.05) higher bacterial loadings in the trash fish than the pellet feeds and that this loading increased over time (Figure 23).
3.8 trash fish/low-value fish qualityIn Viet Nam, three qualities of trash fish were available to the farmers. The quality and price of the trash fish was determined by species composition, quality and freshness, vis:
•Low quality trash fish at a price of US$ 0.24/kg •Medium quality trash fish at a price of US$ 0.34/kg•High quality trash fish at a price of US$ 0.43/kg
In Indonesia, trash fish is delivered to the farmers every three days. On arrival at the farm,thefishisplacedininsulatedtubswithiceandhelduntilfeeding–usuallyforaperiod of one to three days.
At some farms, the trash fish undergoes some minimal forms of processing. The type of processing depends on the target species, and the trash fish are either fed as:
•Whole trash fish•Trash fish body (not including head or tail)•Trash fish without the stomach•A combination of trash fish and fish processing wastes (heads and tails)
3.9 Bacterial levels in water columnThe use of trash fish, particularly low quality trash fish or trash fish that has been stored for a number of days can potentially increase the bacterial loading of the water column. In addition, uneaten trash fish may remain at the bottom of the net, further increasing the prevalence of bacteria.
FIGURE 23Bacterial concentrations in trash fish and pellet feeds stored over time
Trash fish Pellet
0.01
0.1
1
10
100
1 000
Day 1 Day 2 Day 3
Bac
teri
al c
on
cen
trat
ion
(m
illio
n/g
)
Figure 23Bacterial concentrations in trash fish and pellet feeds stored over time

Transition from low-value fish to compound pellets in marine cage farming in Asia-Pacific20
A comparative trial was undertaken by MCMD (Lampung, Indonesia) to measure the bacterial levels in the water column when either trash fish or pellet feeds were fed to the caged fish. Prior to use, the trash fish was stored on ice. The trial was designed to establish the bacterial loading of the water column when the two types of feed were applied. The trial involved feeding pellet feeds and different qualities of trash fish (1-day old, 2-day old, and 3-day old), and comparing the associated total bacterial counts in the water column.
In order to model the impact of the feeds on the bacterial levels in the water column over time, feed samples were placed in 500ml of sterilized seawater, and the water was subsequently analysed for total bacteria and vibrio (cfu/ml). The following sampling schedule was used:
•beforetheintroductionofthefeed•20 seconds after the feed had entered the water (simulating the time between
feeding and the food being ingested by the fish)•1hour after the feedhad entered thewater (simulating feed that hadnotbeen
eaten, but remained at the bottom of the net).
The results were analysed using an F-test to make comparisons of the components of the total deviation. Statistical significance was tested for by comparing the F test statistic where
F = Variance between treatments/variance within treatments
The F-test was used to test the null hypothesis that the sample variances were the same (i.e. H0:var1=var2) or reject the null hypothesis to indicate that the sample variances were different. The value(s) returned by F-test were deemed to be statistically significant if the value was 0.05 or less.
The results demonstrated that in comparison with the use of pellet feeds, the use of trash fish significantly (P<0.05) increased bacterial levels in the water column, and that bacterial levels increased as a function of the length of time the material was exposed to the water, and the length of time the trash fish had been stored before it was used (Figure 24).
FIGURE 24Bacterial concentrations in water exposed to trash fish and pellet feeds
0
50
100
150
200
250
300
Day 1 Day 2 Day 3
Bac
teri
al c
on
cen
trat
ion
(cf
u/m
l)
Trash fish 20 seconds Trash fish 1 hour
Pellet 20 seconds Pellet 1 hour
Figure 24Bacterial concentrations in water exposed to trash fish and pellet feeds

213. Methodology and findings
3.10 nutrient leaching to the water columnPotentially, the use of trash fish (particularly low quality trash fish or trash fish that has been stored for a number of days) could increase the nutrient levels in the cages. In this regard, nutrient enrichment could occur during the period between feeding and ingestion. In addition, uneaten trash fish and feed pellets that remain on the bottom of the net will continue to leach nutrients.
A trial was undertaken by MCMD (Lampung, Indonesia) to measure feed derived nutrient leaching to the water column during feeding. The leaching properties of three different qualities of trash fish (1 day, 2 day, and 3 day old fish) and pelleted feeds were established. The level of leaching was measured as a function of NH3 , NO2 , NO3 and PO4 concentrations in the water column.
In order to model the leaching rates, 100 grams of feed was placed into 500 ml of seawater, and analysed for dissolved nutrients over three time periods, vis,
•beforethefeedenteredthewater(baselinenutrientlevels)•20secondsafterthefeedenteredthewater(simulatingthetimebetweenfeeding
and the food being ingested by the fish)•1hourafterenteringthewater(simulatingthefeednotbeingeatenbutremaining
at the bottom of the cage)
The results describing the levels of ammonia nitrogen (NH3-N) in the water are presented in Figure 25. In contrast with the pellet feed, the NH3-N concentrations were significantly higher (P<0.05) in the water that was exposed to the trash fish, and that the leaching from this feed source increased after the second day of storage and decreased after the 3rd day of storage.
The results indicate that when submerged in the water for one hour, the pellet feed leached significant amounts of nitrite (NO2-N) into the water column. Nevertheless, thetrashfishthathadbeenstoredforonedayreleasedthehighestlevelofnitrite;theselevels decreased after the 2nd and 3rd days of storage (Figure 26).
FIGURE 25Effect of feed type and storage periods on the ammonia (NH3-N) concentration in the
culture water
0
0.01
0.02
0.03
0.04
0.05
0.06
0.07
0.08
Day 1 Day 2 Day 3
Trash fish 1 minute Trash fish 1 hour
Pellet 1 minute Pellet 1 hour
Am
mo
nia
-N (
mg
/l)
Figure 25effect of feed type and storage periods on the nh3-n concentration in
the culture water

Transition from low-value fish to compound pellets in marine cage farming in Asia-Pacific22
Nitrate (NO3-N) leaching was found to be significantly higher (P<0.05) when pellets were immersed in water for one hour (Figure 27). In addition, the levels of nitrate observed from the trash fish that had been stored for one day and left in the water for the one hour period were elevated above those samples that has been stored for two or three days.
Phosphate (PO4-P) leaching was observed to be highest when the pellet feed was immersed in water for one hour (Figure 28). In contrast, the level of phosphate leaching was significantly reduced (P<0.05) when the pellets were immersed for only one minute. In trash fish, the level of leaching was slightly higher in fish that had been stored for one day. Increasing the storage period to two and three days reduced the level of leaching.
FIGURE 26Effect of feed type and storage periods on the nitrite (NO2-N) concentrations in the
culture water
0
0.01
0.02
0.03
0.04
0.05
0.06
Day 1 Day 2 Day 3
Trash fish 1 minute Trashfish 1 hour Pellet 1 minute Pellet 1 hour
Nit
rite
-N (
mg
/l)
Figure 26effect of feed type and storage periods on the no2-n concentrations in
the culture water
FIGURE 27Effect of feed type and storage periods on the nitrate (NO3-N) concentrations in the
culture water
Trash fish 1 minute Trash fish 1 hour Pellet 1 minute Pellet 1 hour
Nit
rate
-N (
mg
/l)
0
0.1
0.2
0.3
0.4
0.5
0.6
0.7
Day 1 Day 2 Day 3
Figure 27effect of feed type and storage periods on the no3-n concentrations in
the culture water

233. Methodology and findings
3.11 comparison of energy useThe energy required to produce aquafeeds varies between feed type (trash fish or pellets) and manufacturing processes. In Norway, EWOS requires 1 040 MJ to produce one tonne of feed (Cermaq, 2009). In contrast, Thai Union uses only 99 kilowatts per tonne of feed produced, which is equivalent to 356.4 MJ per tonne of feed produced (Supis Thongrod, Thai Union Feed Mill Co., Ltd., pers. comm.).
In addition to the energy that is expended in the manufacture of the pellet feeds, there are many additional activities and processes that require energy. These energy requirements include the energy expended in:
• fishingforthefishmealcomponentofthediet.•producingfishmealandotheringredientssources.• transportingtherawmaterialstothefeedproducer.• transportingthefinishedfeedtothefarms.
Pelletier and Tyedmers (2007) estimated that the total energy required to produce 1 tonne of feed pellets was 18 100 MJ (including transportation costs). Using pelleted feeds, and assuming an FCR 2.45:1, it follows that the energy required to produce the feeds that are required to culture 1 kilogram of fish is 44.35 MJ.
A similar model can be applied to calculate the energetic costs associated with using trash fish as a feed source. To establish these energetic costs, data was collected from trash fish fishers in Phuket (Thailand), and Lampung (Indonesia). The manner in which the trash fish are caught, and the energy required for the different processes in the trash fish supply chain can be described as follows:
Phuket, ThailandTypically, fishing trips that target trash fish are made overnight, and it takes three hours to reach the fishing grounds. Each trip harvests an average of 3 000 kg of fish. The fish is delivered directly to the fish cages and stored for up to three days in insulated boxes containing ice.
• Fifteen litres of fuel is required by the boat to access the fishing grounds (three hours each way). This equates to 518.4 MJ.
FIGURE 28Effect of feed type and storage periods on the phosphate (PO4-P) concentrations in the
culture water
Trash fish 1 minute Trash fish 1 hour Pellet 1 minute Pellet 1 hour
Pho
sph
ate-
P (m
g/l
)
0
5
10
15
20
25
Day 1 Day 2 Day 3
Figure 28effect of feed type and storage periods on the po4-p concentrations in
the culture water
Transition from low-value fish to compound pellets in marine cage farming in Asia-Pacific24
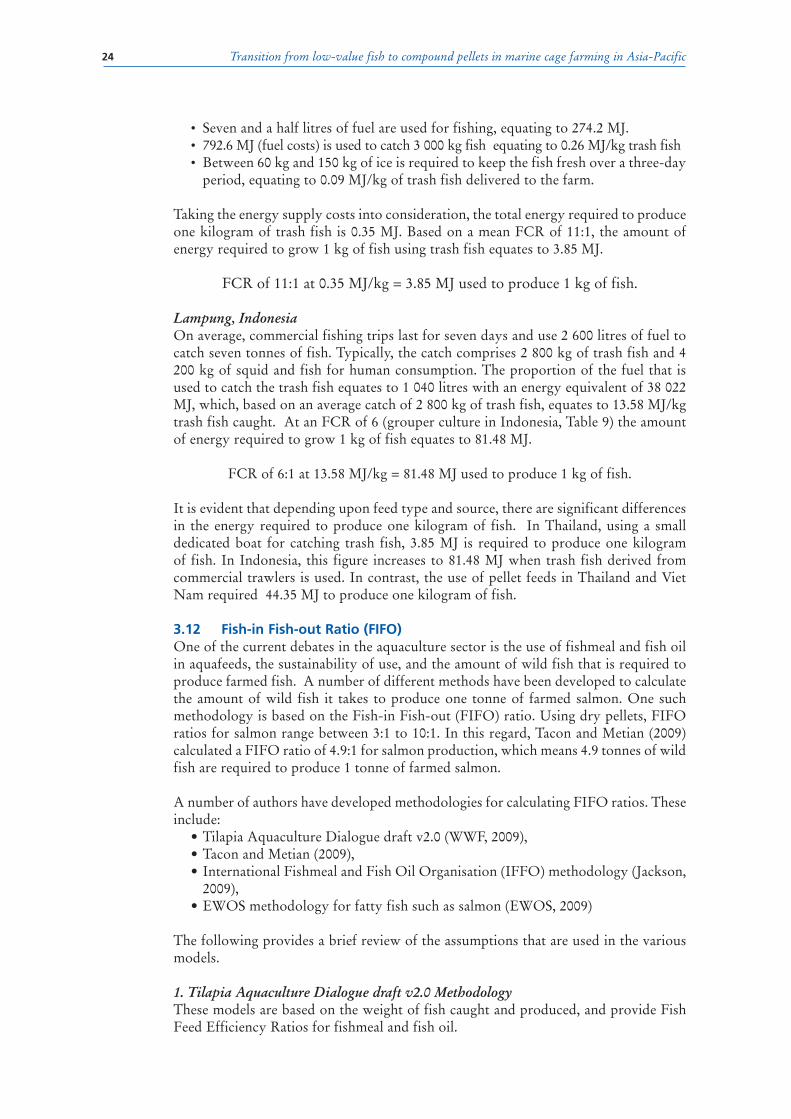
• Seven and a half litres of fuel are used for fishing, equating to 274.2 MJ.• 792.6 MJ (fuel costs) is used to catch 3 000 kg fish equating to 0.26 MJ/kg trash fish• Between 60 kg and 150 kg of ice is required to keep the fish fresh over a three-day
period, equating to 0.09 MJ/kg of trash fish delivered to the farm.
Taking the energy supply costs into consideration, the total energy required to produce one kilogram of trash fish is 0.35 MJ. Based on a mean FCR of 11:1, the amount of energy required to grow 1 kg of fish using trash fish equates to 3.85 MJ.
FCR of 11:1 at 0.35 MJ/kg = 3.85 MJ used to produce 1 kg of fish.
Lampung, IndonesiaOn average, commercial fishing trips last for seven days and use 2 600 litres of fuel to catch seven tonnes of fish. Typically, the catch comprises 2 800 kg of trash fish and 4 200 kg of squid and fish for human consumption. The proportion of the fuel that is used to catch the trash fish equates to 1 040 litres with an energy equivalent of 38 022 MJ, which, based on an average catch of 2 800 kg of trash fish, equates to 13.58 MJ/kg trash fish caught. At an FCR of 6 (grouper culture in Indonesia, Table 9) the amount of energy required to grow 1 kg of fish equates to 81.48 MJ.
FCR of 6:1 at 13.58 MJ/kg = 81.48 MJ used to produce 1 kg of fish.
It is evident that depending upon feed type and source, there are significant differences in the energy required to produce one kilogram of fish. In Thailand, using a small dedicated boat for catching trash fish, 3.85 MJ is required to produce one kilogram of fish. In Indonesia, this figure increases to 81.48 MJ when trash fish derived from commercial trawlers is used. In contrast, the use of pellet feeds in Thailand and Viet Nam required 44.35 MJ to produce one kilogram of fish.
3.12 fish-in fish-out ratio (fIfo)One of the current debates in the aquaculture sector is the use of fishmeal and fish oil in aquafeeds, the sustainability of use, and the amount of wild fish that is required to produce farmed fish. A number of different methods have been developed to calculate the amount of wild fish it takes to produce one tonne of farmed salmon. One such methodology is based on the Fish-in Fish-out (FIFO) ratio. Using dry pellets, FIFO ratios for salmon range between 3:1 to 10:1. In this regard, Tacon and Metian (2009) calculated a FIFO ratio of 4.9:1 for salmon production, which means 4.9 tonnes of wild fish are required to produce 1 tonne of farmed salmon.
A number of authors have developed methodologies for calculating FIFO ratios. These include:
•TilapiaAquacultureDialoguedraftv2.0(WWF,2009),•TaconandMetian(2009),• InternationalFishmealandFishOilOrganisation(IFFO)methodology(Jackson,
2009),•EWOSmethodologyforfattyfishsuchassalmon(EWOS,2009)
The following provides a brief review of the assumptions that are used in the various models.
1. Tilapia Aquaculture Dialogue draft v2.0 Methodology These models are based on the weight of fish caught and produced, and provide Fish Feed Efficiency Ratios for fishmeal and fish oil.

253. Methodology and findings
(% fishmeal in feed) x (eFCR)FFERmeal=––––––––––––––––––––––––––
22.2
(% fish oil in feed) x (eFCR)FFERoil=–––––––––––––––––––––––––
5.0
The model assumes that the fishmeal produced from the fish caught for fish oil is wasted.
2. Tacon and Metian (2009) The method used by Tacon and Metian (2009) effectively assumes that the excess fishmeal produced from the fish caught for fish oil is wasted. In fact it is used as ingredients and materials in other feed production systems. The IFFO (2009) method addresses this issue but fails to recognise that cultured salmon have a higher lipid level than the average wild fish. The models assume a yield of fishmeal and fish oil of 22.5 and 5 percent on a wet weight to dry weight basis, respectively.
3. IFFO methodology (Jackson, 2009)The IFFO method applies the following equation:
Level of fishmeal in the diet + level of fish oil in the dietIFFOFIFORatio=––––––––––––––––––––––––––––––––––––––––––––––––xFCR Yield of fishmeal from wild fish + level of fish oil from wild fish
This model takes into account both the fishmeal and fish oil use, which corrects the Tacon and Metian (2009) model that implies that the extra fishmeal is wasted. However, the model is biased against fish with high lipid levels such as salmon, trout and eels. The bias is a result of the differential between some species of cultured fish that have higher lipid levels than the wild fish used for the production of the fishmeal and fish oil.
4. EWOS methodology The EWOS model compensates for fish that have relatively high fish oil concentrations (e.g. salmon) on the basis of nutrients used and produced, and compares the ratios using the same assumptions (fishmeal and fish oil yields). The nutrient based ratio corrects for the differential oil concentrations, and is the preferred ratios to use for fatty fish such as salmon, trout and eels. The calculations are as follows:
For marine protein kg marine protein used
Marine protein dependency ratio = –––––––––––––––––––––––––– kg marine protein produced
FMfeed x PrFM x eFCR MPDR = ––––––––––––––––––––––– PrtSalmwhereMPDR Marine protein dependency ratioFMfeed Concentration of fishmeal in the feed (%)PrFM Concentration of protein in fishmeal (as a proportion)eFCR economic feed conversion ratioPrtSalm Concentration of protein in the salmon on whole fish basis (%)

Transition from low-value fish to compound pellets in marine cage farming in Asia-Pacific26
For marine oil kg marine oil used Marineoildependencyratio=–––––––––––––––––––– kg marine oil produced
(Fofeed x FMfeed x FoFM)) x eFCR MPDR=––––––––––––––––––––––––––––––– OilSalmwhere
MODR Marine oil dependency ratioFoFeed Concentration of fish oil in the feed (%)FMfeed Concentration of fishmeal in the feed (%)FoFM Concentration of fish oil in fishmeal (as a proportion)eFCR economic feed conversion ratioOilSalm Concentration of oil in the salmon on whole fish basis (%)
For the purpose of this report, the IFFO formula was adopted and used to analyse the results of this study for two reasons: the trial species do not have high lipid levels when compared to salmon and the model accounts for the other uses of the unused fishmeal and fish oil.
The reported use of fishmeal and fish oil in the EWOS and Thai Union formulated diets were remarkably similar. The reported fishmeal and fish oil used in the EWOS test formulation (Dave F.H. Robbs, EWOS Vietnam, Ho Chi Minh City, Viet Nam, pers. com.) comprised:
•Fishmeal:30percent-Group1Scandinavianfishmeal(Norway)•Fishoil:8percent(Denmark)
The reported use of fishmeal and fish oil used in the Thai Union formulation (Supis Throngrod, Thai Union Feed Mill Co., Ltd., pers. com.) comprised:
•Fishmeal:30percentoftheseabassfeed(fishmealwaslocallysourced).•Fish oil: approximately 7.5 percent of the feed (source of fish oil was locally
produced tuna oil).
The average food conversion ratios recorded for the different fish species in the different case study countries using pellet feeds and trash fish are presented in Tables 8 and 9. The average FCRs attained using pellets and trash fish across all the trial in four countries was 2.45:1 and 9.02:1 respectively. These ratios were used to estimate FIFO ratios for tropical marine fish as follows:
Level of fishmeal in the diet + level of fish oil in the diet –––––––––––––––––––––––––––––––––––––––––––––––––––––––xFCR
Yield of fishmeal from wild fish+ yield of fish oil from wild fish
30 + 7.7 ––––––––x2.45=3.34
22.5 + 5
The results indicate that the FIFO ratio from pellet feeds was 3.34:1, which is much lower than the 9.02:1 FIFO ratio from trash fish.

273. Methodology and findings
4. concluSIonSThe results from the environmental assessment demonstrate that there were no significant differences in the impacts between the use of aquafeeds (either pellet or trash feeds) on the water quality and the sediment characteristics beneath and around the fish cages. These results may be attributable to the low stocking densities of the trial farms, and in this regard, higher stocking densities and associated input levels may have yielded different results.
The main findings of the study are as follows:•There were no significant differences in the environmental impacts associatedwiththeuseoftrashfish/low-valuefishandpelletfeeds;
•The culture species did not significantly affect the environmental impactsassociatedwiththeuseofaquafeeds;
•Therewereincreasesinbacterialloadingintrashfishthatwasstoredonicebeforefeeding, and an increased bacterial release to the culture waters when feeding 2- and3-dayoldtrashfish/low-valuefish;
•Generally,therewasmorenutrientleachingintothewatercolumnassociatedwiththeuseofpelletedfeedsthanwiththeuseoftrashfish/low-valuefish;
•Theestimatedenergycostofproducingonekilogramoffarmedfishusingfeedfish as a feed source was significantly lower than that required when using pelleted feeds based on the use of small boats in artisanal fishing, but higher when the trash fishwasharvestedbybigcommercialfishingboats;and
•TheFish-inFish-out ratio (FIFOratio) for theproductionof aunitweightoffish using pellet feed was almost two-thirds lower (3.34:1) than using trash fish (9.02:1).
The implications of the findings on policy, management, and for the development of future research programmes include:
•Apolicyisrequiredtoencouragethedevelopmentofsuitablepelleteddietsforhigh value fish in cages. This will reduce fishing pressure on feed fish/ trash fish stocks, promote the growth of high value cage farming, and negate the seasonal constraints associated with feed fish supply.
Table 8mean feed conversion ratios for fish fed pellets in the study trials
pellets china Indonesia thailand viet nam Average
grouper 2.57 2.41 3.09 2.69
Snapper 1.31 2.20 1.75
Seabass 2.55 2.55
Pompano 2.84 2.84
average 2.45
Table 9mean feed conversion ratios for fish fed trash fish in the study trials
trash fish china Indonesia thailand viet nam Average
Orange-spotted/brown-marbled grouper 12.33 6.00 13.17 10.50
red snapper 5.15 9.00 7.08
barramundi 5.51 5.51
Snubnose pompano 13.00 13.00
average 9.02
Transition from low-value fish to compound pellets in marine cage farming in Asia-Pacific28
•FurtherresearchisrequiredtoestablishwhytherewassuchawidevariationintheFCRs reported from the different study countries using pellet feeds. For example, in Indonesia, farmers culturing grouper reported FCRs of 2.41:1, while farmers in Thailand obtained FCRs of 3.09:1. Likewise in China, farmers culturing snapper reported FCRs of 1.31:1, while in Viet Nam, farmers culturing the same species reported FCRs of 2.2:1.
•Further research is required to determine why there are differences betweenthe FCRs achieved when using feed fish (trash fish) diets, and to determine the influence that feedfish source has on nutritional indices. For example, the use of fish processing waste, low-value fish, and prepared feedfish (head off, and filleted trash fish).
•Thereisaneedtodevelopbetterfeedmanagementguidelinesforusingpelletedfeeds.
The apparent lack of significant differences in the environmental impacts that accrue to the use of different feed types was attributed to the low stocking densities used at the trial sites. This finding confirms the importance of farming within the carrying capacity of the culture site. In particular, it underlines (i) the need for regulation, preferably supported by a carrying capacity assessment, that limits the number of cage farms in a site to an optimal density, (ii) the need for technical guidelines and extension advice to encourage better farm management, and improved feeding and feed management practices, and (iii) the need for quality, low polluting feeds.
Saving energy and reducing the fish component in feed formulations are global as well as wider industry concerns. However, better site management and introducing better management practices would also address issues of improving energy and feed efficiencies.
While it was not within the scope of the study, it was evident that the disease and abiotic factors that resulted in mortalities were exacerbated by impacts from sources other than the cage farms. This further highlights the importance of a policy and plans that consider the competing objectives on the uses of coastal waters and designating mariculture zones. Farms in these zones would be easier to service, monitor and regulate. Furthermore, if the farmers in the zone were organized into an association, they would also benefit from economy of scale.
referenceSAbery, N.W., Sukadi, F., Budhiman, A.A., Kartamihardja, E.S., Koeshendrajana, S.,
Buddhiman & De Silva, S. S. 2005. Fisheries and cage culture of three reservoirs in westJava,Indonesia;acasestudyofambitiousdevelopmentsandresultinginteractions.Fisheries Management and Ecology,12:315–330.
AOAC. 1980. Official Methods of Analysis. Association of Official Analytical Chemists, Washington D.C. 1038 pp.
Boyd, C.E., Lim, C.E., Queiroz, J., Salie, K., De Wet, L., Mcnevin, A. 2008. Best Management Practices for Responsible Aquaculture. In: USAID/Aquaculture CRSP. Oregon State University. Corvallis, Oregon. 47 pp.
Cermaq. 2009. Our performance sustainable aquaculture. Cermaq Annual Report 2009. 3 pp. (availableatwww.cermaq.com/portal/Gazette/eng/pdf/Sustainable_aquaculture.pdf)
EWOS. 2009. Fish in to fish out ratios. An alternative way to calculate and communicate. (available at www.ewos.com/portal/wps/wcm/connect/c37637004fc44288ac91ef1292a7cb6c/FIFO+Ratios.++Alternative+way+to+calculate+and+communicate+08Sep09.pdf?MOD=AJPERES)

294. Conclusions
Holmer, M., Argyrou, M., Dalsgaard, T., Danovaro, R., Diaz-Almela, E., Duarte, C.M., Frederiksen, M., Grau, A., Karakassis, I., Marba, N., Mirto, S., Perez, M., Pusceddu, A., & Tsapakis, M. 2008. Effects of fish farm waste on Posidonia oceanica meadows: Synthesis and provision of monitoring and management tools. Mar. Pollut. Bull., 56:1618–1629.
Howarth, R.W. & R. Marino, R. 2006. Nitrogen as the limiting nutrient for eutrophication in coastal marine ecosystems: Evolving views over three decade. Limnol. Oceanogr., 51(1,part2):364–376.
Hudson, J., Taylor, W. & Schindler, D. 2000. Phosphate concentration in lakes. Nature, 406:54–56.
Jackson, A. 2009. Fishmeal and fish oil production and its role in sustainable aquaculture. International Fishmeal & Fish Oil Organisation. (available at www.seafoodchoices.com/seafoodsummit/documents/JacksonA.pdf).
Olsen. Y, Agusti, S., Andersen, T., Duarte, C.M., Gasol, J.M., Gismervik, I., Heiskanen, A.-S., Hoell, E., Kuuppo, P., Lignel, R., Reinertsen, H., Sommer. U., Stibor, H., Tamminen, T., Vadstein, O., Vaque´, D. & Vidal, M. 2006. A comparative study of responses in planktonic food web structure and function in contrasting European coastal waters exposed to experimental nutrient addition. Limnol. Oceanogr.,51(1,part2):488–503.
Pelletier, N. & Tyedmers, P. 2007 Feeding farmed salmon: Is organic better? Aquaculture, 272:399–416.
Tacon, A.G.J. & Metian, M. 2009. Fishing for aquaculture: Non-food use of small pelagic forage fish - a global perspective. Rev. Fish. Sci.,17:305–317.
White P., Christensen, G.N., Palerud, R., Legovic, T., Rosario, W., Lopez, N., Regpala, R., Gecek, S. & Hernandez, J. 2007. Final report - Bolinao. Environmental monitoring and modelling of aquaculture in risk areas of the Philippines (EMMA) APN-2415.02, 52 pp.
WWF (World Wide Fund for Nature). 2009. International standards for responsible tilapia aquaculture. TAD Standards Version 2.0 for public review created by the Tilapia Aquaculture Dialogue, World Wide Fund for Nature. 24 pp. (available at www.worldwildlife.org/what/globalmarkets/aquaculture/WWFBinaryitem12468.pdf).