jyothy laboratories limited · ujala was ranked 3rd by brand equity in fabric care category with...
TRANSCRIPT
Strictly Private & Confidential
Jyothy Laboratories Limited
November 9,2011

Contents
Company Overview
Financial Summary for Q2 FY 2012
Category-wise Analysis
Recent Developments – Henkel Acquisition
JFSL Status Update
1

Company Overview
� A FMCG company with presence in the fabric care, household insecticide, surface cleaning, personal
care and air care segments
� Promoted by Mr. M.P. Ramachandran in 1983
� Mr. Ramachandran has over 38 years of experience in production, sales and management
� Leadership through Key Brands:
� Ujala: #1 in Fabric Care: 73.5% all-India market share by value and 59.9 % by volume for the year
ended September 2011*
� Maxo: 21.5 % all-India market share by value and 24.0 % by volume (No. 2) for the year ended
2
September 2011
- 30.5% Rural India market share by volume for September 2011* - No. 1
� Exo: 27.2 % South India market share by value and 24.8 % by volume for year ended September 2011*
No. 2
- 53.6 % Kerala market share by value and 52.0 % by volume for year ended September 2011* - No 1
# Liquid Blue Cate0gory
*Source: A.C. Nielsen

Company Overview (Cont’d.)
� Extensive Distribution Network
� Available in ~ 2.9 mn outlets in India as of March 31, 2011 (Source: A.C. Nielson)
� Sales staff of over 1,800 people servicing approx. 3,500 distributors
� Field staff have a direct reach of ~ 1 million outlets
� Strong presence in both rural and urban markets
� Manufacturing
3
� 28 manufacturing facilities in 16 locations across India – some of these are tax efficient units
Offering Value-for-Money Products to the Common Man

Financial Summary
4
2011-12

Profit & Loss Account
Net sales 15,465 14,483 27,764 29,615 59,983
Other income 1,515 527 2,739 927 2,760
Total Income 16,979 15,010 30,503 30,542 62,744
Cost of Goods Sold (8,982) (7,541) (15,334) (14,727) (31,147)
Employee Cost (2,074) (1,785) (4,042) (3,780) (7,479)
Advertisement & Promo Exp. (1,687) (1,722) (2,611) (2,682) (5,378)
Particulars (Rs. in lacs)
6 months
ended 31,
Sept 2010
12 months
ended 31,
March 2011
3 months
ended 31,
Sept 2011
3 months
ended 31,
Sept 2010
6 months
ended 31,
Sept 2011
5
Advertisement & Promo Exp. (1,687) (1,722) (2,611) (2,682) (5,378)
Other Expenses (1,983) (1,874) (3,965) (3,718) (8,074)
EBITDA 2,253 2,087 4,551 5,634 10,666
Depreciation (360) (297) (739) (601) (1,079)
Interest and Finance Charges (199) (2) (376) (3) (30)
Profit before and tax 1,694 1,788 3,436 5,030 9,557
Tax (445) (251) (785) (933) (1,530)
Profit after tax 1,249 1,537 2,651 4,097 8,027
EPS 1.55 2.01 3.29 5.50 10.35

EBIDTA Analysis
Particulars Q2
Amount %
Increase in Raw Material 453 2.93%
Increase in Traded Material 238 1.54%
Employee cost 168 1.09%
Change in Product Mix 52 0.34%
Total 911 5.89%
Rs. In lakhs
Steps taken to improve EBITDA
� Increased in retail price of all the brands by 7 % effective september 2011.
� Savings from change in distribution system expected by 3 to 4%
� Increase Employee cost to justify on annual sales
6
Total 911 5.89%

Highlights
� Reduced pipeline inventory from Rs.70 cr to Rs.20 cr
� Investment in working capital reduced from Rs.160 cr on March 31 to Rs.89 cr
� Debtors from Rs.103 cr. as on March 31, 2011 to Rs.42 cr.
� 120 days turnaround plan (Phase 1) for Henkel is complete (June to September 2011)
� Ujala was ranked 3rd by Brand Equity in fabric care category with Surf and Rin being
No.1 and No. 2, while Tide and Ariel secured No.4 and No. 5 respectivelyNo.1 and No. 2, while Tide and Ariel secured No.4 and No. 5 respectively
7

Category-wise performance
8
Category-wise performance

Brand Tree
Fabric Care
48% (51%)Net Sales : Rs. 13,308 lacs
(Rs. 15,210 for 2011)
Mosquito Repellent
21% (22%)Net Sales : Rs. 5,757 lacs
(Rs. 6,541 for 2011)
Dishwashing Products
25% (19%)Net Sales : Rs. 6,908 lacs
(Rs.5,643 for 2011)
Other Products
6% (8%)Net Sales : Rs. 1,790 lacs
(Rs. 2,220 for 2011)
Category-wise Revenue Mix for 6 M FY2012
9

Combined Entity Will Have Market Leading Brands In Multiple Categories
Fabric Care 47% (Rs. 23836 lacs)
Mosquito Repellent 11% (Rs. 5757 lacs)
Dishwashing Products 21% (Rs. 10895)
Personal Care & Others21% (Rs. 10334)
Combined Sales for Analysis6 Month Ended September 2011
Total Rs. 50822 lacs)
10

Financial Snapshot - Sales
Category-wise Net Sales
Category3 Months ended September
2011-12 2010-11 Growth %
Fabric Care 6,509 6,985 -7%
Mosquito Repellent 3,895 3,719 5% 3,000
4,000
5,000
6,000
7,000
8,000
2011-12
2010-11
11
Mosquito Repellent 3,895 3,719 5%
Dishwashing 3,979 2,721 46%
Other Products 1,082 1,057 2%
15,465 14,483 7%
0
1,000
2,000
3,000
Fabric Care Mosquito
Repellent
Dishwashing Other Products
2010-11
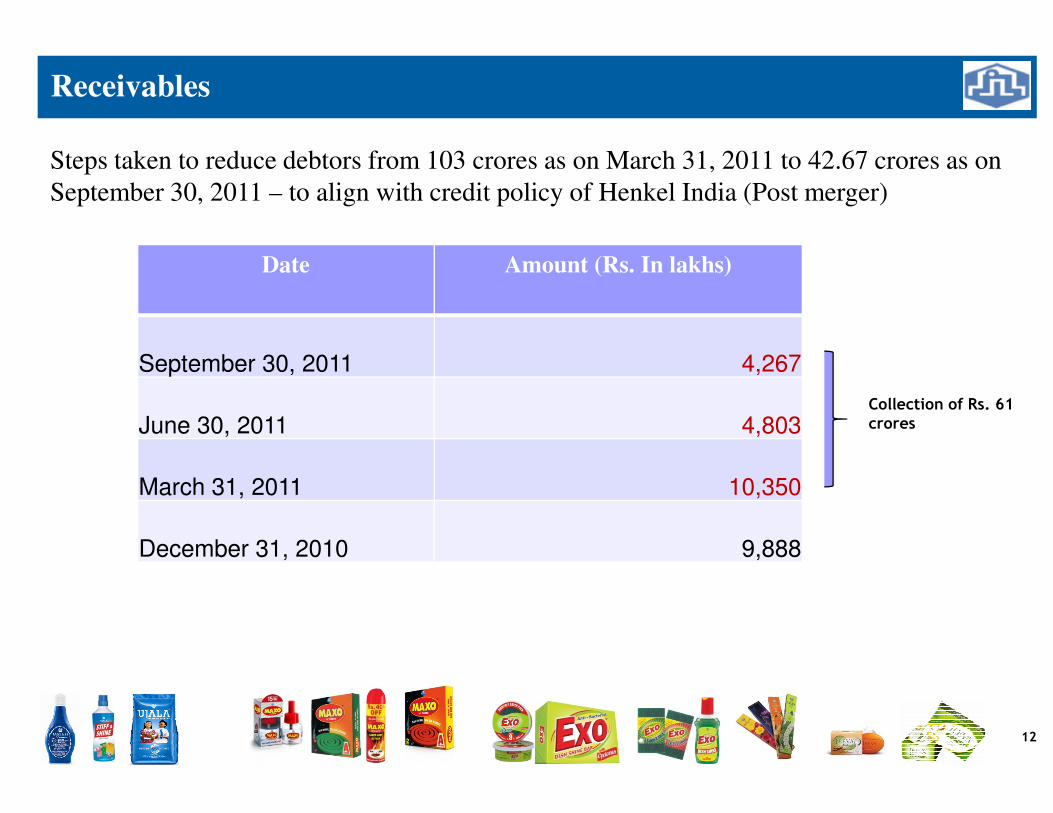
Receivables
Date Amount (Rs. In lakhs)
September 30, 2011 4,267
Steps taken to reduce debtors from 103 crores as on March 31, 2011 to 42.67 crores as on
September 30, 2011 – to align with credit policy of Henkel India (Post merger)
Collection of Rs. 61
June 30, 2011 4,803
March 31, 2011 10,350
December 31, 2010 9,888
Collection of Rs. 61 crores
12

Receivables Scenario
Area September
30, 2011
June 30,
2011
March 31,
2011
Decemeber 31,
2010
CSA 2,128 2,552 8,300 7,147
Non CSA 2,139 2,251 2,050 2,741
Amount (Rs. In lakhs)
Total 4,267 4,803 10,350 9,888
Note:-
1. Normal credit for non CSA area 21 days mainly due to Institutional supplies
2. Reduction of Rs. 61 crores in CSA area resulting in direct impact on primary
sales
3. Secondary sales from Distributors and market share remain intact
13

Fabric Care: UJALA
Brand Facts
� Launched in 1983 – A 27-year old Brand
� Largest brand in the fabric whiteners segment
Positioning
� Positioned as a liquid fabric whitener that do not cause the clothes to “blue” or
appear patchy
Market Share
� #1 in Product Category: 73.5% all-India market share by value for September, 2011*
� Kerala – 99.99% by value for March 2010*
Brand Extension
Largest Brand in Fabric Whitener
14
* Source: A.C. Nielsen
� Washing Powder – Launched in 2003 in Kerala & extended to other southern states
in January 2009.
� Ujala Stiff and Shine – Launched in Kerala in 2005 and nationally in March 2008
Brand Endorsement
� SACHIN TENDULKAR – Brand Ambassador for 30 months till March, 2012
Going Forward
� Detergent – Rollout in other states underway
� Looking for Brand Extensions
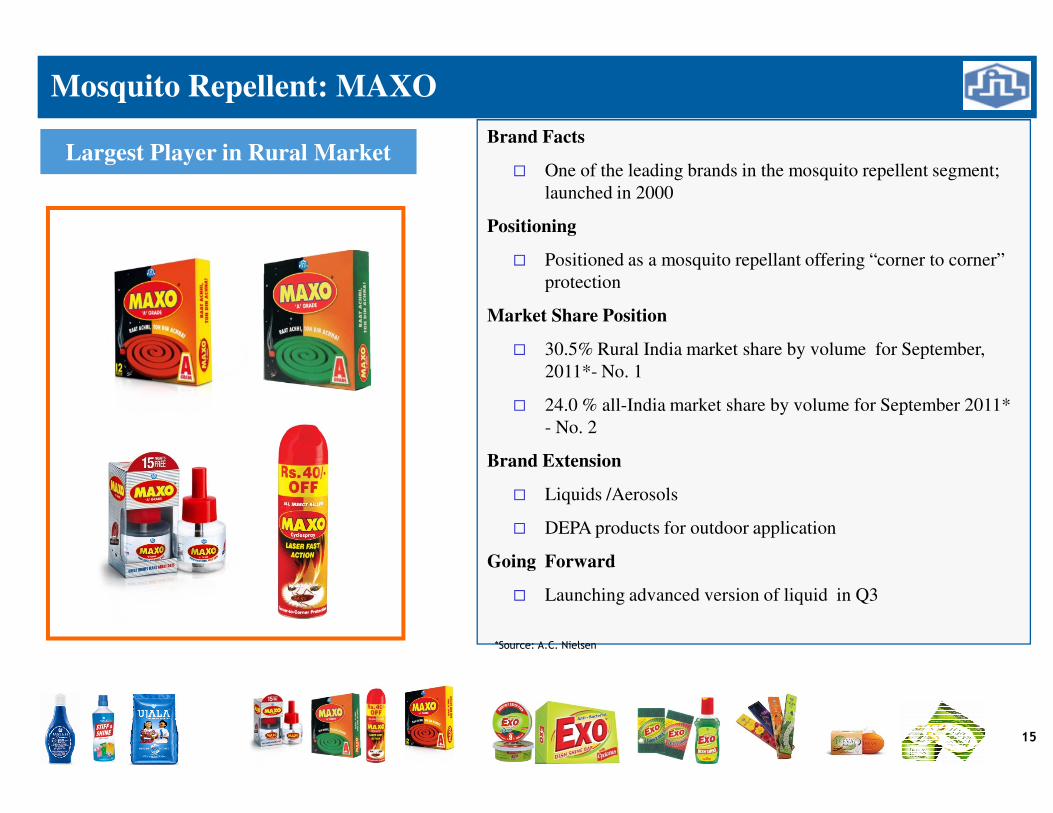
Mosquito Repellent: MAXO
Brand Facts
� One of the leading brands in the mosquito repellent segment;
launched in 2000
Positioning
� Positioned as a mosquito repellant offering “corner to corner”
protection
Market Share Position
� 30.5% Rural India market share by volume for September,
2011*- No. 1
� 24.0 % all-India market share by volume for September 2011*
Largest Player in Rural Market
15
� 24.0 % all-India market share by volume for September 2011*
- No. 2
Brand Extension
� Liquids /Aerosols
� DEPA products for outdoor application
Going Forward
� Launching advanced version of liquid in Q3
*Source: A.C. Nielsen

Dishwashing Products: EXO
Brand Facts
� Exo Dishwash Bar - India’s first anti-bacterial dish wash launched
in 2000
� Features Cyclozan, which gives a protective cover against
bacterial contamination of utensils
Positioning
� Positioned as a brand giving consumers protection against bacterial
contamination of utensils in addition to the promise of “clean and
shiny” utensils – EXO Family HEALTHY Family.
Market Share
27.2 % market share by value in Southern India for September
16
� 27.2 % market share by value in Southern India for September
2011* - No. 2
� 53.6 % Kerala market share by value for September 2011* – No 1
Brand Extension
� Dishwashing liquid - Exo Liquid /Exo Gel
� Dishwashing scrubber - Exo Safai
Going Forward
� National roll out started in phased manner
� Presently available in 0.6 mn retail outlets1 Southern states include T.N., Karnataka, Kerala and A.P.
*Source: A.C. Nielsen

Market Shares at a Glance
40.0
50.0
60.0
70.0
80.073.5
59.9
73.0
59.4
Sep'11
17
0.0
10.0
20.0
30.0
Value Volume Value Volume Value Volume
Ujala Maxo Exo
21.5
24.0
27.2
24.8
22.4
24.523.5
20.8
Sep'10

Recent Development
18
Recent Development

Henkel Acquisition
� Acquired controlling stake in Henkel India Limited
� Board re-constituted on May 31, 2011
19
Brands very well known
amongst consumers and
retailers due to superior
product quality

INR Rs. Cr
Henkel Acquisition
Seller % of shares Value
TPL 16.66 67.9
Henkel AG 50.97 143.0
Open Market 3.97 18.9
Open offer 12.05 57.8
20
Open offer closed on August 22, 2011
Other Transaction Cost 27.88
Preference Capital 42.6
Loan Repayment 425.0
Total 83.65 783.0

Henkel Turnaround Plan – 120 days (Phase 1)
June to September 2011 - Executed
� Shifted the corporate office with 30 employees from
Finance/Operations/Marketing to Mumbai w.e.f October 2011
� Employees as on March 31, 2011 was 421 and as on September 30,
2011 - 275
21

� Production – taken control keeping only key important manufacturing
location
� All other outsourcing arrangements shifted to JLL manufacturing
facilities
� Purchase/Supply chain shifted to Mumbai w.e.f August 2011
� Marketing – New Campaign to start from January 2012
Henkel Turnaround - 120 days (Phase 1) - Contd
� Marketing – New Campaign to start from January 2012
22

Henkel Turnaround - 180 days (Phase 2)
October 2011 to March 2012
� Management team to be in place
� Takeover of sales of weaker zone i.e., North and West
� Synergize distribution network of JLL and Henkel
� Revisit positioning and pricing of Henkel products
� Merger to commence from 1st April, 2012
23

Henkel Turnaround Status
Period Net Sales EBITDA %
Jan-Dec’10 (12 months) 53,390 -3.2 %
Jan-Mar’11 ( 3 months) 11,921 -6.4 %
Apr-Jun’11 ( 3 months) 12,311 8.8 %
Rs. In lakhs
Apr-Jun’11 ( 3 months) 12,311 8.8 %
Jul – Sept’11 (3 months
estimate)
10,746 10.6 %
24

Our Turnaround Plan For The Business
Operational Measures Expected Financial Impact
Clean up(6-12 months)
• Change top management – retain select middle
managers handling brands and distribution
• Remove all sales promotions and offers
• Increase retail prices across products appropriate to
their positioning
• Remove current advertising agencies
Revitalize(12-24 months)
• Recruit a fresh field force of 200 sales persons
• Appoint a Special Task Force at Key positions
including CEO, Marketing head and Supply Chain
Transfer a few best-in-class sales heads from Jyothy
6 -12
Dec-10 months Year 1 Year 2 Year 3 Year 4
Revenue 5,339 5,000 7,000 10,000 12,000
growth (%) -10% 40% 43% 20%
Gross Profit 2,406 1,500 2,100 3,000 3,600
margin (%) 45% 30% 30% 30% 30%
A&P Spend (800) (980) (1,200) (1,200)
16.0% 14.0% 12.0% 10.0%
Clean up
phase;
c.15-20%
25
• Transfer a few best-in-class sales heads from Jyothy
to drive transformation
• Focus on South & East based stockists / distributors
in the first phase and increase their productivity
based incentives
• Transfer all manufacturing to single low-cost
contract manufacturer / Jyothy’s tax free facilities
• Re-launch brands with new creative and positioning
in a phased manner
Salaries (230) (265) (304) (350)
Sales force (180) (207) (238) (274)
Management (50) (58) (66) (76)
Overheads (30) (33) (36) (40)
EBITDA (169) 440 823 1,460 2,010
margin (%) -3.2% 8.8% 11.8% 14.6% 16.8%
c.15-20%
revenue
degrowth
possible

Bangladesh / Sri Lanka
� Looks very positive post Henkel acquisition
� Bangladesh to start operations from April 2012 and Sri Lanka from
July 2012
� Already setup JV in Bangladesh with Kallol Enterprise Limited for
setting up state of art manufacturing facility and marketing of
detergent powder and toilet soapsdetergent powder and toilet soaps
� Shifting best in class sales staff from West Bengal to Bangladesh
and from Kerala and Tamil Nadu to Sri Lanka for 6 months to build
the sales in the respective countries
26

Jyothy Fabricare Services Limited
27
Jyothy Fabricare Services Limited
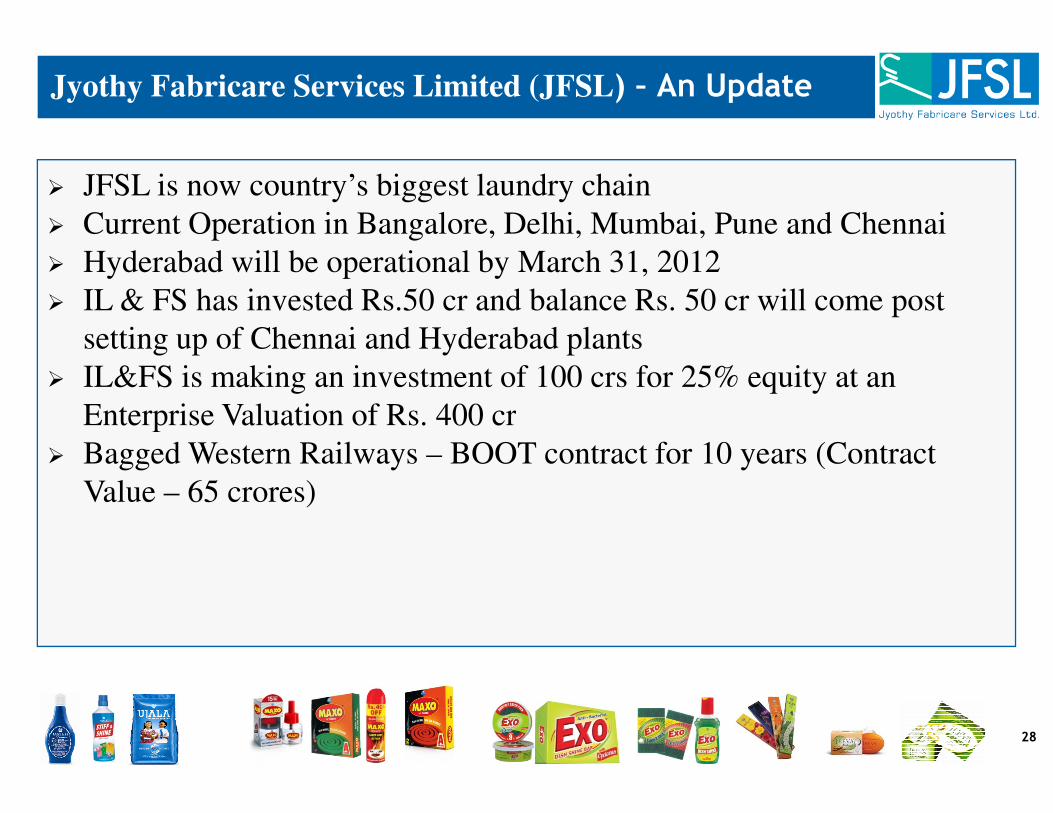
Jyothy Fabricare Services Limited (JFSL) – An Update
� JFSL is now country’s biggest laundry chain
� Current Operation in Bangalore, Delhi, Mumbai, Pune and Chennai
� Hyderabad will be operational by March 31, 2012
� IL & FS has invested Rs.50 cr and balance Rs. 50 cr will come post
setting up of Chennai and Hyderabad plants
� IL&FS is making an investment of 100 crs for 25% equity at an
Enterprise Valuation of Rs. 400 cr
28
Enterprise Valuation of Rs. 400 cr
� Bagged Western Railways – BOOT contract for 10 years (Contract
Value – 65 crores)
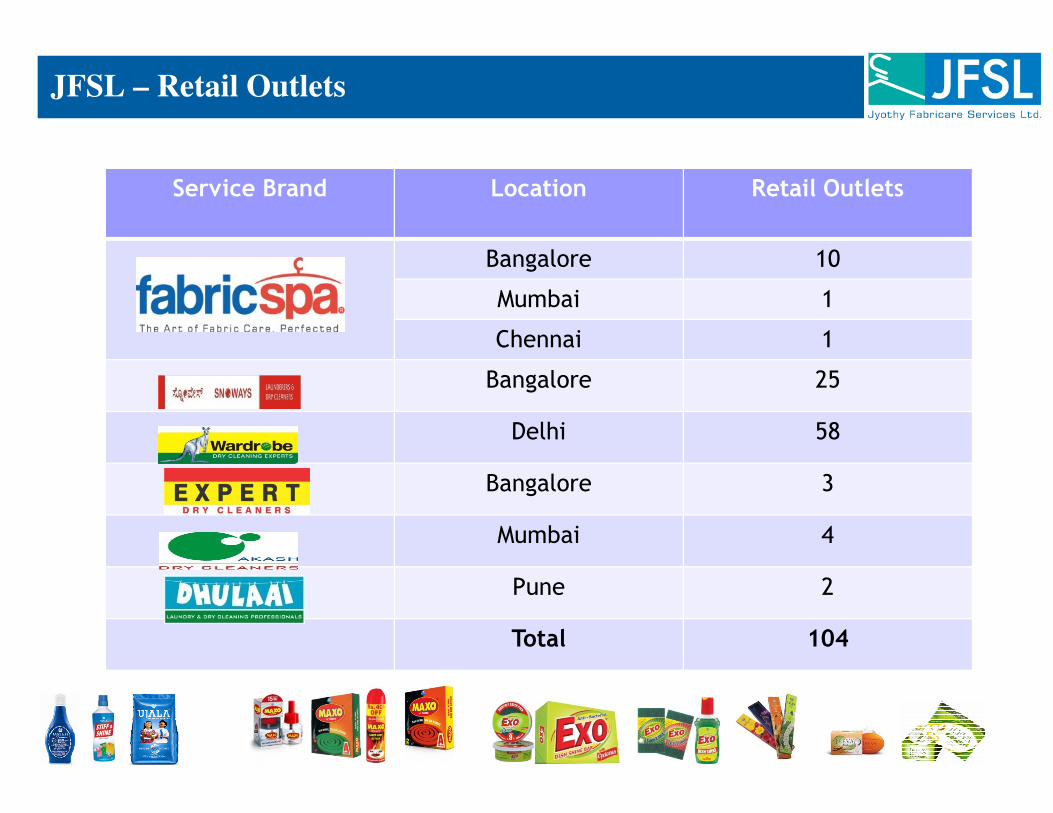
JFSL – Retail Outlets
Service Brand Location Retail Outlets
Bangalore 10
Mumbai 1
Chennai 1
Bangalore 25
Delhi 58
Bangalore 3
Mumbai 4
Pune 2
Total 104

JFSL – Turnover
Location Turnover
Year Ended March
31, 2011
Actual 6 Month
ended Sept 11
Projected 6 Month Oct to March 12
Total for
2011-12
Bangalore 941 818 1,414 2,232
Mumbai - 438 1,217 1,655
Rs. In lakhs

ERROR: stackunderflow
OFFENDING COMMAND: ~
STACK: