jyothy laboratories limitedjyothylaboratories.com/pdf/presentations/2012-13/jyothy investors... ·...
TRANSCRIPT
Strictly Private & Confidential
Jyothy Laboratories LimitedFebruary 7, 2013Analyst Call
1
Contents
Company Overview
Financial Summary for Q3 FY 2013
Segment-wise Analysis
New Business Initiatives
New Management Team
2
Company Overview
� A FMCG company with presence in the fabric care, household insecticide, surface cleaning, personal care
and air care segments
� Promoted by Mr. M.P. Ramachandran in 1983
� Leadership through Key Brands:
� Ujala: #1 in Fabric Care: 72.8% all-India market share by value and 59 % by volume for the year
ended December 2012* (73.6% by value and 60.1% by volume – December 2011)
� Maxo Coil: 17.2% all-India market share by value and 19.8 % by volume for the year ended December 2012
(19.8% by value and 22.0 by volume – December 2011)
- 24.3 % Rural India market share by volume for December 2012*
� Exo Bar : 27.8 % South India market share by value and 25.0 % by volume for year ended December 2012
* - No. 2 (26% by value and 24% by volume – December 2011)
- 53.9 % Kerala market share by value and 51.5 % by volume for year ended December 2012 * - No 1
# Liquid Blue Cate0gory
*Source: A.C. Nielsen
3
Company Overview (Cont’d.)
� Extensive Distribution Network
� Available in ~ 2.9 mn outlets in India as of December 31, 2012 (Source: A.C. Nielson)
� Field staff have a direct reach of ~ 1 million outlets
� Strong presence in both rural and urban markets
Offering Value-for-Money Products to the Common Man
4
Financial Summary
2012-13
5
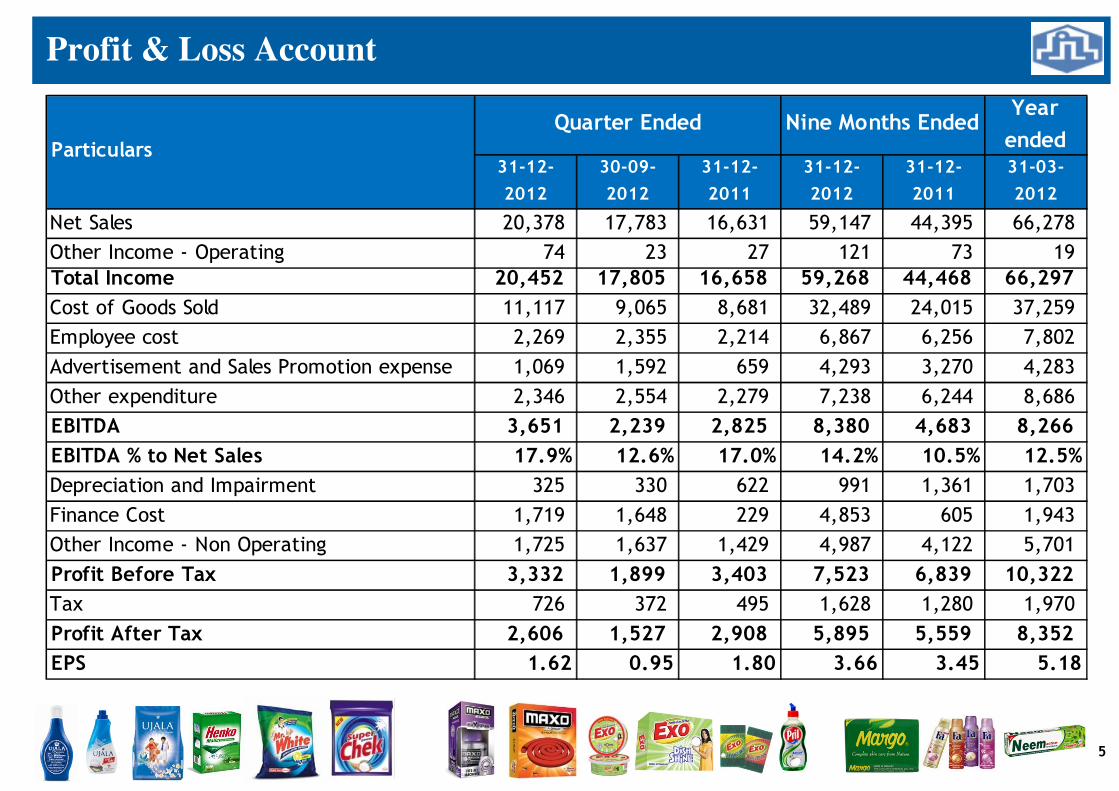
Profit & Loss Account
Year
ended31-12-
2012
30-09-
2012
31-12-
2011
31-12-
2012
31-12-
2011
31-03-
2012
Net Sales 20,378 17,783 16,631 59,147 44,395 66,278
Other Income - Operating 74 23 27 121 73 19
Total Income 20,452 17,805 16,658 59,268 44,468 66,297
Cost of Goods Sold 11,117 9,065 8,681 32,489 24,015 37,259
Employee cost 2,269 2,355 2,214 6,867 6,256 7,802
Advertisement and Sales Promotion expense 1,069 1,592 659 4,293 3,270 4,283
Other expenditure 2,346 2,554 2,279 7,238 6,244 8,686
EBITDA 3,651 2,239 2,825 8,380 4,683 8,266
EBITDA % to Net Sales 17.9% 12.6% 17.0% 14.2% 10.5% 12.5%
Depreciation and Impairment 325 330 622 991 1,361 1,703
Finance Cost 1,719 1,648 229 4,853 605 1,943
Other Income - Non Operating 1,725 1,637 1,429 4,987 4,122 5,701
Profit Before Tax 3,332 1,899 3,403 7,523 6,839 10,322
Tax 726 372 495 1,628 1,280 1,970
Profit After Tax 2,606 1,527 2,908 5,895 5,559 8,352
EPS 1.62 0.95 1.80 3.66 3.45 5.18
Particulars
Quarter Ended Nine Months Ended
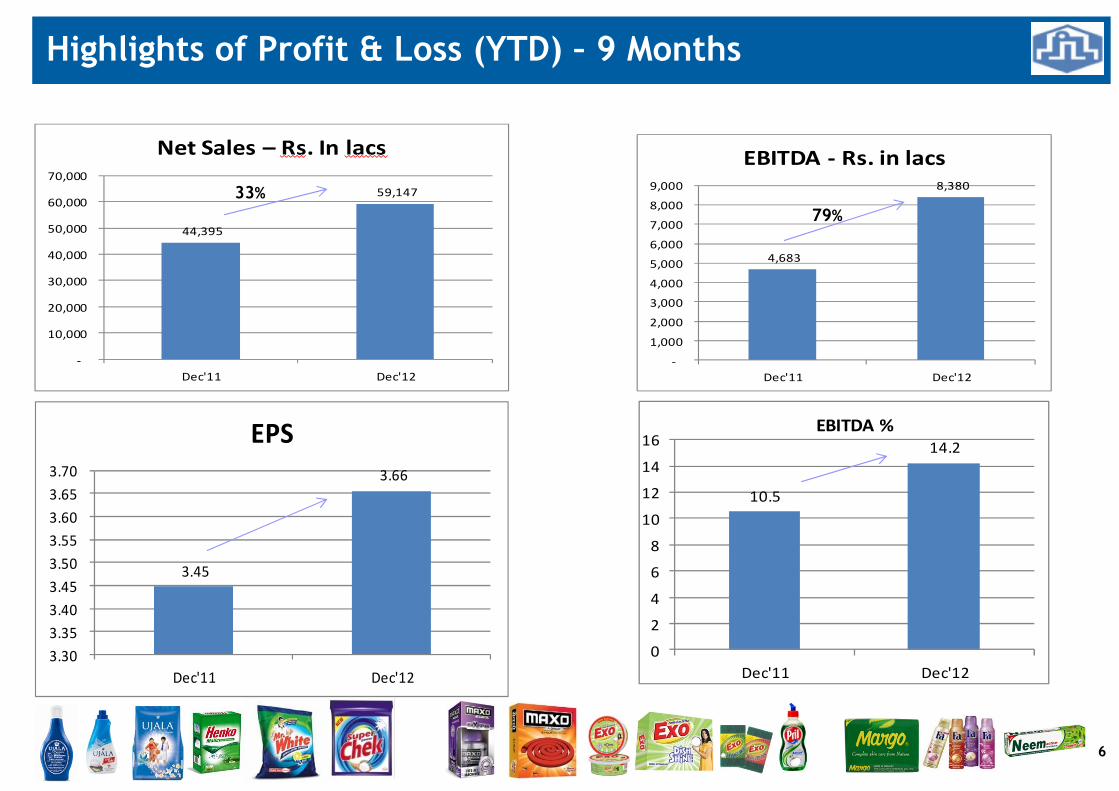
Highlights of Profit & Loss (YTD) – 9 Months
6
10.5
14.2
0
2
4
6
8
10
12
14
16
Dec'11 Dec'12
EBITDA %
4,683
8,380
-
1,000
2,000
3,000
4,000
5,000
6,000
7,000
8,000
9,000
Dec'11 Dec'12
EBITDA - Rs. in lacs
44,395
59,147
-
10,000
20,000
30,000
40,000
50,000
60,000
70,000
Dec'11 Dec'12
Net Sales – Rs. In lacs
3.45
3.66
3.30
3.35
3.40
3.45
3.50
3.55
3.60
3.65
3.70
Dec'11 Dec'12
EPS
79%
33%
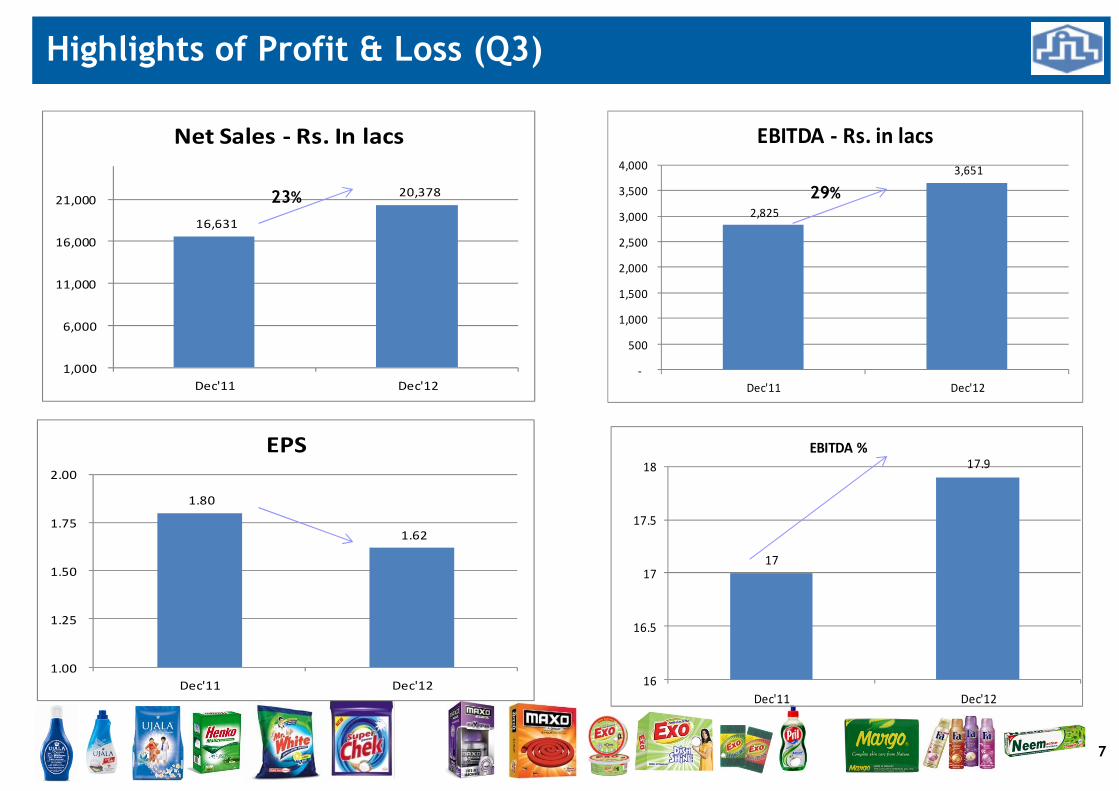
Highlights of Profit & Loss (Q3)
7
1.80
1.62
1.00
1.25
1.50
1.75
2.00
Dec'11 Dec'12
EPS
2,825
3,651
-
500
1,000
1,500
2,000
2,500
3,000
3,500
4,000
Dec'11 Dec'12
EBITDA - Rs. in lacs
17
17.9
16
16.5
17
17.5
18
Dec'11 Dec'12
EBITDA %
16,631
20,378
1,000
6,000
11,000
16,000
21,000
Dec'11 Dec'12
Net Sales - Rs. In lacs
23% 29%
8
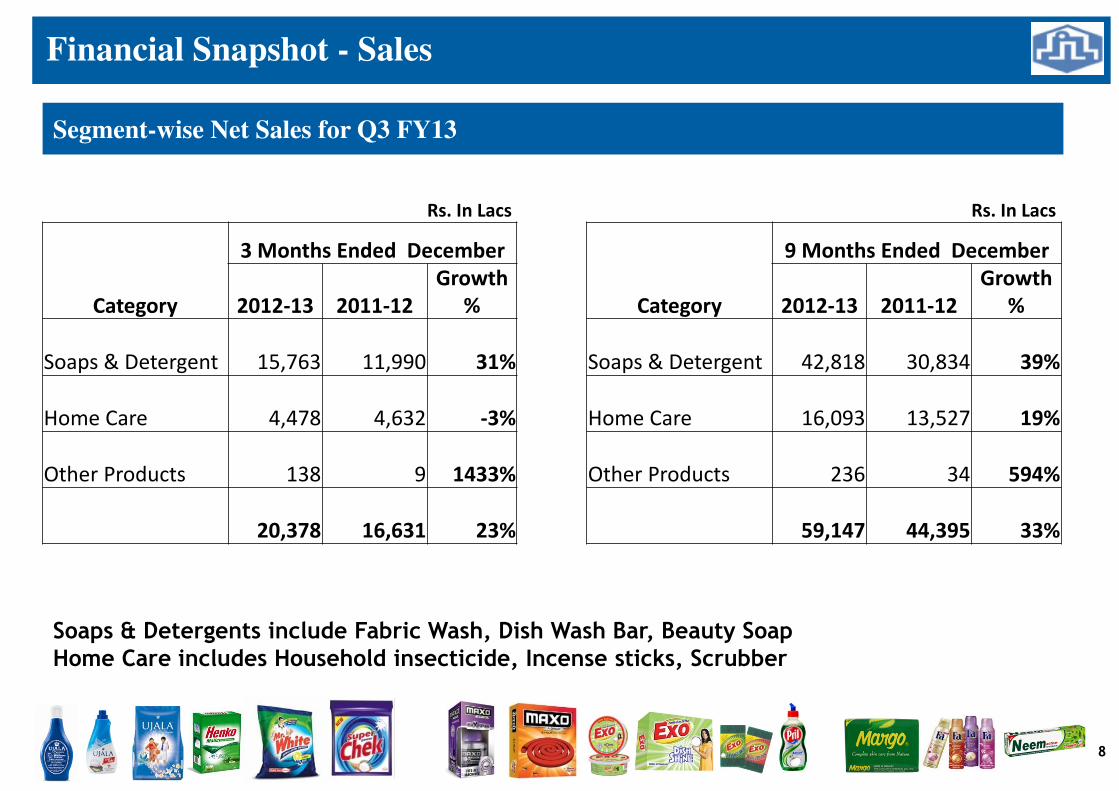
Financial Snapshot - Sales
Segment-wise Net Sales for Q3 FY13
Rs. In Lacs
Category
3 Months Ended December
2012-13 2011-12
Growth
%
Soaps & Detergent 15,763 11,990 31%
Home Care 4,478 4,632 -3%
Other Products 138 9 1433%
20,378 16,631 23%
Rs. In Lacs
Category
9 Months Ended December
2012-13 2011-12
Growth
%
Soaps & Detergent 42,818 30,834 39%
Home Care 16,093 13,527 19%
Other Products 236 34 594%
59,147 44,395 33%
Soaps & Detergents include Fabric Wash, Dish Wash Bar, Beauty SoapHome Care includes Household insecticide, Incense sticks, Scrubber
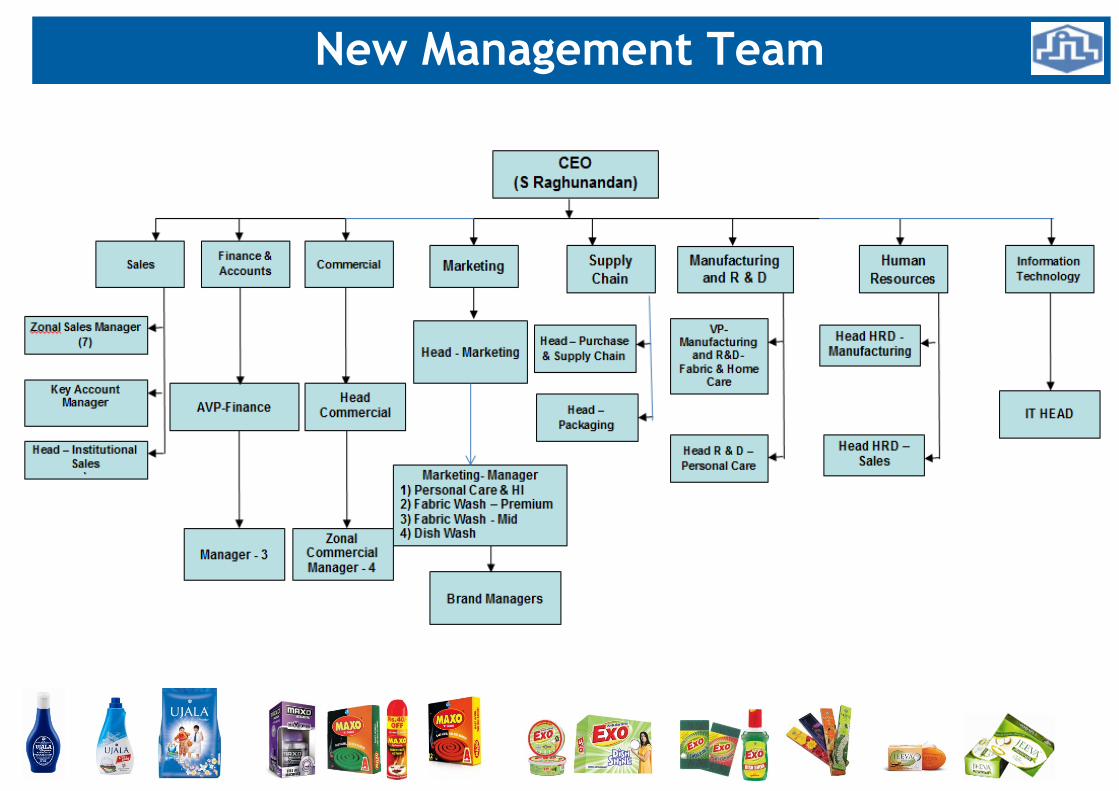
New Management Team
10
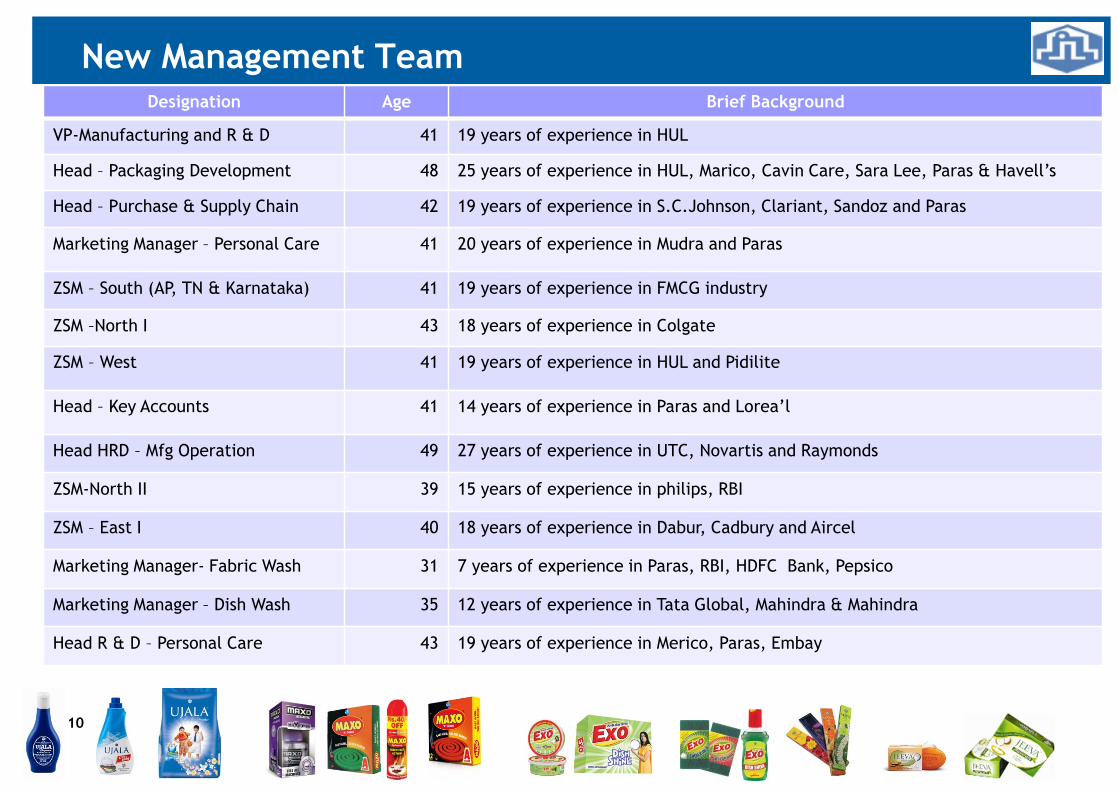
New Management TeamDesignation Age Brief Background
VP-Manufacturing and R & D 41 19 years of experience in HUL
Head – Packaging Development 48 25 years of experience in HUL, Marico, Cavin Care, Sara Lee, Paras & Havell’s
Head – Purchase & Supply Chain 42 19 years of experience in S.C.Johnson, Clariant, Sandoz and Paras
Marketing Manager – Personal Care 41 20 years of experience in Mudra and Paras
ZSM – South (AP, TN & Karnataka) 41 19 years of experience in FMCG industry
ZSM –North I 43 18 years of experience in Colgate
ZSM – West 41 19 years of experience in HUL and Pidilite
Head – Key Accounts 41 14 years of experience in Paras and Lorea’l
Head HRD – Mfg Operation 49 27 years of experience in UTC, Novartis and Raymonds
ZSM-North II 39 15 years of experience in philips, RBI
ZSM – East I 40 18 years of experience in Dabur, Cadbury and Aircel
Marketing Manager- Fabric Wash 31 7 years of experience in Paras, RBI, HDFC Bank, Pepsico
Marketing Manager – Dish Wash 35 12 years of experience in Tata Global, Mahindra & Mahindra
Head R & D – Personal Care 43 19 years of experience in Merico, Paras, Embay
11
New Business Initiatives
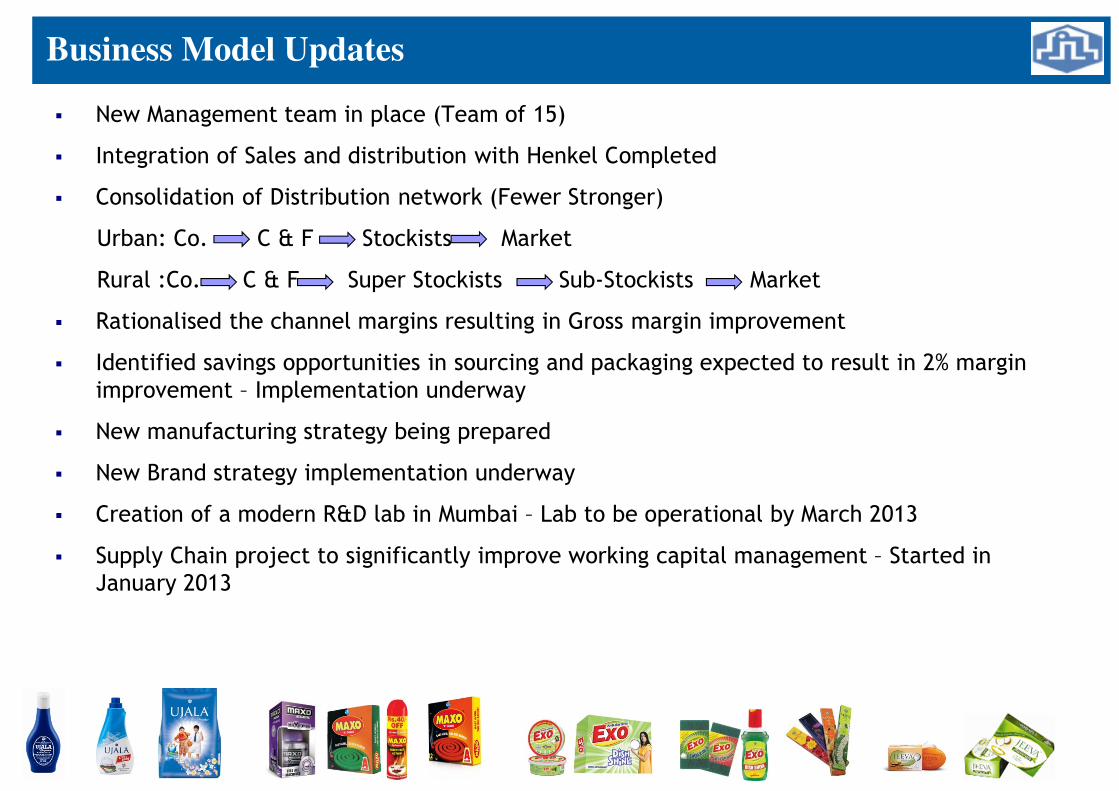
Business Model Updates
� New Management team in place (Team of 15)
� Integration of Sales and distribution with Henkel Completed
� Consolidation of Distribution network (Fewer Stronger)
Urban: Co. C & F Stockists Market
Rural :Co. C & F Super Stockists Sub-Stockists Market
� Rationalised the channel margins resulting in Gross margin improvement
� Identified savings opportunities in sourcing and packaging expected to result in 2% margin
improvement – Implementation underway
� New manufacturing strategy being prepared
� New Brand strategy implementation underway
� Creation of a modern R&D lab in Mumbai – Lab to be operational by March 2013
� Supply Chain project to significantly improve working capital management – Started in
January 2013
Focus for the year 2012-13
13
� Business Model
� Organisation Structure
� Strategy for Sales & Marketing
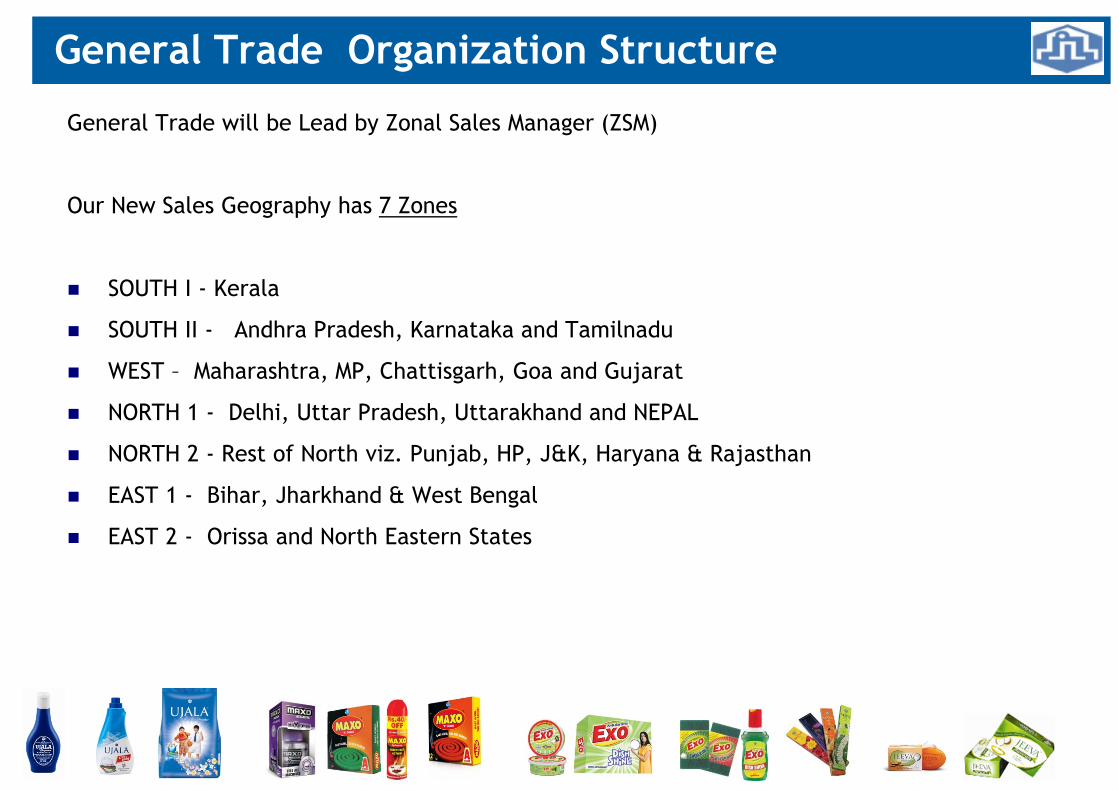
General Trade Organization Structure
General Trade will be Lead by Zonal Sales Manager (ZSM)
Our New Sales Geography has 7 Zones
� SOUTH I - Kerala
� SOUTH II - Andhra Pradesh, Karnataka and Tamilnadu
� WEST – Maharashtra, MP, Chattisgarh, Goa and Gujarat
� NORTH 1 - Delhi, Uttar Pradesh, Uttarakhand and NEPAL
� NORTH 2 - Rest of North viz. Punjab, HP, J&K, Haryana & Rajasthan
� EAST 1 - Bihar, Jharkhand & West Bengal
� EAST 2 - Orissa and North Eastern States
General Trade – Way Forward
� Focus on implementation of the Integration process by ZSM’s
� Automation of Secondary Sales and Order booking : Secondary Sales
software will be LIVE from April 2013.
� All Distributor Claims and Secondary Schemes will be automated through
the same software – September 2013
� Creation of Zonal Commercial Structure - Completed
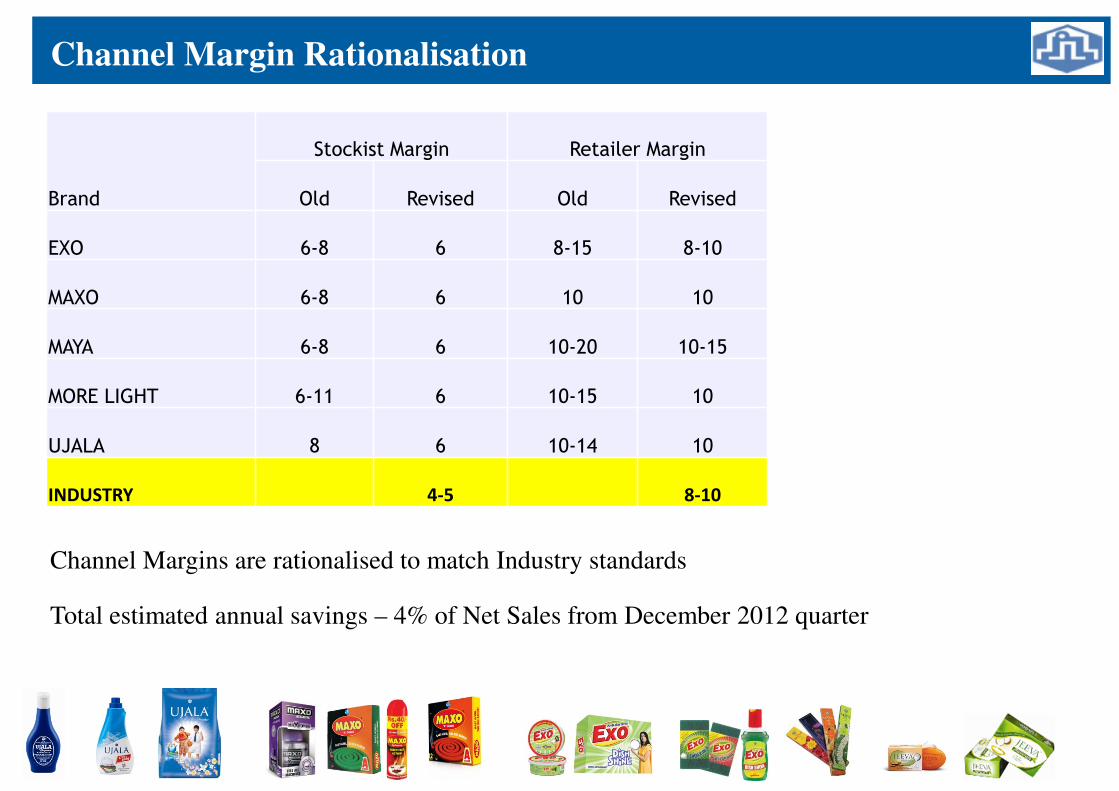
Channel Margin Rationalisation
Total estimated annual savings – 4% of Net Sales from December 2012 quarter
Brand
Stockist Margin Retailer Margin
Old Revised Old Revised
EXO 6-8 6 8-15 8-10
MAXO 6-8 6 10 10
MAYA 6-8 6 10-20 10-15
MORE LIGHT 6-11 6 10-15 10
UJALA 8 6 10-14 10
INDUSTRY 4-5 8-10
Channel Margins are rationalised to match Industry standards
Packaging Development – Key Priorities
� Cost Reduction
� Quality Improvement / packaging upgradation
� Innovation in key brands
� Systems development
Packaging Development 17
Build Innovation Capability
� Analytical & Micro lab in Mumbai
� Key capabilities
� Proof of Principle validation for new technologies
� New Product development
� performance appraisal & competition benchmarking
� Additionally will have accelerated storage stability facility to help predict long term
stability of products.
� Pilot plant in one of our Units. Pondicherry is the lead candidate.
� Tie-ups with External labs, Universities & Suppliers to develop technology for our
innovations
Look for exclusive development with key partners and patenting new
technologies.
Manufacturing Key priorities
� Strategic
� Manufacturing strategy for each product
� Consolidation of manufacturing units
� Low cost business model for new launches in future
� Operational
� Cost efficiency at each location
� Capacity mapping, de-bottlenecking
� Benchmarking across factories and with industry standards
� Long term
� Safety & Quality Assurance
� Statistical Process Control

Thank You