juvenile diversion programs: high-risk youth and their ... · juvenile diversion programs:...
TRANSCRIPT
JUVENILE DIVERSION PROGRAMS 1
Juvenile Diversion Programs: High-Risk Youth
and Their Effect on Offense Targeting
Chelsey R. Warner
Bemidji State University
Political Science Senior Thesis
Bemidji State University
Dr. Patrick Donnay, Advisor
April 2014
JUVENILE DIVERSION PROGRAMS 2
Abstract
One of the largest problems that plague the juvenile justice system today is how to better handle
juvenile crime without causing the juvenile to revert back to that behavior, but still helping them
understand and acknowledge the crime they have committed. The state of Minnesota has created
juvenile diversion programs as an attempt to aid in that endeavor. These programs however are
under researched. The goal of this article is to shed some light on what those programs look like
and how some counties programs vary from other programs on other counties; specifically
focusing on the variation between offense-targeting for high-risk youth. This study uses county
level data collected from the Minnesota Department of Public Safety and the American
Community Survey to answer the following question: Do programs with more high-risk youth
target more severe crimes? Findings suggest that there is a significant correlation between high-
risk youth and diversion programs which target more severe crimes.

JUVENILE DIVERSION PROGRAMS 3
Introduction
Juvenile diversion programs have been forming across the United States since the 1970’s
as an attempt to reduce costs, improve outcomes, hold youth accountable and protect public
safety. A juvenile diversion program is the intentional decision to address unlawful behavior
outside of the formal juvenile justice system. Diversion connects youth to resources to prevent
future offenses, while promoting public safety and encouraging responsible citizenship. The
process of diversion may be administered by law enforcement, county attorney offices,
corrections organizations, educations or community-based organizations. A program which has
the funds to do so, may choose to have multiple diversion programs, this means that they may
have a separate program for youth who have committed an offense of shoplifting, and another
program for youth who commit a curfew violation.
In 1974, the United States passed the Juvenile Justice and Delinquency Prevention Act
(JJDPA), which provided funds to states that follow a series of federal protections, known as the
“core protections”, on the care and treatment of youth in the justice system. The four “core
protections” are: (1) Deinstitutionalization of Status Offenders, which requires that youth who
are runaways, truants or curfew violators not be detained in juvenile detention facilities or adult
jails; (2) “Sight and Sound” separation protection disallows contact between juvenile and adult
offenders in jails, (3) “Jail Removal” disallows the placement of youth in adult jails and lock ups
except under very limited circumstances; and (4) Disproportionate Minority Confinement which
requires states to address the issue of overrepresentation of youth of color in the justice system
(Juvenile Justice and Delinquency Prevention, 1974). As of 2000, most participating states
comply with the first three requirements and are making strides towards the fourth. With the
exception of Wyoming, all states participate in the program. This act created an uptick in
JUVENILE DIVERSION PROGRAMS 4
juvenile diversion programs when the Disproportionate Minority Confinement protection was
added in 2002; it urges states to keep youth out of jails, requires states to reduce racial and ethnic
disparities, and reinforces the focus on prevention programs intended to keep youth from ever
entering the criminal justice system as adults.
As of July 1st of 1995, every county in Minnesota has been required to have an
implemented juvenile diversion program. According to statute these programs must be operated
to further the following goals (Minnesota Statute, 1995):
(1) to provide eligible offenders with an alternative to adjudication that
emphasizes restorative justice;
(2) to reduce the costs and caseload burdens on juvenile courts and the juvenile
justice system;
(3) to minimize recidivism among diverted offenders;
(4) to promote the collection of restitution to the victim of the offender’s crime;
(5) to develop responsible alternatives to the juvenile justice system for eligible
offenders; and
(6) to develop collaborative use of demonstrated successful culturally specific
programming where appropriate.
While Minnesota statute specifies the purpose of diversion and establishes minimum
eligibility criteria, most aspects of juvenile diversion programming and service delivery are left
to the individual counties to determine. With 87 counties, which youth receive diversion, what
agency oversees programming, the conditions necessary to complete diversion and the services
offered in conjunction with diversion can vary widely. This variability can potentially result in
inconsistent application of diversion or inequitable access to services among those diverted.
JUVENILE DIVERSION PROGRAMS 5
In 2009, the Minnesota Legislature required a study to be completed on the feasibility of
collecting and reporting summary data relating to the decisions that affect a child’s status with
the juvenile justice system. The Minnesota Department of Public Safety Office of Justice
Programs conducted this study to better understand what characteristics juvenile diversion
programs in Minnesota counties have.
JUVENILE DIVERSION PROGRAMS 6
Literature Review
Background
In a report published by the Minnesota Department of Public Safety Office of Justice
Programs authors Dana Swayze and Danette Buskovick (2012) detail program specifics for
Minnesota counties, calculating the number of arrests, the type of juvenile cases, the types of
diversion programs, and how each program is run. A county which has the funds to do so, may
choose to have multiple diversion programs, this means that they may have a separate program
for youth who have committed and offense of shoplifting, and another program for youth who
have committed a curfew violation. In Minnesota there are 65 counties with one diversion
program; 16 with two to three diversion programs and four counties with four to six diversion
programs; and only Hennepin County has seven juvenile diversion programs.
Most counties receive diversion referrals from the County Attorney’s office (87% of
counties); with 40% of counties stating that they receive referrals from Law Enforcement
(Swayze & Buskovick, 2012). The study also found that most counties in Minnesota do have
optional diversion programs, this means that if the youth would rather their case go to court, they
may refuse to go through the diversion process. Only two counties in Minnesota require a youth
with a referral go through diversion. The majority of counties only require one meeting about an
hour in length for completion of their diversion program.
In an evaluation of a 3-year experimental, pre-trial, police-referral, community based
youth diversion program Donald Fischer and Richard Jeune (1987) found in their experimental
diversion program (which served 259 youth in a 160,000 population) that there is a pressing need
JUVENILE DIVERSION PROGRAMS 7
for research into recidivism rates of divertees compared to youths processed through court. In
Juvenile Diversion: A Process Analysis they write, “Over 90% of the diversion agreements in the
present study were completed satisfactorily, this suggests a high degree of success in the
operation of the program” Fischer and Jeune also state, “One factor that comes it mind is race or
culture. There were more failures for Native than white youths, for example.”
Recidivism and Labeling Theory
Richard J. Lundman (1976), author of Will Diversion Reduce Recidivism?, writes, “The
demographic characteristics of delinquents appear to be changing. Delinquency statistics affirm
that delinquents are disproportionately male, lower class, in a racial minority, and urban in
residence.” In this article Lundman details origins and background information for juvenile
diversion programs, but most importantly attempts to answer the question of whether diversion
will in fact reduce recidivism. Later Lundman writes, “First, the offender is identified and
labeled. As he is labeled, certain sanctions are imposed; a certain critical stance is assumed. The
sanctions and stance tend to convince the offender that he is deviant, that he is different, and to
confirm any doubts he may have had about his capacity to function in the manner of the
majority. Further, as the label is more securely fixed, society’s agencies, police, school, etc.,
lower their level of tolerance of any further deviance.” This is known as labeling theory and it is
seen as the key motivation behind juvenile diversion.
Labeling theory is one of the most important approaches to understanding deviant and
criminal behavior. It stems from the work of W.I. Thomas (1928) who, in his book The Child in
America, wrote, "If men define situations as real, they are real in their consequences.” Labeling
theory begins with the assumption that no act is intrinsically criminal. Definitions of criminality
JUVENILE DIVERSION PROGRAMS 8
are established by those in power through the formulation of laws and the interpretation of those
laws by police, courts, and correctional institutions. Deviance is therefore not a set of
characteristics of individuals or groups, but rather it is a process of interaction between deviants
and non-deviants and the context in which criminality is being interpreted.
Many of the rules that define deviance and the contexts in which deviant behavior is
labeled as deviant are framed by the wealthy for the poor, by men for women, by older people
for younger people, and by ethnic majorities for minority groups. In other words, the more
powerful and dominant groups in society create and apply deviant labels to the subordinate
groups. For example, many children engage in activities such as breaking windows, stealing fruit
from other people’s trees, climbing into other people’s yards, or playing hooky from school. In
affluent neighborhoods, these acts may be regarded by parents, teachers, and police as innocent
aspects of the process of growing up. In poor areas, on the other hand, these same activities
might be seen as tendencies towards juvenile delinquency.
Once a person is labeled as deviant, it is extremely difficult to remove that label. The
deviant person becomes stigmatized as a criminal or deviant and is likely to be considered, and
treated, as untrustworthy by others. The deviant individual is then likely to accept the label that
has been attached, seeing himself or herself as deviant, and act in a way that fulfills the
expectations of that label. Even if the labeled individual does not commit any further deviant acts
than the one that caused them to be labeled, getting rid of that label can be very hard and time-
consuming.
Consistent with labeling theory, literature indicates that diversion should occur at the
earliest point in the juvenile justice system and before disposition. Early intervention provides
JUVENILE DIVERSION PROGRAMS 9
services that can prevent further involvement with the system (Swayze & Buskovick, 2012).
Diversion programs also adhere to the “risk-responsivity principle” in which the lowest-risk
youth should receive the fewest formal interventions and services, and the highest-risk youth
should receive the most formal interventions. Too many interventions can actually be harmful,
and have the effect of increasing deviant attitudes and behaviors (Swayze & Buskovick, 2012).
In a meta-analysis conducted by Craig Schawlbe, Robin Gearing, Michael MacKenzie,
Kathryne Brewer, and Rawan Ibrahim (2011) entitled A Meta-Analysis of Experimental Studies
of Diversion Programs for Juvenile Offenders, authors used experimental studies that evaluate
the effectiveness of diversion programs for youthful offenders who were identified through an
electronic search. Studies were limited to serve youth under 18 who were referred to diversion by
law enforcement or the juvenile justice system prior to adjudication. Twenty-eight found studies
met inclusion criteria and were included in the analysis. The 28 studies yielded an average age of
12.6 to 15.9 years old, 88% were male. Average recidivism rates for experimental and control
conditions were 31.4% and 36.3% respectively (Schwalbe, Gearing, MacKenzie, Brewer, &
Ibrahim, 2012).
A meta-analysis conducted by Holly Wilson and Robert D. Hoge (2012), entitled The
Effect of Youth Diversion Programs on Recidivism: A Meta-Analysis Review compiling data
from 73 diversion programs assessing 14,573 diverted youth and 18,840 youth processed by the
traditional justice system. To be included in the meta-analysis, a study had to examine the
recidivism rate of youth offenders referred to a diversion program compared to those subject to
traditional processing. Diversion was very broadly defined as any program that allows the youth
to avoid official processing, full prosecution, or a traditional sentence after conviction. Wilson
and Huge concluded that the recidivism rate for all diverted youth had an un-weighted average
JUVENILE DIVERSION PROGRAMS 10
base rate of 31.5%, and the recidivism rate for the traditionally processed youth had an average
of 41.3%, which was significantly different from that of the diverted youth.
Wilson and Hoge write, “Programs targeting medium/high-risk youth offenders achieved
greater reductions in the recidivism than programs targeting low-risk offenders. This is
consistent with the risk principle of offender rehabilitation demonstrating that medium and high
risk offenders are at a greater risk of reoffending and have greater needs that require services.”
The authors go on to write, “programs that offered treatment targeting medium to high risk
offenders were more effective in reducing recidivism that those that did not.”
High-Risk Behaviors and Youth
There is a pressing need for diversion programs to begin targeting high-risk offenders;
these are the juveniles who are most likely to recommit a crime. Hoge and Wilson conclude by
writing, “The conclusions of the meta-analysis also reinforce the recommendation that agencies
pay particular attention to assessing the risk and needs level of youth entering the system” (Hoge
& Wilson, 2012).
High-risk behaviors are those that can have adverse effects on the overall development
and well-being of youth, or that might prevent them from future successes and development.
This includes behaviors that cause immediate physical injury, as well as behaviors with
cumulative negative effects. Risk behaviors also can affect youth by disrupting their normal
development or prevent them from participating in ‘typical’ experiences for their age group. For
example, teen pregnancy can preclude youth from experiencing typical adolescent events such as
graduating from school or from developing close friendships with peers. High-risk behaviors
include: violence, substance abuse and risky sexual behaviors.
JUVENILE DIVERSION PROGRAMS 11
Scholars have identified several factors that predispose youth to risk behaviors. At the
individual level, youth who have low self-esteem, who have negative peer groups, and low
school engagement or educational aspirations are more likely to engage in risky behaviors.
Familial factors include poor parent-child communication, low parental monitoring (e.g., parents
are unaware of youth’s whereabouts), and a lack of family support. Not surprisingly, when
parents themselves engage in risky behaviors, teens also are more likely to do so. Finally, extra-
familial variables also play a role in the risk behaviors of youth. Negative school climate, poor
neighborhood quality and low socioeconomic status, and poor (or no) relationships with non-
parental adults also are at more risk for negative behaviors (Andrews & Bonta, 2010).
The Youth Intervention Program (YIP) conducted a study in 2012 to identify whether
their programs are “serving the intended youth population” (Swayze & Buskovick, 2012) the
goal is to ensure that programs funded by YIP are serving youth identified as “high-risk”. The
study conducted by the Minnesota Department of Public Safety found that participants are over
three times more likely to identify as black or african american than kids not participating in the
program, and twice as likely to identify as Hispanic and 10% more likely to report chemical use.
(Swayze & Buskovick, 2012). Based on the survey conducted by YIP the authors concluded that,
“participants are more likely to represent communities of color; are more likely to receive free or
reduced priced lunch and school than mainstream youth; are more likely to live in a household
with just their mother or with other relatives; and are less likely to spend time doing homework
or studying. Participants are more likely to report feeling angry or irritable; acting without
thinking; and using alcohol and marijuana.”
Officially recorded rates of most forms of crime are higher in economically
disadvantaged areas. In the article Poverty, Parenting, Peers and Crime-Prone Neighborhoods
JUVENILE DIVERSION PROGRAMS 12
authors Don Weatherburn and Bronwyn Lind (1998) write, “economic and social stress exerts
their effects on crime by disrupting the parenting process.” They assert that economic stress, in
one way or another, motivates individuals affected by it to offend.
Understanding the findings that high-risk youth are more likely to commit (or recommit)
offenses, it can be understood that counties with a large percentage of high-risk youth would
have a higher juvenile crime rate. An understanding of the risk-responsivity principle would also
lead to the idea that the highest risk youth, should be receiving the most targeted sanctions when
compared to low-risk youth. This analysis uses this information to understand if counties in
Minnesota are adhering to the risk-responsivity principle and targeting high-risk youth in their
juvenile diversion programs. For this to be the case, Minnesota counties with a large percentage
of high-risk youth would have to be more likely to target more severe crimes.
JUVENILE DIVERSION PROGRAMS 13
Methods and Data
Dataset
Data was collected from two different sources in order to create the dataset used for this
research. The first source was collected from the Minnesota Department of Public Safety Office
of Justice Programs and the second from United States Census American Community Survey 5-
year estimates specifically focusing on poverty, race and age. All of the information collected
from these two locations was collected at the county level and collected for all of Minnesota’s 87
counties.
Independent and Dependent Variables
Dependent Variables
The Swayze & Buskovick study was the source for my juvenile diversion program data.
The study was conducted and in the form of an Excel Spreadsheet along with a codebook. The
data was coded in a way to fit SPSS formatting and uploaded into SPSS. There are four
dependent variables selected regarding the targeting of diversion programs. The respondents in
the study were asked “Does your program target a specific offense?” and then instructed to circle
all that apply among the following: smoking/tobacco, alcohol offenders, marijuana
use/possession offenses, curfew, runaways, truancy, driving offenses/license reinstatement, DUI,
arson, disorderly conduct, assault, shoplifting, animal cruelty, theft, checks/forgery/identity theft,
bullying/harassment, and violent offenders. I then put their responses into 4 categories: class,
violent, property, and drug offenses.
JUVENILE DIVERSION PROGRAMS 14
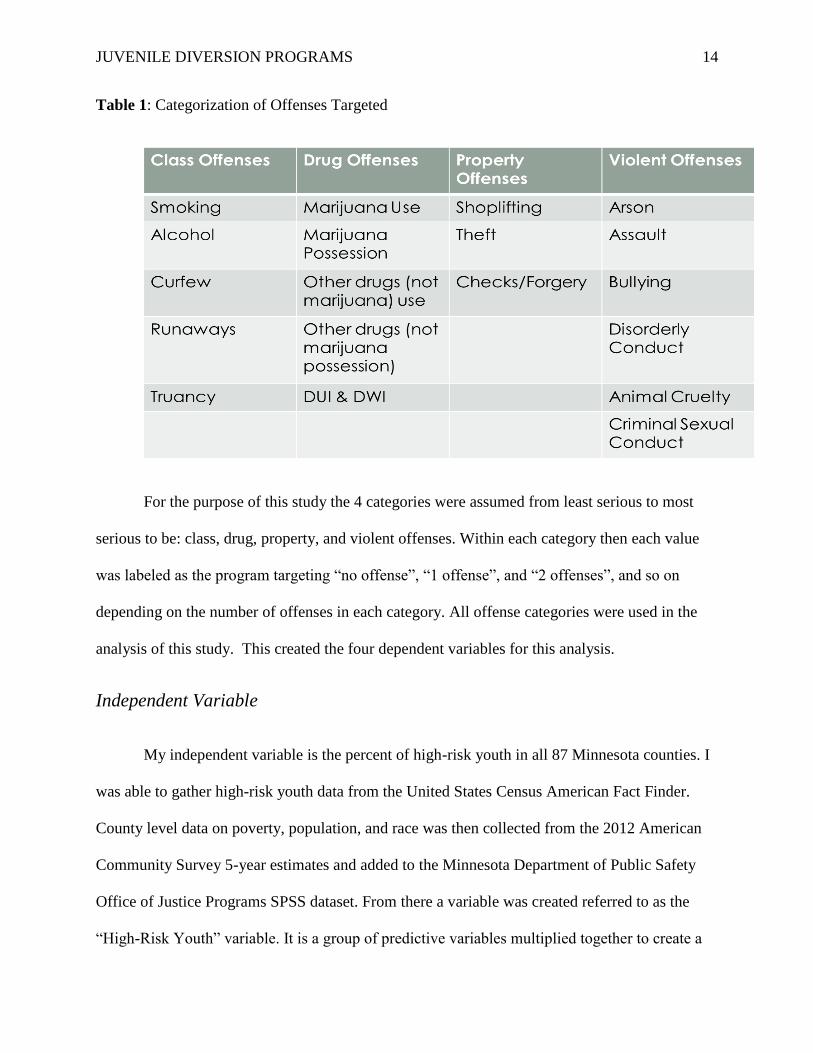
Table 1: Categorization of Offenses Targeted
For the purpose of this study the 4 categories were assumed from least serious to most
serious to be: class, drug, property, and violent offenses. Within each category then each value
was labeled as the program targeting “no offense”, “1 offense”, and “2 offenses”, and so on
depending on the number of offenses in each category. All offense categories were used in the
analysis of this study. This created the four dependent variables for this analysis.
Independent Variable
My independent variable is the percent of high-risk youth in all 87 Minnesota counties. I
was able to gather high-risk youth data from the United States Census American Fact Finder.
County level data on poverty, population, and race was then collected from the 2012 American
Community Survey 5-year estimates and added to the Minnesota Department of Public Safety
Office of Justice Programs SPSS dataset. From there a variable was created referred to as the
“High-Risk Youth” variable. It is a group of predictive variables multiplied together to create a
JUVENILE DIVERSION PROGRAMS 15
predictive set of circumstances. The variables combined are “non-white”, created by taking the
variable collected from the census on the number of white Minnesotans and subtracting it from
100, creating the percentage of Minnesotan’s who are “non-white” by county, this creates the
percent of minority populations in Minnesota counties. This number was then multiplied by the
percent of Minnesotans below the poverty line, and the population of Minnesotan’s age 10-19.
Ideally the population of Minnesotan’s age 10-17 would have been collected however the
American Community Survey did not divide the ages up in a way that would make that possible.
To reduce the artificially wide range of numbers this variable was then divided by 1,000. This
creates a range between .17 and 19.4 with .17 being the county with the least amount of high-risk
youth and 19.4 being the county with the highest amount of high-risk youth. This variable was
then binned in to 4 categories (low, some moderate and high) to create an ordinal variable useful
in crosstab analysis.
JUVENILE DIVERSION PROGRAMS 16
Hypotheses
From the data and literature four hypotheses were created all relating to the interaction of
offense targeting and the high-risk youth predictive variable. First, I hypothesized that counties
with a large number of high-risk youth will not be more likely to target class offenses than
counties with a smaller number of high-risk youth. This is because I have identified class
offenses as the least serious of the offenses that could be targeted. Following the risk-
responsivity principle it should be found that counties which target more class offenses are less
likely to have a large percentage of high-risk youth. By choosing to target class offenses, it could
be inferred that those counties have a smaller percentage of high-risk youth.
Second, I hypothesized that counties with a large number of high-risk youth will be more
likely to target drug offenses than counties with a smaller number of high-risk youth. The drug
offenses section is made up of more severe offenses, such as marijuana or other drug or
possession. By choosing to target a more severe set of offenses, it could be inferred that those
counties will have a higher percentage of high-risk youth.
Third, I hypothesized that counties with a large number of high-risk youth will be more
likely to target property offenses than counties with a smaller number of high-risk youth. Finally,
I hypothesized that counties with a large number of high-risk youth will be more likely to target
violent offenses than counties with a small number of high-risk youth.
JUVENILE DIVERSION PROGRAMS 17
Analysis
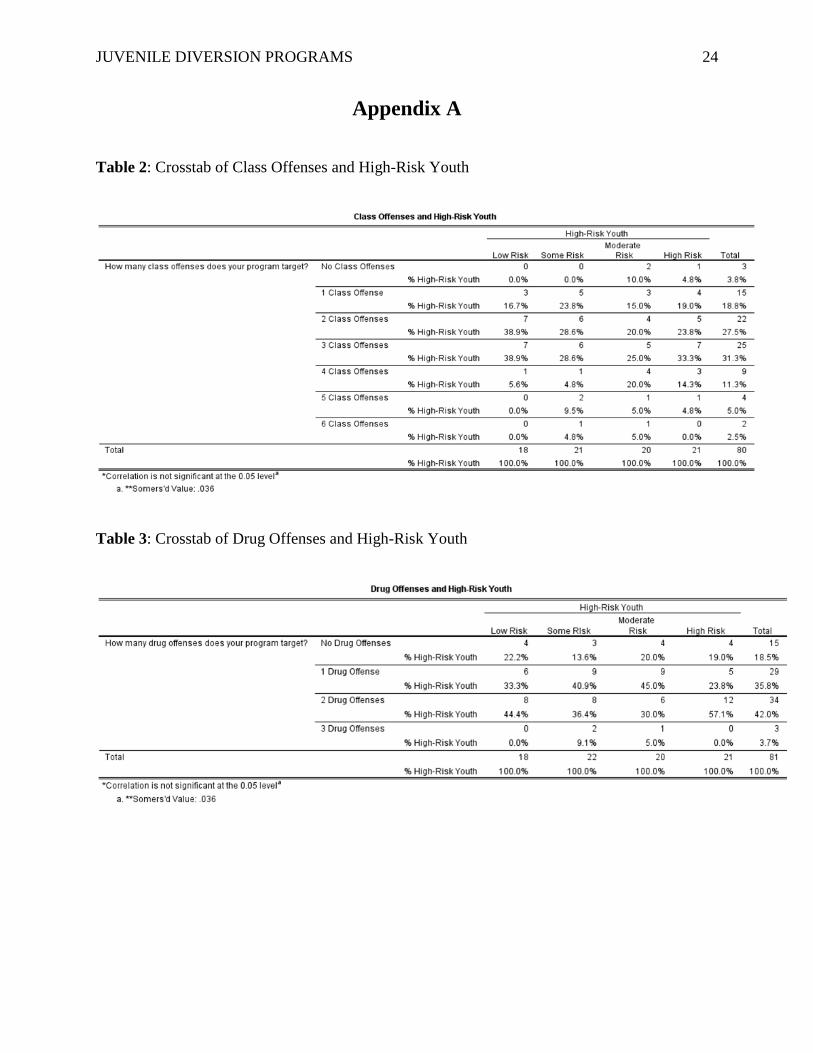
Class Offenses and High-Risk Youth
To answer the question of whether counties with a large number of high-risk youth are
more or less likely to target class offenses a crosstabs was run illustrating the relationship
between high-risk youth and class offenses. This crosstab shows that there is no correlation
between high-risk youth and class offenses. The correlation was not significant at the 0.05 level
with a Somers’d Value of 0.036.
(Insert Table 2 Here)
This supports the original hypothesis (hypothesis one) that counties with a large number
of high-risk youth are not more likely to target class offenses than counties with a small number
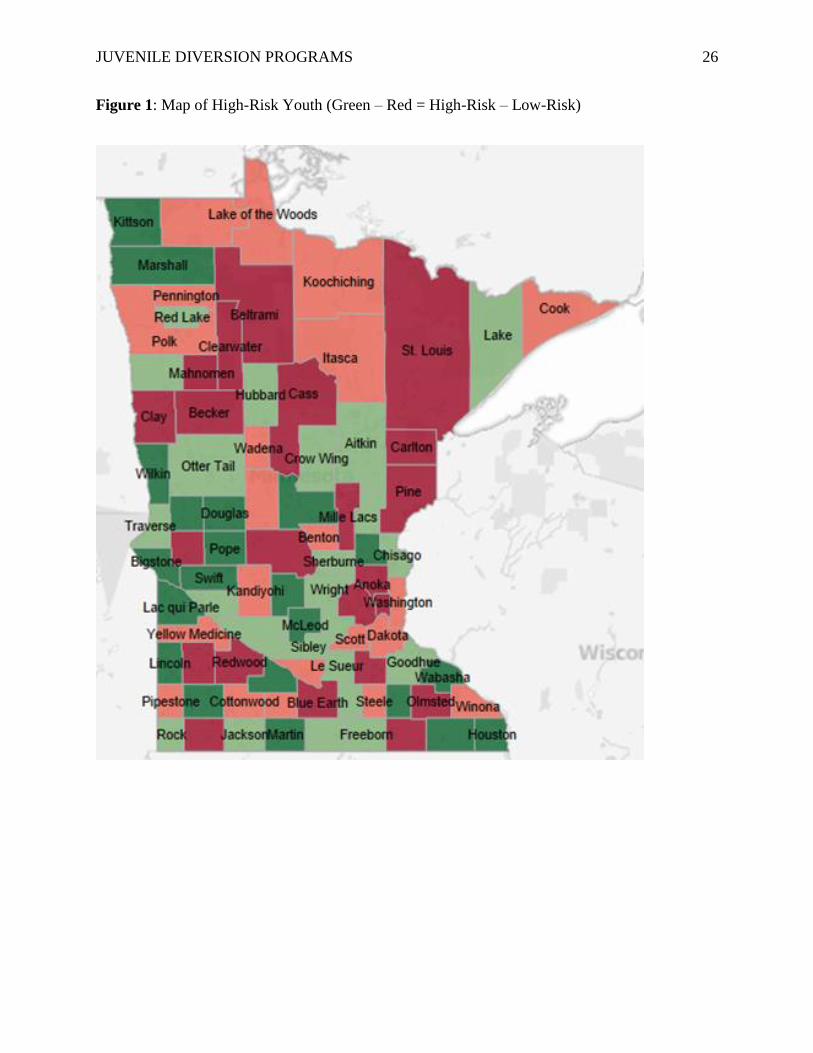
of high-risk youth. A map was then created to better understand the relationship between high-
risk youth and the targeting of class offenses.
(Insert Figure 1 & 2 Here)
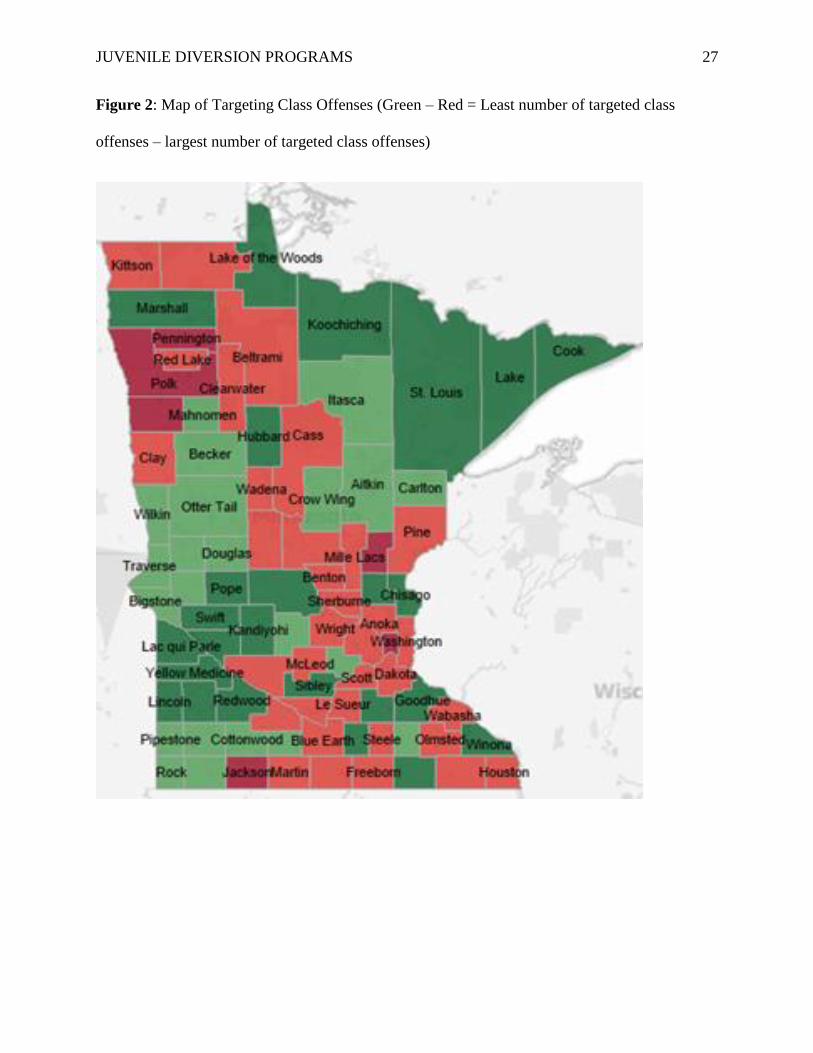
In the above pictured maps the first of which focuses on high-risk youth, the counties
which have a small number of high-risk youth are colored green, and the counties which are
colored red have a large number of high-risk youth. The focus on the second map is the
distinction between the targeting of class offenses. As with the first map, the counties which are
green are less likely to target class offenses and the counties which are red are the most likely to
target class offenses. Consistent with the hypothesis that counties which have a large number of
high-risk youth (the red counties in Figure 1), it can also be found that many of those same
counties are less likely to target few class offenses (the green counties in Figure 2). For example;
JUVENILE DIVERSION PROGRAMS 18
St. Louis, Koochiching, Lake of the Woods, Cottonwood, Cook, Mahnomen, Winonia, and
Becker County all show this pattern. There are still outliers for this pattern, such as Beltrami
County which both targets a large number of class offenses plus has a large number of high-risk
youth. Clearwater is another example of this pattern.
Drug Offenses and High-Risk Youth
To test the hypothesis that counties which have a large number of high-risk youth are
more likely to target drug offenses than counties which have a small number of high-risk youth,
a crosstab was ran which showed that there was not a significant correlation between high-risk
youth and the targeting of drug offenses. The Somers’d Value in this instance was also 0.036.
While there is no statistical significance there are some important things found in this table. Out
of the 21 counties that have been identified as having the most high-risk youth, twelve of those
counties target two drug offenses. The three other risk categories never reach a number higher
than eight in that same category. It should also be noted that between the “moderate” risk and
“high” risk categories there are 19 counties which target two or more drug offenses.
(Insert Table 3 Here)
While this finding is not statistically significant, there is a correlation between high-risk
youth and drug offenses. As with before maps were created to illustrate the interaction between
high-risk youth and drug offenses.
(Insert Figure 1 & 3 Here)
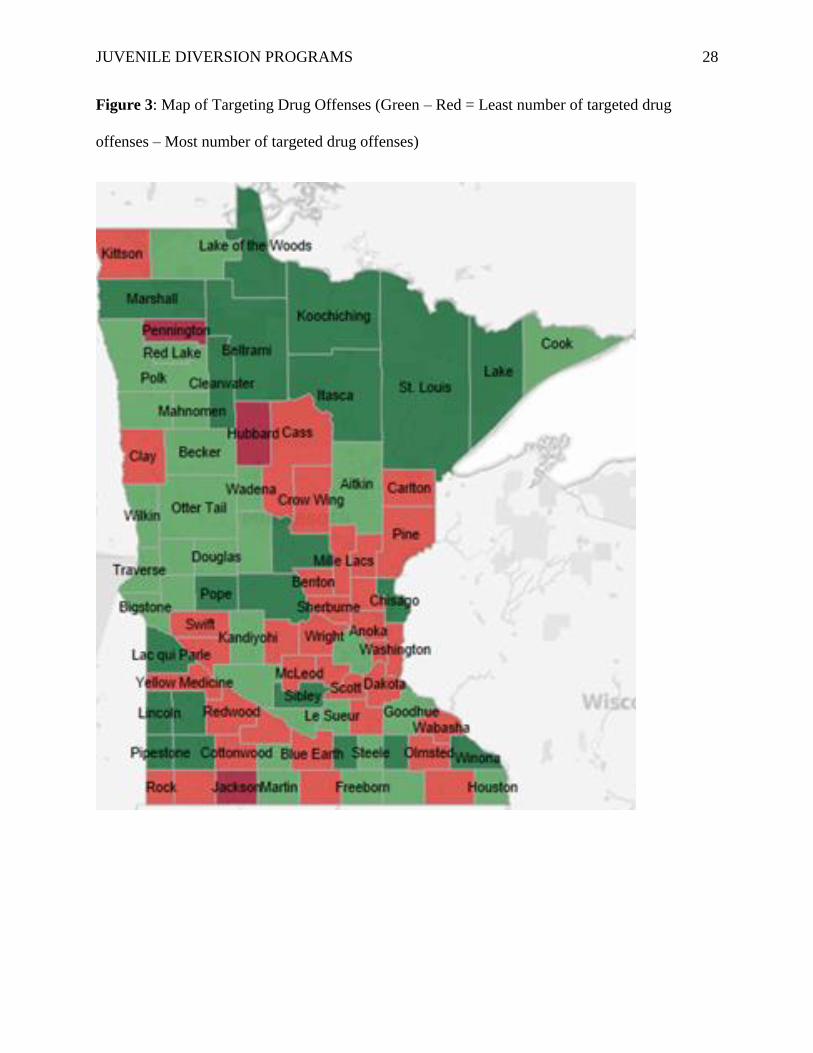
Figure 1, again, shows the number of high-risk youth per county ranging from green
(smallest number of high-risk youth) and red (largest number of high-risk youth). Figure 3

JUVENILE DIVERSION PROGRAMS 19
illustrates the targeting of drug offenses by county. The counties which target the least amount of
drug offenses are colored green and the counties which target the largest number of drug
offenses are colored red. When comparing the two figures, if it were consistent with the
hypothesis, that counties which have a large number of high-risk youth (red in Figure 1) would
also target the most drug offenses (red in Figure 3). Cass, Crow Wing, Wadena, Dakota, Scott,
Anoka, and Redwood County are all consistent with the hypothesis. Beltrami, Mahnomen, Swift,
St. Louis, and Cook County are all inconsistent with the hypothesis.
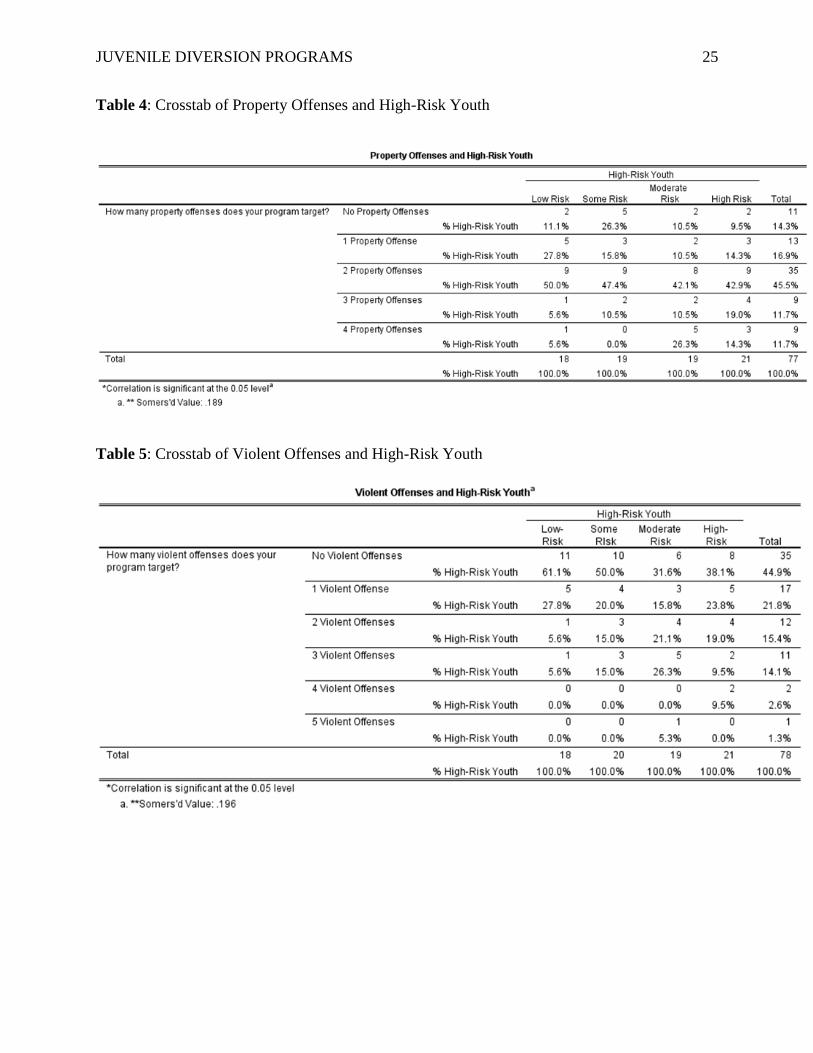
Property Offenses and High-Risk Youth
The third hypothesis, that counties with a large number of high-risk youth are more likely
to target property offenses than counties with a small number of high-risk youth, was tested with
a crosstab. This crosstab found a significant correlation between property offense and high-risk
youth. This correlation is significant at the 0.05 level with a Somers’d value of 0.189.
(Insert Table 4 Here)
This table shows a very prominent correlation between high-risk youth and property
offenses. When comparing the “low” and “some” risk categories to property offenses we find
that 89% of those counties fall within the first the property offense categories (No property
offenses, 1 property offense and 2 property offense) on the opposite end of the table it is shown
that in the “moderate” to “high” risk categories that counties which target more than 2 property
offenses make up 76% of those counties.
(Figure 1 & 4 Here)
JUVENILE DIVERSION PROGRAMS 20
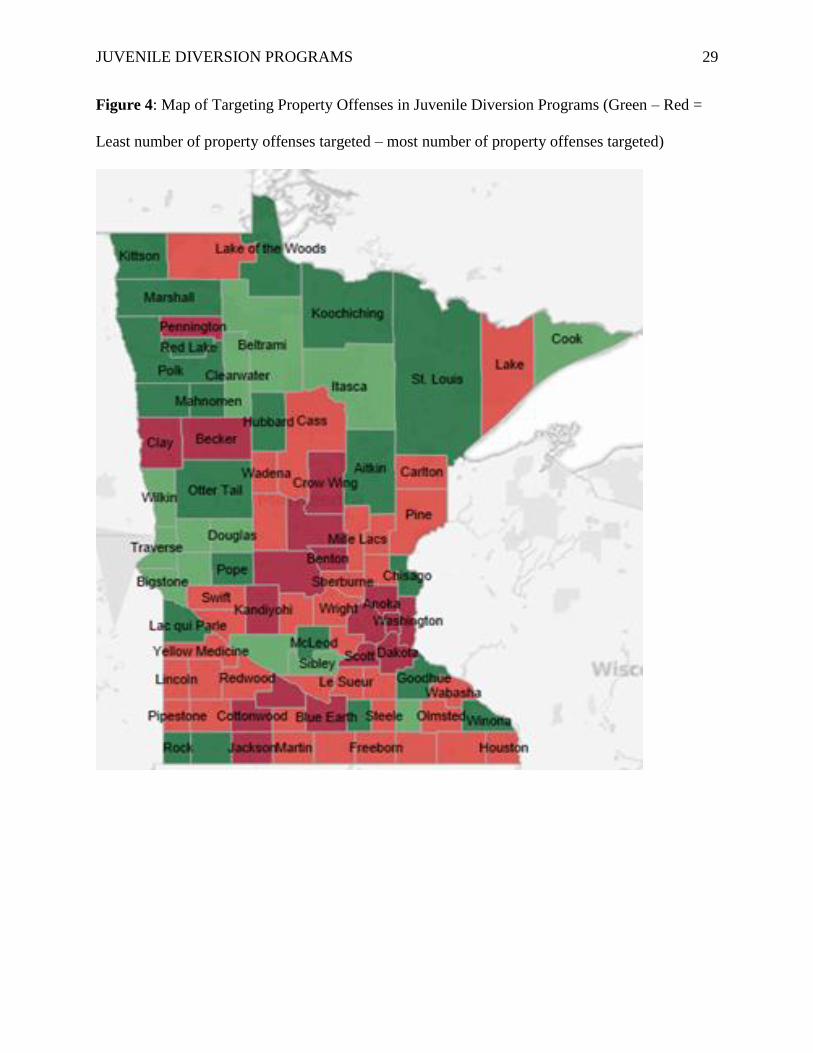
Figure 1, again, shows the number of high-risk youth per county ranging from green
(smallest number of high-risk youth) and red (largest number of high-risk youth). Figure 4 shows
the counties which target property offenses. Counties colored green target none to a few property
offenses and counties colored red target three to four property offenses. Clay, Becker, Cass,
Wadena, Crow Wing, Carlton, Pine, Washington, Anoka, Dakota, Wright, and Blue Earth
County are all consistent with the hypothesis that counties which have a large number of high-
risk youth will target more property offenses. Beltrami, Jackson, and Cook, Lake of the Woods
County are all inconsistent with the hypothesis in that they have a large number of high-risk
youth, but either do not target property offenses or do not target many. There are multiple
counties which target many property offenses but do not have a large number of high-risk youth,
such as Lincoln, Houston, and Lake County.
Violent Offenses and High Risk Youth
For the fourth, and final, hypothesis a crosstab between the targeting of violent offenses
and the percent of high-risk youth was created. This correlation was found to be statistically
significant at the 0.05 level with a Somers’d value of 0.196.
(Insert Table 5 Here)
This table shows that the counties which have youth that are at a “moderate” to “high”
risk target more violent offenses than counties with youth who are at a “low” to “some” risk. Not
many counties target violent offenses, in fact, 44% (35 counties) of counties do not target violent
offenses as part of their juvenile diversion program, however, of the counties that do target at
least one violent offense (43 counties) a little over half (26 counties) of those counties have a
“moderate” to “high” percent of youth who are high-risk. There are only 3 counties which target
JUVENILE DIVERSION PROGRAMS 21
four or more violent offenses, and all of those counties fall within the “moderate” to “high” risk
categories. Conversely, there are also 21 counties with “low” to “some” risk that do not target
any violent offenses as part of their diversion program.
(Figure 1 & 5 Here)
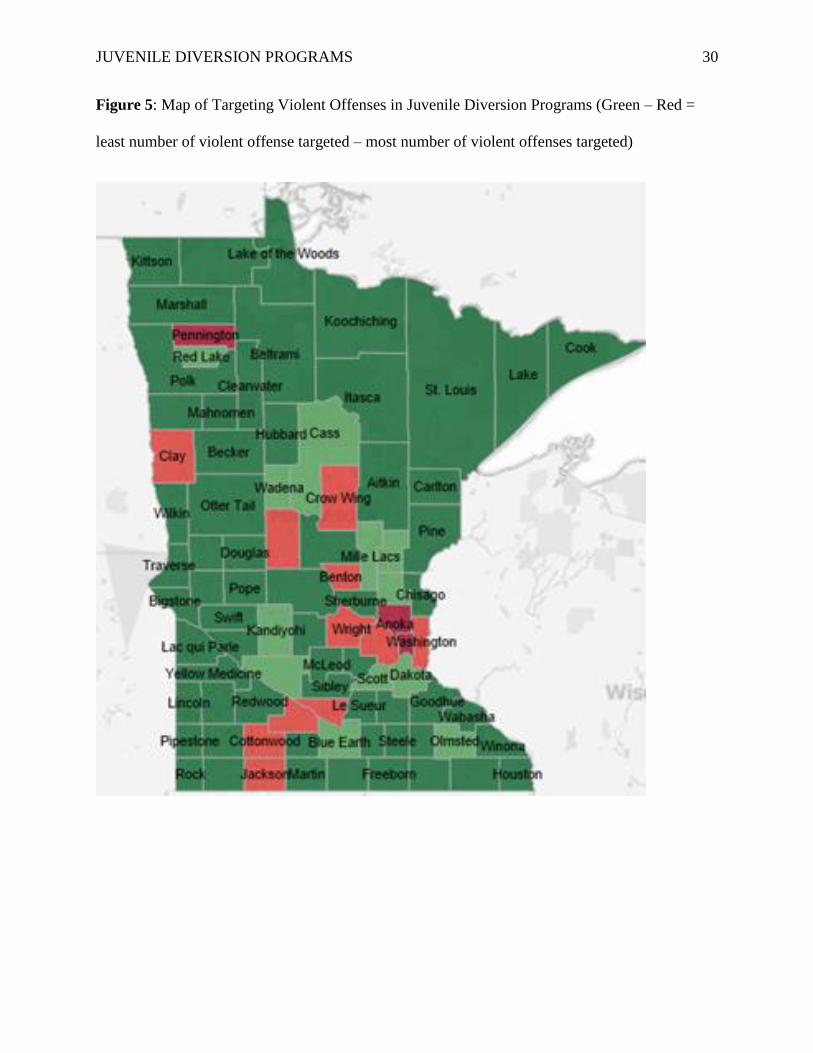
Figure 1 shows the number of high-risk youth per county ranging from green (smallest
number of high-risk youth) and red (largest number of high-risk youth). Figure 5 illustrates the
counties which target (or in this case more so do not target) violent offenses. Most counties do
not target violent offenses as part of their diversion program. However, as illustrated in the
figures above, the counties that do target multiple violent offenses are all counties with a large
number of high-risk youth. Washington, Anoka, Wright, Hennepin, Pennington, Clay, and Todd
County have a large percentage of high-risk youth as well as a juvenile diversion program which
targets violent crimes. Lake, Aitkin, Marshall, Kittson, Houston and Martin are just a few of the
many counties which have a low percentage of high-risk youth and do not target violent crimes.
JUVENILE DIVERSION PROGRAMS 22
Discussion
This analysis found that juvenile diversion programs first, that counties with a large
number of high-risk youth are not more likely to target class offenses than counties with a
smaller number of high-risk youth. Second, those counties with a large number of high risk
youth are more likely to target drug offenses than counties with a smaller number of high-risk
youth. Third, those counties with a large number of high-risk youth are more likely to target
property offenses than counties with a smaller number of high-risk youth. Finally, those counties
with a large number of high-risk youth would be more likely to target violent offenses than
counties with a small number of high-risk youth.
These findings are indicative of what literature suggests: counties with a high percentage
of high-risk youth should be focusing on those youth and gearing their program towards them.
By targeting more severe crimes such as violent crimes, property crimes or drug crimes, the
counties which have high-risk youth are creating a program that is geared towards the
population. While there are some counties, such as Beltrami County, which do not choose to
follow this practice, there are a number of counties which opt to do so.
There are a number of explanations why Beltrami or Mahnomen County, or other
counties like it, may differ from other counties who also have a large percentage of high-risk
youth; the most prominent one is that those counties look very different. Beltrami and Hennepin
County, while they may have a similar number of high-risk youth, have youth that are very
different. The needs of youth who live in these counties may vary, and that may cause one
program to look different than the other. There is no theory tested in this analysis that suggests
that targeting the crimes of high-risk youth is the right way to structure a diversion program. In
JUVENILE DIVERSION PROGRAMS 23
fact, until a uniform measure of success is found that extends across the state, there is no way of
knowing what programs are better than others, or how they rank.
What this analysis does however is lay the groundwork and the need for understanding
measures of success within juvenile diversion programs, whether it is through recidivism rates or
with another measure of success such as school attendance, or home life. As of now, each county
in Minnesota is permitted to define recidivism in their own way, which means that each county
can decide that someone committing a crime in six months is not recidivism, while another
county may decide that the only way to recommit a crime is to commit the same crime again
within a certain period of time. With this in mind, it is especially challenging to understand how
successful these programs are in comparison to each other.
JUVENILE DIVERSION PROGRAMS 24
Appendix A
Table 2: Crosstab of Class Offenses and High-Risk Youth
Table 3: Crosstab of Drug Offenses and High-Risk Youth
JUVENILE DIVERSION PROGRAMS 25
Table 4: Crosstab of Property Offenses and High-Risk Youth
Table 5: Crosstab of Violent Offenses and High-Risk Youth
JUVENILE DIVERSION PROGRAMS 26
Figure 1: Map of High-Risk Youth (Green – Red = High-Risk – Low-Risk)
JUVENILE DIVERSION PROGRAMS 27
Figure 2: Map of Targeting Class Offenses (Green – Red = Least number of targeted class
offenses – largest number of targeted class offenses)
JUVENILE DIVERSION PROGRAMS 28
Figure 3: Map of Targeting Drug Offenses (Green – Red = Least number of targeted drug
offenses – Most number of targeted drug offenses)
JUVENILE DIVERSION PROGRAMS 29
Figure 4: Map of Targeting Property Offenses in Juvenile Diversion Programs (Green – Red =
Least number of property offenses targeted – most number of property offenses targeted)
JUVENILE DIVERSION PROGRAMS 30
Figure 5: Map of Targeting Violent Offenses in Juvenile Diversion Programs (Green – Red =
least number of violent offense targeted – most number of violent offenses targeted)
JUVENILE DIVERSION PROGRAMS 31
Bibliography Abrams, L. S., Umbreit, M., & Gordon, A. (2003). Youthful Offenders Response to Victim Offender
Conferencing in Washington County, Minnesota. Center for Restorative Justice & Peacemaking,
1-10.
Andrews, D. A., & Bonta, J. (2010). The Psychology of Criminal Conduct. New Providence: Anderson.
Fischer, D. G., & Jeune, R. (1987). Juvenile Diversion: A Process Analysis. Canadian Psychology, 60-70.
Hoge, R. D., & Wilson, H. A. (2012). The Effect of Youth Diversion Programs on Recidivism: A Meta-
Analytic Review. Criminal Justice and Behavior, 497-518.
Juvenile Justice and Delinquency Prevention, 93-415 (United States Congress 1974).
Kreager, C. M. (2011). Minnesota Diversion Guidebook. Juvenile Justice Coalition, 1-14.
Lind, B., & Weatherburn, D. (1998). Poverty, Parenting, Peers and Crime-Prone Neighborhoods.
Australian Institute of Criminology, 1-6.
Lundman, R. J. (1976). Will Diversion Reduce Recidivism? Crime & Delinquency, 428-437.
Minnesota Statute, 388.24 (Minnesota Legislature July 1, 1995).
Schwalbe, C. S., Gearing, R. E., MacKenzie, M. J., Brewer, K. B., & Ibrahim, R. (2012). A Meta-Analysis of
Experimental Studies of Diversion Programs for Juvenile Offenders. Clinical Psychology Review,
26-33.
Swayze, D., & Buskovick, D. (2012). Minnesota Juvenile Diversion: A Summary of Statewide Practices and
Programming. St. Paul: Minnesota Department of Public Safety.
Swayze, D., & Buskovick, D. (2012). The Minnesota Youth Intervention Program. Minnesota Department
of Public Safety Office of Justice Programs, 1-55.
Thomas, W. I. (1928). The Child in America: Behavior Problems and Programs. In The Methodology of
Behavior Study (pp. 553-576). New York: Alfred A. Knopf.