just in time adoption and performance of major oil
TRANSCRIPT

JUST IN TIME ADOPTION AND PERFORMANCE OF MAJOR OIL
COMPANIES IN KENYA
BY
SEREM NICHOLUS MANESE
D61/75655/2012
A RESEARCH PROJECT PRESENTED IN PARTIAL FULFILLMENT OF THE
REQUIREMENT FOR THE AWARD OF THE DEGREE OF MASTER OF
BUSINESS ADMINISTRATION (MBA), SCHOOL OF BUSINESS, UNIVERSITY
OF NAIROBI.
NOVEMBER 2014

ii
DECLARATION
This project is my original work and has not been submitted for a degree award in any
other university.
Signature………………………………… Date…………………………………….
Serem Nicholus Manese
D61/75655/2012
This research project has been submitted for examination with my approval as the
University supervisor.
Signature ………………………………… Date…………………………………….
Kariuki C. Ngugi
Lecturer, Department of Management Science

iii
DEDICATION
This research is dedicated to my parents Richard and Esther, who made me be whom I
am today and who never got tired of talking to me on the value of education, sacrificed
our family comfort to invest in our education and endured a lot to make me whom I am
today.

iv
ACKNOWLEDGEMENT
I thank God for providing me with an opportunity, strength, health, knowledge and
favour to complete this research project. I am heartily thankful and appreciate my
supervisor without whose guidance and supervision, this project would not have been
accomplished. Lastly and not least, am also indebted to my MBA colleagues and friends
and all those who assisted me in one way or another throughout this period of study and
though I may not name each one of you individually, your contribution is recognized and
appreciated immensely. I owe you my gratitude and to you all, God bless you.

v
TABLE OF CONTENTS
DECLARATION............................................................................................................... ii
DEDICATION.................................................................................................................. iii
ACKNOWLEDGEMENT ............................................................................................... iv
TABLE OF CONTENTS ................................................................................................. v
LIST OF TABLES .......................................................................................................... vii
LIST OF FIGURES ....................................................................................................... viii
ACRONYMS .................................................................................................................... ix
ABSTRACT ....................................................................................................................... x
CHAPTER ONE: INTRODUCTION ............................................................................. 1
1.1 Background of the Study .............................................................................................. 1
1.2 Statement of the problem .............................................................................................. 7
1.3 Objectives of the Study ................................................................................................. 9
1.4 Importance of the study ................................................................................................ 9
CHAPTER TWO: LITERATURE REVIEW .............................................................. 10
2.1 Introduction ................................................................................................................. 10
2.2 Theoretical Review of JIT .......................................................................................... 10
2.3 Just In Time Techniques ............................................................................................. 11
2.4 Just In Time and Performance .................................................................................... 15
2.5 Just in Time and Performance in Oil Companies ....................................................... 16
2.6 Summary and Conceptual Framework........................................................................ 18
CHAPTER THREE: RESEARCH METHODOLOGY ............................................. 21
3.1 Introduction ................................................................................................................. 21
3.2 Research Design.......................................................................................................... 21
3.3 Target Population ........................................................................................................ 21
3.4 Sampling ..................................................................................................................... 21
3.5 Data Collection ........................................................................................................... 22
3.6 Data Analysis .............................................................................................................. 22
CHAPTER FOUR: DATA ANALYSIS AND FINDINGS.......................................... 24
4.1 Introduction ................................................................................................................. 24
4.2 General Information .................................................................................................... 24

vi
4.3 Extent of Just in Time (JIT) Techniques Application Adoption by Major Oil
Companies in Kenya. .................................................................................................. 27
4.4 Determinants of Just in Time (JIT) Adoption by Major Oil Companies in Kenya. ... 33
4.5 Effect of Just in Time (JIT) Adoption on Performance of Major Oil Companies in
Kenya... ....................................................................................................................... 37
4.6 Discussion of Findings ................................................................................................ 41
CHAPTER FIVE: CONCLUSIONS AND RECOMMENDATIONS ...................... 43
5.1 Introduction ................................................................................................................. 43
5.2 Conclusion .................................................................................................................. 43
5.3 Recommendations ....................................................................................................... 44
5.4 Limitations of the Study.............................................................................................. 45
5.5 Suggestions for Further Studies .................................................................................. 45
REFERENCES ................................................................................................................ 47
APPENDICES ................................................................................................................. 50
Appendix I: Letter To The Respondents ........................................................................... 50
Appendix Ii: Research Questionnaire ............................................................................... 51
Appendix Iii: List of Oil Companies in Kenya ................................................................. 57

vii
LIST OF TABLES
Table 4.1: Respondents Designation in the Company ...................................................... 24
Table 4.2: Number of Branches of Respondents Company in Kenya ............................. 26
Table 4.3: Period of Time Respondents Firm has been in Operation in Kenya ............... 26
Table 4.4: Implementation of JIT by Respondents Company .......................................... 28
Table 4.5: Reasons against Implementation of JIT by Respondents Company ................ 28
Table 4.6: Aspects of JIT Practiced in the Respondents Organization ............................. 30
Table 4.7: Rotated Component Matrix for Aspects of JIT ............................................... 32
Table 4.8: Factors Influencing JIT in Respondents Organization .................................... 34
Table 4.9: Rotated Component Matrix for factors influencing JIT .................................. 36
Table 4.10: Extent To Which Respondents Organization Experienced ........................... 38
Table 4.11: Rotated Component Matrix for Performance of JIT...................................... 40

viii
LIST OF FIGURES
Figure 2.1: Determinants of JIT Techniques Application and Performance .................... 20
Figure 4.2: Ownership Status of the Respondents Company ........................................... 25
Figure 4.3: Respondents Prior Knowledge of JIT Production System ............................. 27
Figure 4.4: JIT Efforts in Respondents Company ............................................................ 29
Figure 4.5: Extent to Which Top Management Provide Expertise in JIT Implementation
........................................................................................................................................... 33

ix
ACRONYMS
EBQ Economic Batch quantity.
EDI Electronic Data Interchange.
FMS Flexible Manufacturing System.
GT Group Technology.
JIT Just-in-Time.
JITP Just-in-Time Purchasing.
TPM Total Productive Maintenance.
TQM Total Quality Management.
WIP Work-in-Progress.

x
ABSTRACT
The recent decades’ global economic trends and the oil industry have turned out to be
inseparable and they have a great impact on each other. The oil market is also
exceedingly volatile because of various unpredictable factors. The purpose of this study
was to assess Just in Time adoption and performance of major oil Companies in Kenya.
The research design employed in this study was a descriptive survey research design with
an illustration of a case study. The target populations for this study were the 15 major oil
firms in Kenya, which are; Vivo Ltd (Shell), Total Kenya Ltd, Kenol/Kobil (Kenya Oil
Ltd), Oil Libya Kenya Ltd, National Oil Corporation of Kenya (NOCK), GAPCO, Hashi,
Gulf, Hass, Galana, Bakri, Engen, Oilcom, Rivapet and Fossil due to their market share
and depot capacity. The respondents were selected from operations, customer service and
procurement departments making a total sample of 45 respondents. Census sampling was
used hence the entire target population of 15 major oil companies was studied. The study
collected primary data which was analyzed by the use of descriptive statistics using SPSS
(Statistical Package for Social Sciences) and presented through percentages, means and
frequencies.
The study concluded that the aspects of JIT practiced in the organization were;
Continuous improvement, Set-up time reduction, Smoothed line production, JIT
purchasing, Work team quality control and Flexible workforce. The study further
concluded that the greatest performance indicators the respondents’ organization
experienced as a result of implementation of Just in Time (JIT) techniques were; the
organization currently has audited financial reports and it enjoys a good reputation with
other partners. The study recommended that the companies should work to achieve the
following specific requirements; Stabilize and level the master production system with
uniform plant loading; Reduce or eliminate set-up times; Reduce lot sizes and lead times;
Use total productive maintenance to reduce machine breakdowns; Train the work force to
multi-skill; Develop few nearby suppliers, this may be difficult for the oil marketers
during the first time but in the long run it can be achieved, and Use small-lot (single unit)
conveyance using kanban card like system.

1
CHAPTER ONE: INTRODUCTION
1.1 Background of the Study
In today’s competitive global business environment, the goal of all manufacturing
systems is long-term survival. A company’s survival in an increasingly competitive
market closely depends upon its ability to produce highest quality product at lowest
possible cost and in a timely manner with shortest possible lead time. In addition, these
goals should be achieved by paying utmost respect to the humanity of the employees who
make the system work. Sometime, the difficulty of achieving the goals lies in the
complexity of operations. It is not difficult to build the high quality product, but is
extremely difficult to do so while maintaining excellent quality, and at some time
respecting the humanity of people who do the actual work of building that product
(Bowman, 1998).
A Just-in-Time (JIT) approach, which is suggested here, is capable of achieving all above
stated goals. Just-in-Time (JIT) Based Quality Management is both philosophy and
guiding set of principles that integrates the basic management techniques, existing
improvement efforts, and technical tools. This approach stresses on long-term benefits
resulting from waste elimination, and continuous improvements to systems, programs,
products, and people (Cammarano, 1996). It has significant impact on quality control,
purchasing functions, and work culture with a philosophy that encompasses cost, meeting
delivery schedules, employee’s empowerment and skill development, supplier relations
and development of new products.
Conceptually, this approach combines apparently conflicting objectives of low cost, high
quality, manufacturing flexibility, and delivery dependability. Its effects are significant in
improving the overall performance of the whole organization. However, there is no
standard to implement JIT other than continuous progress towards the ultimate objective
of delivery as wanted, with a smoothly synchronized continuous flow keyed to final
demand, with perfect quality of incoming goods. Even with this problem, it provides a
wide range of benefits (Bowman, 1998; Clode, 1993; White et al., 1999). The adoption of

2
JIT based approach may be helpful for oil companies, which are still struggling with
problems of unreliable and long lead-time, inferior quality, low productivity, high rate of
scrap and defects, shortage of raw-material, and under utilization of workers and
equipments.
1.1.1 Just in Time Technique
JIT is a Japanese-developed manufacturing philosophy that represents “an aesthetic ideal,
a natural state of simplicity” in production efficiency (Zipkin, 1991). Although precisely
defining JIT continues to be perplexing (White and Ruch, 1990), JIT production is
generally referred to as a manufacturing system for achieving excellence through
continuous improvements in productivity and elimination of waste (Crawford and Cox,
1990; Suzaki, 1987). A more specific definition is provided by Calvasina et al. (1989):
“JIT is a system of production control that seeks to minimize raw materials and Work in
Progress (WIP) inventories; control (eliminate) defects; stabilize production;
continuously simplify the production process; and create a flexible, multi-skilled
workforce.”
According to Schonberger (1987), JIT is the “most important productivity enhancing
management innovation since the turn of the century.” Gleckmanet al. (1994) stated that
“JIT has come of age,” and is recognized as a legitimate management philosophy. “The
concept of JIT has completed its evolution from a manufacturing technique to a much
broader philosophy of improvement” (Vokurka and Davis, 1996) that can help the US
manufacturers regain and maintain a competitive advantage in the global market (Yasin
et al., 1997). JIT looks beyond the short run to the long-term optimization of the entire
production/distribution network (Jones, 1991). Successful JIT implementation should
accomplish two major objectives: improve quality and control the timeliness of the
production and delivery of products (Davy et al., 1992; Monden, 1981; Walleigh, 1986).
By concentrating on quality, companies should experience less scrap and rework and
more effective communication among departments and employees. In addition, long-term
commitments with fewer suppliers should result in fewer inspections. The achievement of
these results requires an even production flow of small lot size, schedule stability,

3
product quality, short setup times, preventive maintenance, and efficient process layout
(Chapman and Carter, 1990; Foster and Horngren, 1987; Hall and Jackson, 1992).
1.1.2 Performance
Performance refers to how well an organization achieves its market-oriented goals as well
as its financial goals. Different frameworks and reference models for measuring business
performance have evolved from a variety of origins. Frameworks are approaches to
measurement that businesses frequently adopted, often with significant diversity in their
design and use. Reference models are more rigorous standards, typically around specific
performance metrics and associated business processes, adopted by an industry or by a
common functional unit. They include; Balanced Scorecard, Economic Value Added,
Activity-based costing, Quality Management, Customer Value Analysis and Action-
Profit Linkage Model.
A central tenant for all of these programs is business performance measurement. Quality
programs, while grounded in product quality improvement and applied to many other
business processes (Wruck & Jensen, 1998), are continuous improvement frameworks
that might not be best suited to help manage discontinuities in business strategies (Kaplan
& Lamotte, 2001). A number of prior studies have measured organizational performance
using both financial and market criteria, including return on investment (ROI), market
share, profit margin on sales, the growth of ROI, the growth of sales, the growth of
market share, and overall competitive position.
Performance measurement and reporting is now widespread across the private sector as
well as public sector of many industrialized and industrializing countries (Williams,
2003). The common tool that is used for this process, key performance indicators (KPIs),
have been argued to provide intelligence in the form of useful information about a public
and private agency’s performance (Williams, 2003). Scholars like Modell (2004),
Moynihan (2005), Vakkuri and Meklin (2006) have maintained that the implementation
of performance measurement systems possess important symbolic value.

4
1.1.3 Just in Time and Performance
JIT is an integrated, problem-solving management approach aimed at improving quality
and facilitating timeliness in supply, production and distribution (Davy et al.1992).
Toyota believed that the only way for JIT to be successful is to have every individual
within the organization involved and committed to it, if the resources and processes are
fully utilized for maximum output and efficiency, and if the product and service offerings
are delivered to satisfy market requirements without delay. Even three decades later in
the twenty-first century, many firms are still struggling with the JIT management
approach. JIT has gained considerable interest because it allows a firm to deliver high
quality products/services with reduced waste and increased productivity (Davy et al.
1992).
The implementation of the JIT management approach requires a body of knowledge,
encompassing a comprehensive set of management principles and toolkits. Generally, it
is accepted that the implementation of JIT can lead to improved firm performance. For
example, in a study on the financial impact of JIT adoption, Kinney and Wempe (2002)
found that JIT adopters outperform non-adopters in asset turnover and profit margins.
The reason behind this is that the ability of the adopters of JIT to turn their asset is
increased with improved product quality, greater responsiveness to customer demand
because of shorter lead times and greater product line variety. These performance
dimensions are underpinned by the philosophical elements of the JIT management
approach on waste reduction and system flexibility for the performance of business
processes (Tierney, 2004).
Kinney and Wempe (2002) suggested further that firms practicing JIT are associated with
increased profit margins as the waste reduction emphasis of JIT helps reveal activities
that add no value. Generally, these activities and their related costs are either hidden by
excessive buffer inventories, or are ignored because holding buffer inventories is a
convenient solution to such problems as failure of production lines or other systems. With
the implementation of JIT, excessive inventories are no longer allowed to mitigate these
problems and the adopters of JIT are more inclined to develop cost-saving solutions,

5
thereby increasing profit margins. Another study also found a positive relationship
between the level of JIT implementation in US manufacturing firms and their
performance improvements (Fullerton and McWatters 2002).
1.1.4 Major Oil Companies in Kenya
Petroleum fuels constitute the main source of commercial energy in Kenya. Kenya is a
net importer of petroleum products and has a refinery owned and managed by the Kenya
Petroleum Refineries Ltd (KPRL). An 800 km cross country oil pipeline from Mombasa
to Nairobi and Western Kenya with terminals in Nairobi, Nakuru, Eldoret and Kisumu,
run by the Kenya Pipeline Company (KPC). The sector also boasts of over 30 oil
importing and marketing companies, comprising of major and minor ones classified on
basis of depot size and capacity and market share.
There are over 15 major Oil marketers in Kenya and their market share based on the
volumes of fuel pushed within a given period. In the month of March, 2011, Total Kenya
was the leader at 23.4% followed by Kenol Kobil at 22.8%, Shell at 17.9%, Libyaoil at
11.8%, Nock at 5.2%, Gapco at 4.4%, Hass at 1.8%, Gulf at 1.8%, Hashi at 1.8%, Galana
at 1.4%, Bakri at 1.4%, Engen at 0.8%, Oilcom at 0.7%, Rivapet at 0.6% and Fossil at
0.5% of the total Kenyan market share. For one to remain on top in the list, then they
must ensure they push large volumes of fuel which is dependent on the availability of the
equipment at the retail outlets. The volume of fuel sold is used as the measure of gauging
how particular Marketer is positioned in the market. Large volumes reveal higher
margins since the prices are controlled and all Marketers almost sell at similar prices.
1.1.5 Just in Time and Performance in Oil Companies
There is no doubt of the significant effect of the oil industry in today’s world economy
and in our daily lives (Mast, 2005). Due to globalization, the role of world trade and
transportation has increased. The oil is the number one energy source for many
industries, especially for those which are based on motor driven machines
for instance transportation companies, modern production and agriculture since oil meets
their basic requirements such as portability, energy density, safety and ease of

6
handling whereas other sources do not (Mast, 2005). Accordingly, along with the
increase of globalization, the world trend for oil consumption shows a constant increasing
tendency (Tierney, 2004; Nation Master, 2009; CIA, 2010; Hilmola, 2011).
The US is reckoned to be the biggest consumer and China has become the second one
(Hussain, Assavapokee & Khumawala, 2006; Nation Master, CIA, 2010). Moreover,
Hölschler, Bachan and Stimpson (2008) state that China’s robust economy and other fast
developing countries’ growth will continue the increasing trend in oil consumption in the
near future. For the engine of these growth rates a stable energy supply is indispensable.
But there are other facts too that strengthen the petroleum corporations’ further
significance. For instance Hilmola (2011) asserts that China is not just the second largest
consumer of oil in the world but its oil reserves are decreasing thus China is forced to
keep moving its economic growth.
The biggest producers and exporters in the industry are from the Middle East territory,
especially Saudi Arabia and Russia (CIA, 2010). Due to the economic importance of the
oil, oil companies are among the most profitable companies. Other alternative energy
sources such as renewable wind, water and solar energy are still not equal competitors’ of
oil. Although oil reserves are limited, they will be available and exploitable for several
decades; therefore, their importance can remain and will provide the base for the global
economy in the near future (Hussain et al., 2006).
The high level of demand growth, the eased trade barriers and the technological growth
in the oil industry has developed a strong competition among the oil corporations
(Jenkins & Wright, 1998; Anderson, 2003; Himola, 2011). Therefore, oil companies,
just like companies in every industry, endeavour to achieve competitive advantage over
their competitors in order to be successful in the long-term. This competitive advantage
derives from the capabilities of the businesses which make them able to provide a
superior product or service among the competitors in a certain market (Johnson, Scholes
& Whittington, 2009).
7
In the last few decades just in time techniques have been recognized as a vital capability
of the businesses to achieve competitive advantages. Christopher (2011) argues that the
company with better logistics and supply chain management can improve and sustain
their competitive advantage over the rival companies. Competitive advantages of the
companies are very closely related either to their cost or their value advantages, or in the
most optimal case both exist at the same time. Therefore, just in time techniques
have the ultimate goal to satisfy the customers preferably on the most cost effective
level through the supplier-buyer integration and cooperation (Christopher, 2011).
1.2 Statement of the problem
The recent decades’ global economic trends and the oil industry have turned out to be
inseparable and they have a great impact on each other. The supply of oil and gas has
become a necessity for the national economies and shows a growing demand tendency
(Hilmola, 2011; Tierney, 2004; CIA, 2010).With globalization the trade barriers have
also been eased for smoother trade and technology development has clearly intensified
(Jenkins & Wright, 1998). Hall (2002) notes that faster delivery, reliability and lower cost
have also appeared as a need from the customers’ point of view. Supply chain
management plays an indispensable role. In a competitive market the companies aim to
be more effective, more efficient and more profitable than their competitors. Hussain et
al. (2006) supports the importance of supply chain management within the industry as the
oil companies of today believe that the competition occurs on their supply chain level
rather than within individual companies.
The oil market is also exceedingly volatile because of various unpredictable factors. One
of the main factors as, Anderson (2003) explains, is the frequent price fluctuation and the
frequent political changes. Obviously these factors keep causing changes in the demand
and supply which has an impact on the whole supply chain and its management. Ribas et
al. (2011) add that volatility can be the result of unforeseen events as well, such as a
natural disaster or broken down equipment. The result is tremendous uncertainty
surrounding the industry which makes the supply chain manager’s job and just in time
techniques optimization more challenging. The high level of uncertainties actually is one

8
of the main reasons for the oil industry adopting a unique supply chain management
approach (Ribas et al., 2011).
Studies have found that the implementation of JIT by the firms has been in a relatively
slow and ad hoc manner, despite growing awareness of its purported benefits (Clode,
1993; Gilbert, 1990; Goyal and Deshmukh, 1992). One reason for a firm’s reluctance to
adopt JIT is its resistance to change (Golhar and Deshpande, 1993; King, 1988). The
implementation lag has been attributed to a number of other factors, including a lack of
understanding of JIT methods, an incompatible workforce and workplace environment,
non-supportive suppliers (Majchrzak, 1988; Snell and Dean, 1992; Wafa and Yasin,
1998), and an inadequate performance measurement and incentive system (Fullerton and
McWatters,1999a). Evidence also exists that JIT may not be appropriate and has not been
successful for all firms (Golhar and Deshpande, 1993; Inman and Brandon, 1992;
Milligan, 1999). A categorization has been made (Jarrar, Maria and Dongilli, 2006),
which places all these factors in the following categories; Top management commitment,
Training and change management, Security Systems and IT infrastructure, and business
process re-engineering.
Locally, Elyas and Richu (2012) did a study on the influence of Enterprise Resource
Planning (ERP) on cycle time of supply of oil products in Oil Industry in Kenya. The
study findings showed that Enterprise resource planning; Enterprise resource decision
support and Information flow have a positive significant effect on supply chain
performance. No study known to the researcher has been done to establish the extent to
which the various factors affect the implementation of JIT system in major oil companies.
Based on this review, this study sought to fill this research gap by answering the
following research questions: what is the extent of Just in Time (JIT) techniques
application in major oil companies in Kenya? what are the determinants of Just in Time
(JIT) techniques application in major oil companies in Kenya? and what is the effect of
Just in Time (JIT) techniques on performance of major oil companies in Kenya?
9
1.3 Objectives of the Study
i. To establish the extent of Just in Time (JIT) adoption by major oil companies in
Kenya.
ii. To establish the determinants of Just in Time (JIT) adoption by major oil
companies in Kenya.
iii. To determine the effect of Just in Time (JIT) adoption on performance by major
oil companies in Kenya.
1.4 Importance of the study
The findings of this study will be useful to the management of oil marketers in Kenya. It
is expected to provide useful information that will help the management in application of
Just in Time (JIT) techniques and strategies towards addressing the challenges that face
its implementation.
This study will also be of assistance to the employees of these oil firms because it will be
used as a reference during the implementation of other projects in the organization. Thus,
helping the organization in increasingly competitive market based on the ability to
produce highest quality product at lowest possible cost and in a timely manner with
shortest possible lead time.
This study will also be useful to future researchers who might be interested to research
further on application of Just in Time (JIT) techniques to all oil marketers in Kenya.
Since oil industry involves a complex of processes, JIT application to many subsystems
as engineering design, setup time and lot size reduction, will enhance performance.

10
CHAPTER TWO: LITERATURE REVIEW
2.1 Introduction
This chapter covers contributions from other scholars on JIT. The specific areas covered
here are theoretical review, JIT techniques and JIT implementation factors as well as the
conceptual framework.
2.2 Theoretical Review of JIT
According to Theory of JIT production, JIT Based Quality management is combination
of inventory control, quality control and production management functions that makes
sincere efforts for quality improvement by two ways. First, it concentrates on
philosophical aspect of quality improvement by making the quality everyone’s
responsibility, and then focused on effective implementation of quality control techniques
(Kumar et al, 2001).
It recognized that most valuable resources of an organization are its workers, and workers
work best when they are motivated, valued, encouraged to contribute, and allowed to
make their own decisions. Under this approach, Workers inspect the product quality after
each successive operation. They are trained along with managers in preparation and
interpretation of process control charts. Managers motivate the workers to think quality
first and production rate second. The workers have authority to halt the production line or
cell, if quality problems are uncovered. Thus, this concept not only gives the quality
responsibility to workers but also match that responsibility with authority to share the
quality control functions so that quality problems can be uncovered and solved quickly
(Ebrahimpour and Schonberger, 1984).
Garg (1997) observes that, JIT production system demands to buy parts in small lots.
Small lots require less space and time. Less space and time require less peoples and
facilities to complete the same job. Besides, small lots easy to inspect, and defects can be
immediately detected. Thus, the parts that are purchased steadily in small lot sizes with
frequent deliveries contribute to higher quality and productivity through lower levels of
inventory and scrap, lower inspection costs for incoming parts, and early detection of

11
defects. In short, JIT based approaches have potential to improve the product quality and
productivity to significant level but organizations must adopt its principles in way that
meet their own organizational structure, design and processes.
2.3 Just In Time Techniques
In order to implement JIT practically and eliminate the various types of waste, the
practical aspects of JIT have been sub-divided into techniques. Even though JIT is not
merely a set of techniques, certain techniques typify JIT production; these techniques are
referred to as JIT techniques. It is important to note that many of these so-called JIT
techniques are not unique to JIT. Such techniques are identified in production systems
where JIT has never been implemented; one such example being process flow charts.
Numerous JIT techniques have been studied and grouped. Those techniques that are
presented by both Harrison (1992) and Bichero (1991) are considered in this study, and
are summarized briefly as follows:
Total quality management is defined by Chase and Acquilano (1992) as managing the
entire organization so that it excels in all dimensions of products and services that are
important to the customer. Quality extends throughout the entire firm and is defined by
the customer. The implementation of TQ is a long term process that generally results
from proper implementation of other JIT techniques. Majima (1992) states that JIT puts
people first. JIT maximizes the physical and mental capabilities of an individual.
Management Commitment is essentially a long term technique aimed at preparing a
manufacturing firm for the implementation of JIT; it includes managers and
manufacturing staff.
Effective Project Management for JIT incorporates the principles of zero waste and zero
defects with specific reference to the production system and each manufacturing process.
According to Harrison (1992) design and development processes are far greater drivers of
product costs and quality than manufacturing. Harrison refers to studies conducted on
2,000 components at Rolls-Royce (1986) where it was shown that 80% of total costs
were determined by design. The aim of focusing is to initially produce only these items
12
while focusing on them. A Pareto analysis (Freund, Johnson & Johnson, 1990) is done on
the product range to identify the items that are produced most frequently; the portion of
the total income delivered by each product is examined. The total number of different
products produced is reduced in order to eliminate waste in an effective manner.
When applied to production systems, JIT requires the parts to move through the system
instantaneously. In working towards this goal the travel length of parts moving through
the production system is minimized. Schniederjans (1993) states that cycle time
requirements to meet customer demand are the driving force behind formation of
production lines. In order to optimize the machine layout of the processes in the JIT
production system, small machines are used. Large machines are replaced by a set of
smaller more flexible machines. This basic principle of using smaller machines
encourages the formation of flexible manufacturing cells and prevents the "big boat, big
guns" approach that Toyota considers a major limitation in many western manufacturing
firms (Majima, 1992).
TPM is referred to as Total Productive Maintenance by some (Harisson, 1992) and Total
Preventive Maintenance by others. Unexpected machine downtime needs to be low for
the proper implementation of various JIT techniques. By applying effective TPM on all
equipment this is accomplished. Crawford et al (1988) state that TPM is an important
technique that needs attention in the early stages of the JIT implementation process. Set-
up time, the phrase is changing overtime. In order for small batch sizes to be
economically feasible, it is essential that set-up times have an insignificant effect on the
total time required to manufacture the product. Numerous studies have shown the radical
set-up reductions obtained in manufacturing firms (Crawford et al, 1988; Harisson, 1992;
Majima, 1992). The reduction of set-up is considered by some to be of first importance
when implementing JIT.
The key to successful JIT implementation is to get people involved through training. This
can be done by means of awareness revolution signboards, as Hirano (1988) suggests. He
even states that no change will take place if such awareness campaigns are not in place.
People involvement focuses on awareness: manufacturing staff need to be aware of order

13
quantities, outstanding orders and customer requirements and need to give inputs to the
management of the production system in order to improve it continually. The
manufacturing worker should develop into a problem identifier and -solver aiming at
plant improvement. Two specific flow scheduling methods described in detail by
Schniederjans (1993) are mixed model scheduling and kanban pull systems. The mixed
model recommendation seeks a uniform daily production schedule where there is little or
no variation in production quantities of each item type between days. A pull system
operates only in environments where known customer orders drive the production effort.
The production schedule is pulled by the demand.
Inventory reduction technique aims at reducing the value of non-value-adding capital.
Inventory is WIP, and needs to be minimized. This is only possible when implemented in
conjunction with other techniques such as people involvement, layout and flow, set-up
reduction and standard containers. When the above are lacking large quantities of WIP
are required at each process to make up for operator absence, machine breakdowns and
scheduling and flow problems. Bowman (1991) states that inventory is the cholesterol of
manufacturing. The mistake is often made to equate JIT and inventory reduction.
Implementing JIT will reduce the inventory as shown for example at Cummins Engine by
Venkatesan (1990). JIT is however much more than an inventory reduction system.
MRP is referred to as Manufacturing Resource Planning by some (Schniederjans, 1993)
and Material Requirements Planning by others (Harisson, 1992); both refer to the same
system. When an MRP-system is in use for flow scheduling the parts are essentially
pushed through the production system. This can be combined with JIT in an effective
manner as described by Bowman (1991); Harisson (1992) and Schniederjans, (1993). In
theory, with a batch size of one and a balanced system, it is impossible to tell whether a
part is pushed or pulled through the production system. Some examples of successful
JIT/MRP combinations and resulting improvements are given by Bowman (1991). The
use of standard containers is an effective way to aid the flow of parts through a
production system (Hirano, 1988). The container size should match the batch size. The
technique is based on the use of specific containers, containing a pre-determined number

14
of parts, throughout the production system. Ideally these containers should be small to
aim at the ideal JIT batch size of one item.
Process charts have existed for many years and are included as a JIT technique; however,
the use of these charts did not originate from JIT. Gilbreth's process chart proposed in
1921 had 40 symbols for activities. Modern process charts may be of several kinds,
although all the standard types are constructed by using only five symbols. The ASME
symbols derived from those originally used by Gilbreth are recommended in BS 3138,
1979, and discussed by Pilcher (1992). Process charts combine these symbols to represent
the sequence of individual activities or events in the system under study. The total
operation as well as the boundary conditions for the study should be clearly defined
before a process chart can be constructed. Process charts are extremely useful when
repetitive processes are studied. Production systems are good examples of systems where
repetitive processes abound. Different types of process charts can be drawn at varying
levels of detail, depending on the scope of the process.
In bottleneck-areas where specific problems exist in the production system the limiting
processes, that lie on the critical path, can be analyzed and optimized. This will have an
immediate effect on the productivity of the entire production system. Pilcher (1992)
observes that a typical JIT system would require such a study to be conducted continually
on each process in the production system, since JIT requires continual improvement.
According to Harisson (1988) all processes in the production system can be made to be
fool-proof. This takes time and is aided by input from the relevant machine operators.
The idea is to improve the process to such an extent that the action cannot be performed
incorrectly. With this in place in all processes the aim of total quality is within reach.
According to Harisson (1988) the equipment requirements of the typical JIT production
system should be able to meet the entire peak demand. Thus, ideally, the equipment in a
JIT layout is not operated at full capacity for a significant amount of the time. Integral to
this method of operation, one operator can be shared between various machines in a cell,
which is typically U-shaped, and production on each machine is thus scheduled below its

15
maximum capacity. This is one of the key techniques in the complete implementation of
JIT in a manufacturing firm. The scheduling system should extend beyond the production
line to the supplier and to the customer as discussed by Harrison (1988). The customer
drives the production system by determining the inputs, since products are only produced
as demand from the customer arises. Trust between buyer and supplier is essential in such
an environment.
2.4 Just In Time and Performance
The JIT system is based on a philosophy of eliminating waste and utilizing the full
capability of each worker to gain maximum benefit traditionally, purchasing departments
have been given the task of negotiating for the lowest prices possible in an effort to
reduce costs and increase company profits. These conventional relationships with
suppliers were adversarial. Today’s competitive marketplace calls for an updated strategy
for the function. JIT (Just-in-Time) is one such approach to become a world-class
competitor for world-class manufacturing. During the last two decades, the purchasing
environment has become one of the most crucial elements in establishing the value added
contents for the products and services and hence has become the vital organization in the
dynamic international market (Kinney and Wempe, 2002).
Shortages of raw material, shorter lead time, high quality, increasing the variety of
products with smaller runs, inflation, productivity and introduction of a JIT purchasing
system etc. has prompted the realization of the importance of purchasing. The traditional
approach to purchasing is at the root of many of the problems, business faces today. High
inventory levels, soaring costs, adverse relationships with suppliers and quality issues
which either stop production or results in poor products are just a few of the problems
with the current way of purchasing. JIT purchasing functions often conflict with
traditional practices of purchasing, which is characterized by competitive buyer-supplier
relations with minimum communication and infrequent deliveries. The buyer carries
large inventory to compensate for long lead-times and poor quality of incoming parts. In
contrast a fundamental element of JIT purchasing is cooperative and long- term buyer-
supplier relationship. In addition to price the supplier selection is based on quality,

16
technical expertise, and effective buyer-supplier communication, which result infrequent
and reliable deliveries, high quality of incoming parts, small shipment size and parts
delivered in exact quantity. As a result JIT purchasing helps to reduce inventory and
increased productivity, benefiting both the buyer and supplier (Fullerton and McWatters
2002).
In this study, performance will be measured based on; Economic Value Added (EVA),
Activity-based costing, Quality Management, Customer Value Analysis; and Action-
Profit Linkage Model. Activity-based costing links expenses related to resources supplied
to the company to the activities performed within the company. It is a way of measuring
which of the firm’s activities generate revenues in excess of costs and as a result, provide
keen insight into what is really providing value for customers (Meyer, 2002). Action-
Profit Linkage (APL) model helps firms identify measure and understand the causal links
between company actions and profits. The APL model starts with the corporate strategy
and moves to the four main components: company actions, delivered product/service,
customer actions and economic impact. Customer value analysis is a sufficiently rich
framework and customer relationship management (CRM) technologies that provide
firms with better data integration and hence better measurement regarding customers. In
addition, employee performance aspects will be addressed including knowledge about
organization’s vision and strategy, regularly training, as well as existence of team work.
2.5 Just in Time and Performance in Oil Companies
The oil industry faces many problems setting several constraints and challenges for the
industry. Resulting from the above mentioned, demand growth, eased trade barriers and
technological growth built a strong competition among the petroleum corporations
(Jenkins & Wright, 1998; Anderson, 2003; Himola, 2011). Although the whole business
world, especially the private sector is characterized by a high level of competition, it has
a greater significance in the oil industry because of the enormous amount of money
involved in (Anderson, 2003; Gainsborough, 2006). For illustration, out of around US$
1.5 trillion oil business globally, Exxon Mobile alone made US$ 41 billion annual profit
in 2011 (Gainsborough, 2006; Taxpayer,2011). The competition is complicated by

17
very volatile circumstances surrounding the whole oil industry. Unforeseen events, for
instance political changes such as the recent international situation or governmental
decisions have an impact on the price of the oil. Fluctuated oil prices affect the accurate
demand forecasting which could lead to distortion in the supply (Anderson, 2003).
The oil supply chain is also known to be a very complex chain compared to other
industries’ (Jenkins & Wright, 1998; Hussain, Assavapokee & Khumawala, 2006). It is
due to several reasons. The whole oil supply chain is divided into up-and downstream
segments based on activities before and after the refining stage. However, the distance
from the oil exploitation point to the final consumers could often be thousands and
thousands of kilometers (km) which is the main reason for the oil supply chain having
longer lead time than in other industries. In addition, crude oil has to go through a
complex, capital intensive refinery process as well (Gainsborough, 2006; Ribas, Leiras &
Hamacher, 2011). The long lead time also indicates the involvement of various means of
transport such as ships, pipelines, rail and road as well as high transportation cost
(Hussain et al., 2006; Ribas, Leiras& Hamacher, 2011). Hall (2002) and Gainsborough
(2006) also emphasize that cost efficiency stands as a primary goal in order to maximize
profit. It can be seen that oil just in time technique has an important role to play not only
to gain competitive advantage but it helps to solve many constraints and challenges
caused by the many variables in this business.
JIT emphasizes on quality, which is essential for a JIT system. The defects not only
produce waste but they can also grind the production process to a halt. Since there is no
inventory to cover up for mistakes, perfect quality is required by a JIT system. A JIT
system is designed to expose errors and get them corrected rather than covering them up
with inventory. JIT can be applied to many subsystems of a manufacturing environment
such as engineering design, setup time and lot size reduction, purchasing, flexibility,
suppliers’ management, product development, inventory reduction at every stage,
marketing, lead time reduction etc. among these purchasing has the cost saving. The
purchasing goods represent 50-80% of the cost of goods sold for many companies, and in
some industries such as textile industry, it accounts for more than 80% of the total cost.

18
Usually, the purchasing department is expected to procure the right quantity of material
of right quality at the right time, from the right source, and at the right cost. JIT system
has been implemented in many industries of several countries such as United States,
United Kingdom, Italy, Germany, and Korea etc. JIT is an approach of excellence in the
entire organization, emphasizing on quality, by eliminating wastages to improve
productivity. JIT is an inventory monitoring technique at each stage of the system starting
from raw material to finished product to achieve the target in time.
Kimani (2013) noted that there are challenges in Kenya petroleum industry and that
Kenya’s petroleum industry faces inventory challenges such as lack of strategic stocks,
relatively high petroleum prices compared to other East African countries, frequent fuel
shortages, sub-standard products and diversion of products destined for export back into
the country.
2.6 Summary and Conceptual Framework
This section presents the summary of literature review and a conceptual framework,
which depict the relation between the variables in the study.
2.6.1 Summary
One most outstanding feature of JIT is that it generates great number of suggestions by
worker’s involvement in continuous improvement. Management works hard to
implement these suggestions. The number of suggestions is regarded as an important
criterion in reviewing the performance of a worker. Thus, management recognizes
worker’s efforts for quality improvement. Quality circles are also act as group oriented
suggestion system for making improvement. In short, JIT requires efficient suggestion
system to involve employees in organization activities.
In bottleneck-areas where specific problems exist in the production system the limiting
processes, that lie on the critical path, can be analyzed and optimized. This will have an
immediate effect on the productivity of the entire production system. Pilcher (1992)
observes that a typical JIT system would require such a study to be conducted continually
on each process in the production system, since JIT requires continual improvement. The

19
latest advances regarding JIT, and methods for the implementation thereof are studied
and then, in order to provide a sound basis for JIT implementation in major oil companies
in Kenya.
2.6.2 Conceptual Framework
This section discusses the conceptual framework for the study. It shows the
conceptualizations between the independent and dependent variables. The independent
variables for purposes of this study are Top management support, Training and change
management, Security Systems and IT infrastructure and Effective project management
while the dependent variable is the application of JIT. This conceptualization is based on
the arguments by Jarrar, Maria and Dongilli (2006).

20
Figure 2.1: Determinants of JIT Techniques Application and Performance
Just In Time Determinants Performance measures
Independent Variables Dependent Variable
Source: (Author, 2014)
Top Management Support
Support
Training
-Organization growth
-Employee development
-Financial performance
Systems security
Effective Project Management

21
CHAPTER THREE: RESEARCH METHODOLOGY
3.1 Introduction
According to Guay and Kothari (2003), research methodology involves details in
approaches and procedures used in carrying out studies. It includes the techniques,
methods and procedures adopted in the research. This chapter discusses the research
design, target population, sample and sampling procedures, data collection procedure and
data analysis techniques
3.2 Research Design
The research design employed in this study was a descriptive survey research design with
an illustration of a case study. A descriptive research design describes the state of affairs
as it exists in the present (Guay and Kothari, 2003). It was deemed appropriate because
the research involved seeking information from managers experienced in management
and operation management practices and performance of the firm. A descriptive research
design was appropriate as the study involved fact finding to describe the determinants of
JIT techniques application and documenting the findings.
3.3 Target Population
The target populations for this study were the 15 major oil firms in Kenya, which are;
Vivo Ltd (Shell), Total Kenya Ltd, Kenol/Kobil (Kenya Oil Ltd), Oil Libya Kenya Ltd,
National Oil Corporation of Kenya (NOCK), GAPCO, Hashi, Gulf, Hass, Galana, Bakri,
Engen, Oilcom, Rivapet and Fossil due to their market share and depot capacity. The
study respondents were staff in operations, customer service and procurement department
of these firms, because they are in charge of quality and operation issues hence have the
required information.
3.4 Sampling
This study adopted census sampling. According to Bryman (2008), sampling is the
process of selecting a number of individuals for a study in such a way that the individual
represents a larger group from which they are selected. One approach is to use the entire
population as the sample. Although cost considerations make this impossible for large

22
populations, a census is attractive for small populations (normally of less than 200). A
census eliminates sampling error and provides data on all the individuals in the
population.
The respondents were selected from operations, customer service and procurement
departments making a total sample of 45 respondents. Census sampling was used hence
the entire target population of 15 major oil companies was studied. The study collected
primary data.
3.5 Data Collection
The main instrument for data collection was semi-structured questionnaires. The study
collected primary data since there was no available secondary data specifically on Just in
Time adoption and performance of major oil companies in Kenya. Primary research also
enables a focus on specific subjects; it also enables the researcher to have a higher control
over how the information is collected as well as deciding on the time frame and goal.
Questionnaires gave the researcher comprehensive data on a wide range of factors. Data
was collected from 45 respondents in all levels at the 15 major oil firms in Kenya. The
questionnaire had two sections. Section A contained questions on demographic
information of the respondents while section B focused on questions relating to Just in
Time (JIT) Technique application and performance in major oil companies in Kenya.
The questionnaire were administered to the respondents using drop and pick later method
since the managers are knowledgeable and busy hence would be able to fill the required
answers at their own time without assistance. A period of two weeks was given for data
collection period after which those who would not have completed were given one more
week for completion. The filled questionnaires were then collected and sorted ready for
analysis.
3.6 Data Analysis
Quantitative data collected using questionnaires was analyzed by the use of descriptive
statistics using SPSS (Statistical Package for Social Sciences) and presented through
percentages, means and frequencies. The information was also displayed by use of

23
frequency tables and charts. A frequency distribution indicated the result of the
grouping of the responses with respect to a single quantitative characteristic.
The Likert scale data was analyzed using mean score and standard deviation. The Likert
scale questions enabled the respondents to state their levels of agreement with
statements referring to JIT application techniques. The standard deviation signified the
variation or "dispersion" from the "average" (mean). Mean scores ranged from 1-5,
where a mean of above 3 indicated significant adoption of JIT technique or high value
of performance indicator. Standard deviation was used to indicate the variation or
"dispersion" from the "average" (mean). A low standard deviation implied that the data
points have a tendency to be near to the mean, while high standard deviation implied
that the data is dispersed over a large range of values
Factor analysis is a statistical method used to describe variability among observed,
correlated variables in terms of a potentially lower number of unobserved variables
(factors). Factor analysis attempts to bring intercorrelated variables together under more
general, underlying variables. Factor analysis was used to highlight the most significant
determinants of Just in Time (JIT) techniques application in major oil companies in
Kenya.

24
CHAPTER FOUR: DATA ANALYSIS AND FINDINGS
4.1 Introduction
This chapter discusses the analysis and findings of the study. The purpose of the study
was to investigate the determinants of JIT techniques application and performance of
major oil companies in Kenya (Vivo Ltd (Shell), Total Kenya Ltd, Kenol/Kobil (Kenya
Oil Ltd), Oil Libya Kenya Ltd, National Oil Corporation of Kenya (NOCK), GAPCO,
Hashi, Gulf, Hass, Galana, Bakri, Engen, Oilcom, Rivapet and Fossil). The researcher
made use of frequency tables and figures to present data. Data was collated and reports
were produced in form of tables and figures and qualitative analysis. A total number of
45 questionnaires were sent out, and of 35 of questionnaires of them collected. This gave
a response rate of 78%.
4.2 General Information
The study initially sought to inquire information on various aspects of respondents’ and
company background that is; designation in the company, ownership status of the
respondents company, number of branches of Respondents Company in Kenya and
period of time respondents firm has been in operation in Kenya (In Years). This
information aimed at testing the appropriateness of the respondent in answering the
questions regarding determinants of JIT techniques application and performance of major
oil companies in Kenya.
4.2.1 Respondents Designation in the Company
The respondents were requested to indicate their designation in the Company. The
findings are as presented in Table 4.2.
Table 4.1: Respondents Designation in the Company
Designation Frequency Percentage (%)
Operations officer 16 46
Customer service officer 10 29
Procurement officer 9 25
Total 35 100

25
As per the findings, 16 of the respondents were operations officers, 10 were customer
service officers and 9 were procurement officers. This is good representation of the target
population.
4.2.2 Ownership Status of the Respondents Company
The study also requested the respondents to state the ownership status of their Company
and the findings are as illustrated in Figure 4.2.
Figure 4.2: Ownership Status of the Respondents Company
From the findings, 23 of the respondents stated that the ownership status of their
Company was local whereas 12 respondents stated that the ownership status of their
Company was foreign. This depicts that the oil marketing companies under study were
both foreign and locally owned as targeted.
4.2.3 Number of Branches of Respondents Company in Kenya
The study requested the respondents to indicate how many branches does their company
has in Kenya. The findings are shown in Table 4.2.

26
Table 4.2: Number of Branches of Respondents Company in Kenya
Number of Branches Frequency Percentage (%)
0-20 4 11
21-40 9 26
41-60 10 29
61 -80 6 17
81 or more 6 17
Total 35 100
The findings show that 10 of the respondents company have 41-60 branches in Kenya, 9
have 21-40 branches in Kenya, 6 have 61-80 and 81 and above branches each in Kenya
and 4 respondents have 0-20 branches in Kenya. This implies that they are large
companies.
4.2.4 Period of Time Respondents Firm has been in Operation in Kenya
The study sought to determine the number of years respondents firm has been in
operation in Kenya. The findings are shown in Table 4.3.
Table 4.3: Period of Time Respondents Firm has been in Operation in Kenya
Period (yrs) Frequency Percentage (%)
0-5 9 26
6-10 3 6
11-15 3 6
16-20 9 26
21 and above 11 36
Total 35 100
According to the findings in Table 4.3, 36% of the respondents firms have been in
operation in Kenya for 21 years and above, 26% of the respondents firms have been in

27
operation in Kenya for 16-20 years, another 26% of the respondents firms have been in
operation in Kenya for 0-5 years, 6% of the respondents firm have been in operation in
Kenya for 6-10 years and 6% have been in operation in Kenya for 11-15 years. This
shows that the respondents firms have been in operation in Kenya for over 5 years and
have better knowledge about the performance of oil companies in Kenya.
4.3 Extent of Just in Time (JIT) Techniques Application Adoption by Major Oil
Companies in Kenya.
The first objective of the study was to establish the extent of Just in Time (JIT) adoption
by major oil companies in Kenya. This section presents the findings in relation to this.
4.3.1 Respondents Prior Knowledge of JIT Production System
The respondents were asked if they have any prior knowledge of JIT production system.
The findings are illustrated in Figure 4.3 below.
Figure 4.3: Respondents Prior Knowledge of JIT Production System
As per the findings above, 78% of the respondents have prior knowledge of JIT
production system while 22% said they did not.

28
4.3.2 Implementation of JIT by Respondents Company
The respondents were asked if their Company is implementing JIT. A summary of the
findings is presented in Table 4.4 below.
Table 4.4: Implementation of JIT by Respondents Company
Response Frequency Percentage (%)
Yes 23 66
No 12 34
Total 35 100
From the findings in Table 4.4, 66% of the respondents Company implement JIT whereas
34% of the respondents Company do not implement JIT.
The study probed further the respondents who disagreed that their Company is
implementing JIT on why this is the case.
Table 4.5: Reasons against Implementation of JIT by Respondents Company
Reasons Frequency
Incorporating JIT requires a heavy commitment of time 9
Incorporating JIT imposes a rigorous discipline upon the organization 7
JIT requires an overall cultural change of an organization 6
The trends of the industries discovered are currently influenced by the
culture of traditional manufacturing system
6
A total employee involvement is required to ensure the quality of their
product
5
Employees in the industries are not fully ready for this issue for fear of job
security, job security prevailing
5
Total 38
According to the findings in Table 4.5 above, the respondents mentioned that
incorporating JIT requires a heavy commitment of time and imposes a rigorous discipline

29
upon the organization. JIT requires an overall cultural change of an organization, but the
trends of the industries discovered, are currently influenced by the culture of traditional
manufacturing system. They went on to say that a total employee involvement is required
to ensure the quality of their product. It seems that employees in the industries are not
fully ready for this issue. The main reasons cited by the respondent for the employee
resistance in companies are: Fear of job security, Job security prevailing, Segmented
problem solving practices (segmented concern), Working or acting to be loyal to their
supervisors rather than the company, The employees are loyal to professionals, Narrow
skill of most employees and Functional workers are somewhat specialized and rigid.
4.3.3 JIT Efforts in Respondents Company
The study requested the respondents to rate the JIT efforts in their company. A summary
of the findings is illustrated in Figure 4.4 below.
Figure 4.4: JIT Efforts in Respondents Company
As per the findings, 78% of the respondents rated the JIT efforts in their company to be
of great extent while 22% of the respondents rated the JIT efforts in their company to be
of moderate extent.

30
4.3.4 Aspects of JIT Practiced in the Respondents Organization
The study sought to identify the aspects of JIT practiced in the respondents’
organization. The responses were placed on a five Likert scale where 1 =very small
extent, 2=small extent 3= moderate 4=great extent and 5=very great extent. A mean of
above 3 is regarded to indicate a measure of satisfaction on the test variables. Standard
deviation was used to indicate the variation or "dispersion" from the "average" (mean).
A low standard deviation indicates that the data points tend to be close to the mean,
whereas high standard deviation indicates that the data is spread out over a large range
of values. The results are as in the Table 4.6.
Table 4.6: Aspects of JIT Practiced in the Respondents Organization
Aspects of JIT Mean Std
Dev
U-shaped line production. 2.92 0.447
Parallel line production. 2.98 0.317
Statistical process control. 3.68 0.254
Group technology. 3.71 0.239
Preventive maintenance. 3.72 0.316
Work in progress reduction. 3.77 0.144
Kanban card information circulation system. 3.77 0.155
Production simplification. 3.85 0.252
Standard containers. 3.93 0.196
Flexible workforce. 3.98 0.213
Work team quality control. 4.00 0.178
JIT purchasing. 4.01 0.289
Smoothed line production. 4.07 0.336
Set-up time reduction. 4.09 0.416
Continuous improvement. 4.21 0.111
The findings in Table 4.6 portray that the respondents strongly agreed that the aspects of
JIT practiced in the respondents’ organization are: Continuous improvement

31
(mean=4.21); Set-up time reduction (mean=4.09); Smoothed line production
(mean=4.07); JIT purchasing (mean=4.01) and work team quality control (mean=4.00):
They agreed that other aspects of JIT practiced in the respondents’ organization are
Flexible workforce (mean=3.98), Standard containers (mean=3.93), Production
simplification (mean=3.85), Kanban card information circulation system and Work in
progress reduction (mean=3.77 each), Preventive maintenance (mean=3.72), Group
technology (mean=3.71) and Statistical process control (mean=3.68).
However they disagreed on some aspects of JIT begin practiced in their organization
including Parallel line production (mean=2.98) and U-shaped line production
(mean=2.92).
4.3.5 Factor analysis for Aspects of JIT
Factor analysis was used to extract the most important components that measured the
Rotated component factor analysis for Aspects of JIT. The principal component analysis
and varimax rotation methods were used to extract components with the Eigen values > 1
and items with correlation coefficients greater than or equal 0.60 as shown in the
following rotated matrix tables.

32
Table 4.7: Rotated Component Matrix for Aspects of JIT
Rotated component factor analysis for Aspects of JIT
Components
Qu
ali
ty
Imp
rovem
ent
Mu
ltif
un
ctio
nal
Work
er
Inven
tory
Man
agem
ent
Continuous improvement .419
Production simplification .381
Work in progress reduction .374
Preventive maintenance .369
Set-up time reduction .408
Statistical process control .359
Work team quality control .395
Flexible workforce
.392
Smoothed line production .402
JIT purchasing
.399
Standard containers
.389
Kanban card information circulation system .374
Group technology.
.366
Parallel line production .261
U-shaped line production .242
Eigen Values 1.635 1.199 .105
Variance % 7.108 10.902 15.911
Cumulative % 72.293 83.195 99.106
Extraction Method: Principal Component Analysis. Rotation Method: Varimax with
Kaiser Normalization. A rotation converged in 8 iterations.
Factor analysis results yielded three components. These were interpreted as Quality
Improvement (7.108), Multifunctional Worker (10.902), Inventory Management
(15.911); all explaining 99.1% of the variance in Aspects of JIT.
Since the largest Eigen value of 1.635 corresponds to Quality Improvement, this is a
component that claims most of the responses.

33
4.4 Determinants of Just in Time (JIT) Adoption by Major Oil Companies in Kenya.
The second objective of the study was to establish the determinants of Just in Time (JIT)
adoption by major oil companies in Kenya. This section presents the findings in relation
to this.
4.4.1 Extent to Which Top Management Provide Expertise in JIT Implementation
The respondents were asked to indicate the extent to which top management provide
expertise in JIT implementation. The findings are as illustrated in Figure 4.5.
Figure 4.5: Extent to Which Top Management Provide Expertise in JIT
Implementation
The findings in Figure 4.5 depict that majority (51%) of the respondents are of the
opinion that top management provide expertise in JIT implementation to a great extent,
27% of the respondents are of the opinion that top management provide expertise in JIT
implementation to a moderate extent and 22% of the respondents are of the opinion that
top management provide expertise in JIT implementation to a very great extent. This
implies that top management provides expertise in JIT implementation to a great extent.
4.4.2 Factors Influencing JIT in Respondents Organization
The study sought to identify the influence of various factors on JIT in the respondents’
organization. The responses were placed on a five Likert scale where 1=very small
extent, 2=small extent 3= moderate 4=great extent and 5=very great extent. A mean of

34
above 3 is regarded to indicate satisfaction on the test variables. Standard deviation was
used to indicate the variation or "dispersion" from the "average" (mean). A low standard
deviation indicates that the data points tend to be very close to the mean, whereas high
standard deviation indicates that the data is spread out over a large range of values. The
results are as in the Table 4.8.
Table 4.8: Factors Influencing JIT in Respondents Organization
Factors Mean Std
Dev
The cost of the system security exceeds the monetary benefits accruing
from the system.
2.12 0.211
The organization does not have competent personnel to effectively
maintain the JIT system.
2.65 0.325
There is a project team in charge of JIT implementation. 3.45 0.244
There is a department concerned with ultimate control and operation of
JIT
3.55 0.148
There are sufficient measures to retrieve lost data. 3.64 0.169
There are no loopholes in the JIT system security in this organization. 3.68 0.174
The team has been able to deliver as per the stipulated time schedule in
JIT implementation.
3.69 0.156
There are no issues of confidentiality to unauthorized personnel. 3.71 0.365
A sufficient budget has been allocated for purposes of JIT training. 3.75 0.333
My competencies on the use of the JIT have contributed to increased
efficiency in this organization.
3.76 0.188
JIT system is compatible with other Information technology systems 3.84 0.167
The adequacy of the security system of JIT in this organization is
sufficient
3.88 0.111
JIT adoption involves integration of all functions of the organization 3.96 0.562
The Managing Director enhances the running of JIT 3.96 0.239
JIT adoption enhances costs reduction. 3.99 0.144
JIT adoption entails better management control 4.03 0.233
JIT adoption improves business processes 4.08 0.241
JIT adoption enhance customer service 4.12 0.279
Training in JIT has improved performance 4.18 0.156
Good performance can be attributed to adequate training on JIT. 4.32 0.199

35
From the findings in Table 4.8 depict that, the most influential factors on JIT in the
respondents’ organization are; Good performance can be attributed to adequate training
on JIT (mean=4.32); Training in JIT has improved performance (mean=4.18); JIT
adoption enhance customer service (mean=4.12); JIT adoption improves business
processes (mean=4.08) and JIT adoption entails better management control (mean=4.03).
They also agreed that JIT adoption enhance costs reduction (mean=3.99), The Managing
Director enhances the running of JIT and JIT adoption involves integration of all
functions of the organization (mean=3.96 each). The adequacy of the security system of
JIT in this organization is sufficient (mean=3.88), JIT system is compatible with other
Information technology systems (mean=3.84), my competencies on the use of the JIT
have contributed to increased efficiency in this organization (mean=3.76).
In addition, a sufficient budget has been allocated for purposes of JIT training
(mean=3.75), There are issues of confidentiality to unauthorized personnel (mean=3.71),
The team has been able to deliver as per the stipulated time schedule in JIT
implementation (mean=3.69), There are no loopholes in the JIT system security in this
organization (mean=3.68), There are no sufficient measures to retrieve lost data
(mean=3.64), There is a department concerned with ultimate control and operation of JIT
(mean=3.55) and There is a project team in charge of JIT implementation (mean=3.45).
However, they disagreed that the organization does not have competent personnel to
effectively maintain the JIT system (mean=2.65) and the cost of the system security
exceeds the monetary benefits accruing from the system (mean=2.12). This implies that
Good performance can be attributed to adequate training on JIT.
4.4.3 Factor Analysis for Factors Influencing JIT
Factor analysis was used to extract the most important components that measured the
rotated component factor analysis for factors influencing JIT. The principal component
analysis and varimax rotation methods were used to extract components with the Eigen
values > 1 and items with correlation coefficients greater than or equal 0.60 as shown in
the following rotated matrix tables.

36
Table 4.9: Rotated Component Matrix for factors influencing JIT
Rotated component factor analysis for factors
influencing JIT
Components
To
p
Ma
na
gem
ent
Su
pp
ort
Tra
inin
g
Eff
ecti
ve
Pro
ject
Ma
na
gem
ent
Sec
uri
ty
Sy
stem
s
JIT adoption enhance customer service .409
JIT adoption entails better management control .400
The Managing Director enhances the running of JIT .391
There is a department concerned with ultimate control
and operation of JIT .351
Good performance can be attributed to adequate training
on JIT .429
Training in JIT has improved performance
.411
My competencies on the use of the JIT have contributed
to increased efficiency in this organization.
.370
A sufficient budget has been allocated for purposes of JIT
training.
.369
The organization does not have competent personnel to
effectively maintain the JIT system. .256
JIT adoption improves business processes .405
JIT adoption involves integration of all functions of the
organization
.391
JIT adoption enhance costs reduction
. 395
The team has been able to deliver as per the stipulated
time schedule in JIT implementation . 361
There is a project team in charge of JIT implementation . 341
The adequacy of the security system of JIT in this
organization is sufficient
.384
JIT system is compatible with other Information
technology systems .379
There are no issues of confidentiality to unauthorized
personnel
.366
There are no loopholes in the JIT system security in this
organization
.359
There are sufficient measures to retrieve lost data
.356
The cost of the system security exceeds the monetary
benefits accruing from the system
.210
Eigen Values .083 .074 .037 .012
Variance % .360 .322 .161 .051
Cumulative % 99.466
99.7
88 99.949
100.00
0
Extraction Method: Principal Component Analysis. Rotation Method: Varimax with
Kaiser Normalization. A rotation converged in 8 iterations.

37
Factor analysis results yielded four components. These were interpreted as Top
Management Support (0.360), Training (0.322), Effective Project Management (0.161),
Security Systems (0.051); all explaining 100.000% of the variance in factors influencing
JIT.
Since the largest Eigen value of 0.360 corresponds to Top Management Support, this is a
component that claims most of the responses.
4.5 Effect of Just in Time (JIT) Adoption on Performance of Major Oil Companies
in Kenya.
The final objective of the study was to determine the effect of Just in Time (JIT) adoption
on performance by major oil companies in Kenya.
4.5.1 Extent To Which Respondents Organization Experienced Performance
Indicators
The study sought to identify the extent to which respondents’ organization experienced
the following performance indicators as a result of implementation of Just In Time (JIT)
techniques where responses were placed on a five point Likert scale (1 =very small
extent, 2=small extent 3= moderate 4=great extent and 5=very great extent). A mean of
above 3 is regarded to indicate satisfaction on the test variables. Standard deviation was
used to indicate the variation or "dispersion" from the "average" (mean). A low standard
deviation indicates that the data points tend to be very close to the mean, whereas high
standard deviation indicates that the data is spread measure range of values. The results
are as in the Table 4.10.

38
Table 4.10: Extent To Which Respondents Organization Experienced The Following
Performance Indicators
Performance indicators
Mean Std
Dev
Team work exists within the organization. 3.51 0.411
Employees have the skills and knowledge to do their job well. 3.74 0.148
Employees are regularly provided with training in their areas of work 3.86 0.114
Managers/supervisors give people the authority they need to do their
work effectively
3.96 0.332
The organization is able to achieve objectives within their budgets 3.99 0.239
The organization’s structure helps different departments/regions to work
together effectively
3.99 0.358
The organization adapts well to changes in the internal environment 3.99 0.562
The organization has clearly documented procedures 4.03 0.169
The organization adapts well to changes in the external environment 4.04 0.279
Management provides good leadership for employees 4.05 0.119
The organization has seen an increase in profits 4.06 0.177
Employees are regularly provided with training in their areas of work 4.09 0.230
Employees are clear about organization’s vision and strategy 4.11 0.163
Employees are clear about the values required for the organization to be
successful
4.15 0.228
Customers are satisfied with our organizations performance 4.18 0.110
Over the past years, the organization has shown steady, reduction in cost. 4.19 0.247
The organization has implemented new innovations in the past 6 months 4.20 0.233
Organization promptly resolves customer complaints. 4.27 0.118
The organization enjoys a good reputation with stakeholders such as the
Government and partners
4.29 0.328
The organization enjoys a good reputation with other partners 4.35 0.228
The organization currently has audited financial reports 4.41 0.112
From the findings in Table 4.10, the greatest performance indicators the respondents
organization experienced as a result of implementation of Just In Time (JIT) techniques
were: The organization currently has audited financial reports (mean=4.41); The
organization enjoys a good reputation with other partners (mean=4.35); The organization
enjoys a good reputation with stakeholders such as the Government and partners
(mean=4.29); Organization promptly resolves customer complaints (mean=4.27), The
organization has implemented new innovations in the past 6 months (mean=4.20), Over
the past years, the organization has shown steady, reduction in cost (mean=4.19),

39
Customers are satisfied with our organizations performance (mean=4.18), Employees are
clear about the values required for the organization to be successful (mean=4.15),
Employees are clear about organization’s vision and strategy (mean=4.11), Employees
are regularly provided with training in their areas of work (mean=4.09), The organization
has seen an increase in profits (mean=4.06), Management provides good leadership for
employees (mean=4.05), The organization adapts well to changes in the external
environment (mean=4.04) and The organization has clearly documented procedures
(mean=4.03).
They also agreed that The organization adapts well to changes in the internal
environment, The organization’s structure helps different departments/regions to work
together effectively and The organization is able to achieve objectives within their
budgets (mean=3.99 each), Managers/supervisors give people the authority they need to
do their work effectively (mean=3.96), Employees are regularly provided with training in
their areas of work (mean=3.86), Employees have the skills and knowledge to do their
job well (mean=3.74) and Team work exists within the organization (mean=3.51).
This implies that the greatest performance indicators the respondents’ organization
experienced as a result of implementation of Just In Time (JIT) techniques was the
organization currently has audited financial reports.
4.5.2 Factor Analysis for Performance of JIT
Factor analysis was used to extract the most important components that measured the
rotated component factor analysis for performance of JIT. The principal component
analysis and varimax rotation methods were used to extract components with the Eigen
values > 1 and items with correlation coefficients greater than or equal 0.60 as shown in
the following rotated matrix tables.
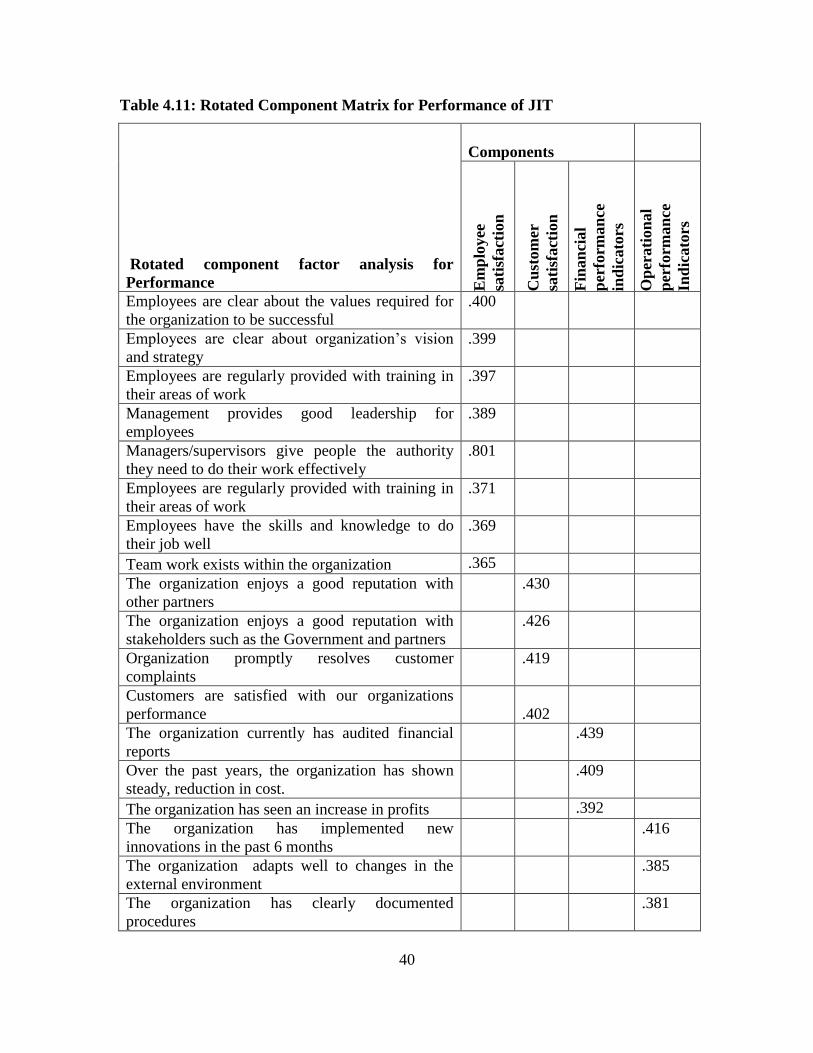
40
Table 4.11: Rotated Component Matrix for Performance of JIT
Rotated component factor analysis for
Performance
Components
Em
plo
yee
sati
sfact
ion
Cu
stom
er
sati
sfact
ion
Fin
an
cial
per
form
an
ce
ind
icato
rs
Op
erati
on
al
per
form
an
ce
Ind
icato
rs
Employees are clear about the values required for
the organization to be successful
.400
Employees are clear about organization’s vision
and strategy
.399
Employees are regularly provided with training in
their areas of work
.397
Management provides good leadership for
employees
.389
Managers/supervisors give people the authority
they need to do their work effectively
.801
Employees are regularly provided with training in
their areas of work
.371
Employees have the skills and knowledge to do
their job well
.369
Team work exists within the organization .365
The organization enjoys a good reputation with
other partners
.430
The organization enjoys a good reputation with
stakeholders such as the Government and partners
.426
Organization promptly resolves customer
complaints
.419
Customers are satisfied with our organizations
performance .402
The organization currently has audited financial
reports
.439
Over the past years, the organization has shown
steady, reduction in cost.
.409
The organization has seen an increase in profits .392
The organization has implemented new
innovations in the past 6 months
.416
The organization adapts well to changes in the
external environment
.385
The organization has clearly documented
procedures
.381

41
The organization adapts well to changes in the
internal environment
.379
The organization’s structure helps different
departments/regions to work together effectively
.374
The organization is able to achieve objectives
within their budgets
.374
Employees are clear about the values required for
the organization to be successful
.401
Eigen Values
26.32
6
15.95
8 13.500 8.805
Variance %
36.56
4
22.16
3 18.750 12.229
Cumulative %
36.56
4
58.72
7 77.477 89.706
Extraction Method: Principal Component Analysis. Rotation Method: Varimax with
Kaiser Normalization. A rotation converged in 8 iterations.
Factor analysis results yielded four components. These were interpreted as Employee
satisfaction (21.938%), Customer satisfaction (13.396%), Financial performance
indicators (13.028%), Operational performance Indicators (12.859%); all explaining
89.7% of the variance in Performance. Since the largest Eigen value of 36.564
corresponds to Employee satisfaction, this is a component that claims most of the
responses.
4.6 Discussion of Findings
The study found out that Quality Improvement, Multifunctional Worker, Inventory
Management explains 99.1% of the variance in Aspects of JIT. Since the largest Eigen
value of 1.635 corresponds to Quality Improvement, this is a component that claims most
of the responses. Similarly, Padukone and Rao (1993) have grouped the JIT techniques
into two stages. The first stage of JIT implementation is composed of areas that are
necessary for full JIT to work. They focus on four main elements of JIT that can be
achieved in the short term. These are simplicity, flow, quality, and fast set-up and lay the
foundation for moving on to the more difficult techniques like kanban and JIT
purchasing, which are a part of stage two.

42
The study also found out that Top Management Support, Training, Effective Project
Management, Security Systems explain 100.000% of the variance in factors influencing
JIT. Since the largest Eigen value of 0.360 corresponds to Top Management Support, this
is a component that claims most of the responses. Likewise, JIT experts such as
Schonberger (1984) and Hall (1983) who maintain that it is essential to begin JIT
implementation with a good deal of attention first being paid to the people aspects.
The study further found out that Employee satisfaction, Customer satisfaction, financial
performance indicators, Operational performance Indicators explain 89.7% of the
variance in Performance. Since the largest Eigen value of 36.564 corresponds to
Employee satisfaction, this is a component that claims most of the responses. This is in
agreement with Fiedler et al., (1993) who proposed the following two stages process:
Prepare the plant and its people for flexibility, low costs, short lead-times and high
quality by concentrating on design; maintenance; quality; layout; set-up time; and people.
Strive to produce zero lead-time with no waste by focusing on: total people involvement;
visibility; process data collection; enforced improvement; flow scheduling; inventory
control; buffer and lot size reduction, and supplier and customer relationship.

43
CHAPTER FIVE: CONCLUSIONS AND RECOMMENDATIONS
5.1 Introduction
This chapter presents the summary of the data findings on the determinants of JIT
techniques application and performance of major oil companies in Kenya, the
conclusions and recommendations are drawn there to. The chapter is therefore structured
into summary of findings, conclusions, recommendations and area for further research.
5.2 Conclusion
The study concluded that the aspects of JIT practiced in the organization were;
Continuous improvement, Set-up time reduction, Smoothed line production, JIT
purchasing, Work team quality control, Flexible workforce, Standard containers,
Production simplification, Kanban card information circulation system, Work in progress
reduction, Preventive maintenance, Group technology and Statistical process control
respectively.
The study also concluded that the most influential factors on JIT in the organization were
good performance attributed to adequate training on JIT. The study further concluded that
the greatest performance indicators experienced as a result of implementation of Just In
Time (JIT) techniques were; the organization currently has audited financial reports and it
enjoys a good reputation with other partners.
The study concluded that JIT Based Quality Management makes outstanding
improvements in area of cost and quality through best use of human resources by
focusing on simplicity, waste elimination and continuous improvement. It is a great
opportunity for industries due to its relatively low investment needs and compatibility to
small business environment. This approach utilizes the full capacity of workers and
enables them to systematically analyze the hidden causes of quality problems by making
small consistent changes in organizational arrangements.

44
It allows the workers to become participant in decision-making by putting the trust and
responsibility in their hands. Several leading oil marketers in Kenya are implementing the
JIT with belief that it would be helpful to face the global competition. Yet, its
effectiveness would depend upon qualities, attitudes and values of the work force. In the
end, it is hope that other industries would initiate the necessary changes in their existing
production system for adopting the JIT Based Quality Management to gain maximum
benefits.
5.3 Recommendations
In order to achieve the benefits of the pull (customer-demand) production, the oil
marketer should utilize the Just-In-Time production system. The procedures necessary to
implement the pull production system are simple yet powerful in maintaining efficiencies
with minimum inventory. The basic idea is that the companies are only responding to the
company’s actual-customer demand for their products.
The implementation model of JIT developed for the companies are made with the
consideration of where the companies are at the moment. Their readiness is rated at their
infancy stage to implement JIT. Therefore, the line implementation model should be
followed sequentially without shortcutting or jumping any of the steps.
In general, to implement JIT the companies should first made priorities like:-Respond to
customer’s requirement; Integrate and stream line all processes in their manufacturing
system; Develop employee participation in meeting the commitments of the company;
Implant a company-wide commitment to education; Eliminate redundant processes;
Locate and eliminate all sources of inventory; Establish goals that require continuous
improvement to the production process; Use a pull production system; Develop
controllable production processes; Have a companywide defect protection program; Set
goals on reducing set-up time, and Build products to specifications.
After achieving the above general goals, each of the companies should work to achieve
the following specific requirements such as:-Stabilize and level the master production

45
system with uniform plant loading; Reduce or eliminate set-up times; Reduce lot sizes
and lead times; Use total productive maintenance to reduce machine breakdowns; Train
the work force to multi-skill; Develop few nearby suppliers, this may be difficult for the
oil marketers during the first time but in the long run it can be achieved, and Use small-
lot (single unit) conveyance using kanban card like system.
5.4 Limitations of the Study
The study area was limited to the 15 major oil companies in Kenya only and this could
affect the generalizations of the findings.
The sample size is far below the number of cases reported in other research, which has
led in this case to a more complex data analysis. It would be advisable to replicate the
study in broader contexts to confirm the underlying factors identified in this case.
While the purpose of the study was to assess Just in Time adoption and performance of
major oil Companies in Kenya, the study does not attempt to explain why such adoption
might have occurred.
Finally, the study also suffers from a common limitation in quantitative research: the use
of subjective measures for the variables considered. However, it is widely reported in the
literature that this procedure increases the response rate as well as that there is a high
correlation between subjective and objective data on performance (Venkatraman and
Ramanujan, 1986). The use of self-reported data may induce social desirability bias,
although the assurance of anonymity can reduce such bias when responses concern
sensitive topics (Hair et al., 1999).
5.5 Suggestions for Further Studies
This study investigated on the determinants of JIT techniques application and
performance of major oil companies in Kenya. The study suggests that further research to
be done on challenges affecting implementation of JIT techniques application and
performance of major oil companies in Kenya.

46
The study also recommends that further study be done on the impacts of effective
implementation of JIT techniques application and performance of major oil companies in
Kenya.
JIT techniques implementation has positive effects on overall firm performance.
However such positive effects should be examined in detail to see if they are sustainable
and continuous studies carried to verify if this then remains true in the long run. It would
be good to know then the advantages and disadvantages of JIT techniques
implementation.

47
REFERENCES
Anderson, E. (2003). Supply Chain Strategy in the Oil and Gas Sector. Business
Briefing: Exploration and Production.
Banker, R., Potter, G., Schroeder, R. (1993a). Reporting manufacturing performance
measures to workers: an empirical study. Journal of Management Accounting
Research 5, 33–53.
Bowman, D.J. (1991). If you don't understand JIT how can you implement it?
Industrial Engineering, pages 38-39, Feb 1991.
Bowman, R.J. (1996). Has JIT flopped? Distribution 95 (7), 38–42.
Calvasina, R.V., Calvasina, E.J. and Calvasina, G.E. (1989). Beware the new
accounting myths. Management Accounting 12, 41–45.
Cammarano, J.R. (1996). Is it time to turn out the lights? IIE Solutions 28, 24–33.
Christopher, M. (2011).Logistics and Supply Chain Management (4th ed.). Edinburgh:
Pearson Education Limited.4.
CIA. (2010).Publications. Retrieved March 07, 2012,
from https://www.cia.gov/library/publications/theworldfactbook/rankorder/217
4rank.htmland https://www.cia.gov/library/publications/theworldfactbook/rank
order/2173rank.html.
Clode, D.M. (1993). A survey of UK manufacturing control over the past ten years.
Production and Inventory Management Journal 2, 53–56.
Davy, J.A., White, R.E., Merritt, N.J. and Gritzmacher, K. (1992). A derivation of the
underlying constructs of JIT management systems. Academy of Management
Journal 35 (3), 653–670.
Epps, R.W. (1995). Just-in-time inventory management: implementation of a
successful program. Review of Business17 (1), 40–44.
Fisher, M. (1997).What is the Right Supply Chain for Your Product? Harvard
Business Review.105-116.6.
Flynn, B.B., Sakakibara, S., Schroeder, R.G., (1995). Relationship between JIT and
TQM: practices and performance. Academy of Management Journal 38, 1325–
1353.
Foster, G. and Horngren, C.T. (1987). JIT: cost accounting and cost management
issues. Management Accounting 6, 19–25.
Gleckman, H., Schiller, Z. and Treece, J. (1994). A tonic for the business cycle.
Business Week 3365, 57.
Golhar, D.Y., Deshpande, S.P. (1993). An empirical investigation of HRM practices in
JIT firms. Production and Inventory Management Journal, 28–32.
Guay, W., & Kothari, S. P. (2003). How Much Do Firms Hedge With Derivatives?
Journal of Financial Economics, 70(3), 423-461.

48
Hall, R.W. (1987). Attaining Manufacturing Excellence. Business One Irwin,
Homewood, IL. (7), 35-38.3.
Harrison, A. (1992). Just-In-Time Manufacturing in Perspective. Prentice Hall Inc.,
1992.
Hasini, E. (2008). Supply Chain Optimization: Current Practices and Overview of
Emerging Research Opportunities. Information System and Operation
Research. 42(2), 93-96.9.
Hay, E.J. (1988). The Just-In-Time Breakthrough: Implementing the New
Manufacturing Basics. Wiley, New York.
Hilmola, O. (2011). Logistics Sector Development Potential of World’s Oil
Exporters.
Johnson, G., Scholes, K. & Whittington, R. (2009). Fundamentals of Strategy (1st ed.)
Edinburgh: Pearson Education Limited.
Jones, D.J. (1991). JIT and the EOQ model: odd couple no more. Management
Accounting 2, 54–57.
King, R.A. (1988). Overcoming manufacturing myopia. Journal of Business Strategy
9/10, 60–62.
Kimani, C. W. (2013). Supply Chain Management Challenges in Kenya Petroleum
Industry: Case of National Oil Corporation of Kenya, International Journal of
Social Sciences and Entrepreneurship, 1 (3), 231-246.
Kumar, C.S. et al. (2006). Literature Review of J-I-T-Kanban System. International
Kumar, V., Garg, D. and Mehta, N.P. (2001). JIT based quality management in Indian
industries: prospectus and future directions”, National Conference Supply
Chain Management, Institute of Public Enterprise, Hyderabad, January 19- 20,
pp: 73-80.
Majchrzak, A. (1988). The Human Side of Factory Automation, Jossey-Bass, San
Francisco, CA.
Majima, I. (1992). The Shift to JIT - How people make the difference. Productivity
Press.
Manoochehri, G.H. (1985). Improving productivity with the Just-In-Time system.
Journal of Systems Management, pages 23-26, Jan 1985.
Mast, T. (2005).Oil and Its Alternatives: Why They Are So Important.
Mecheo, J., & Omiti, J. (2003). Petroleum Market Structure and Pricing Following
Deregulation. Institute of Policy Analysis and Research.
Monden, Y. (1981). What makes the Toyota production system really tick? Industrial
Engineering 1, 36–46.
Mugenda O.M.& Mugenda A.G. (2003). Research Methods Qualitative and
Quantitative Approaches, Laba-Graphics Services, Nairobi, Kenya.

49
Mugenda, O. M. (1999). Research Methods: Quantitative and Qualitative
Approaches. African Centre for Technology Studies.
Nation Master. (2009). Energy Statistics. Retrieved March 07, 2012,
from http://www.nationmaster.com/red/graph/ene_oil_conenergyoilconsumpti
on&b_printable=1.
Petroleum Institute of East Africa (PIEA) (2011). Oil Market Information database.
Online subscription database.
Pilcher, R. (1992). Principles of Construction Management. McGraw-Hill Book
Company Europe.
Rolls-Royce. Design for Economic Manufacture. Anals of CIRP, 35(1):93-94, 1986.
Schniederjans, M.J. (1993). Topics in Just-In-Time Management. Allyn and Bacon.
Schonberger, R.J. (1987). World Class Manufacturing Casebook: Implementing JIT
and TQC, Free Press. New York.
Snell, S.A., Dean Jr., J.W. (1992). Integrated manufacturing and human resource
management: a human capital perspective. Academy of Management Journal
35 (3), 467–504.
Stabell, C. (2001).New Models for Value Creation and Competitive Advantage in the
Petroleum Industry. Nordberg: Norwegian School of Management BI.
Venkatesan, R. (1990). Cummins Engine flexes its factory. Harvard Business Review,
pages 120-127, Mar-Apr 1990.
Vokurka, R.J. and Davis, R.A. (1996). Just-in-time: the evolution of a philosophy.
Production and Inventory Management Journal 37 (2), 56–59.
Wafa, M.A., Yasin, M.M. (1998). A conceptual framework for effective
implementation of JIT: an empirical investigation. International Journal of
Operations and Production Management18 (11), 1111–1124.
Yasin, M.M., Small, M. and Wafa, M.A. (1997). An empirical investigation of JIT
effectiveness: an organizational perspective. Omega, International Journal of
Management Science 25 (4), 461–471.
Young, S.M., Shields, M.D., Wolf, G., 1988. Manufacturing controls and
performance: an experiment. Accounting, Organizations and Society 13 (6),
607–618.
Your dictionary (2012).Take-Or-Pay Agreement. Retrieved April 15, 2012,
fromhttp://business.yourdictionary.com/take-or-pay-agreement.
Zipkin, P.H. (1991). Does manufacturing need a JIT revolution? Harvard Business
Review 1/2, 40–50.

50
APPENDICES
APPENDIX I: LETTER TO THE RESPONDENTS

51
APPENDIX II: RESEARCH QUESTIONNAIRE
This questionnaire aims at collecting information and data for academic use by the
researcher. Your kind participation will go a long way in providing useful information
required to complete this research. The information provided will be treated in
confidence. You need not indicate your name.
Please answer the questions precisely and objectively.
PART A: Background Information
Please tick (√) or fill the gaps as appropriate
1. What is your designation in your Company?
……………………………………………………………………..
2. What is the ownership status of your Company?
Local.....................
Foreign.................
Both......................
3. How many branches does your company have in Kenya?
0-20....................................
21-40..................................
41-60..................................
61 -80............................... ..
81 or more...........................
4. How long has your firm been in operation in Kenya (In Years):
......................................................
PART B
Section 1: The extent of Just in Time (JIT) techniques application
5. Do you have any prior knowledge of JIT production system?

52
Yes [ ] No [ ]
6. Is your Company implementing JIT?
Yes [ ] No [ ]
If no, give reasons for your answer
………………………………………………………………………………………
………………………………………………………………………………………
……………………………………………………………………………………..
7. How do you rate the JIT efforts in your company?
Very small ( ) Small ( ) moderate ( )
Great ( ) Very great ( )
8. In JIT environment the following aspects of JIT are practiced. Rate them
according to the extent to which they are practiced in your company where;
1=very low extent, 2=low extent, 3=moderate, 4= high extent, 5= very high extent

53
Aspects of JIT 1 2 3 4 5
Flexible workforce.
Work in progress reduction.
Production simplification.
Preventive maintenance.
Statistical process control.
Set-up time reduction.
Continuous improvement.
JIT purchasing.
Work team quality control.
Standard containers.
Group technology.
Smoothed line production.
Parallel line production.
U-shaped line production.
Kanban card information circulation system.
Section 2: The determinants of Just in Time (JIT) adoption in major oil companies
in Kenya.
9. To what extent does top management provide expertise in JIT implementation
Very small extent ( ) Small extent ( ) Moderate extent ( )
Great extent ( ) Very great extent ( )
10. Rank the influence of the following factors on JIT in your company according your
level of agreement, where; 1 = strongly disagree 2 = disagree, 3 = Neutral, 4 = Agree,
5 = strongly agree
Factors 1 2 3 4 5
i. JIT adoption involves integration of all functions of the

54
organization
ii. JIT adoption entails better management control
iii. JIT adoption enhance customer service
iv. JIT adoption enhance costs reduction
v. JIT adoption improves business processes
vi. A sufficient budget has been allocated for purposes of JIT
training.
7 8 9 10 11
vii. My competencies on the use of the JIT have contributed to
increased efficiency in this organization.
8 9 10 11 12
viii. Training in JIT has improved performance 9 10 11 12 13
ix. The organization does not have competent personnel to
effectively maintain the JIT system.
10 11 12 13 14
x. Good performance can be attributed to adequate training on
JIT.
11 12 13 14 15
xi. There is a department concerned with ultimate control and
operation of JIT
xii. There is a project team in charge of JIT implementation
xiii. The team has been able to deliver as per the stipulated time
schedule in JIT implementation
xiv. The Managing Director enhances the running of JIT
xv. JIT system is compatible with other Information technology
systems
xvi. The adequacy of the security system of JIT in this
organization is sufficient
xvii. There are no loopholes in the JIT system security in this
organization
xviii. There are issues of confidentiality to unauthorized personnel
xix. There are no sufficient measures to retrieve lost data.
xx. The cost of the system security exceeds the monetary benefits
accruing from the system

55
xxi. Others
…………………………………………………………………
…..
Section 3: The effect of Just in Time (JIT) adoption on performance of major oil
companies in Kenya.
12 Indicate the extent to which your organization experienced the following
performance indicators as a result of implementation of Just In Time (JIT)
techniques (use scale where 1 = Very small extent 2 = Small extent, 3 = moderate
extent, 4 = Great extent, 5 = Very great extent.
Performance indicators
1 2 3 4 5
i. Employees are clear about organization’s vision and strategy
ii. Employees are regularly provided with training in their areas
of work
iii. Employees are regularly provided with training in their areas
of work
iv. Employees have the skills and knowledge to do their job well
v. Managers/supervisors give people the authority they need to
do their work effectively
vi. Team work exists within the organization
vii. Management provides good leadership for employees
viii. Customers are satisfied with our organizations performance
ix. The organization enjoys a good reputation with stakeholders
such as the Government and partners
x. The organization enjoys a good reputation with other partners
xi. Organization promptly resolves customer complaints.
xii. Over the past years, the organization has shown steady,
reduction in cost.
xiii. The organization currently has audited financial reports
xiv. The organization has seen an increase in profits
xv. The organization is able to achieve objectives within their
budgets
xvi. The organization has clearly documented procedures
xvii. Employees are clear about the values required for the
organization to be successful

56
xviii. The organization has implemented new innovations in the past
6 months
xix. The organization’s structure helps different
departments/regions to work together effectively
xx. The organization adapts well to changes in the internal
environment
xxi. The organization adapts well to changes in the external
environment
xxii. Others
………………………………………………………………………….
Thankyou for your Cooperation!!

57
APPENDIX III: LIST OF OIL COMPANIES IN KENYA
1. BAKRI int
2. ENGEN int
3. FOSSIL local 2003
4. GALANA local
5. GAPCO int 1990 mid
6. GULF int
7. HASHI local 1991
8. HASS int 1997
9. KENOLKOBIL over 50 years
10. LIBYAOIL int 2006
11. NOCK local 1981
12. OILCOM int 1990
13. RIVAPET local 1996
14. SHELL int 1900
15. TOTAL int 1955
Source: PIEA, March 2011