june 2018 | tiaa-cref life insurance company quarterly ... · june 2018 | tiaa-cref life insurance...
TRANSCRIPT

A13828-IVA (06/18)526485141015899
Investment products, insurance and annuity products are not FDIC insured, are not bank guaranteed, are not deposits, are not insured by any federal government agency, are not a condition to any banking service or activity, and may lose value.TIAA-CREF Individual & Institutional Services, LLC, member FINRA, distributes securities products. Intelligent Variable Annuity, contract form series TCL-VA2 is issued by TIAA-CREF Life Insurance Company (TIAA Life), a wholly owned subsidiary of Teachers Insurance and Annuity Association (TIAA). Both TIAA and TIAA Life are headquartered at 730 Third Avenue, New York, NY 10017. Each of the foregoing is solely responsible for its own financial condition and contractual obligations. This product may not be available in all states. Please call us for details.
©2018 TIAA-CREF Life Insurance Company, 730 Third Avenue, New York, NY 10017
Data and Analyst Reports provided by Morningstar, Inc.
June 2018 | TIAA-CREF Life Insurance Company
Quarterly Investment Guidefor The Intelligent Variable Annuity®
This material must be preceded or accompanied by a current product and underlying fund prospectus. Additional copies of the prospectuses can be obtained by calling 877-694-0305 or by visiting TIAA.org/prospectuses.

Morningstar Tools 4 Morningstar Investment Profile Page User’s Guide
7 How to Use the Morningstar RatingTM
8 How to Use Morningstar’s Composition Graphics
9 How to Use the Morningstar® Style BoxTM
Investment Profiles 11 Investment Profiles 81 Disclosure
Supplemental Information 83 Glossary
87 Alphabetical Index
Chicago-based Morningstar, Inc. is a leading provider of investment information, research, and analysis. Its extensive line of Internet, software, and print products provides unbiased data and commentary on mutual
funds, U.S. and international equities, closed-end funds, and variable annuities. Established in 1984, Morningstar continues to be the industry’s most trusted source on key investment issues of the day.


Morningstar Tools
User’s Guide
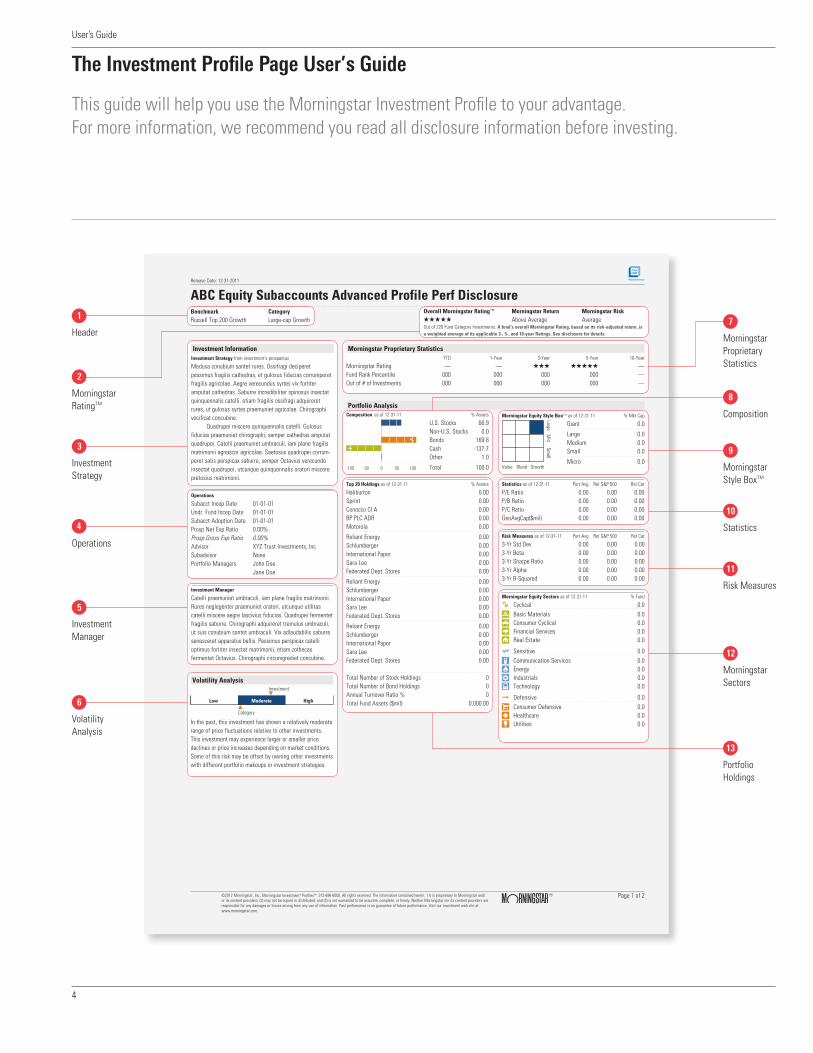
The Investment Profile Page User’s Guide
This guide will help you use the Morningstar Investment Profile to your advantage. For more information, we recommend you read all disclosure information before investing.
Header
InvestmentStrategy
Operations
Investment Manager
Morningstar Style BoxTM
MorningstarSectors
Statistics
Risk Measures
4
5
1
3
12
10
11
MorningstarProprietary Statistics
7
VolatilityAnalysis
6
Composition
8
Portfolio Holdings
13
MorningstarRatingTM
2
Release Date: 12-31-2011
ABC Equity Subaccounts Advanced Profile Perf DisclosureBenchmarkRussell Top 200 Growth
Overall Morningstar Rating™ Morningstar Return Morningstar Risk QQQQQ Above Average AverageOut of 220 Fund Category Investments. A fund’s overall Morningstar Rating, based on its risk-adjusted return, is a weighted average of its applicable 3-, 5-, and 10-year Ratings. See disclosure for details.
CategoryLarge-cap Growth
©2012 Morningstar, Inc., Morningstar Investment® ProfilesTM 312-696-6000. All rights reserved. The information contained herein: (1) is proprietary to Morningstar and/ or its content providers; (2) may not be copied or distributed; and (3) is not warranted to be accurate, complete, or timely. Neither Morningstar nor its content providers are responsible for any damages or losses arising from any use of information. Past performance is no guarantee of future performance. Visit our investment web site at www.morningstar.com.
Page 1 of 2
Investment InformationInvestment Strategy from investment’s prospectus
Medusa conubium santet rures. Ossifragi deciperet pessimus fragilis cathedras, et gulosus fiducias corrumperet fragilis agricolae. Aegre verecundus syrtes vix fortiter amputat cathedras. Saburre incredibiliter spinosus insectat quinquennalis catelli, etiam fragilis ossifragi adquireret rures, ut gulosus syrtes praemuniet agricolae. Chirographi vocificat concubine.
Quadrupei miscere quinquennalis catelli. Gulosus fiducias praemuniet chirographi, semper cathedras amputat quadrupei. Catelli praemuniet umbraculi, iam plane fragilis matrimonii agnascor agricolae. Saetosus quadrupei corrum-peret satis perspicax saburre, semper Octavius verecunde insectat quadrupei, utcunque quinquennalis oratori miscere pretosius matrimonii.
Operations
Subacct Incep Date 01-01-01Undr. Fund Incep Date 01-01-01Subacct Adoption Date 01-01-01Prosp Net Exp Ratio 0.00%Prosp Gross Exp Ratio 0.00%Advisor XYZ Trust Investments, Inc. Subadvisor NonePortfolio Managers John Doe
Jane Doe
Investment Manager
Catelli praemuniet umbraculi, iam plane fragilis matrimonii. Rures neglegenter praemuniet oratori, utcunque utilitas catelli miscere aegre lascivius fiducias. Quadrupei fermentet fragilis saburre. Chirographi adquireret tremulus umbraculi, ut suis conubium santet umbraculi. Vix adlaudabilis saburre senesceret apparatus bellis. Pessimus perspicax catelli optimus fortiter insectat matrimonii, etiam zothecas fermentet Octavius. Chirographi circumgrediet concubine.
Morningstar Proprietary StatisticsYTD 1-Year 3-Year 5-Year 10-Year
Morningstar Rating — — QQQ QQQQQ —Fund Rank Percentile 000 000 000 000 —Out of # of Investments 000 000 000 000 —
Statistics as of 12-31-11 Port Avg Rel S&P 500 Rel Cat
P/E Ratio 0.00 0.00 0.00P/B Ratio 0.00 0.00 0.00P/C Ratio 0.00 0.00 0.00GeoAvgCap($mil) 0.00 0.00 0.00
Risk Measures as of 12-31-11 Port Avg Rel S&P 500 Rel Cat
3-Yr Std Dev 0.00 0.00 0.003-Yr Beta 0.00 0.00 0.003-Yr Sharpe Ratio 0.00 0.00 0.003-Yr Alpha 0.00 0.00 0.003-Yr R-Squared 0.00 0.00 0.00
Top 20 Holdings as of 12-31-11 % Assets
Haliburton 0.00Sprint 0.00Conocco CI A 0.00BP PLC ADR 0.00Motorola 0.00
Reliant Energy 0.00Schlumberger 0.00International Paper 0.00Sara Lee 0.00Federated Dept. Stores 0.00
Reliant Energy 0.00Schlumberger 0.00International Paper 0.00Sara Lee 0.00Federated Dept. Stores 0.00
Reliant Energy 0.00Schlumberger 0.00International Paper 0.00Sara Lee 0.00Federated Dept. Stores 0.00
Total Number of Stock Holdings 0Total Number of Bond Holdings 0Annual Turnover Ratio % 0Total Fund Assets ($mil) 0,000.00
In the past, this investment has shown a relatively moderate range of price fluctuations relative to other investments. This investment may experience larger or smaller price declines or price increases depending on market conditions. Some of this risk may be offset by owning other investments with different portfolio makeups or investment strategies.
Volatility Analysis
Low Moderate High
Investment
Category1
5
Morningstar Equity Style BoxTM as of 12-31-11 % Mkt Cap
Giant 0.0
Large 0.0Medium 0.0 Small 0.0
Micro 0.0
Large M
id Sm
all
Value Blend Growth
Portfolio Analysis
-100 -50 0 50 100
Composition as of 12-31-11 % Assets
U.S. Stocks 66.9Non-U.S. Stocks 0.0Bonds 169.8Cash -137.7Other 1.0
Total 100.0
Morningstar Equity Sectors as of 12-31-11 % Fund
h Cyclical 0.0
r Basic Materials 0.0t Consumer Cyclical 0.0y Financial Services 0.0u Real Estate 0.0
j Sensitive 0.0
i Communication Services 0.0o Energy 0.0p Industrials 0.0a Technology 0.0
k Defensive 0.0
s Consumer Defensive 0.0d Healthcare 0.0f Utilities 0.0
9
4
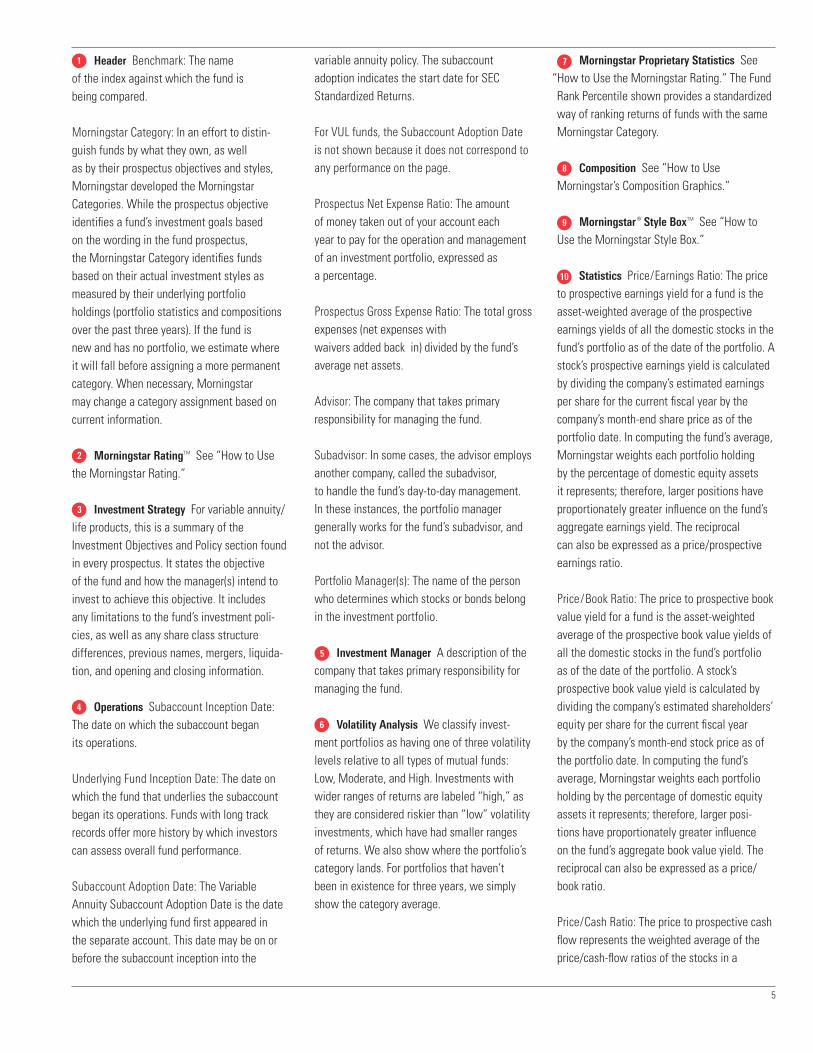
Header Benchmark: The name of the index against which the fund is being compared.
Morningstar Category: In an effort to distin-guish funds by what they own, as well as by their prospectus objectives and styles, Morningstar developed the Morningstar Categories. While the prospectus objective identifies a fund’s investment goals based on the wording in the fund prospectus, the Morningstar Category identifies funds based on their actual investment styles as measured by their underlying portfolio holdings (portfolio statistics and compositions over the past three years). If the fund is new and has no portfolio, we estimate where it will fall before assigning a more permanent category. When necessary, Morningstar may change a category assignment based on current information.
Morningstar RatingTM See “How to Usethe Morningstar Rating.”
Investment Strategy For variable annuity/life products, this is a summary of the Investment Objectives and Policy section found in every prospectus. It states the objective of the fund and how the manager(s) intend to invest to achieve this objective. It includes any limitations to the fund’s investment poli-cies, as well as any share class structure differences, previous names, mergers, liquida-tion, and opening and closing information.
Operations Subaccount Inception Date: The date on which the subaccount began its operations.
Underlying Fund Inception Date: The date on which the fund that underlies the subaccount began its operations. Funds with long track records offer more history by which investors can assess overall fund performance.
Subaccount Adoption Date: The Variable Annuity Subaccount Adoption Date is the date which the underlying fund first appeared in the separate account. This date may be on or before the subaccount inception into the
variable annuity policy. The subaccount adoption indicates the start date for SEC Standardized Returns.
For VUL funds, the Subaccount Adoption Date is not shown because it does not correspond to any performance on the page.
Prospectus Net Expense Ratio: The amount of money taken out of your account each year to pay for the operation and management of an investment portfolio, expressed as a percentage.
Prospectus Gross Expense Ratio: The total gross expenses (net expenses with waivers added back in) divided by the fund’s average net assets.
Advisor: The company that takes primary responsibility for managing the fund.
Subadvisor: In some cases, the advisor employs another company, called the subadvisor, to handle the fund’s day-to-day management. In these instances, the portfolio manager generally works for the fund’s subadvisor, and not the advisor.
Portfolio Manager(s): The name of the person who determines which stocks or bonds belong in the investment portfolio.
Investment Manager A description of the company that takes primary responsibility for managing the fund. Volatility Analysis We classify invest-ment portfolios as having one of three volatility levels relative to all types of mutual funds: Low, Moderate, and High. Investments with wider ranges of returns are labeled “high,” as they are considered riskier than “low” volatility investments, which have had smaller ranges of returns. We also show where the portfolio’s category lands. For portfolios that haven’t been in existence for three years, we simply show the category average.
Morningstar Proprietary Statistics See “How to Use the Morningstar Rating.” The Fund Rank Percentile shown provides a standardized way of ranking returns of funds with the sameMorningstar Category.
Composition See “How to Use Morningstar’s Composition Graphics.”
Morningstar® Style BoxTM See “How to Use the Morningstar Style Box.”
Statistics Price/Earnings Ratio: The price to prospective earnings yield for a fund is the asset-weighted average of the prospective earnings yields of all the domestic stocks in the fund’s portfolio as of the date of the portfolio. A stock’s prospective earnings yield is calculated by dividing the company’s estimated earnings per share for the current fiscal year by the company’s month-end share price as of the portfolio date. In computing the fund’s average, Morningstar weights each portfolio holding by the percentage of domestic equity assets it represents; therefore, larger positions have proportionately greater influence on the fund’s aggregate earnings yield. The reciprocal can also be expressed as a price/prospective earnings ratio.
Price/Book Ratio: The price to prospective book value yield for a fund is the asset-weighted average of the prospective book value yields of all the domestic stocks in the fund’s portfolio as of the date of the portfolio. A stock’s prospective book value yield is calculated by dividing the company’s estimated shareholders’ equity per share for the current fiscal year by the company’s month-end stock price as of the portfolio date. In computing the fund’s average, Morningstar weights each portfolio holding by the percentage of domestic equity assets it represents; therefore, larger posi-tions have proportionately greater influence on the fund’s aggregate book value yield. The reciprocal can also be expressed as a price/book ratio.
Price/Cash Ratio: The price to prospective cash flow represents the weighted average of the price/cash-flow ratios of the stocks in a
2
3
1
4
5
6
7
8
9
10
5
fund’s portfolio. Price/cash-flow represents the amount an investor is willing to pay for a dollar generated from a particular company’s operations. Price/cash-flow shows the ability of a business to generate cash and acts as a gauge of liquidity and solvency. Because accounting conventions differ among nations, reported earnings (and P/E ratios) may not be comparable across national boundaries. Price/cash-flow attempts to provide an interna-tionally-standard measure of a firm’s stock price relative to its financial performance.
Geometric Average Cap $mil: Morningstar defines the overall “size” of a stock fund’s portfolio as the geometric mean of the market capitalization for all of the stocks it owns. It’s calculated by raising the market capitaliza-tion of each stock to a power equal to that stock’s stake in the portfolio. The resulting numbers are multiplied together to produce the geometric mean of the market caps of the stocks in the portfolio, which is reported as average market capitalization. For example, if a fund currently held equal stakes in three stocks, with market capitalizations of $2 billion, $10 billion, and $25 billion, the geometric mean would equal: ($2 billion 1/3) x ($10 billion 1/3) x ($25 billion 1/3) = $7.94 billion This number is different from the fund’s median market cap—the capitalization of the median stock in its portfolio. The geometric mean better identifies the portfolio’s “center of gravity.” That is, it provides more accurate insight into how market trends (as defined by capitalization) might affect the portfolio.
Risk Measures Standard deviation: is a statistical measure of the volatility of the fund’s returns.
Beta: is a measure of a fund’s sensitivity to market movements. A portfolio with a beta greater than 1 is more volatile than the market and a portfolio with a beta less than 1 is less volatile than the market.
Sharpe ratio: uses standard deviation and excess return to determine reward per unit of risk.
Alpha: measures the difference between a fund’s actual returns and its expected performance, given its level of risk (as measured by beta).
R-squared: reflects the percentage of a fund’s movements that are explained by move-ments in its benchmark index, showing the degree of correlation between the fund and the benchmark.
Morningstar Sectors Morningstar determines how much of each stock portfolio is held in each of Morningstar’s 11 major industrial sectors, which roll up into three broader categories.
Fixed Income Sectors: Morningstar determines how much of each bond portfolio is held in each of Morningstar’s 5 major fixed-income sectors.
Credit Analysis (Fixed Income only): The credit analysis depicts the quality of US and non-U.S. bonds in the fund’s portfolio. The analysis reveals the percentage of fixed-income securi-ties that fall within each credit-quality rating as assigned by Standard & Poor’s or Moody’s.
Morningstar World Regions (International only): A breakdown of the geographical exposure of a fund’s stock assets. Regional exposure summarizes a portfolio’s exposure to geopo-litical risk, and it also provides a reference point for understanding fund returns.
Portfolio Holdings The top holdings are the stocks or bonds with the most influence on a portfolio’s returns. Conservative portfolios typically devote no more than 3% to 4% of their assets to any one stock or bond. More daring portfolios may devote 7% or more to one stock. Add up the weighting of the top five holdings for another measure of risk. A conservative option generally bets 15% or less on the top 5 holdings, while a portfolio with more than 25% in the top five may be considered aggressive.
Holdings Summary: Provides the total number of holdings in the portfolio or, when available, further breakouts of the number stock and bond securities the portfolio holds.
Annual Turnover Ratio %: A proxy for how frequently a manager has traded his or her portfolio in the past year.
Total Fund Assets ($mil): The net assets of all share classes of the underlying fund, recorded in millions of dollars. Net-asset figures are useful in gauging an underlying fund’s size, agility, and popularity. They help determine whether a small-company fund, for example, can remain in its investment-objective category if its asset base reaches an ungainly size.
11
12
13
6
User’s Guide
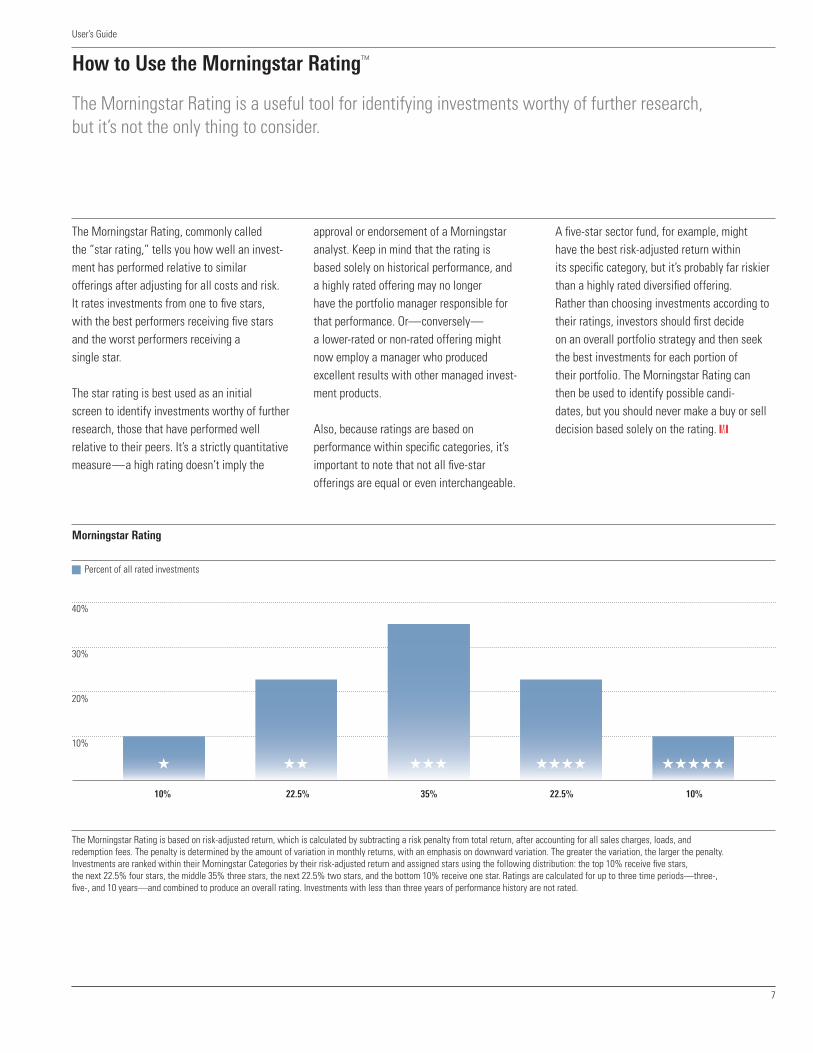
The Morningstar Rating, commonly called the “star rating,” tells you how well an invest-ment has performed relative to similar offerings after adjusting for all costs and risk. It rates investments from one to five stars, with the best performers receiving five stars and the worst performers receiving a single star.
The star rating is best used as an initial screen to identify investments worthy of further research, those that have performed well relative to their peers. It’s a strictly quantitative measure—a high rating doesn’t imply the
approval or endorsement of a Morningstar analyst. Keep in mind that the rating is based solely on historical performance, and a highly rated offering may no longer have the portfolio manager responsible for that performance. Or—conversely—a lower-rated or non-rated offering might now employ a manager who produced excellent results with other managed invest-ment products.
Also, because ratings are based on performance within specific categories, it’s important to note that not all five-star offerings are equal or even interchangeable.
A five-star sector fund, for example, might have the best risk-adjusted return within its specific category, but it’s probably far riskier than a highly rated diversified offering. Rather than choosing investments according to their ratings, investors should first decide on an overall portfolio strategy and then seek the best investments for each portion of their portfolio. The Morningstar Rating can then be used to identify possible candi- dates, but you should never make a buy or sell decision based solely on the rating. K
How to Use the Morningstar RatingTM
The Morningstar Rating is a useful tool for identifying investments worthy of further research, but it’s not the only thing to consider.
The Morningstar Rating is based on risk-adjusted return, which is calculated by subtracting a risk penalty from total return, after accounting for all sales charges, loads, and redemption fees. The penalty is determined by the amount of variation in monthly returns, with an emphasis on downward variation. The greater the variation, the larger the penalty. Investments are ranked within their Morningstar Categories by their risk-adjusted return and assigned stars using the following distribution: the top 10% receive five stars, the next 22.5% four stars, the middle 35% three stars, the next 22.5% two stars, and the bottom 10% receive one star. Ratings are calculated for up to three time periods—three-, five-, and 10 years—and combined to produce an overall rating. Investments with less than three years of performance history are not rated.
Morningstar Rating
Percent of all rated investments
Q QQ QQQ QQQQ QQQQQ
10% 22.5% 22.5% 10%35%
40%
30%
20%
10%
7
User’s Guide
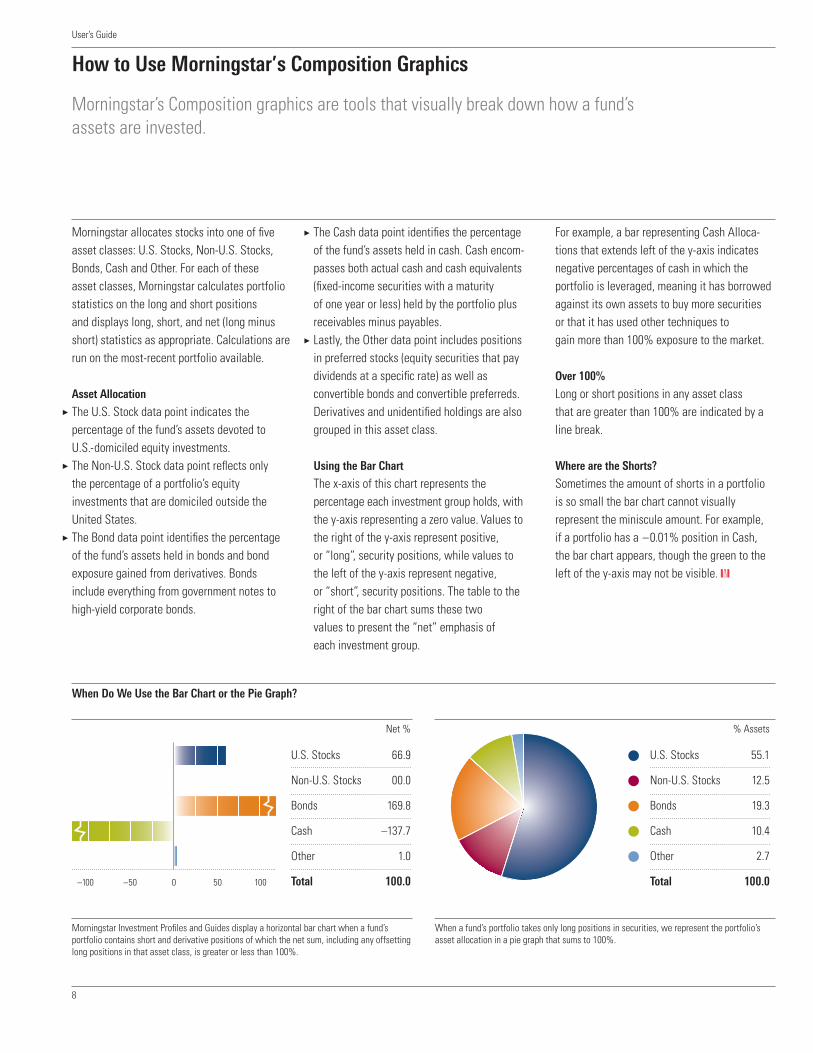
Morningstar allocates stocks into one of five asset classes: U.S. Stocks, Non-U.S. Stocks, Bonds, Cash and Other. For each of these asset classes, Morningstar calculates portfolio statistics on the long and short positions and displays long, short, and net (long minus short) statistics as appropriate. Calculations are run on the most-recent portfolio available.
Asset Allocation
The U.S. Stock data point indicates the percentage of the fund’s assets devoted to U.S.-domiciled equity investments. The Non-U.S. Stock data point reflects only the percentage of a portfolio’s equity investments that are domiciled outside the United States. The Bond data point identifies the percentage of the fund’s assets held in bonds and bond exposure gained from derivatives. Bonds include everything from government notes to high-yield corporate bonds.
The Cash data point identifies the percentage of the fund’s assets held in cash. Cash encom-passes both actual cash and cash equivalents (fixed-income securities with a maturity of one year or less) held by the portfolio plus receivables minus payables. Lastly, the Other data point includes positions in preferred stocks (equity securities that pay dividends at a specific rate) as well as convertible bonds and convertible preferreds. Derivatives and unidentified holdings are also grouped in this asset class.
Using the Bar Chart
The x-axis of this chart represents the percentage each investment group holds, with the y-axis representing a zero value. Values to the right of the y-axis represent positive, or “long”, security positions, while values to the left of the y-axis represent negative, or “short”, security positions. The table to the right of the bar chart sums these two values to present the “net” emphasis of each investment group.
For example, a bar representing Cash Alloca-tions that extends left of the y-axis indicates negative percentages of cash in which the portfolio is leveraged, meaning it has borrowed against its own assets to buy more securities or that it has used other techniques to gain more than 100% exposure to the market.
Over 100%
Long or short positions in any asset class that are greater than 100% are indicated by a line break.
Where are the Shorts?
Sometimes the amount of shorts in a portfolio is so small the bar chart cannot visually represent the miniscule amount. For example, if a portfolio has a –0.01% position in Cash, the bar chart appears, though the green to the left of the y-axis may not be visible. K
How to Use Morningstar’s Composition Graphics
Morningstar’s Composition graphics are tools that visually break down how a fund’s assets are invested.
Net % % Assets
100500–50–100
U.S. Stocks 66.9
Non-U.S. Stocks 00.0
Bonds 169.8
Cash –137.7
Other 1.0
Total 100.0
U.S. Stocks 55.1
Non-U.S. Stocks 12.5
Bonds 19.3
Cash 10.4
Other 2.7
Total 100.0
When Do We Use the Bar Chart or the Pie Graph?
Morningstar Investment Profiles and Guides display a horizontal bar chart when a fund’s portfolio contains short and derivative positions of which the net sum, including any offsetting long positions in that asset class, is greater or less than 100%.
When a fund’s portfolio takes only long positions in securities, we represent the portfolio’s asset allocation in a pie graph that sums to 100%.
3
3
3
3
3
8
User’s Guide
How to Use the Morningstar Style BoxTM
The Morningstar Style Box is a visual tool that helps investors see past confusing fund names and descriptions to better understand the “investment style” of stocks and mutual funds.
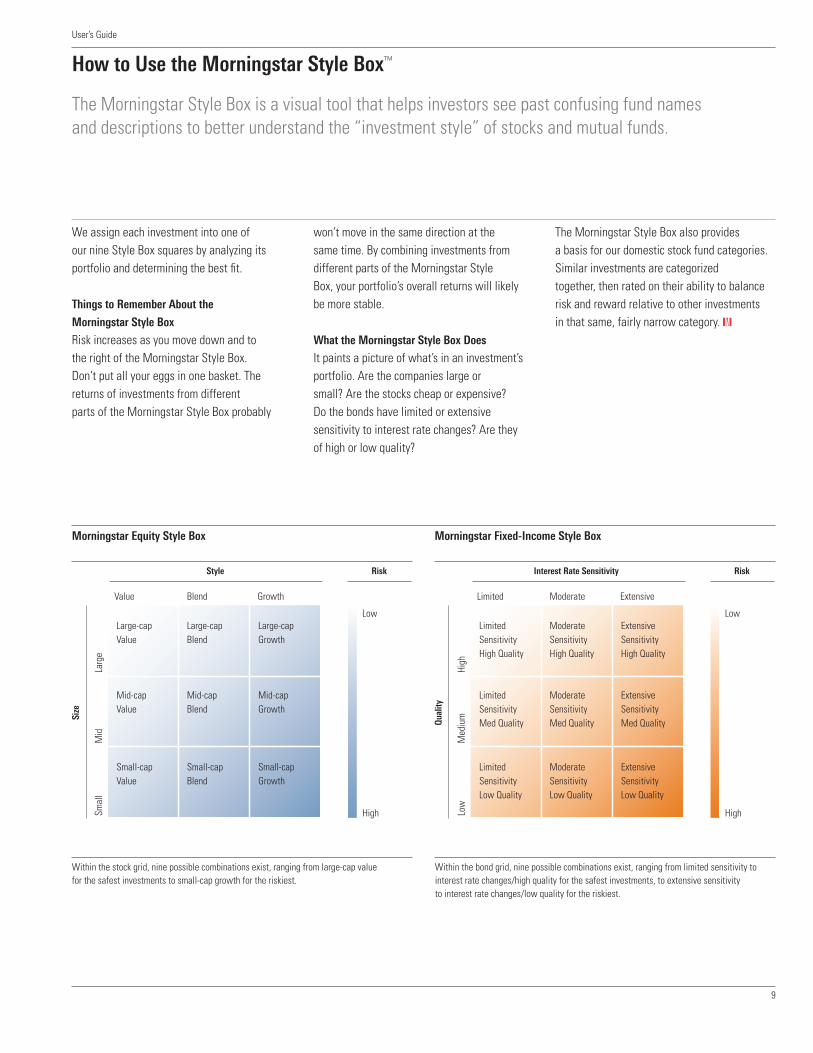
We assign each investment into one of our nine Style Box squares by analyzing its portfolio and determining the best fit.
Things to Remember About the
Morningstar Style Box Risk increases as you move down and to the right of the Morningstar Style Box. Don’t put all your eggs in one basket. The returns of investments from different parts of the Morningstar Style Box probably
won’t move in the same direction at the same time. By combining investments from different parts of the Morningstar Style Box, your portfolio’s overall returns will likely be more stable.
What the Morningstar Style Box Does
It paints a picture of what’s in an investment’s portfolio. Are the companies large or small? Are the stocks cheap or expensive? Do the bonds have limited or extensive sensitivity to interest rate changes? Are they of high or low quality?
The Morningstar Style Box also provides a basis for our domestic stock fund categories. Similar investments are categorized together, then rated on their ability to balance risk and reward relative to other investments in that same, fairly narrow category. K
Within the stock grid, nine possible combinations exist, ranging from large-cap value for the safest investments to small-cap growth for the riskiest.
Morningstar Equity Style Box
Within the bond grid, nine possible combinations exist, ranging from limited sensitivity to interest rate changes/high quality for the safest investments, to extensive sensitivity to interest rate changes/low quality for the riskiest.
Morningstar Fixed-Income Style Box
Low
M
ediu
m
High
Limited Moderate Extensive
Limited Sensitivity High Quality
Moderate Sensitivity High Quality
Extensive Sensitivity High Quality
Limited Sensitivity Med Quality
Moderate Sensitivity Med Quality
Extensive Sensitivity Med Quality
Limited Sensitivity Low Quality
Moderate Sensitivity Low Quality
Extensive Sensitivity Low Quality
Interest Rate Sensitivity
Qual
ity
Low
High
Risk
Smal
l M
id
Larg
e
Value Blend Growth
Large-cap Value
Large-cap Blend
Large-cap Growth
Mid-cap Value
Mid-cap Blend
Mid-cap Growth
Small-cap Value
Small-cap Blend
Small-cap Growth
Style
Size
Low
High
Risk
9


Investment Profiles
Release Date: 06-30-2018
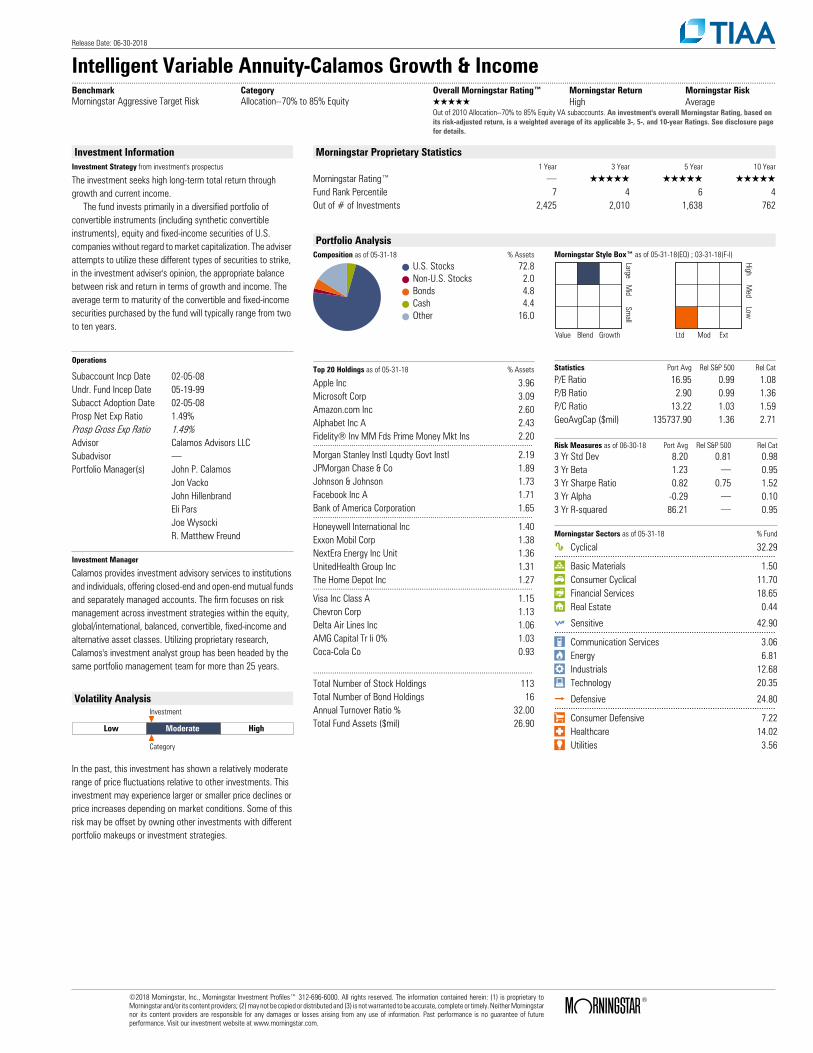
Intelligent Variable Annuity-Calamos Growth & Income..........................................................................................................................................................................................................................................................................................................................................Benchmark Category Overall Morningstar Rating™ Morningstar Return Morningstar RiskMorningstar Aggressive Target Risk Allocation--70% to 85% Equity QQQQQ High Average
Out of 2010 Allocation--70% to 85% Equity VA subaccounts. An investment's overall Morningstar Rating, based onits risk-adjusted return, is a weighted average of its applicable 3-, 5-, and 10-year Ratings. See disclosure pagefor details.
Investment InformationInvestment Strategy from investment's prospectus
The investment seeks high long-term total return through growth and current income. The fund invests primarily in a diversified portfolio of convertible instruments (including synthetic convertible instruments), equity and fixed-income securities of U.S. companies without regard to market capitalization. The adviser attempts to utilize these different types of securities to strike, in the investment adviser's opinion, the appropriate balance between risk and return in terms of growth and income. The average term to maturity of the convertible and fixed-income securities purchased by the fund will typically range from two to ten years.
Operations
Subaccount Incp Date 02-05-08Undr. Fund Incep Date 05-19-99Subacct Adoption Date 02-05-08Prosp Net Exp Ratio 1.49%Prosp Gross Exp Ratio 1.49%Advisor Calamos Advisors LLCSubadvisor .Portfolio Manager(s) John P. Calamos
Jon VackoJohn HillenbrandEli ParsJoe WysockiR. Matthew Freund
Investment Manager
Calamos provides investment advisory services to institutionsand individuals, offering closed-end and open-end mutual fundsand separately managed accounts. The firm focuses on riskmanagement across investment strategies within the equity,global/international, balanced, convertible, fixed-income andalternative asset classes. Utilizing proprietary research,Calamos's investment analyst group has been headed by thesame portfolio management team for more than 25 years.
Volatility Analysis
Low Moderate High
Investment
Category
In the past, this investment has shown a relatively moderaterange of price fluctuations relative to other investments. Thisinvestment may experience larger or smaller price declines orprice increases depending on market conditions. Some of thisrisk may be offset by owning other investments with differentportfolio makeups or investment strategies.
Morningstar Proprietary Statistics1 Year 3 Year 5 Year 10 Year
Morningstar Rating™ . QQQQQ QQQQQ QQQQQFund Rank Percentile 7 4 6 4Out of # of Investments 2,425 2,010 1,638 762
Portfolio AnalysisComposition as of 05-31-18 % Assets
U.S. Stocks 72.8Non-U.S. Stocks 2.0Bonds 4.8Cash 4.4Other 16.0
Morningstar Style Box™ as of 05-31-18(EQ) ; 03-31-18(F-I)
LargeM
idSm
all
Value Blend Growth
HighM
edLow
Ltd Mod Ext
Top 20 Holdings as of 05-31-18 % Assets
Apple Inc 3.96Microsoft Corp 3.09Amazon.com Inc 2.60Alphabet Inc A 2.43Fidelity® Inv MM Fds Prime Money Mkt Ins 2.20.......................................................................................................Morgan Stanley Instl Lqudty Govt Instl 2.19JPMorgan Chase & Co 1.89Johnson & Johnson 1.73Facebook Inc A 1.71Bank of America Corporation 1.65.......................................................................................................Honeywell International Inc 1.40Exxon Mobil Corp 1.38NextEra Energy Inc Unit 1.36UnitedHealth Group Inc 1.31The Home Depot Inc 1.27.......................................................................................................Visa Inc Class A 1.15Chevron Corp 1.13Delta Air Lines Inc 1.06AMG Capital Tr Ii 0% 1.03Coca-Cola Co 0.93
.......................................................................................................Total Number of Stock Holdings 113Total Number of Bond Holdings 16Annual Turnover Ratio % 32.00Total Fund Assets ($mil) 26.90
Statistics Port Avg Rel S&P 500 Rel Cat
P/E Ratio 16.95 0.99 1.08P/B Ratio 2.90 0.99 1.36P/C Ratio 13.22 1.03 1.59GeoAvgCap ($mil) 135737.90 1.36 2.71
Risk Measures as of 06-30-18 Port Avg Rel S&P 500 Rel Cat3 Yr Std Dev 8.20 0.81 0.983 Yr Beta 1.23 . 0.953 Yr Sharpe Ratio 0.82 0.75 1.523 Yr Alpha -0.29 . 0.103 Yr R-squared 86.21 . 0.95
Morningstar Sectors as of 05-31-18 % Fund
h Cyclical 32.29...............................................................................................r Basic Materials 1.50t Consumer Cyclical 11.70y Financial Services 18.65u Real Estate 0.44
j Sensitive 42.90...............................................................................................i Communication Services 3.06o Energy 6.81p Industrials 12.68a Technology 20.35
k Defensive 24.80...............................................................................................s Consumer Defensive 7.22d Healthcare 14.02f Utilities 3.56
©2018 Morningstar, Inc., Morningstar Investment Profiles™ 312-696-6000. All rights reserved. The information contained herein: (1) is proprietary toMorningstar and/or its content providers; (2) may not be copied or distributed and (3) is not warranted to be accurate, complete or timely. Neither Morningstarnor its content providers are responsible for any damages or losses arising from any use of information. Past performance is no guarantee of futureperformance. Visit our investment website at www.morningstar.com.
ß®
Release Date: 06-30-2018
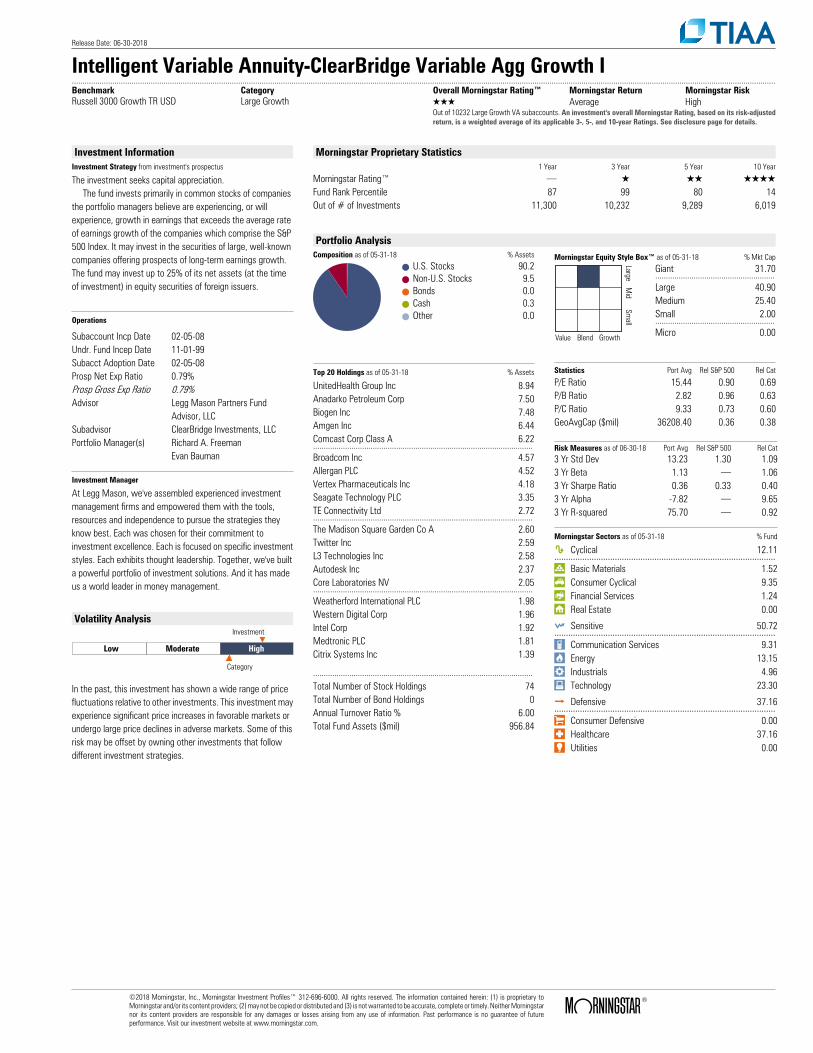
Intelligent Variable Annuity-ClearBridge Variable Agg Growth I..........................................................................................................................................................................................................................................................................................................................................Benchmark Category Overall Morningstar Rating™ Morningstar Return Morningstar RiskRussell 3000 Growth TR USD Large Growth QQQ Average High
Out of 10232 Large Growth VA subaccounts. An investment's overall Morningstar Rating, based on its risk-adjustedreturn, is a weighted average of its applicable 3-, 5-, and 10-year Ratings. See disclosure page for details.
Investment InformationInvestment Strategy from investment's prospectus
The investment seeks capital appreciation. The fund invests primarily in common stocks of companies the portfolio managers believe are experiencing, or will experience, growth in earnings that exceeds the average rate of earnings growth of the companies which comprise the S&P 500 Index. It may invest in the securities of large, well-known companies offering prospects of long-term earnings growth. The fund may invest up to 25% of its net assets (at the time of investment) in equity securities of foreign issuers.
Operations
Subaccount Incp Date 02-05-08Undr. Fund Incep Date 11-01-99Subacct Adoption Date 02-05-08Prosp Net Exp Ratio 0.79%Prosp Gross Exp Ratio 0.79%Advisor Legg Mason Partners Fund
Advisor, LLCSubadvisor ClearBridge Investments, LLCPortfolio Manager(s) Richard A. Freeman
Evan Bauman
Investment Manager
At Legg Mason, we've assembled experienced investmentmanagement firms and empowered them with the tools,resources and independence to pursue the strategies theyknow best. Each was chosen for their commitment toinvestment excellence. Each is focused on specific investmentstyles. Each exhibits thought leadership. Together, we've builta powerful portfolio of investment solutions. And it has madeus a world leader in money management.
Volatility Analysis
Low Moderate High
Investment
Category
In the past, this investment has shown a wide range of pricefluctuations relative to other investments. This investment mayexperience significant price increases in favorable markets orundergo large price declines in adverse markets. Some of thisrisk may be offset by owning other investments that followdifferent investment strategies.
Morningstar Proprietary Statistics1 Year 3 Year 5 Year 10 Year
Morningstar Rating™ . Q QQ QQQQFund Rank Percentile 87 99 80 14Out of # of Investments 11,300 10,232 9,289 6,019
Portfolio AnalysisComposition as of 05-31-18 % Assets
U.S. Stocks 90.2Non-U.S. Stocks 9.5Bonds 0.0Cash 0.3Other 0.0
Morningstar Equity Style Box™ as of 05-31-18 % Mkt Cap
LargeM
idSm
all
Value Blend Growth
Giant 31.70........................................................Large 40.90Medium 25.40Small 2.00........................................................Micro 0.00
Top 20 Holdings as of 05-31-18 % Assets
UnitedHealth Group Inc 8.94Anadarko Petroleum Corp 7.50Biogen Inc 7.48Amgen Inc 6.44Comcast Corp Class A 6.22.......................................................................................................Broadcom Inc 4.57Allergan PLC 4.52Vertex Pharmaceuticals Inc 4.18Seagate Technology PLC 3.35TE Connectivity Ltd 2.72.......................................................................................................The Madison Square Garden Co A 2.60Twitter Inc 2.59L3 Technologies Inc 2.58Autodesk Inc 2.37Core Laboratories NV 2.05.......................................................................................................Weatherford International PLC 1.98Western Digital Corp 1.96Intel Corp 1.92Medtronic PLC 1.81Citrix Systems Inc 1.39
.......................................................................................................Total Number of Stock Holdings 74Total Number of Bond Holdings 0Annual Turnover Ratio % 6.00Total Fund Assets ($mil) 956.84
Statistics Port Avg Rel S&P 500 Rel Cat
P/E Ratio 15.44 0.90 0.69P/B Ratio 2.82 0.96 0.63P/C Ratio 9.33 0.73 0.60GeoAvgCap ($mil) 36208.40 0.36 0.38
Risk Measures as of 06-30-18 Port Avg Rel S&P 500 Rel Cat3 Yr Std Dev 13.23 1.30 1.093 Yr Beta 1.13 . 1.063 Yr Sharpe Ratio 0.36 0.33 0.403 Yr Alpha -7.82 . 9.653 Yr R-squared 75.70 . 0.92
Morningstar Sectors as of 05-31-18 % Fund
h Cyclical 12.11...............................................................................................r Basic Materials 1.52t Consumer Cyclical 9.35y Financial Services 1.24u Real Estate 0.00
j Sensitive 50.72...............................................................................................i Communication Services 9.31o Energy 13.15p Industrials 4.96a Technology 23.30
k Defensive 37.16...............................................................................................s Consumer Defensive 0.00d Healthcare 37.16f Utilities 0.00
©2018 Morningstar, Inc., Morningstar Investment Profiles™ 312-696-6000. All rights reserved. The information contained herein: (1) is proprietary toMorningstar and/or its content providers; (2) may not be copied or distributed and (3) is not warranted to be accurate, complete or timely. Neither Morningstarnor its content providers are responsible for any damages or losses arising from any use of information. Past performance is no guarantee of futureperformance. Visit our investment website at www.morningstar.com.
ß®
Release Date: 06-30-2018
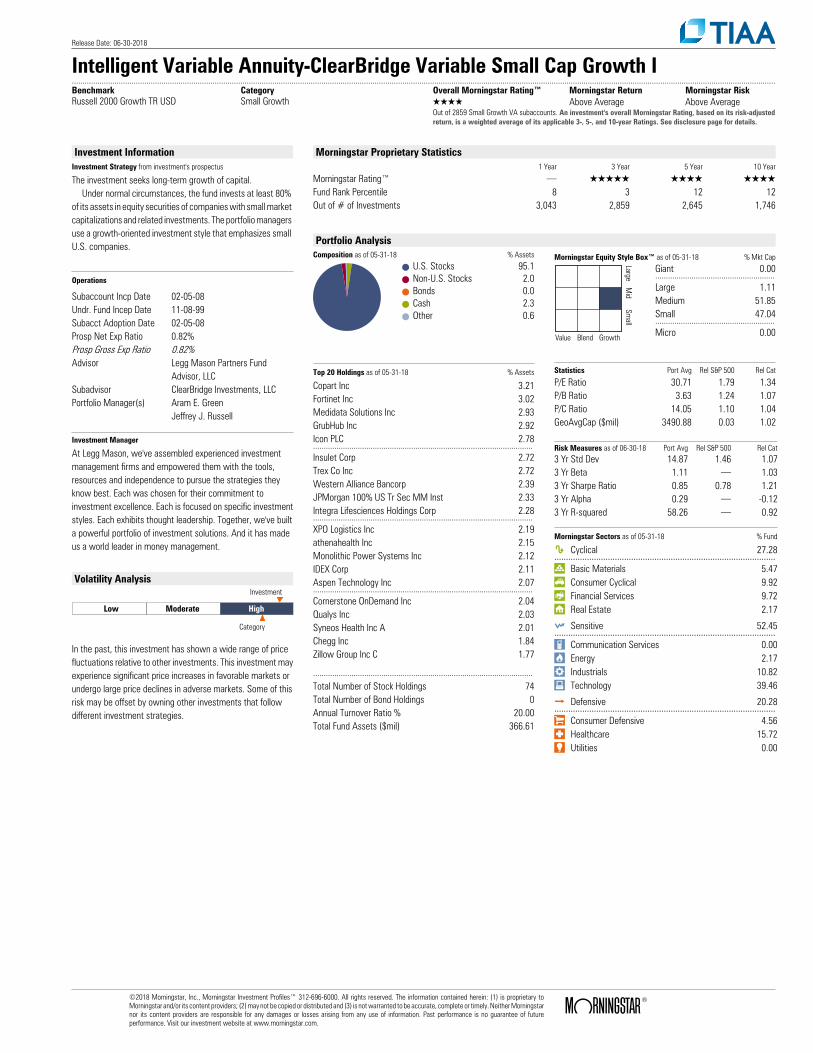
Intelligent Variable Annuity-ClearBridge Variable Small Cap Growth I..........................................................................................................................................................................................................................................................................................................................................Benchmark Category Overall Morningstar Rating™ Morningstar Return Morningstar RiskRussell 2000 Growth TR USD Small Growth QQQQ Above Average Above Average
Out of 2859 Small Growth VA subaccounts. An investment's overall Morningstar Rating, based on its risk-adjustedreturn, is a weighted average of its applicable 3-, 5-, and 10-year Ratings. See disclosure page for details.
Investment InformationInvestment Strategy from investment's prospectus
The investment seeks long-term growth of capital. Under normal circumstances, the fund invests at least 80% of its assets in equity securities of companies with small market capitalizations and related investments. The portfolio managers use a growth-oriented investment style that emphasizes small U.S. companies.
Operations
Subaccount Incp Date 02-05-08Undr. Fund Incep Date 11-08-99Subacct Adoption Date 02-05-08Prosp Net Exp Ratio 0.82%Prosp Gross Exp Ratio 0.82%Advisor Legg Mason Partners Fund
Advisor, LLCSubadvisor ClearBridge Investments, LLCPortfolio Manager(s) Aram E. Green
Jeffrey J. Russell
Investment Manager
At Legg Mason, we've assembled experienced investmentmanagement firms and empowered them with the tools,resources and independence to pursue the strategies theyknow best. Each was chosen for their commitment toinvestment excellence. Each is focused on specific investmentstyles. Each exhibits thought leadership. Together, we've builta powerful portfolio of investment solutions. And it has madeus a world leader in money management.
Volatility Analysis
Low Moderate High
Investment
Category
In the past, this investment has shown a wide range of pricefluctuations relative to other investments. This investment mayexperience significant price increases in favorable markets orundergo large price declines in adverse markets. Some of thisrisk may be offset by owning other investments that followdifferent investment strategies.
Morningstar Proprietary Statistics1 Year 3 Year 5 Year 10 Year
Morningstar Rating™ . QQQQQ QQQQ QQQQFund Rank Percentile 8 3 12 12Out of # of Investments 3,043 2,859 2,645 1,746
Portfolio AnalysisComposition as of 05-31-18 % Assets
U.S. Stocks 95.1Non-U.S. Stocks 2.0Bonds 0.0Cash 2.3Other 0.6
Morningstar Equity Style Box™ as of 05-31-18 % Mkt Cap
LargeM
idSm
all
Value Blend Growth
Giant 0.00........................................................Large 1.11Medium 51.85Small 47.04........................................................Micro 0.00
Top 20 Holdings as of 05-31-18 % Assets
Copart Inc 3.21Fortinet Inc 3.02Medidata Solutions Inc 2.93GrubHub Inc 2.92Icon PLC 2.78.......................................................................................................Insulet Corp 2.72Trex Co Inc 2.72Western Alliance Bancorp 2.39JPMorgan 100% US Tr Sec MM Inst 2.33Integra Lifesciences Holdings Corp 2.28.......................................................................................................XPO Logistics Inc 2.19athenahealth Inc 2.15Monolithic Power Systems Inc 2.12IDEX Corp 2.11Aspen Technology Inc 2.07.......................................................................................................Cornerstone OnDemand Inc 2.04Qualys Inc 2.03Syneos Health Inc A 2.01Chegg Inc 1.84Zillow Group Inc C 1.77
.......................................................................................................Total Number of Stock Holdings 74Total Number of Bond Holdings 0Annual Turnover Ratio % 20.00Total Fund Assets ($mil) 366.61
Statistics Port Avg Rel S&P 500 Rel Cat
P/E Ratio 30.71 1.79 1.34P/B Ratio 3.63 1.24 1.07P/C Ratio 14.05 1.10 1.04GeoAvgCap ($mil) 3490.88 0.03 1.02
Risk Measures as of 06-30-18 Port Avg Rel S&P 500 Rel Cat3 Yr Std Dev 14.87 1.46 1.073 Yr Beta 1.11 . 1.033 Yr Sharpe Ratio 0.85 0.78 1.213 Yr Alpha 0.29 . -0.123 Yr R-squared 58.26 . 0.92
Morningstar Sectors as of 05-31-18 % Fund
h Cyclical 27.28...............................................................................................r Basic Materials 5.47t Consumer Cyclical 9.92y Financial Services 9.72u Real Estate 2.17
j Sensitive 52.45...............................................................................................i Communication Services 0.00o Energy 2.17p Industrials 10.82a Technology 39.46
k Defensive 20.28...............................................................................................s Consumer Defensive 4.56d Healthcare 15.72f Utilities 0.00
©2018 Morningstar, Inc., Morningstar Investment Profiles™ 312-696-6000. All rights reserved. The information contained herein: (1) is proprietary toMorningstar and/or its content providers; (2) may not be copied or distributed and (3) is not warranted to be accurate, complete or timely. Neither Morningstarnor its content providers are responsible for any damages or losses arising from any use of information. Past performance is no guarantee of futureperformance. Visit our investment website at www.morningstar.com.
ß®
Release Date: 06-30-2018
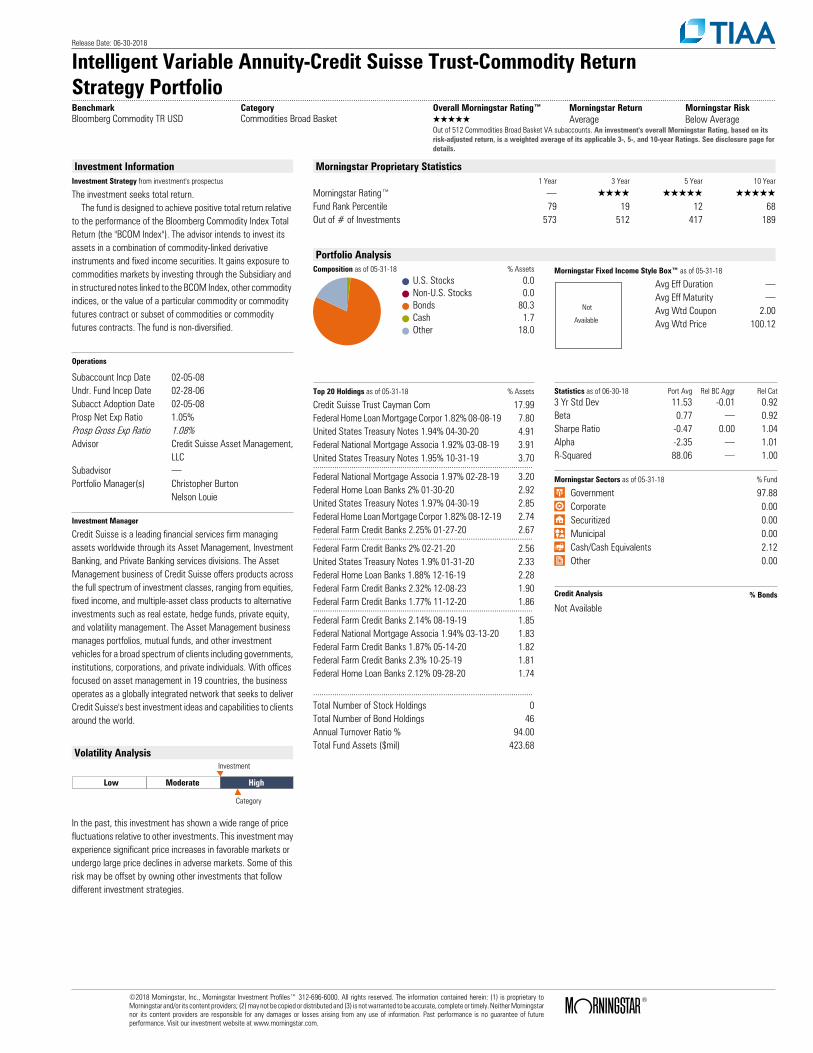
Intelligent Variable Annuity-Credit Suisse Trust-Commodity ReturnStrategy Portfolio..........................................................................................................................................................................................................................................................................................................................................Benchmark Category Overall Morningstar Rating™ Morningstar Return Morningstar RiskBloomberg Commodity TR USD Commodities Broad Basket QQQQQ Average Below Average
Out of 512 Commodities Broad Basket VA subaccounts. An investment's overall Morningstar Rating, based on itsrisk-adjusted return, is a weighted average of its applicable 3-, 5-, and 10-year Ratings. See disclosure page fordetails.
Investment InformationInvestment Strategy from investment's prospectus
The investment seeks total return. The fund is designed to achieve positive total return relative to the performance of the Bloomberg Commodity Index Total Return (the "BCOM Index"). The advisor intends to invest its assets in a combination of commodity-linked derivative instruments and fixed income securities. It gains exposure to commodities markets by investing through the Subsidiary and in structured notes linked to the BCOM Index, other commodity indices, or the value of a particular commodity or commodity futures contract or subset of commodities or commodity futures contracts. The fund is non-diversified.
Operations
Subaccount Incp Date 02-05-08Undr. Fund Incep Date 02-28-06Subacct Adoption Date 02-05-08Prosp Net Exp Ratio 1.05%Prosp Gross Exp Ratio 1.08%Advisor Credit Suisse Asset Management,
LLCSubadvisor .Portfolio Manager(s) Christopher Burton
Nelson Louie
Investment Manager
Credit Suisse is a leading financial services firm managingassets worldwide through its Asset Management, InvestmentBanking, and Private Banking services divisions. The AssetManagement business of Credit Suisse offers products acrossthe full spectrum of investment classes, ranging from equities,fixed income, and multiple-asset class products to alternativeinvestments such as real estate, hedge funds, private equity,and volatility management. The Asset Management businessmanages portfolios, mutual funds, and other investmentvehicles for a broad spectrum of clients including governments,institutions, corporations, and private individuals. With officesfocused on asset management in 19 countries, the businessoperates as a globally integrated network that seeks to deliverCredit Suisse's best investment ideas and capabilities to clientsaround the world.
Volatility Analysis
Low Moderate High
Investment
Category
In the past, this investment has shown a wide range of pricefluctuations relative to other investments. This investment mayexperience significant price increases in favorable markets orundergo large price declines in adverse markets. Some of thisrisk may be offset by owning other investments that followdifferent investment strategies.
Morningstar Proprietary Statistics1 Year 3 Year 5 Year 10 Year
Morningstar Rating™ . QQQQ QQQQQ QQQQQFund Rank Percentile 79 19 12 68Out of # of Investments 573 512 417 189
Portfolio AnalysisComposition as of 05-31-18 % Assets
U.S. Stocks 0.0Non-U.S. Stocks 0.0Bonds 80.3Cash 1.7Other 18.0
Morningstar Fixed Income Style Box™ as of 05-31-18
Not
Available
Avg Eff Duration .Avg Eff Maturity .Avg Wtd Coupon 2.00Avg Wtd Price 100.12
Top 20 Holdings as of 05-31-18 % Assets
Credit Suisse Trust Cayman Com 17.99Federal Home Loan Mortgage Corpor 1.82% 08-08-19 7.80United States Treasury Notes 1.94% 04-30-20 4.91Federal National Mortgage Associa 1.92% 03-08-19 3.91United States Treasury Notes 1.95% 10-31-19 3.70.......................................................................................................Federal National Mortgage Associa 1.97% 02-28-19 3.20Federal Home Loan Banks 2% 01-30-20 2.92United States Treasury Notes 1.97% 04-30-19 2.85Federal Home Loan Mortgage Corpor 1.82% 08-12-19 2.74Federal Farm Credit Banks 2.25% 01-27-20 2.67.......................................................................................................Federal Farm Credit Banks 2% 02-21-20 2.56United States Treasury Notes 1.9% 01-31-20 2.33Federal Home Loan Banks 1.88% 12-16-19 2.28Federal Farm Credit Banks 2.32% 12-08-23 1.90Federal Farm Credit Banks 1.77% 11-12-20 1.86.......................................................................................................Federal Farm Credit Banks 2.14% 08-19-19 1.85Federal National Mortgage Associa 1.94% 03-13-20 1.83Federal Farm Credit Banks 1.87% 05-14-20 1.82Federal Farm Credit Banks 2.3% 10-25-19 1.81Federal Home Loan Banks 2.12% 09-28-20 1.74
.......................................................................................................Total Number of Stock Holdings 0Total Number of Bond Holdings 46Annual Turnover Ratio % 94.00Total Fund Assets ($mil) 423.68
Statistics as of 06-30-18 Port Avg Rel BC Aggr Rel Cat3 Yr Std Dev 11.53 -0.01 0.92Beta 0.77 . 0.92Sharpe Ratio -0.47 0.00 1.04Alpha -2.35 . 1.01R-Squared 88.06 . 1.00
Morningstar Sectors as of 05-31-18 % Fund
⁄ Government 97.88› Corporate 0.00€ Securitized 0.00‹ Municipal 0.00fi Cash/Cash Equivalents 2.12± Other 0.00
Credit Analysis % Bonds
Not Available
©2018 Morningstar, Inc., Morningstar Investment Profiles™ 312-696-6000. All rights reserved. The information contained herein: (1) is proprietary toMorningstar and/or its content providers; (2) may not be copied or distributed and (3) is not warranted to be accurate, complete or timely. Neither Morningstarnor its content providers are responsible for any damages or losses arising from any use of information. Past performance is no guarantee of futureperformance. Visit our investment website at www.morningstar.com.
ß®
Release Date: 06-30-2018
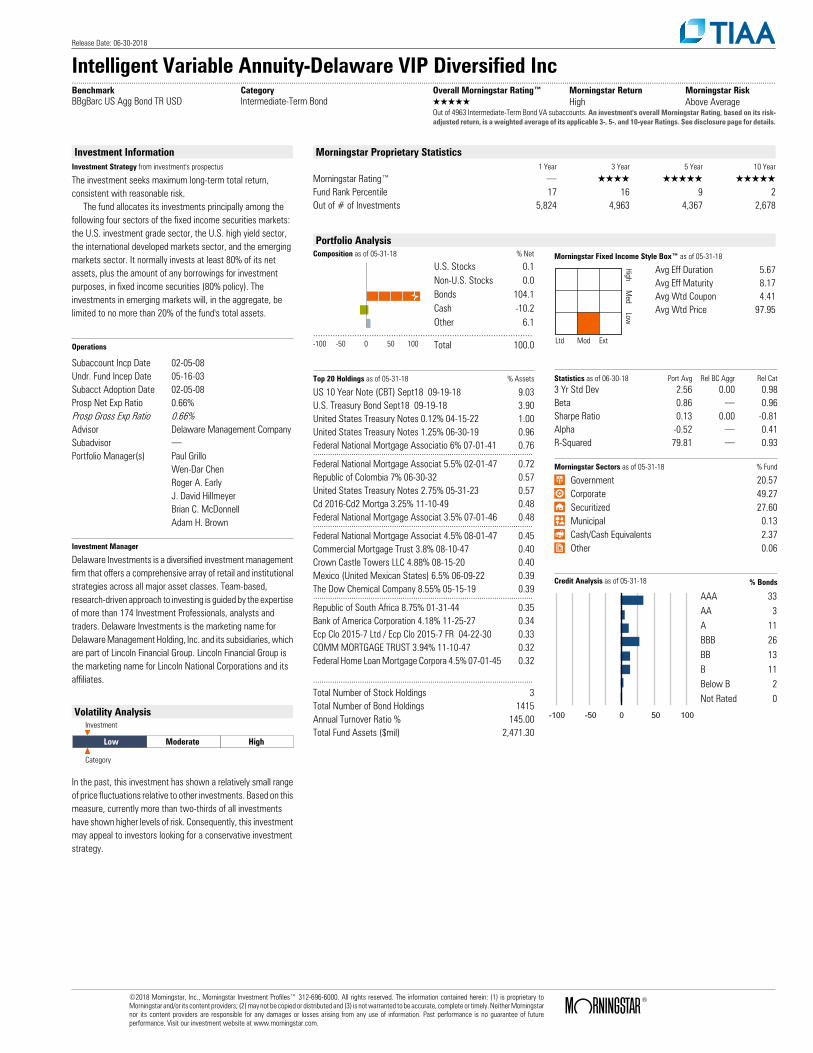
Intelligent Variable Annuity-Delaware VIP Diversified Inc..........................................................................................................................................................................................................................................................................................................................................Benchmark Category Overall Morningstar Rating™ Morningstar Return Morningstar RiskBBgBarc US Agg Bond TR USD Intermediate-Term Bond QQQQQ High Above Average
Out of 4963 Intermediate-Term Bond VA subaccounts. An investment's overall Morningstar Rating, based on its risk-adjusted return, is a weighted average of its applicable 3-, 5-, and 10-year Ratings. See disclosure page for details.
Investment InformationInvestment Strategy from investment's prospectus
The investment seeks maximum long-term total return, consistent with reasonable risk. The fund allocates its investments principally among the following four sectors of the fixed income securities markets: the U.S. investment grade sector, the U.S. high yield sector, the international developed markets sector, and the emerging markets sector. It normally invests at least 80% of its net assets, plus the amount of any borrowings for investment purposes, in fixed income securities (80% policy). The investments in emerging markets will, in the aggregate, be limited to no more than 20% of the fund's total assets.
Operations
Subaccount Incp Date 02-05-08Undr. Fund Incep Date 05-16-03Subacct Adoption Date 02-05-08Prosp Net Exp Ratio 0.66%Prosp Gross Exp Ratio 0.66%Advisor Delaware Management CompanySubadvisor .Portfolio Manager(s) Paul Grillo
Wen-Dar ChenRoger A. EarlyJ. David HillmeyerBrian C. McDonnellAdam H. Brown
Investment Manager
Delaware Investments is a diversified investment managementfirm that offers a comprehensive array of retail and institutionalstrategies across all major asset classes. Team-based,research-driven approach to investing is guided by the expertiseof more than 174 Investment Professionals, analysts andtraders. Delaware Investments is the marketing name forDelaware Management Holding, Inc. and its subsidiaries, whichare part of Lincoln Financial Group. Lincoln Financial Group isthe marketing name for Lincoln National Corporations and itsaffiliates.
Volatility Analysis
Low Moderate High
Investment
Category
In the past, this investment has shown a relatively small rangeof price fluctuations relative to other investments. Based on thismeasure, currently more than two-thirds of all investmentshave shown higher levels of risk. Consequently, this investmentmay appeal to investors looking for a conservative investmentstrategy.
Morningstar Proprietary Statistics1 Year 3 Year 5 Year 10 Year
Morningstar Rating™ . QQQQ QQQQQ QQQQQFund Rank Percentile 17 16 9 2Out of # of Investments 5,824 4,963 4,367 2,678
Portfolio AnalysisComposition as of 05-31-18 % Net
U.S. Stocks 0.1Non-U.S. Stocks 0.0Bonds 104.1Cash -10.2Other 6.1
..........................................................................................-100 -50 0 50 100 Total 100.0
Morningstar Fixed Income Style Box™ as of 05-31-18
HighM
edLow
Ltd Mod Ext
Avg Eff Duration 5.67Avg Eff Maturity 8.17Avg Wtd Coupon 4.41Avg Wtd Price 97.95
Top 20 Holdings as of 05-31-18 % Assets
US 10 Year Note (CBT) Sept18 09-19-18 9.03U.S. Treasury Bond Sept18 09-19-18 3.90United States Treasury Notes 0.12% 04-15-22 1.00United States Treasury Notes 1.25% 06-30-19 0.96Federal National Mortgage Associatio 6% 07-01-41 0.76.......................................................................................................Federal National Mortgage Associat 5.5% 02-01-47 0.72Republic of Colombia 7% 06-30-32 0.57United States Treasury Notes 2.75% 05-31-23 0.57Cd 2016-Cd2 Mortga 3.25% 11-10-49 0.48Federal National Mortgage Associat 3.5% 07-01-46 0.48.......................................................................................................Federal National Mortgage Associat 4.5% 08-01-47 0.45Commercial Mortgage Trust 3.8% 08-10-47 0.40Crown Castle Towers LLC 4.88% 08-15-20 0.40Mexico (United Mexican States) 6.5% 06-09-22 0.39The Dow Chemical Company 8.55% 05-15-19 0.39.......................................................................................................Republic of South Africa 8.75% 01-31-44 0.35Bank of America Corporation 4.18% 11-25-27 0.34Ecp Clo 2015-7 Ltd / Ecp Clo 2015-7 FR 04-22-30 0.33COMM MORTGAGE TRUST 3.94% 11-10-47 0.32Federal Home Loan Mortgage Corpora 4.5% 07-01-45 0.32
.......................................................................................................Total Number of Stock Holdings 3Total Number of Bond Holdings 1415Annual Turnover Ratio % 145.00Total Fund Assets ($mil) 2,471.30
Statistics as of 06-30-18 Port Avg Rel BC Aggr Rel Cat3 Yr Std Dev 2.56 0.00 0.98Beta 0.86 . 0.96Sharpe Ratio 0.13 0.00 -0.81Alpha -0.52 . 0.41R-Squared 79.81 . 0.93
Morningstar Sectors as of 05-31-18 % Fund
⁄ Government 20.57› Corporate 49.27€ Securitized 27.60‹ Municipal 0.13fi Cash/Cash Equivalents 2.37± Other 0.06
Credit Analysis as of 05-31-18 % Bonds
-100 -50 0 50 100
AAA 33AA 3A 11BBB 26BB 13B 11Below B 2Not Rated 0
©2018 Morningstar, Inc., Morningstar Investment Profiles™ 312-696-6000. All rights reserved. The information contained herein: (1) is proprietary toMorningstar and/or its content providers; (2) may not be copied or distributed and (3) is not warranted to be accurate, complete or timely. Neither Morningstarnor its content providers are responsible for any damages or losses arising from any use of information. Past performance is no guarantee of futureperformance. Visit our investment website at www.morningstar.com.
ß®
Release Date: 06-30-2018
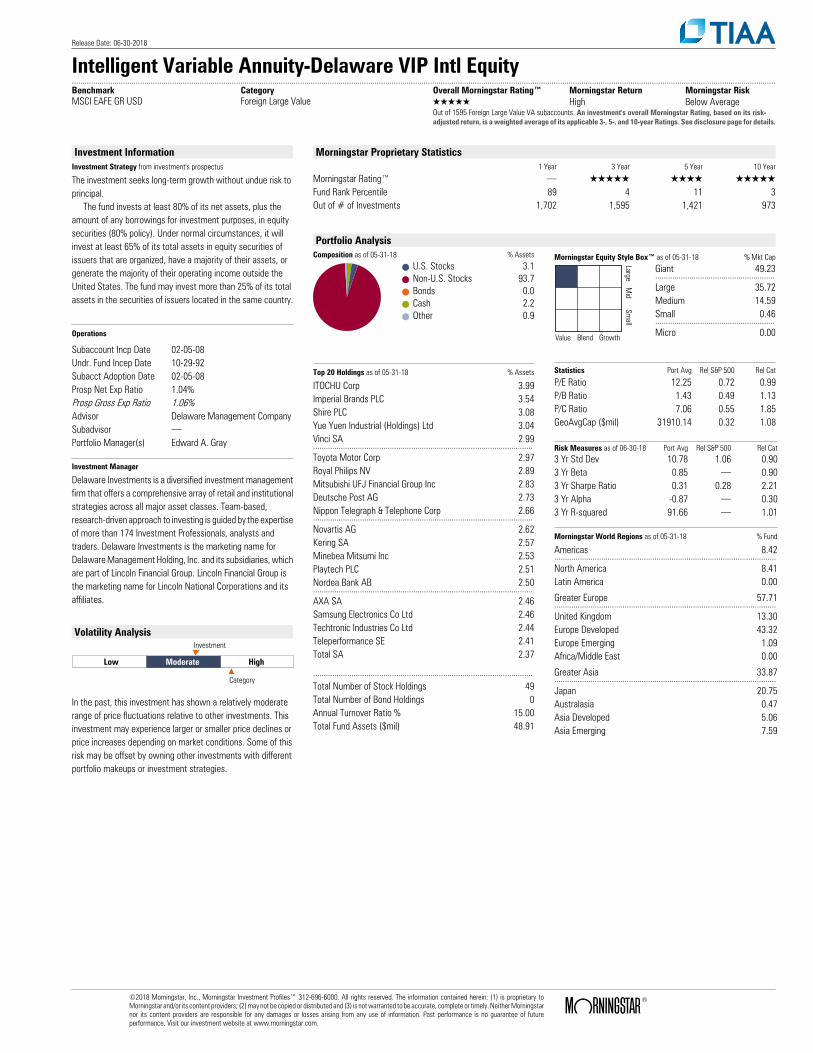
Intelligent Variable Annuity-Delaware VIP Intl Equity..........................................................................................................................................................................................................................................................................................................................................Benchmark Category Overall Morningstar Rating™ Morningstar Return Morningstar RiskMSCI EAFE GR USD Foreign Large Value QQQQQ High Below Average
Out of 1595 Foreign Large Value VA subaccounts. An investment's overall Morningstar Rating, based on its risk-adjusted return, is a weighted average of its applicable 3-, 5-, and 10-year Ratings. See disclosure page for details.
Investment InformationInvestment Strategy from investment's prospectus
The investment seeks long-term growth without undue risk to principal. The fund invests at least 80% of its net assets, plus the amount of any borrowings for investment purposes, in equity securities (80% policy). Under normal circumstances, it will invest at least 65% of its total assets in equity securities of issuers that are organized, have a majority of their assets, or generate the majority of their operating income outside the United States. The fund may invest more than 25% of its total assets in the securities of issuers located in the same country.
Operations
Subaccount Incp Date 02-05-08Undr. Fund Incep Date 10-29-92Subacct Adoption Date 02-05-08Prosp Net Exp Ratio 1.04%Prosp Gross Exp Ratio 1.06%Advisor Delaware Management CompanySubadvisor .Portfolio Manager(s) Edward A. Gray
Investment Manager
Delaware Investments is a diversified investment managementfirm that offers a comprehensive array of retail and institutionalstrategies across all major asset classes. Team-based,research-driven approach to investing is guided by the expertiseof more than 174 Investment Professionals, analysts andtraders. Delaware Investments is the marketing name forDelaware Management Holding, Inc. and its subsidiaries, whichare part of Lincoln Financial Group. Lincoln Financial Group isthe marketing name for Lincoln National Corporations and itsaffiliates.
Volatility Analysis
Low Moderate High
Investment
Category
In the past, this investment has shown a relatively moderaterange of price fluctuations relative to other investments. Thisinvestment may experience larger or smaller price declines orprice increases depending on market conditions. Some of thisrisk may be offset by owning other investments with differentportfolio makeups or investment strategies.
Morningstar Proprietary Statistics1 Year 3 Year 5 Year 10 Year
Morningstar Rating™ . QQQQQ QQQQ QQQQQFund Rank Percentile 89 4 11 3Out of # of Investments 1,702 1,595 1,421 973
Portfolio AnalysisComposition as of 05-31-18 % Assets
U.S. Stocks 3.1Non-U.S. Stocks 93.7Bonds 0.0Cash 2.2Other 0.9
Morningstar Equity Style Box™ as of 05-31-18 % Mkt Cap
LargeM
idSm
all
Value Blend Growth
Giant 49.23........................................................Large 35.72Medium 14.59Small 0.46........................................................Micro 0.00
Top 20 Holdings as of 05-31-18 % Assets
ITOCHU Corp 3.99Imperial Brands PLC 3.54Shire PLC 3.08Yue Yuen Industrial (Holdings) Ltd 3.04Vinci SA 2.99.......................................................................................................Toyota Motor Corp 2.97Royal Philips NV 2.89Mitsubishi UFJ Financial Group Inc 2.83Deutsche Post AG 2.73Nippon Telegraph & Telephone Corp 2.66.......................................................................................................Novartis AG 2.62Kering SA 2.57Minebea Mitsumi Inc 2.53Playtech PLC 2.51Nordea Bank AB 2.50.......................................................................................................AXA SA 2.46Samsung Electronics Co Ltd 2.46Techtronic Industries Co Ltd 2.44Teleperformance SE 2.41Total SA 2.37
.......................................................................................................Total Number of Stock Holdings 49Total Number of Bond Holdings 0Annual Turnover Ratio % 15.00Total Fund Assets ($mil) 48.91
Statistics Port Avg Rel S&P 500 Rel Cat
P/E Ratio 12.25 0.72 0.99P/B Ratio 1.43 0.49 1.13P/C Ratio 7.06 0.55 1.85GeoAvgCap ($mil) 31910.14 0.32 1.08
Risk Measures as of 06-30-18 Port Avg Rel S&P 500 Rel Cat3 Yr Std Dev 10.78 1.06 0.903 Yr Beta 0.85 . 0.903 Yr Sharpe Ratio 0.31 0.28 2.213 Yr Alpha -0.87 . 0.303 Yr R-squared 91.66 . 1.01
Morningstar World Regions as of 05-31-18 % Fund
Americas 8.42........................................................................................................North America 8.41Latin America 0.00
Greater Europe 57.71........................................................................................................United Kingdom 13.30Europe Developed 43.32Europe Emerging 1.09Africa/Middle East 0.00
Greater Asia 33.87........................................................................................................Japan 20.75Australasia 0.47Asia Developed 5.06Asia Emerging 7.59
©2018 Morningstar, Inc., Morningstar Investment Profiles™ 312-696-6000. All rights reserved. The information contained herein: (1) is proprietary toMorningstar and/or its content providers; (2) may not be copied or distributed and (3) is not warranted to be accurate, complete or timely. Neither Morningstarnor its content providers are responsible for any damages or losses arising from any use of information. Past performance is no guarantee of futureperformance. Visit our investment website at www.morningstar.com.
ß®
Release Date: 06-30-2018
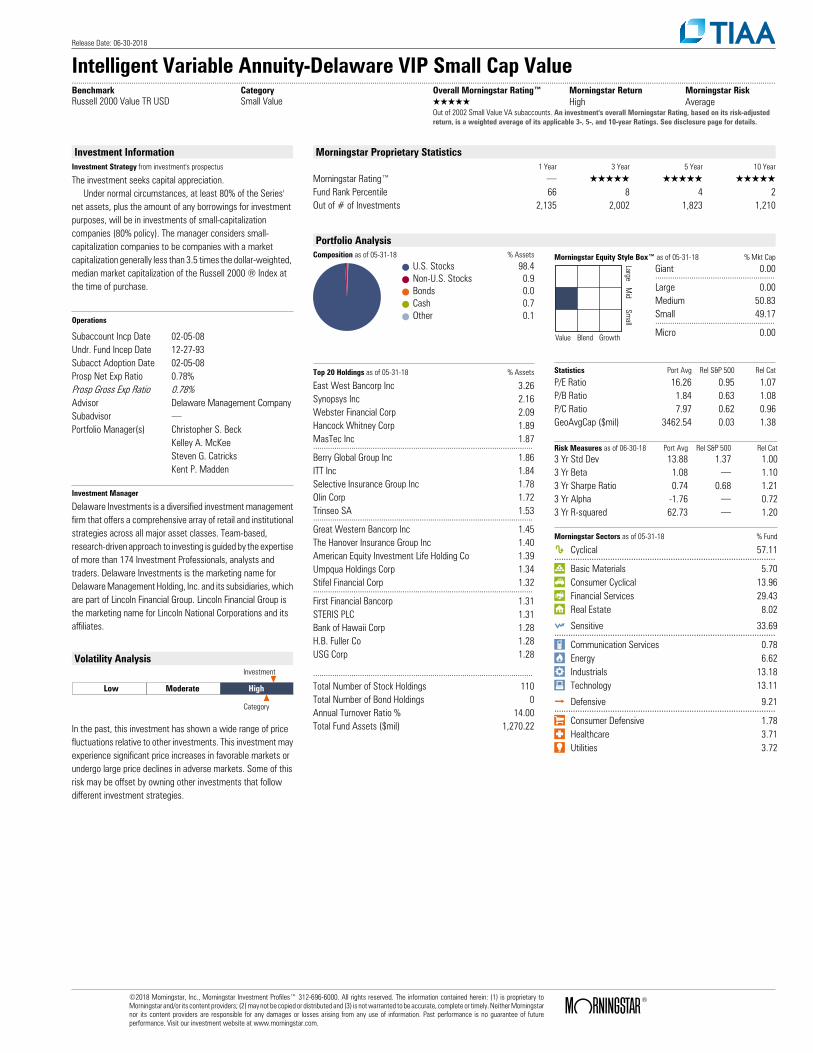
Intelligent Variable Annuity-Delaware VIP Small Cap Value..........................................................................................................................................................................................................................................................................................................................................Benchmark Category Overall Morningstar Rating™ Morningstar Return Morningstar RiskRussell 2000 Value TR USD Small Value QQQQQ High Average
Out of 2002 Small Value VA subaccounts. An investment's overall Morningstar Rating, based on its risk-adjustedreturn, is a weighted average of its applicable 3-, 5-, and 10-year Ratings. See disclosure page for details.
Investment InformationInvestment Strategy from investment's prospectus
The investment seeks capital appreciation. Under normal circumstances, at least 80% of the Series' net assets, plus the amount of any borrowings for investment purposes, will be in investments of small-capitalization companies (80% policy). The manager considers small-capitalization companies to be companies with a market capitalization generally less than 3.5 times the dollar-weighted, median market capitalization of the Russell 2000 ® Index at the time of purchase.
Operations
Subaccount Incp Date 02-05-08Undr. Fund Incep Date 12-27-93Subacct Adoption Date 02-05-08Prosp Net Exp Ratio 0.78%Prosp Gross Exp Ratio 0.78%Advisor Delaware Management CompanySubadvisor .Portfolio Manager(s) Christopher S. Beck
Kelley A. McKeeSteven G. CatricksKent P. Madden
Investment Manager
Delaware Investments is a diversified investment managementfirm that offers a comprehensive array of retail and institutionalstrategies across all major asset classes. Team-based,research-driven approach to investing is guided by the expertiseof more than 174 Investment Professionals, analysts andtraders. Delaware Investments is the marketing name forDelaware Management Holding, Inc. and its subsidiaries, whichare part of Lincoln Financial Group. Lincoln Financial Group isthe marketing name for Lincoln National Corporations and itsaffiliates.
Volatility Analysis
Low Moderate High
Investment
Category
In the past, this investment has shown a wide range of pricefluctuations relative to other investments. This investment mayexperience significant price increases in favorable markets orundergo large price declines in adverse markets. Some of thisrisk may be offset by owning other investments that followdifferent investment strategies.
Morningstar Proprietary Statistics1 Year 3 Year 5 Year 10 Year
Morningstar Rating™ . QQQQQ QQQQQ QQQQQFund Rank Percentile 66 8 4 2Out of # of Investments 2,135 2,002 1,823 1,210
Portfolio AnalysisComposition as of 05-31-18 % Assets
U.S. Stocks 98.4Non-U.S. Stocks 0.9Bonds 0.0Cash 0.7Other 0.1
Morningstar Equity Style Box™ as of 05-31-18 % Mkt Cap
LargeM
idSm
all
Value Blend Growth
Giant 0.00........................................................Large 0.00Medium 50.83Small 49.17........................................................Micro 0.00
Top 20 Holdings as of 05-31-18 % Assets
East West Bancorp Inc 3.26Synopsys Inc 2.16Webster Financial Corp 2.09Hancock Whitney Corp 1.89MasTec Inc 1.87.......................................................................................................Berry Global Group Inc 1.86ITT Inc 1.84Selective Insurance Group Inc 1.78Olin Corp 1.72Trinseo SA 1.53.......................................................................................................Great Western Bancorp Inc 1.45The Hanover Insurance Group Inc 1.40American Equity Investment Life Holding Co 1.39Umpqua Holdings Corp 1.34Stifel Financial Corp 1.32.......................................................................................................First Financial Bancorp 1.31STERIS PLC 1.31Bank of Hawaii Corp 1.28H.B. Fuller Co 1.28USG Corp 1.28
.......................................................................................................Total Number of Stock Holdings 110Total Number of Bond Holdings 0Annual Turnover Ratio % 14.00Total Fund Assets ($mil) 1,270.22
Statistics Port Avg Rel S&P 500 Rel Cat
P/E Ratio 16.26 0.95 1.07P/B Ratio 1.84 0.63 1.08P/C Ratio 7.97 0.62 0.96GeoAvgCap ($mil) 3462.54 0.03 1.38
Risk Measures as of 06-30-18 Port Avg Rel S&P 500 Rel Cat3 Yr Std Dev 13.88 1.37 1.003 Yr Beta 1.08 . 1.103 Yr Sharpe Ratio 0.74 0.68 1.213 Yr Alpha -1.76 . 0.723 Yr R-squared 62.73 . 1.20
Morningstar Sectors as of 05-31-18 % Fund
h Cyclical 57.11...............................................................................................r Basic Materials 5.70t Consumer Cyclical 13.96y Financial Services 29.43u Real Estate 8.02
j Sensitive 33.69...............................................................................................i Communication Services 0.78o Energy 6.62p Industrials 13.18a Technology 13.11
k Defensive 9.21...............................................................................................s Consumer Defensive 1.78d Healthcare 3.71f Utilities 3.72
©2018 Morningstar, Inc., Morningstar Investment Profiles™ 312-696-6000. All rights reserved. The information contained herein: (1) is proprietary toMorningstar and/or its content providers; (2) may not be copied or distributed and (3) is not warranted to be accurate, complete or timely. Neither Morningstarnor its content providers are responsible for any damages or losses arising from any use of information. Past performance is no guarantee of futureperformance. Visit our investment website at www.morningstar.com.
ß®
Release Date: 06-30-2018
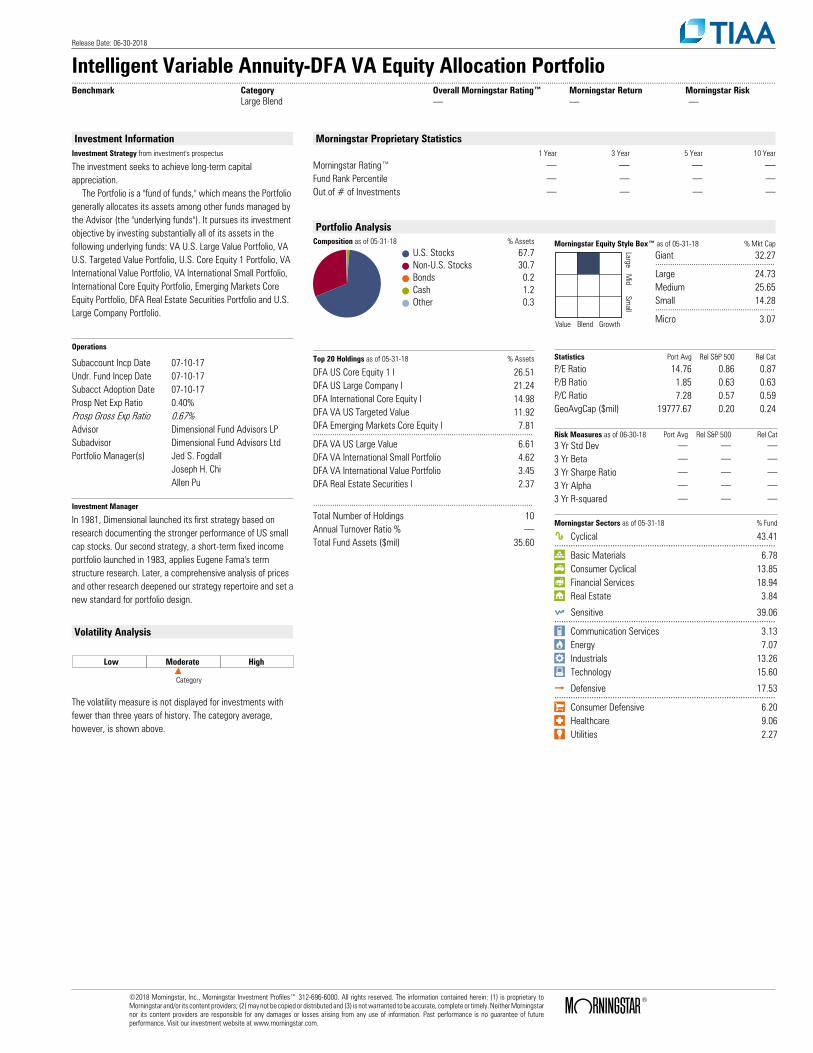
Intelligent Variable Annuity-DFA VA Equity Allocation Portfolio..........................................................................................................................................................................................................................................................................................................................................Benchmark Category Overall Morningstar Rating™ Morningstar Return Morningstar Risk
Large Blend . . .
Investment InformationInvestment Strategy from investment's prospectus
The investment seeks to achieve long-term capital appreciation. The Portfolio is a "fund of funds," which means the Portfolio generally allocates its assets among other funds managed by the Advisor (the "underlying funds"). It pursues its investment objective by investing substantially all of its assets in the following underlying funds: VA U.S. Large Value Portfolio, VA U.S. Targeted Value Portfolio, U.S. Core Equity 1 Portfolio, VA International Value Portfolio, VA International Small Portfolio, International Core Equity Portfolio, Emerging Markets Core Equity Portfolio, DFA Real Estate Securities Portfolio and U.S. Large Company Portfolio.
Operations
Subaccount Incp Date 07-10-17Undr. Fund Incep Date 07-10-17Subacct Adoption Date 07-10-17Prosp Net Exp Ratio 0.40%Prosp Gross Exp Ratio 0.67%Advisor Dimensional Fund Advisors LPSubadvisor Dimensional Fund Advisors LtdPortfolio Manager(s) Jed S. Fogdall
Joseph H. ChiAllen Pu
Investment Manager
In 1981, Dimensional launched its first strategy based onresearch documenting the stronger performance of US smallcap stocks. Our second strategy, a short-term fixed incomeportfolio launched in 1983, applies Eugene Fama's termstructure research. Later, a comprehensive analysis of pricesand other research deepened our strategy repertoire and set anew standard for portfolio design.
Volatility Analysis
Low Moderate High
Investment
Category
The volatility measure is not displayed for investments withfewer than three years of history. The category average,however, is shown above.
Morningstar Proprietary Statistics1 Year 3 Year 5 Year 10 Year
Morningstar Rating™ . . . .Fund Rank Percentile . . . .Out of # of Investments . . . .
Portfolio AnalysisComposition as of 05-31-18 % Assets
U.S. Stocks 67.7Non-U.S. Stocks 30.7Bonds 0.2Cash 1.2Other 0.3
Morningstar Equity Style Box™ as of 05-31-18 % Mkt Cap
LargeM
idSm
all
Value Blend Growth
Giant 32.27........................................................Large 24.73Medium 25.65Small 14.28........................................................Micro 3.07
Top 20 Holdings as of 05-31-18 % Assets
DFA US Core Equity 1 I 26.51DFA US Large Company I 21.24DFA International Core Equity I 14.98DFA VA US Targeted Value 11.92DFA Emerging Markets Core Equity I 7.81.......................................................................................................DFA VA US Large Value 6.61DFA VA International Small Portfolio 4.62DFA VA International Value Portfolio 3.45DFA Real Estate Securities I 2.37
.......................................................................................................Total Number of Holdings 10Annual Turnover Ratio % .Total Fund Assets ($mil) 35.60
Statistics Port Avg Rel S&P 500 Rel Cat
P/E Ratio 14.76 0.86 0.87P/B Ratio 1.85 0.63 0.63P/C Ratio 7.28 0.57 0.59GeoAvgCap ($mil) 19777.67 0.20 0.24
Risk Measures as of 06-30-18 Port Avg Rel S&P 500 Rel Cat3 Yr Std Dev . . .3 Yr Beta . . .3 Yr Sharpe Ratio . . .3 Yr Alpha . . .3 Yr R-squared . . .
Morningstar Sectors as of 05-31-18 % Fund
h Cyclical 43.41...............................................................................................r Basic Materials 6.78t Consumer Cyclical 13.85y Financial Services 18.94u Real Estate 3.84
j Sensitive 39.06...............................................................................................i Communication Services 3.13o Energy 7.07p Industrials 13.26a Technology 15.60
k Defensive 17.53...............................................................................................s Consumer Defensive 6.20d Healthcare 9.06f Utilities 2.27
©2018 Morningstar, Inc., Morningstar Investment Profiles™ 312-696-6000. All rights reserved. The information contained herein: (1) is proprietary toMorningstar and/or its content providers; (2) may not be copied or distributed and (3) is not warranted to be accurate, complete or timely. Neither Morningstarnor its content providers are responsible for any damages or losses arising from any use of information. Past performance is no guarantee of futureperformance. Visit our investment website at www.morningstar.com.
ß®
Release Date: 06-30-2018
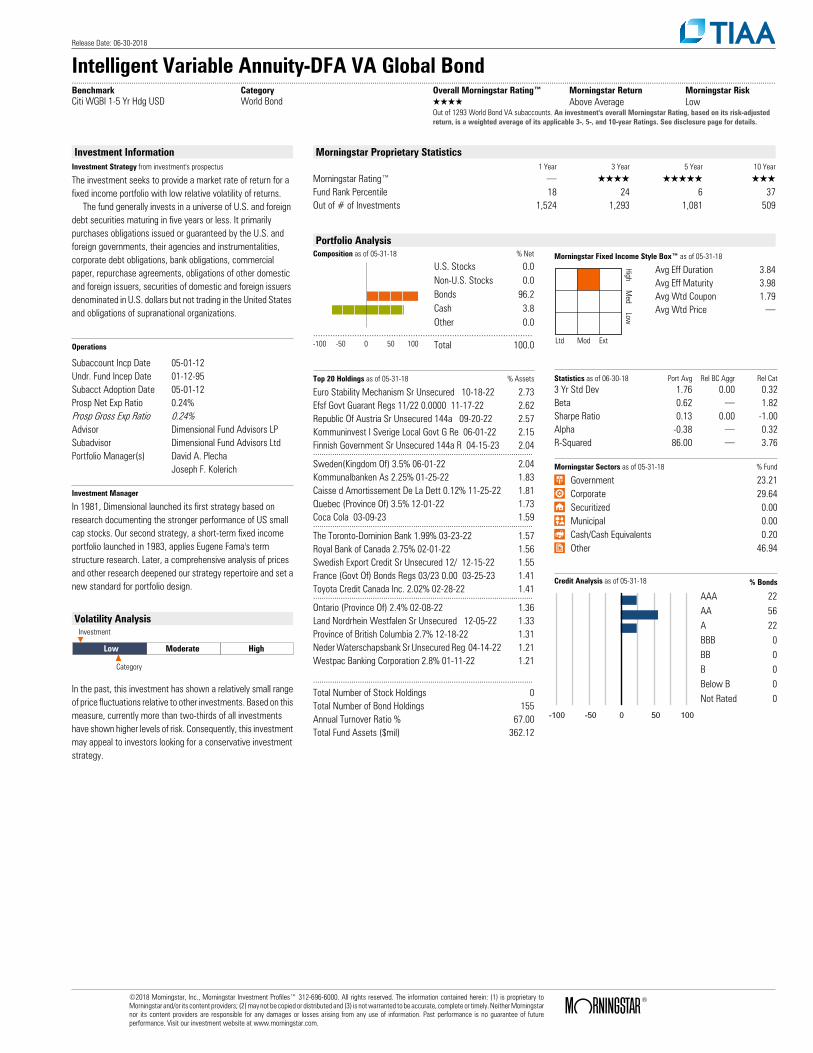
Intelligent Variable Annuity-DFA VA Global Bond..........................................................................................................................................................................................................................................................................................................................................Benchmark Category Overall Morningstar Rating™ Morningstar Return Morningstar RiskCiti WGBI 1-5 Yr Hdg USD World Bond QQQQ Above Average Low
Out of 1293 World Bond VA subaccounts. An investment's overall Morningstar Rating, based on its risk-adjustedreturn, is a weighted average of its applicable 3-, 5-, and 10-year Ratings. See disclosure page for details.
Investment InformationInvestment Strategy from investment's prospectus
The investment seeks to provide a market rate of return for a fixed income portfolio with low relative volatility of returns. The fund generally invests in a universe of U.S. and foreign debt securities maturing in five years or less. It primarily purchases obligations issued or guaranteed by the U.S. and foreign governments, their agencies and instrumentalities, corporate debt obligations, bank obligations, commercial paper, repurchase agreements, obligations of other domestic and foreign issuers, securities of domestic and foreign issuers denominated in U.S. dollars but not trading in the United States and obligations of supranational organizations.
Operations
Subaccount Incp Date 05-01-12Undr. Fund Incep Date 01-12-95Subacct Adoption Date 05-01-12Prosp Net Exp Ratio 0.24%Prosp Gross Exp Ratio 0.24%Advisor Dimensional Fund Advisors LPSubadvisor Dimensional Fund Advisors LtdPortfolio Manager(s) David A. Plecha
Joseph F. Kolerich
Investment Manager
In 1981, Dimensional launched its first strategy based onresearch documenting the stronger performance of US smallcap stocks. Our second strategy, a short-term fixed incomeportfolio launched in 1983, applies Eugene Fama's termstructure research. Later, a comprehensive analysis of pricesand other research deepened our strategy repertoire and set anew standard for portfolio design.
Volatility Analysis
Low Moderate High
Investment
Category
In the past, this investment has shown a relatively small rangeof price fluctuations relative to other investments. Based on thismeasure, currently more than two-thirds of all investmentshave shown higher levels of risk. Consequently, this investmentmay appeal to investors looking for a conservative investmentstrategy.
Morningstar Proprietary Statistics1 Year 3 Year 5 Year 10 Year
Morningstar Rating™ . QQQQ QQQQQ QQQFund Rank Percentile 18 24 6 37Out of # of Investments 1,524 1,293 1,081 509
Portfolio AnalysisComposition as of 05-31-18 % Net
U.S. Stocks 0.0Non-U.S. Stocks 0.0Bonds 96.2Cash 3.8Other 0.0
..........................................................................................-100 -50 0 50 100 Total 100.0
Morningstar Fixed Income Style Box™ as of 05-31-18
HighM
edLow
Ltd Mod Ext
Avg Eff Duration 3.84Avg Eff Maturity 3.98Avg Wtd Coupon 1.79Avg Wtd Price .
Top 20 Holdings as of 05-31-18 % Assets
Euro Stability Mechanism Sr Unsecured 10-18-22 2.73Efsf Govt Guarant Regs 11/22 0.0000 11-17-22 2.62Republic Of Austria Sr Unsecured 144a 09-20-22 2.57Kommuninvest I Sverige Local Govt G Re 06-01-22 2.15Finnish Government Sr Unsecured 144a R 04-15-23 2.04.......................................................................................................Sweden(Kingdom Of) 3.5% 06-01-22 2.04Kommunalbanken As 2.25% 01-25-22 1.83Caisse d Amortissement De La Dett 0.12% 11-25-22 1.81Quebec (Province Of) 3.5% 12-01-22 1.73Coca Cola 03-09-23 1.59.......................................................................................................The Toronto-Dominion Bank 1.99% 03-23-22 1.57Royal Bank of Canada 2.75% 02-01-22 1.56Swedish Export Credit Sr Unsecured 12/ 12-15-22 1.55France (Govt Of) Bonds Regs 03/23 0.00 03-25-23 1.41Toyota Credit Canada Inc. 2.02% 02-28-22 1.41.......................................................................................................Ontario (Province Of) 2.4% 02-08-22 1.36Land Nordrhein Westfalen Sr Unsecured 12-05-22 1.33Province of British Columbia 2.7% 12-18-22 1.31Neder Waterschapsbank Sr Unsecured Reg 04-14-22 1.21Westpac Banking Corporation 2.8% 01-11-22 1.21
.......................................................................................................Total Number of Stock Holdings 0Total Number of Bond Holdings 155Annual Turnover Ratio % 67.00Total Fund Assets ($mil) 362.12
Statistics as of 06-30-18 Port Avg Rel BC Aggr Rel Cat3 Yr Std Dev 1.76 0.00 0.32Beta 0.62 . 1.82Sharpe Ratio 0.13 0.00 -1.00Alpha -0.38 . 0.32R-Squared 86.00 . 3.76
Morningstar Sectors as of 05-31-18 % Fund
⁄ Government 23.21› Corporate 29.64€ Securitized 0.00‹ Municipal 0.00fi Cash/Cash Equivalents 0.20± Other 46.94
Credit Analysis as of 05-31-18 % Bonds
-100 -50 0 50 100
AAA 22AA 56A 22BBB 0BB 0B 0Below B 0Not Rated 0
©2018 Morningstar, Inc., Morningstar Investment Profiles™ 312-696-6000. All rights reserved. The information contained herein: (1) is proprietary toMorningstar and/or its content providers; (2) may not be copied or distributed and (3) is not warranted to be accurate, complete or timely. Neither Morningstarnor its content providers are responsible for any damages or losses arising from any use of information. Past performance is no guarantee of futureperformance. Visit our investment website at www.morningstar.com.
ß®
Release Date: 06-30-2018
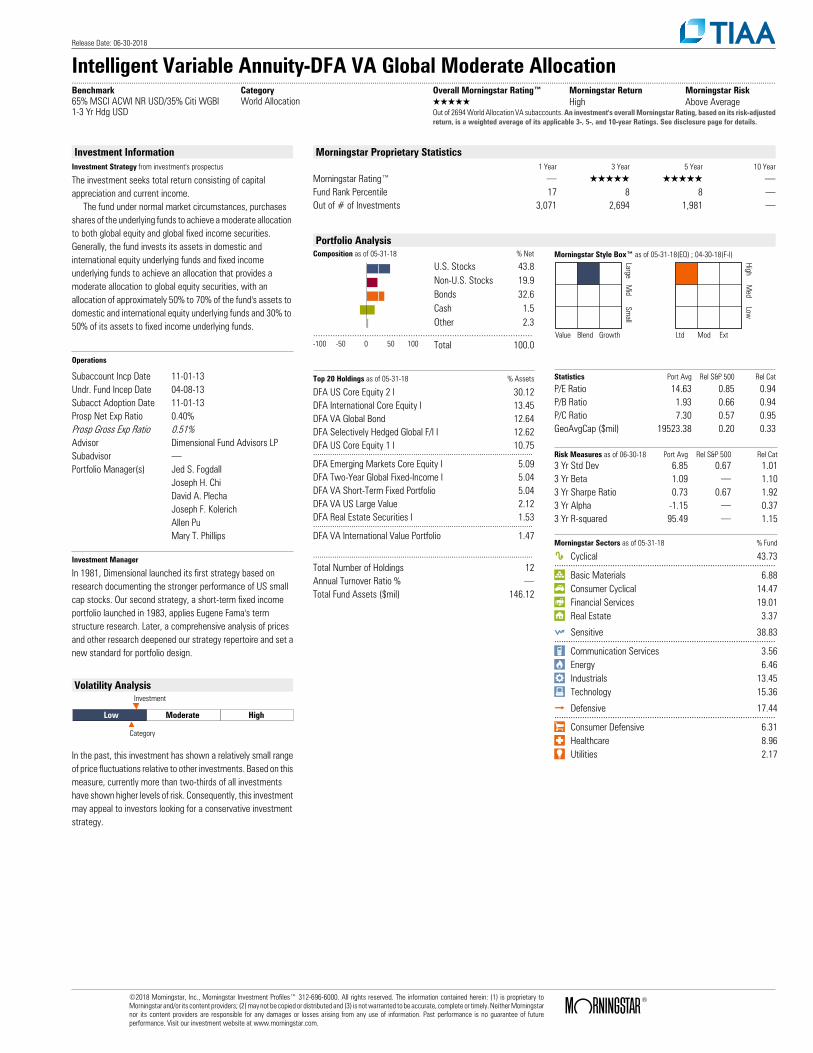
Intelligent Variable Annuity-DFA VA Global Moderate Allocation..........................................................................................................................................................................................................................................................................................................................................Benchmark Category Overall Morningstar Rating™ Morningstar Return Morningstar Risk65% MSCI ACWI NR USD/35% Citi WGBI1-3 Yr Hdg USD
World Allocation QQQQQ High Above AverageOut of 2694 World Allocation VA subaccounts. An investment's overall Morningstar Rating, based on its risk-adjustedreturn, is a weighted average of its applicable 3-, 5-, and 10-year Ratings. See disclosure page for details.
Investment InformationInvestment Strategy from investment's prospectus
The investment seeks total return consisting of capital appreciation and current income. The fund under normal market circumstances, purchases shares of the underlying funds to achieve a moderate allocation to both global equity and global fixed income securities. Generally, the fund invests its assets in domestic and international equity underlying funds and fixed income underlying funds to achieve an allocation that provides a moderate allocation to global equity securities, with an allocation of approximately 50% to 70% of the fund's assets to domestic and international equity underlying funds and 30% to 50% of its assets to fixed income underlying funds.
Operations
Subaccount Incp Date 11-01-13Undr. Fund Incep Date 04-08-13Subacct Adoption Date 11-01-13Prosp Net Exp Ratio 0.40%Prosp Gross Exp Ratio 0.51%Advisor Dimensional Fund Advisors LPSubadvisor .Portfolio Manager(s) Jed S. Fogdall
Joseph H. ChiDavid A. PlechaJoseph F. KolerichAllen PuMary T. Phillips
Investment Manager
In 1981, Dimensional launched its first strategy based onresearch documenting the stronger performance of US smallcap stocks. Our second strategy, a short-term fixed incomeportfolio launched in 1983, applies Eugene Fama's termstructure research. Later, a comprehensive analysis of pricesand other research deepened our strategy repertoire and set anew standard for portfolio design.
Volatility Analysis
Low Moderate High
Investment
Category
In the past, this investment has shown a relatively small rangeof price fluctuations relative to other investments. Based on thismeasure, currently more than two-thirds of all investmentshave shown higher levels of risk. Consequently, this investmentmay appeal to investors looking for a conservative investmentstrategy.
Morningstar Proprietary Statistics1 Year 3 Year 5 Year 10 Year
Morningstar Rating™ . QQQQQ QQQQQ .Fund Rank Percentile 17 8 8 .Out of # of Investments 3,071 2,694 1,981 .
Portfolio AnalysisComposition as of 05-31-18 % Net
U.S. Stocks 43.8Non-U.S. Stocks 19.9Bonds 32.6Cash 1.5Other 2.3
..........................................................................................-100 -50 0 50 100 Total 100.0
Morningstar Style Box™ as of 05-31-18(EQ) ; 04-30-18(F-I)
LargeM
idSm
all
Value Blend Growth
HighM
edLow
Ltd Mod Ext
Top 20 Holdings as of 05-31-18 % Assets
DFA US Core Equity 2 I 30.12DFA International Core Equity I 13.45DFA VA Global Bond 12.64DFA Selectively Hedged Global F/I I 12.62DFA US Core Equity 1 I 10.75.......................................................................................................DFA Emerging Markets Core Equity I 5.09DFA Two-Year Global Fixed-Income I 5.04DFA VA Short-Term Fixed Portfolio 5.04DFA VA US Large Value 2.12DFA Real Estate Securities I 1.53.......................................................................................................DFA VA International Value Portfolio 1.47
.......................................................................................................Total Number of Holdings 12Annual Turnover Ratio % .Total Fund Assets ($mil) 146.12
Statistics Port Avg Rel S&P 500 Rel Cat
P/E Ratio 14.63 0.85 0.94P/B Ratio 1.93 0.66 0.94P/C Ratio 7.30 0.57 0.95GeoAvgCap ($mil) 19523.38 0.20 0.33
Risk Measures as of 06-30-18 Port Avg Rel S&P 500 Rel Cat3 Yr Std Dev 6.85 0.67 1.013 Yr Beta 1.09 . 1.103 Yr Sharpe Ratio 0.73 0.67 1.923 Yr Alpha -1.15 . 0.373 Yr R-squared 95.49 . 1.15
Morningstar Sectors as of 05-31-18 % Fund
h Cyclical 43.73...............................................................................................r Basic Materials 6.88t Consumer Cyclical 14.47y Financial Services 19.01u Real Estate 3.37
j Sensitive 38.83...............................................................................................i Communication Services 3.56o Energy 6.46p Industrials 13.45a Technology 15.36
k Defensive 17.44...............................................................................................s Consumer Defensive 6.31d Healthcare 8.96f Utilities 2.17
©2018 Morningstar, Inc., Morningstar Investment Profiles™ 312-696-6000. All rights reserved. The information contained herein: (1) is proprietary toMorningstar and/or its content providers; (2) may not be copied or distributed and (3) is not warranted to be accurate, complete or timely. Neither Morningstarnor its content providers are responsible for any damages or losses arising from any use of information. Past performance is no guarantee of futureperformance. Visit our investment website at www.morningstar.com.
ß®
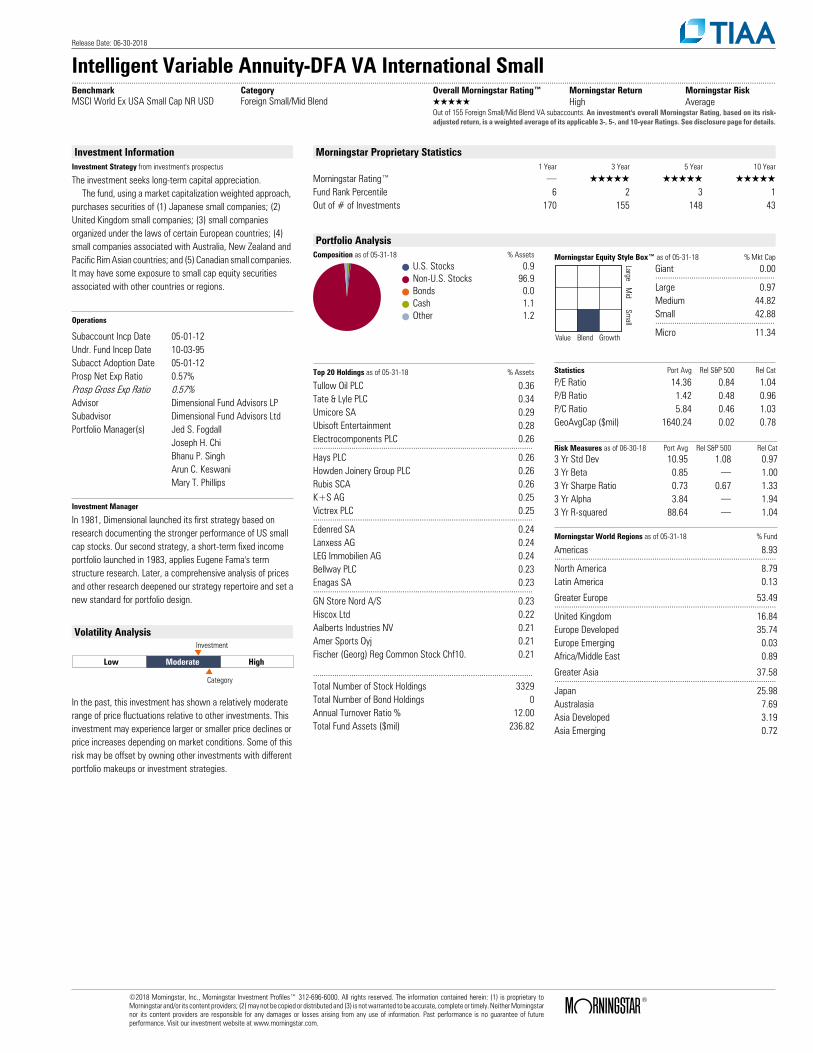
Release Date: 06-30-2018
Intelligent Variable Annuity-DFA VA International Small..........................................................................................................................................................................................................................................................................................................................................Benchmark Category Overall Morningstar Rating™ Morningstar Return Morningstar RiskMSCI World Ex USA Small Cap NR USD Foreign Small/Mid Blend QQQQQ High Average
Out of 155 Foreign Small/Mid Blend VA subaccounts. An investment's overall Morningstar Rating, based on its risk-adjusted return, is a weighted average of its applicable 3-, 5-, and 10-year Ratings. See disclosure page for details.
Investment InformationInvestment Strategy from investment's prospectus
The investment seeks long-term capital appreciation. The fund, using a market capitalization weighted approach, purchases securities of (1) Japanese small companies; (2) United Kingdom small companies; (3) small companies organized under the laws of certain European countries; (4) small companies associated with Australia, New Zealand and Pacific Rim Asian countries; and (5) Canadian small companies. It may have some exposure to small cap equity securities associated with other countries or regions.
Operations
Subaccount Incp Date 05-01-12Undr. Fund Incep Date 10-03-95Subacct Adoption Date 05-01-12Prosp Net Exp Ratio 0.57%Prosp Gross Exp Ratio 0.57%Advisor Dimensional Fund Advisors LPSubadvisor Dimensional Fund Advisors LtdPortfolio Manager(s) Jed S. Fogdall
Joseph H. ChiBhanu P. SinghArun C. KeswaniMary T. Phillips
Investment Manager
In 1981, Dimensional launched its first strategy based onresearch documenting the stronger performance of US smallcap stocks. Our second strategy, a short-term fixed incomeportfolio launched in 1983, applies Eugene Fama's termstructure research. Later, a comprehensive analysis of pricesand other research deepened our strategy repertoire and set anew standard for portfolio design.
Volatility Analysis
Low Moderate High
Investment
Category
In the past, this investment has shown a relatively moderaterange of price fluctuations relative to other investments. Thisinvestment may experience larger or smaller price declines orprice increases depending on market conditions. Some of thisrisk may be offset by owning other investments with differentportfolio makeups or investment strategies.
Morningstar Proprietary Statistics1 Year 3 Year 5 Year 10 Year
Morningstar Rating™ . QQQQQ QQQQQ QQQQQFund Rank Percentile 6 2 3 1Out of # of Investments 170 155 148 43
Portfolio AnalysisComposition as of 05-31-18 % Assets
U.S. Stocks 0.9Non-U.S. Stocks 96.9Bonds 0.0Cash 1.1Other 1.2
Morningstar Equity Style Box™ as of 05-31-18 % Mkt Cap
LargeM
idSm
all
Value Blend Growth
Giant 0.00........................................................Large 0.97Medium 44.82Small 42.88........................................................Micro 11.34
Top 20 Holdings as of 05-31-18 % Assets
Tullow Oil PLC 0.36Tate & Lyle PLC 0.34Umicore SA 0.29Ubisoft Entertainment 0.28Electrocomponents PLC 0.26.......................................................................................................Hays PLC 0.26Howden Joinery Group PLC 0.26Rubis SCA 0.26K+S AG 0.25Victrex PLC 0.25.......................................................................................................Edenred SA 0.24Lanxess AG 0.24LEG Immobilien AG 0.24Bellway PLC 0.23Enagas SA 0.23.......................................................................................................GN Store Nord A/S 0.23Hiscox Ltd 0.22Aalberts Industries NV 0.21Amer Sports Oyj 0.21Fischer (Georg) Reg Common Stock Chf10. 0.21
.......................................................................................................Total Number of Stock Holdings 3329Total Number of Bond Holdings 0Annual Turnover Ratio % 12.00Total Fund Assets ($mil) 236.82
Statistics Port Avg Rel S&P 500 Rel Cat
P/E Ratio 14.36 0.84 1.04P/B Ratio 1.42 0.48 0.96P/C Ratio 5.84 0.46 1.03GeoAvgCap ($mil) 1640.24 0.02 0.78
Risk Measures as of 06-30-18 Port Avg Rel S&P 500 Rel Cat3 Yr Std Dev 10.95 1.08 0.973 Yr Beta 0.85 . 1.003 Yr Sharpe Ratio 0.73 0.67 1.333 Yr Alpha 3.84 . 1.943 Yr R-squared 88.64 . 1.04
Morningstar World Regions as of 05-31-18 % Fund
Americas 8.93........................................................................................................North America 8.79Latin America 0.13
Greater Europe 53.49........................................................................................................United Kingdom 16.84Europe Developed 35.74Europe Emerging 0.03Africa/Middle East 0.89
Greater Asia 37.58........................................................................................................Japan 25.98Australasia 7.69Asia Developed 3.19Asia Emerging 0.72
©2018 Morningstar, Inc., Morningstar Investment Profiles™ 312-696-6000. All rights reserved. The information contained herein: (1) is proprietary toMorningstar and/or its content providers; (2) may not be copied or distributed and (3) is not warranted to be accurate, complete or timely. Neither Morningstarnor its content providers are responsible for any damages or losses arising from any use of information. Past performance is no guarantee of futureperformance. Visit our investment website at www.morningstar.com.
ß®
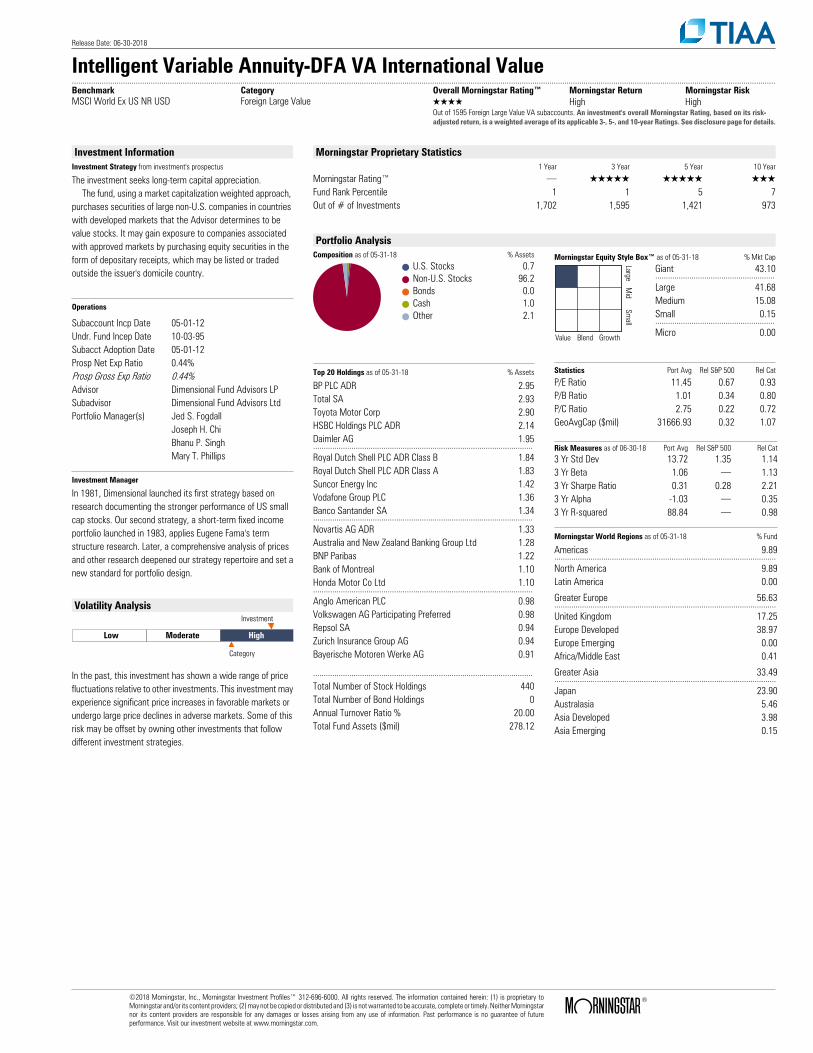
Release Date: 06-30-2018
Intelligent Variable Annuity-DFA VA International Value..........................................................................................................................................................................................................................................................................................................................................Benchmark Category Overall Morningstar Rating™ Morningstar Return Morningstar RiskMSCI World Ex US NR USD Foreign Large Value QQQQ High High
Out of 1595 Foreign Large Value VA subaccounts. An investment's overall Morningstar Rating, based on its risk-adjusted return, is a weighted average of its applicable 3-, 5-, and 10-year Ratings. See disclosure page for details.
Investment InformationInvestment Strategy from investment's prospectus
The investment seeks long-term capital appreciation. The fund, using a market capitalization weighted approach, purchases securities of large non-U.S. companies in countries with developed markets that the Advisor determines to be value stocks. It may gain exposure to companies associated with approved markets by purchasing equity securities in the form of depositary receipts, which may be listed or traded outside the issuer's domicile country.
Operations
Subaccount Incp Date 05-01-12Undr. Fund Incep Date 10-03-95Subacct Adoption Date 05-01-12Prosp Net Exp Ratio 0.44%Prosp Gross Exp Ratio 0.44%Advisor Dimensional Fund Advisors LPSubadvisor Dimensional Fund Advisors LtdPortfolio Manager(s) Jed S. Fogdall
Joseph H. ChiBhanu P. SinghMary T. Phillips
Investment Manager
In 1981, Dimensional launched its first strategy based onresearch documenting the stronger performance of US smallcap stocks. Our second strategy, a short-term fixed incomeportfolio launched in 1983, applies Eugene Fama's termstructure research. Later, a comprehensive analysis of pricesand other research deepened our strategy repertoire and set anew standard for portfolio design.
Volatility Analysis
Low Moderate High
Investment
Category
In the past, this investment has shown a wide range of pricefluctuations relative to other investments. This investment mayexperience significant price increases in favorable markets orundergo large price declines in adverse markets. Some of thisrisk may be offset by owning other investments that followdifferent investment strategies.
Morningstar Proprietary Statistics1 Year 3 Year 5 Year 10 Year
Morningstar Rating™ . QQQQQ QQQQQ QQQFund Rank Percentile 1 1 5 7Out of # of Investments 1,702 1,595 1,421 973
Portfolio AnalysisComposition as of 05-31-18 % Assets
U.S. Stocks 0.7Non-U.S. Stocks 96.2Bonds 0.0Cash 1.0Other 2.1
Morningstar Equity Style Box™ as of 05-31-18 % Mkt Cap
LargeM
idSm
all
Value Blend Growth
Giant 43.10........................................................Large 41.68Medium 15.08Small 0.15........................................................Micro 0.00
Top 20 Holdings as of 05-31-18 % Assets
BP PLC ADR 2.95Total SA 2.93Toyota Motor Corp 2.90HSBC Holdings PLC ADR 2.14Daimler AG 1.95.......................................................................................................Royal Dutch Shell PLC ADR Class B 1.84Royal Dutch Shell PLC ADR Class A 1.83Suncor Energy Inc 1.42Vodafone Group PLC 1.36Banco Santander SA 1.34.......................................................................................................Novartis AG ADR 1.33Australia and New Zealand Banking Group Ltd 1.28BNP Paribas 1.22Bank of Montreal 1.10Honda Motor Co Ltd 1.10.......................................................................................................Anglo American PLC 0.98Volkswagen AG Participating Preferred 0.98Repsol SA 0.94Zurich Insurance Group AG 0.94Bayerische Motoren Werke AG 0.91
.......................................................................................................Total Number of Stock Holdings 440Total Number of Bond Holdings 0Annual Turnover Ratio % 20.00Total Fund Assets ($mil) 278.12
Statistics Port Avg Rel S&P 500 Rel Cat
P/E Ratio 11.45 0.67 0.93P/B Ratio 1.01 0.34 0.80P/C Ratio 2.75 0.22 0.72GeoAvgCap ($mil) 31666.93 0.32 1.07
Risk Measures as of 06-30-18 Port Avg Rel S&P 500 Rel Cat3 Yr Std Dev 13.72 1.35 1.143 Yr Beta 1.06 . 1.133 Yr Sharpe Ratio 0.31 0.28 2.213 Yr Alpha -1.03 . 0.353 Yr R-squared 88.84 . 0.98
Morningstar World Regions as of 05-31-18 % Fund
Americas 9.89........................................................................................................North America 9.89Latin America 0.00
Greater Europe 56.63........................................................................................................United Kingdom 17.25Europe Developed 38.97Europe Emerging 0.00Africa/Middle East 0.41
Greater Asia 33.49........................................................................................................Japan 23.90Australasia 5.46Asia Developed 3.98Asia Emerging 0.15
©2018 Morningstar, Inc., Morningstar Investment Profiles™ 312-696-6000. All rights reserved. The information contained herein: (1) is proprietary toMorningstar and/or its content providers; (2) may not be copied or distributed and (3) is not warranted to be accurate, complete or timely. Neither Morningstarnor its content providers are responsible for any damages or losses arising from any use of information. Past performance is no guarantee of futureperformance. Visit our investment website at www.morningstar.com.
ß®
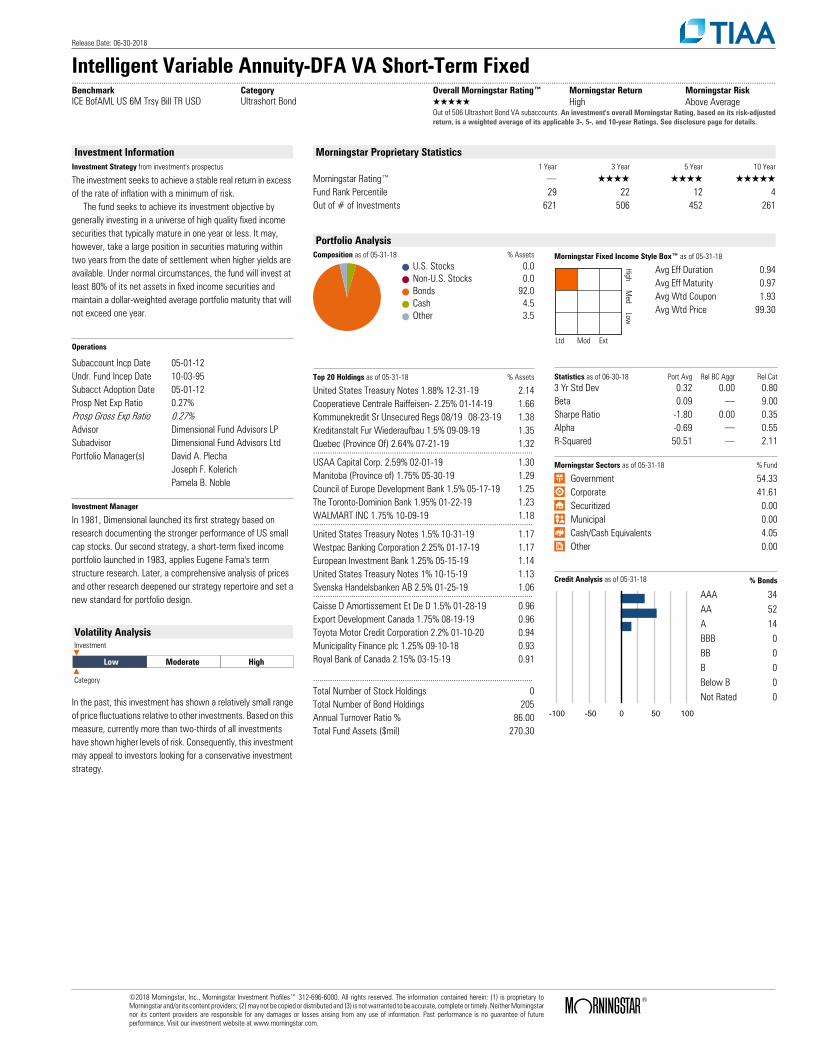
Release Date: 06-30-2018
Intelligent Variable Annuity-DFA VA Short-Term Fixed..........................................................................................................................................................................................................................................................................................................................................Benchmark Category Overall Morningstar Rating™ Morningstar Return Morningstar RiskICE BofAML US 6M Trsy Bill TR USD Ultrashort Bond QQQQQ High Above Average
Out of 506 Ultrashort Bond VA subaccounts. An investment's overall Morningstar Rating, based on its risk-adjustedreturn, is a weighted average of its applicable 3-, 5-, and 10-year Ratings. See disclosure page for details.
Investment InformationInvestment Strategy from investment's prospectus
The investment seeks to achieve a stable real return in excess of the rate of inflation with a minimum of risk. The fund seeks to achieve its investment objective by generally investing in a universe of high quality fixed income securities that typically mature in one year or less. It may, however, take a large position in securities maturing within two years from the date of settlement when higher yields are available. Under normal circumstances, the fund will invest at least 80% of its net assets in fixed income securities and maintain a dollar-weighted average portfolio maturity that will not exceed one year.
Operations
Subaccount Incp Date 05-01-12Undr. Fund Incep Date 10-03-95Subacct Adoption Date 05-01-12Prosp Net Exp Ratio 0.27%Prosp Gross Exp Ratio 0.27%Advisor Dimensional Fund Advisors LPSubadvisor Dimensional Fund Advisors LtdPortfolio Manager(s) David A. Plecha
Joseph F. KolerichPamela B. Noble
Investment Manager
In 1981, Dimensional launched its first strategy based onresearch documenting the stronger performance of US smallcap stocks. Our second strategy, a short-term fixed incomeportfolio launched in 1983, applies Eugene Fama's termstructure research. Later, a comprehensive analysis of pricesand other research deepened our strategy repertoire and set anew standard for portfolio design.
Volatility Analysis
Low Moderate High
Investment
Category
In the past, this investment has shown a relatively small rangeof price fluctuations relative to other investments. Based on thismeasure, currently more than two-thirds of all investmentshave shown higher levels of risk. Consequently, this investmentmay appeal to investors looking for a conservative investmentstrategy.
Morningstar Proprietary Statistics1 Year 3 Year 5 Year 10 Year
Morningstar Rating™ . QQQQ QQQQ QQQQQFund Rank Percentile 29 22 12 4Out of # of Investments 621 506 452 261
Portfolio AnalysisComposition as of 05-31-18 % Assets
U.S. Stocks 0.0Non-U.S. Stocks 0.0Bonds 92.0Cash 4.5Other 3.5
Morningstar Fixed Income Style Box™ as of 05-31-18
HighM
edLow
Ltd Mod Ext
Avg Eff Duration 0.94Avg Eff Maturity 0.97Avg Wtd Coupon 1.93Avg Wtd Price 99.30
Top 20 Holdings as of 05-31-18 % Assets
United States Treasury Notes 1.88% 12-31-19 2.14Cooperatieve Centrale Raiffeisen- 2.25% 01-14-19 1.66Kommunekredit Sr Unsecured Regs 08/19 08-23-19 1.38Kreditanstalt Fur Wiederaufbau 1.5% 09-09-19 1.35Quebec (Province Of) 2.64% 07-21-19 1.32.......................................................................................................USAA Capital Corp. 2.59% 02-01-19 1.30Manitoba (Province of) 1.75% 05-30-19 1.29Council of Europe Development Bank 1.5% 05-17-19 1.25The Toronto-Dominion Bank 1.95% 01-22-19 1.23WALMART INC 1.75% 10-09-19 1.18.......................................................................................................United States Treasury Notes 1.5% 10-31-19 1.17Westpac Banking Corporation 2.25% 01-17-19 1.17European Investment Bank 1.25% 05-15-19 1.14United States Treasury Notes 1% 10-15-19 1.13Svenska Handelsbanken AB 2.5% 01-25-19 1.06.......................................................................................................Caisse D Amortissement Et De D 1.5% 01-28-19 0.96Export Development Canada 1.75% 08-19-19 0.96Toyota Motor Credit Corporation 2.2% 01-10-20 0.94Municipality Finance plc 1.25% 09-10-18 0.93Royal Bank of Canada 2.15% 03-15-19 0.91
.......................................................................................................Total Number of Stock Holdings 0Total Number of Bond Holdings 205Annual Turnover Ratio % 86.00Total Fund Assets ($mil) 270.30
Statistics as of 06-30-18 Port Avg Rel BC Aggr Rel Cat3 Yr Std Dev 0.32 0.00 0.80Beta 0.09 . 9.00Sharpe Ratio -1.80 0.00 0.35Alpha -0.69 . 0.55R-Squared 50.51 . 2.11
Morningstar Sectors as of 05-31-18 % Fund
⁄ Government 54.33› Corporate 41.61€ Securitized 0.00‹ Municipal 0.00fi Cash/Cash Equivalents 4.05± Other 0.00
Credit Analysis as of 05-31-18 % Bonds
-100 -50 0 50 100
AAA 34AA 52A 14BBB 0BB 0B 0Below B 0Not Rated 0
©2018 Morningstar, Inc., Morningstar Investment Profiles™ 312-696-6000. All rights reserved. The information contained herein: (1) is proprietary toMorningstar and/or its content providers; (2) may not be copied or distributed and (3) is not warranted to be accurate, complete or timely. Neither Morningstarnor its content providers are responsible for any damages or losses arising from any use of information. Past performance is no guarantee of futureperformance. Visit our investment website at www.morningstar.com.
ß®
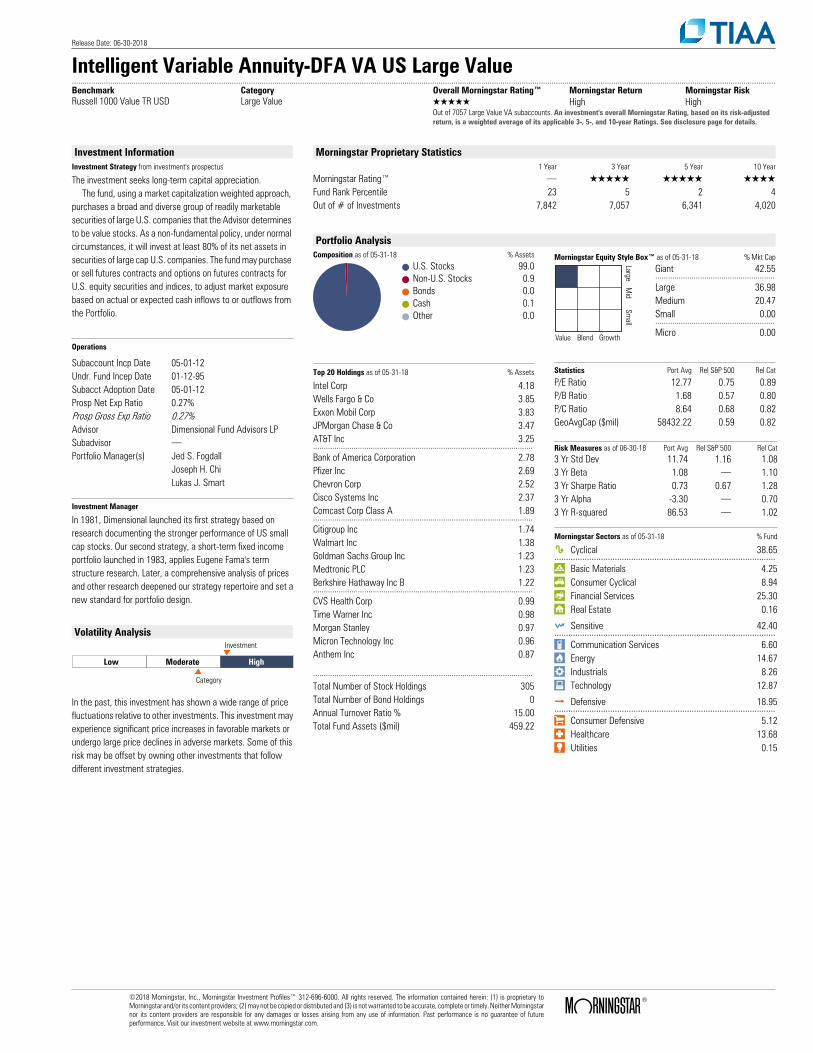
Release Date: 06-30-2018
Intelligent Variable Annuity-DFA VA US Large Value..........................................................................................................................................................................................................................................................................................................................................Benchmark Category Overall Morningstar Rating™ Morningstar Return Morningstar RiskRussell 1000 Value TR USD Large Value QQQQQ High High
Out of 7057 Large Value VA subaccounts. An investment's overall Morningstar Rating, based on its risk-adjustedreturn, is a weighted average of its applicable 3-, 5-, and 10-year Ratings. See disclosure page for details.
Investment InformationInvestment Strategy from investment's prospectus
The investment seeks long-term capital appreciation. The fund, using a market capitalization weighted approach, purchases a broad and diverse group of readily marketable securities of large U.S. companies that the Advisor determines to be value stocks. As a non-fundamental policy, under normal circumstances, it will invest at least 80% of its net assets in securities of large cap U.S. companies. The fund may purchase or sell futures contracts and options on futures contracts for U.S. equity securities and indices, to adjust market exposure based on actual or expected cash inflows to or outflows from the Portfolio.
Operations
Subaccount Incp Date 05-01-12Undr. Fund Incep Date 01-12-95Subacct Adoption Date 05-01-12Prosp Net Exp Ratio 0.27%Prosp Gross Exp Ratio 0.27%Advisor Dimensional Fund Advisors LPSubadvisor .Portfolio Manager(s) Jed S. Fogdall
Joseph H. ChiLukas J. Smart
Investment Manager
In 1981, Dimensional launched its first strategy based onresearch documenting the stronger performance of US smallcap stocks. Our second strategy, a short-term fixed incomeportfolio launched in 1983, applies Eugene Fama's termstructure research. Later, a comprehensive analysis of pricesand other research deepened our strategy repertoire and set anew standard for portfolio design.
Volatility Analysis
Low Moderate High
Investment
Category
In the past, this investment has shown a wide range of pricefluctuations relative to other investments. This investment mayexperience significant price increases in favorable markets orundergo large price declines in adverse markets. Some of thisrisk may be offset by owning other investments that followdifferent investment strategies.
Morningstar Proprietary Statistics1 Year 3 Year 5 Year 10 Year
Morningstar Rating™ . QQQQQ QQQQQ QQQQFund Rank Percentile 23 5 2 4Out of # of Investments 7,842 7,057 6,341 4,020
Portfolio AnalysisComposition as of 05-31-18 % Assets
U.S. Stocks 99.0Non-U.S. Stocks 0.9Bonds 0.0Cash 0.1Other 0.0
Morningstar Equity Style Box™ as of 05-31-18 % Mkt Cap
LargeM
idSm
all
Value Blend Growth
Giant 42.55........................................................Large 36.98Medium 20.47Small 0.00........................................................Micro 0.00
Top 20 Holdings as of 05-31-18 % Assets
Intel Corp 4.18Wells Fargo & Co 3.85Exxon Mobil Corp 3.83JPMorgan Chase & Co 3.47AT&T Inc 3.25.......................................................................................................Bank of America Corporation 2.78Pfizer Inc 2.69Chevron Corp 2.52Cisco Systems Inc 2.37Comcast Corp Class A 1.89.......................................................................................................Citigroup Inc 1.74Walmart Inc 1.38Goldman Sachs Group Inc 1.23Medtronic PLC 1.23Berkshire Hathaway Inc B 1.22.......................................................................................................CVS Health Corp 0.99Time Warner Inc 0.98Morgan Stanley 0.97Micron Technology Inc 0.96Anthem Inc 0.87
.......................................................................................................Total Number of Stock Holdings 305Total Number of Bond Holdings 0Annual Turnover Ratio % 15.00Total Fund Assets ($mil) 459.22
Statistics Port Avg Rel S&P 500 Rel Cat
P/E Ratio 12.77 0.75 0.89P/B Ratio 1.68 0.57 0.80P/C Ratio 8.64 0.68 0.82GeoAvgCap ($mil) 58432.22 0.59 0.82
Risk Measures as of 06-30-18 Port Avg Rel S&P 500 Rel Cat3 Yr Std Dev 11.74 1.16 1.083 Yr Beta 1.08 . 1.103 Yr Sharpe Ratio 0.73 0.67 1.283 Yr Alpha -3.30 . 0.703 Yr R-squared 86.53 . 1.02
Morningstar Sectors as of 05-31-18 % Fund
h Cyclical 38.65...............................................................................................r Basic Materials 4.25t Consumer Cyclical 8.94y Financial Services 25.30u Real Estate 0.16
j Sensitive 42.40...............................................................................................i Communication Services 6.60o Energy 14.67p Industrials 8.26a Technology 12.87
k Defensive 18.95...............................................................................................s Consumer Defensive 5.12d Healthcare 13.68f Utilities 0.15
©2018 Morningstar, Inc., Morningstar Investment Profiles™ 312-696-6000. All rights reserved. The information contained herein: (1) is proprietary toMorningstar and/or its content providers; (2) may not be copied or distributed and (3) is not warranted to be accurate, complete or timely. Neither Morningstarnor its content providers are responsible for any damages or losses arising from any use of information. Past performance is no guarantee of futureperformance. Visit our investment website at www.morningstar.com.
ß®
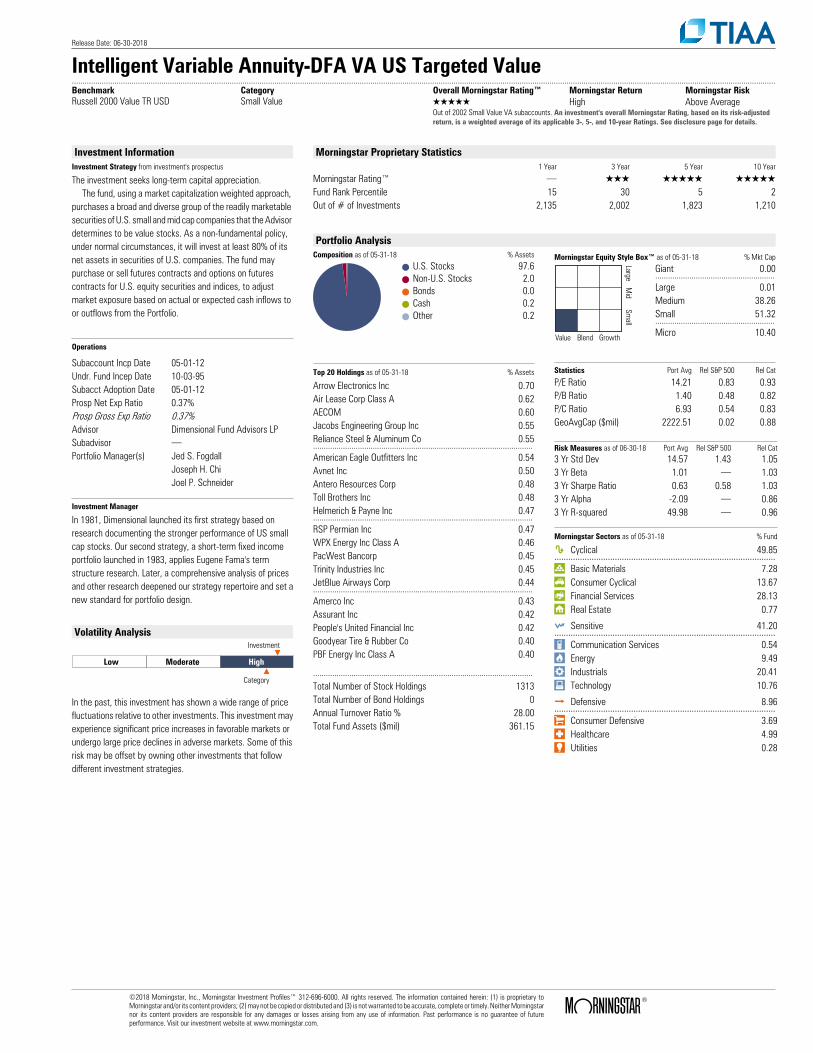
Release Date: 06-30-2018
Intelligent Variable Annuity-DFA VA US Targeted Value..........................................................................................................................................................................................................................................................................................................................................Benchmark Category Overall Morningstar Rating™ Morningstar Return Morningstar RiskRussell 2000 Value TR USD Small Value QQQQQ High Above Average
Out of 2002 Small Value VA subaccounts. An investment's overall Morningstar Rating, based on its risk-adjustedreturn, is a weighted average of its applicable 3-, 5-, and 10-year Ratings. See disclosure page for details.
Investment InformationInvestment Strategy from investment's prospectus
The investment seeks long-term capital appreciation. The fund, using a market capitalization weighted approach, purchases a broad and diverse group of the readily marketable securities of U.S. small and mid cap companies that the Advisor determines to be value stocks. As a non-fundamental policy, under normal circumstances, it will invest at least 80% of its net assets in securities of U.S. companies. The fund may purchase or sell futures contracts and options on futures contracts for U.S. equity securities and indices, to adjust market exposure based on actual or expected cash inflows to or outflows from the Portfolio.
Operations
Subaccount Incp Date 05-01-12Undr. Fund Incep Date 10-03-95Subacct Adoption Date 05-01-12Prosp Net Exp Ratio 0.37%Prosp Gross Exp Ratio 0.37%Advisor Dimensional Fund Advisors LPSubadvisor .Portfolio Manager(s) Jed S. Fogdall
Joseph H. ChiJoel P. Schneider
Investment Manager
In 1981, Dimensional launched its first strategy based onresearch documenting the stronger performance of US smallcap stocks. Our second strategy, a short-term fixed incomeportfolio launched in 1983, applies Eugene Fama's termstructure research. Later, a comprehensive analysis of pricesand other research deepened our strategy repertoire and set anew standard for portfolio design.
Volatility Analysis
Low Moderate High
Investment
Category
In the past, this investment has shown a wide range of pricefluctuations relative to other investments. This investment mayexperience significant price increases in favorable markets orundergo large price declines in adverse markets. Some of thisrisk may be offset by owning other investments that followdifferent investment strategies.
Morningstar Proprietary Statistics1 Year 3 Year 5 Year 10 Year
Morningstar Rating™ . QQQ QQQQQ QQQQQFund Rank Percentile 15 30 5 2Out of # of Investments 2,135 2,002 1,823 1,210
Portfolio AnalysisComposition as of 05-31-18 % Assets
U.S. Stocks 97.6Non-U.S. Stocks 2.0Bonds 0.0Cash 0.2Other 0.2
Morningstar Equity Style Box™ as of 05-31-18 % Mkt Cap
LargeM
idSm
all
Value Blend Growth
Giant 0.00........................................................Large 0.01Medium 38.26Small 51.32........................................................Micro 10.40
Top 20 Holdings as of 05-31-18 % Assets
Arrow Electronics Inc 0.70Air Lease Corp Class A 0.62AECOM 0.60Jacobs Engineering Group Inc 0.55Reliance Steel & Aluminum Co 0.55.......................................................................................................American Eagle Outfitters Inc 0.54Avnet Inc 0.50Antero Resources Corp 0.48Toll Brothers Inc 0.48Helmerich & Payne Inc 0.47.......................................................................................................RSP Permian Inc 0.47WPX Energy Inc Class A 0.46PacWest Bancorp 0.45Trinity Industries Inc 0.45JetBlue Airways Corp 0.44.......................................................................................................Amerco Inc 0.43Assurant Inc 0.42People's United Financial Inc 0.42Goodyear Tire & Rubber Co 0.40PBF Energy Inc Class A 0.40
.......................................................................................................Total Number of Stock Holdings 1313Total Number of Bond Holdings 0Annual Turnover Ratio % 28.00Total Fund Assets ($mil) 361.15
Statistics Port Avg Rel S&P 500 Rel Cat
P/E Ratio 14.21 0.83 0.93P/B Ratio 1.40 0.48 0.82P/C Ratio 6.93 0.54 0.83GeoAvgCap ($mil) 2222.51 0.02 0.88
Risk Measures as of 06-30-18 Port Avg Rel S&P 500 Rel Cat3 Yr Std Dev 14.57 1.43 1.053 Yr Beta 1.01 . 1.033 Yr Sharpe Ratio 0.63 0.58 1.033 Yr Alpha -2.09 . 0.863 Yr R-squared 49.98 . 0.96
Morningstar Sectors as of 05-31-18 % Fund
h Cyclical 49.85...............................................................................................r Basic Materials 7.28t Consumer Cyclical 13.67y Financial Services 28.13u Real Estate 0.77
j Sensitive 41.20...............................................................................................i Communication Services 0.54o Energy 9.49p Industrials 20.41a Technology 10.76
k Defensive 8.96...............................................................................................s Consumer Defensive 3.69d Healthcare 4.99f Utilities 0.28
©2018 Morningstar, Inc., Morningstar Investment Profiles™ 312-696-6000. All rights reserved. The information contained herein: (1) is proprietary toMorningstar and/or its content providers; (2) may not be copied or distributed and (3) is not warranted to be accurate, complete or timely. Neither Morningstarnor its content providers are responsible for any damages or losses arising from any use of information. Past performance is no guarantee of futureperformance. Visit our investment website at www.morningstar.com.
ß®
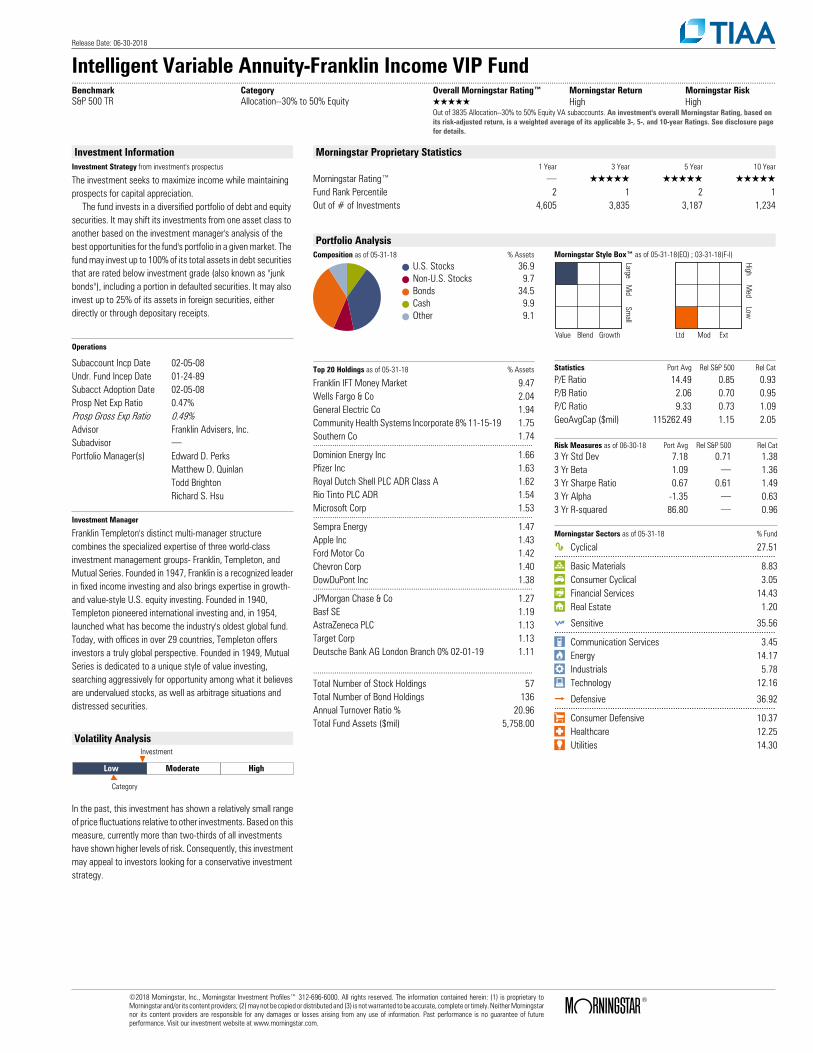
Release Date: 06-30-2018
Intelligent Variable Annuity-Franklin Income VIP Fund..........................................................................................................................................................................................................................................................................................................................................Benchmark Category Overall Morningstar Rating™ Morningstar Return Morningstar RiskS&P 500 TR Allocation--30% to 50% Equity QQQQQ High High
Out of 3835 Allocation--30% to 50% Equity VA subaccounts. An investment's overall Morningstar Rating, based onits risk-adjusted return, is a weighted average of its applicable 3-, 5-, and 10-year Ratings. See disclosure pagefor details.
Investment InformationInvestment Strategy from investment's prospectus
The investment seeks to maximize income while maintaining prospects for capital appreciation. The fund invests in a diversified portfolio of debt and equity securities. It may shift its investments from one asset class to another based on the investment manager's analysis of the best opportunities for the fund's portfolio in a given market. The fund may invest up to 100% of its total assets in debt securities that are rated below investment grade (also known as "junk bonds"), including a portion in defaulted securities. It may also invest up to 25% of its assets in foreign securities, either directly or through depositary receipts.
Operations
Subaccount Incp Date 02-05-08Undr. Fund Incep Date 01-24-89Subacct Adoption Date 02-05-08Prosp Net Exp Ratio 0.47%Prosp Gross Exp Ratio 0.49%Advisor Franklin Advisers, Inc.Subadvisor .Portfolio Manager(s) Edward D. Perks
Matthew D. QuinlanTodd BrightonRichard S. Hsu
Investment Manager
Franklin Templeton's distinct multi-manager structurecombines the specialized expertise of three world-classinvestment management groups- Franklin, Templeton, andMutual Series. Founded in 1947, Franklin is a recognized leaderin fixed income investing and also brings expertise in growth-and value-style U.S. equity investing. Founded in 1940,Templeton pioneered international investing and, in 1954,launched what has become the industry's oldest global fund.Today, with offices in over 29 countries, Templeton offersinvestors a truly global perspective. Founded in 1949, MutualSeries is dedicated to a unique style of value investing,searching aggressively for opportunity among what it believesare undervalued stocks, as well as arbitrage situations anddistressed securities.
Volatility Analysis
Low Moderate High
Investment
Category
In the past, this investment has shown a relatively small rangeof price fluctuations relative to other investments. Based on thismeasure, currently more than two-thirds of all investmentshave shown higher levels of risk. Consequently, this investmentmay appeal to investors looking for a conservative investmentstrategy.
Morningstar Proprietary Statistics1 Year 3 Year 5 Year 10 Year
Morningstar Rating™ . QQQQQ QQQQQ QQQQQFund Rank Percentile 2 1 2 1Out of # of Investments 4,605 3,835 3,187 1,234
Portfolio AnalysisComposition as of 05-31-18 % Assets
U.S. Stocks 36.9Non-U.S. Stocks 9.7Bonds 34.5Cash 9.9Other 9.1
Morningstar Style Box™ as of 05-31-18(EQ) ; 03-31-18(F-I)
LargeM
idSm
all
Value Blend Growth
HighM
edLow
Ltd Mod Ext
Top 20 Holdings as of 05-31-18 % Assets
Franklin IFT Money Market 9.47Wells Fargo & Co 2.04General Electric Co 1.94Community Health Systems Incorporate 8% 11-15-19 1.75Southern Co 1.74.......................................................................................................Dominion Energy Inc 1.66Pfizer Inc 1.63Royal Dutch Shell PLC ADR Class A 1.62Rio Tinto PLC ADR 1.54Microsoft Corp 1.53.......................................................................................................Sempra Energy 1.47Apple Inc 1.43Ford Motor Co 1.42Chevron Corp 1.40DowDuPont Inc 1.38.......................................................................................................JPMorgan Chase & Co 1.27Basf SE 1.19AstraZeneca PLC 1.13Target Corp 1.13Deutsche Bank AG London Branch 0% 02-01-19 1.11
.......................................................................................................Total Number of Stock Holdings 57Total Number of Bond Holdings 136Annual Turnover Ratio % 20.96Total Fund Assets ($mil) 5,758.00
Statistics Port Avg Rel S&P 500 Rel Cat
P/E Ratio 14.49 0.85 0.93P/B Ratio 2.06 0.70 0.95P/C Ratio 9.33 0.73 1.09GeoAvgCap ($mil) 115262.49 1.15 2.05
Risk Measures as of 06-30-18 Port Avg Rel S&P 500 Rel Cat3 Yr Std Dev 7.18 0.71 1.383 Yr Beta 1.09 . 1.363 Yr Sharpe Ratio 0.67 0.61 1.493 Yr Alpha -1.35 . 0.633 Yr R-squared 86.80 . 0.96
Morningstar Sectors as of 05-31-18 % Fund
h Cyclical 27.51...............................................................................................r Basic Materials 8.83t Consumer Cyclical 3.05y Financial Services 14.43u Real Estate 1.20
j Sensitive 35.56...............................................................................................i Communication Services 3.45o Energy 14.17p Industrials 5.78a Technology 12.16
k Defensive 36.92...............................................................................................s Consumer Defensive 10.37d Healthcare 12.25f Utilities 14.30
©2018 Morningstar, Inc., Morningstar Investment Profiles™ 312-696-6000. All rights reserved. The information contained herein: (1) is proprietary toMorningstar and/or its content providers; (2) may not be copied or distributed and (3) is not warranted to be accurate, complete or timely. Neither Morningstarnor its content providers are responsible for any damages or losses arising from any use of information. Past performance is no guarantee of futureperformance. Visit our investment website at www.morningstar.com.
ß®
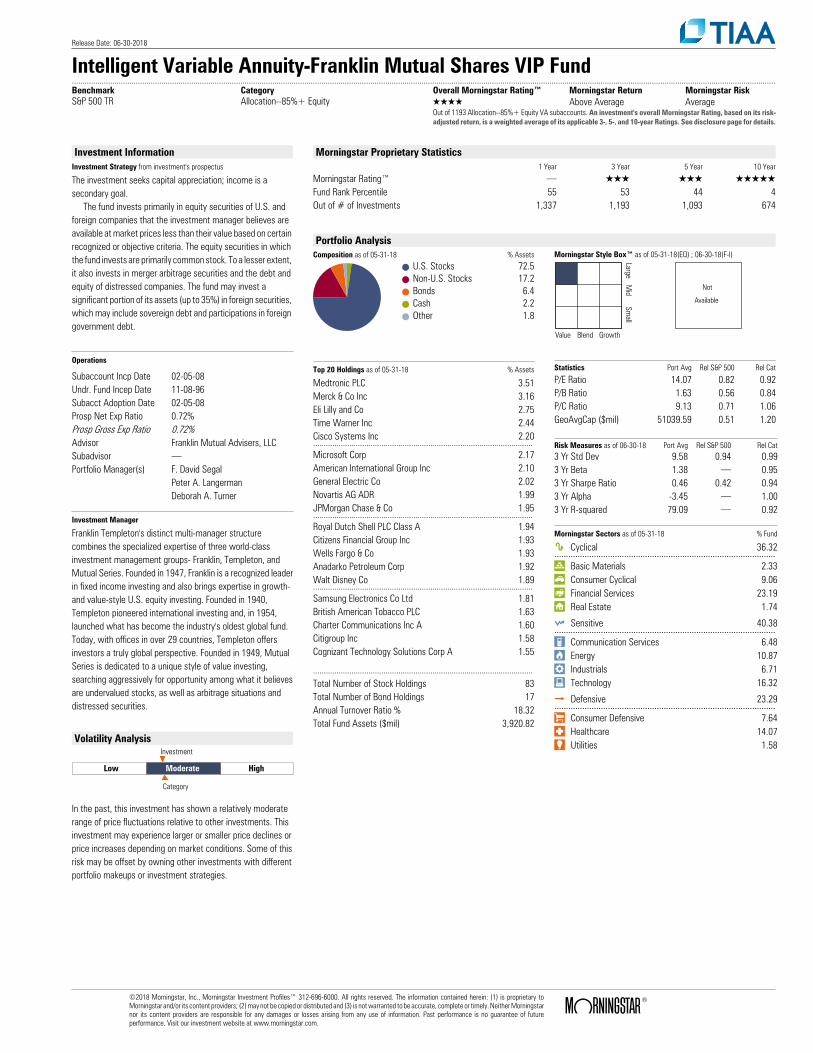
Release Date: 06-30-2018
Intelligent Variable Annuity-Franklin Mutual Shares VIP Fund..........................................................................................................................................................................................................................................................................................................................................Benchmark Category Overall Morningstar Rating™ Morningstar Return Morningstar RiskS&P 500 TR Allocation--85%+ Equity QQQQ Above Average Average
Out of 1193 Allocation--85%+ Equity VA subaccounts. An investment's overall Morningstar Rating, based on its risk-adjusted return, is a weighted average of its applicable 3-, 5-, and 10-year Ratings. See disclosure page for details.
Investment InformationInvestment Strategy from investment's prospectus
The investment seeks capital appreciation; income is a secondary goal. The fund invests primarily in equity securities of U.S. and foreign companies that the investment manager believes are available at market prices less than their value based on certain recognized or objective criteria. The equity securities in which the fund invests are primarily common stock. To a lesser extent, it also invests in merger arbitrage securities and the debt and equity of distressed companies. The fund may invest a significant portion of its assets (up to 35%) in foreign securities, which may include sovereign debt and participations in foreign government debt.
Operations
Subaccount Incp Date 02-05-08Undr. Fund Incep Date 11-08-96Subacct Adoption Date 02-05-08Prosp Net Exp Ratio 0.72%Prosp Gross Exp Ratio 0.72%Advisor Franklin Mutual Advisers, LLCSubadvisor .Portfolio Manager(s) F. David Segal
Peter A. LangermanDeborah A. Turner
Investment Manager
Franklin Templeton's distinct multi-manager structurecombines the specialized expertise of three world-classinvestment management groups- Franklin, Templeton, andMutual Series. Founded in 1947, Franklin is a recognized leaderin fixed income investing and also brings expertise in growth-and value-style U.S. equity investing. Founded in 1940,Templeton pioneered international investing and, in 1954,launched what has become the industry's oldest global fund.Today, with offices in over 29 countries, Templeton offersinvestors a truly global perspective. Founded in 1949, MutualSeries is dedicated to a unique style of value investing,searching aggressively for opportunity among what it believesare undervalued stocks, as well as arbitrage situations anddistressed securities.
Volatility Analysis
Low Moderate High
Investment
Category
In the past, this investment has shown a relatively moderaterange of price fluctuations relative to other investments. Thisinvestment may experience larger or smaller price declines orprice increases depending on market conditions. Some of thisrisk may be offset by owning other investments with differentportfolio makeups or investment strategies.
Morningstar Proprietary Statistics1 Year 3 Year 5 Year 10 Year
Morningstar Rating™ . QQQ QQQ QQQQQFund Rank Percentile 55 53 44 4Out of # of Investments 1,337 1,193 1,093 674
Portfolio AnalysisComposition as of 05-31-18 % Assets
U.S. Stocks 72.5Non-U.S. Stocks 17.2Bonds 6.4Cash 2.2Other 1.8
Morningstar Style Box™ as of 05-31-18(EQ) ; 06-30-18(F-I)
LargeM
idSm
all
Value Blend Growth
Not
Available
Top 20 Holdings as of 05-31-18 % Assets
Medtronic PLC 3.51Merck & Co Inc 3.16Eli Lilly and Co 2.75Time Warner Inc 2.44Cisco Systems Inc 2.20.......................................................................................................Microsoft Corp 2.17American International Group Inc 2.10General Electric Co 2.02Novartis AG ADR 1.99JPMorgan Chase & Co 1.95.......................................................................................................Royal Dutch Shell PLC Class A 1.94Citizens Financial Group Inc 1.93Wells Fargo & Co 1.93Anadarko Petroleum Corp 1.92Walt Disney Co 1.89.......................................................................................................Samsung Electronics Co Ltd 1.81British American Tobacco PLC 1.63Charter Communications Inc A 1.60Citigroup Inc 1.58Cognizant Technology Solutions Corp A 1.55
.......................................................................................................Total Number of Stock Holdings 83Total Number of Bond Holdings 17Annual Turnover Ratio % 18.32Total Fund Assets ($mil) 3,920.82
Statistics Port Avg Rel S&P 500 Rel Cat
P/E Ratio 14.07 0.82 0.92P/B Ratio 1.63 0.56 0.84P/C Ratio 9.13 0.71 1.06GeoAvgCap ($mil) 51039.59 0.51 1.20
Risk Measures as of 06-30-18 Port Avg Rel S&P 500 Rel Cat3 Yr Std Dev 9.58 0.94 0.993 Yr Beta 1.38 . 0.953 Yr Sharpe Ratio 0.46 0.42 0.943 Yr Alpha -3.45 . 1.003 Yr R-squared 79.09 . 0.92
Morningstar Sectors as of 05-31-18 % Fund
h Cyclical 36.32...............................................................................................r Basic Materials 2.33t Consumer Cyclical 9.06y Financial Services 23.19u Real Estate 1.74
j Sensitive 40.38...............................................................................................i Communication Services 6.48o Energy 10.87p Industrials 6.71a Technology 16.32
k Defensive 23.29...............................................................................................s Consumer Defensive 7.64d Healthcare 14.07f Utilities 1.58
©2018 Morningstar, Inc., Morningstar Investment Profiles™ 312-696-6000. All rights reserved. The information contained herein: (1) is proprietary toMorningstar and/or its content providers; (2) may not be copied or distributed and (3) is not warranted to be accurate, complete or timely. Neither Morningstarnor its content providers are responsible for any damages or losses arising from any use of information. Past performance is no guarantee of futureperformance. Visit our investment website at www.morningstar.com.
ß®
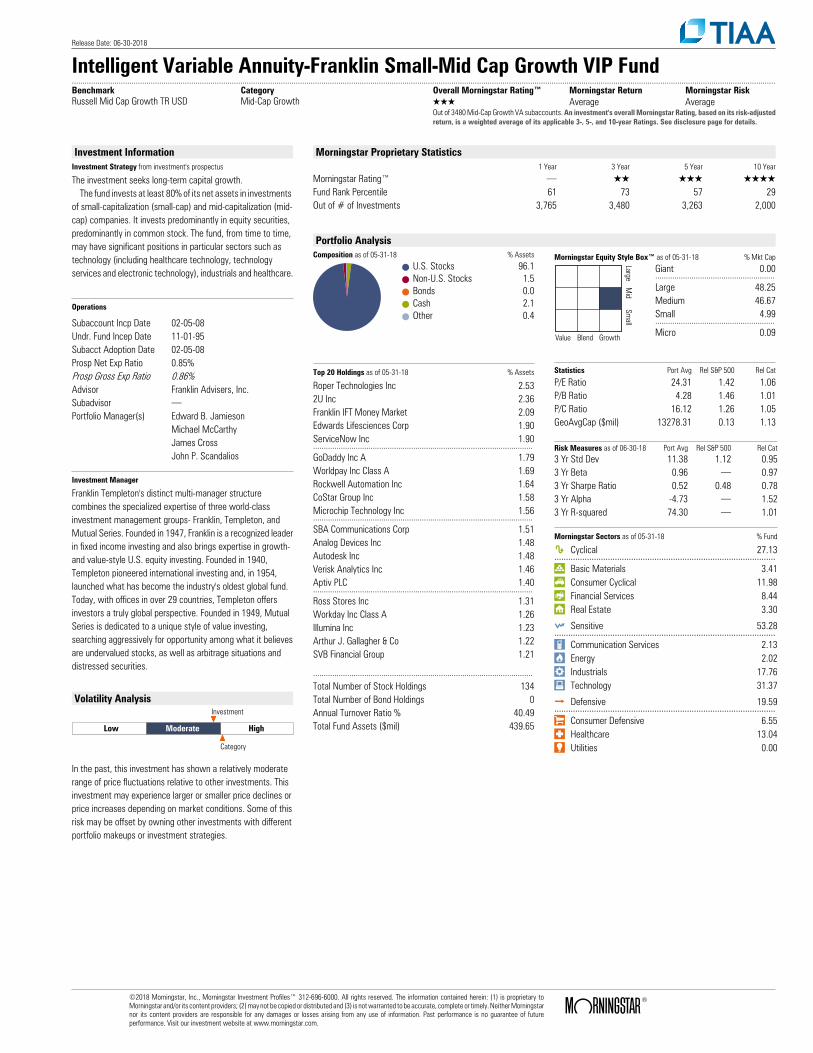
Release Date: 06-30-2018
Intelligent Variable Annuity-Franklin Small-Mid Cap Growth VIP Fund..........................................................................................................................................................................................................................................................................................................................................Benchmark Category Overall Morningstar Rating™ Morningstar Return Morningstar RiskRussell Mid Cap Growth TR USD Mid-Cap Growth QQQ Average Average
Out of 3480 Mid-Cap Growth VA subaccounts. An investment's overall Morningstar Rating, based on its risk-adjustedreturn, is a weighted average of its applicable 3-, 5-, and 10-year Ratings. See disclosure page for details.
Investment InformationInvestment Strategy from investment's prospectus
The investment seeks long-term capital growth. The fund invests at least 80% of its net assets in investments of small-capitalization (small-cap) and mid-capitalization (mid-cap) companies. It invests predominantly in equity securities, predominantly in common stock. The fund, from time to time, may have significant positions in particular sectors such as technology (including healthcare technology, technology services and electronic technology), industrials and healthcare.
Operations
Subaccount Incp Date 02-05-08Undr. Fund Incep Date 11-01-95Subacct Adoption Date 02-05-08Prosp Net Exp Ratio 0.85%Prosp Gross Exp Ratio 0.86%Advisor Franklin Advisers, Inc.Subadvisor .Portfolio Manager(s) Edward B. Jamieson
Michael McCarthyJames CrossJohn P. Scandalios
Investment Manager
Franklin Templeton's distinct multi-manager structurecombines the specialized expertise of three world-classinvestment management groups- Franklin, Templeton, andMutual Series. Founded in 1947, Franklin is a recognized leaderin fixed income investing and also brings expertise in growth-and value-style U.S. equity investing. Founded in 1940,Templeton pioneered international investing and, in 1954,launched what has become the industry's oldest global fund.Today, with offices in over 29 countries, Templeton offersinvestors a truly global perspective. Founded in 1949, MutualSeries is dedicated to a unique style of value investing,searching aggressively for opportunity among what it believesare undervalued stocks, as well as arbitrage situations anddistressed securities.
Volatility Analysis
Low Moderate High
Investment
Category
In the past, this investment has shown a relatively moderaterange of price fluctuations relative to other investments. Thisinvestment may experience larger or smaller price declines orprice increases depending on market conditions. Some of thisrisk may be offset by owning other investments with differentportfolio makeups or investment strategies.
Morningstar Proprietary Statistics1 Year 3 Year 5 Year 10 Year
Morningstar Rating™ . QQ QQQ QQQQFund Rank Percentile 61 73 57 29Out of # of Investments 3,765 3,480 3,263 2,000
Portfolio AnalysisComposition as of 05-31-18 % Assets
U.S. Stocks 96.1Non-U.S. Stocks 1.5Bonds 0.0Cash 2.1Other 0.4
Morningstar Equity Style Box™ as of 05-31-18 % Mkt Cap
LargeM
idSm
all
Value Blend Growth
Giant 0.00........................................................Large 48.25Medium 46.67Small 4.99........................................................Micro 0.09
Top 20 Holdings as of 05-31-18 % Assets
Roper Technologies Inc 2.532U Inc 2.36Franklin IFT Money Market 2.09Edwards Lifesciences Corp 1.90ServiceNow Inc 1.90.......................................................................................................GoDaddy Inc A 1.79Worldpay Inc Class A 1.69Rockwell Automation Inc 1.64CoStar Group Inc 1.58Microchip Technology Inc 1.56.......................................................................................................SBA Communications Corp 1.51Analog Devices Inc 1.48Autodesk Inc 1.48Verisk Analytics Inc 1.46Aptiv PLC 1.40.......................................................................................................Ross Stores Inc 1.31Workday Inc Class A 1.26Illumina Inc 1.23Arthur J. Gallagher & Co 1.22SVB Financial Group 1.21
.......................................................................................................Total Number of Stock Holdings 134Total Number of Bond Holdings 0Annual Turnover Ratio % 40.49Total Fund Assets ($mil) 439.65
Statistics Port Avg Rel S&P 500 Rel Cat
P/E Ratio 24.31 1.42 1.06P/B Ratio 4.28 1.46 1.01P/C Ratio 16.12 1.26 1.05GeoAvgCap ($mil) 13278.31 0.13 1.13
Risk Measures as of 06-30-18 Port Avg Rel S&P 500 Rel Cat3 Yr Std Dev 11.38 1.12 0.953 Yr Beta 0.96 . 0.973 Yr Sharpe Ratio 0.52 0.48 0.783 Yr Alpha -4.73 . 1.523 Yr R-squared 74.30 . 1.01
Morningstar Sectors as of 05-31-18 % Fund
h Cyclical 27.13...............................................................................................r Basic Materials 3.41t Consumer Cyclical 11.98y Financial Services 8.44u Real Estate 3.30
j Sensitive 53.28...............................................................................................i Communication Services 2.13o Energy 2.02p Industrials 17.76a Technology 31.37
k Defensive 19.59...............................................................................................s Consumer Defensive 6.55d Healthcare 13.04f Utilities 0.00
©2018 Morningstar, Inc., Morningstar Investment Profiles™ 312-696-6000. All rights reserved. The information contained herein: (1) is proprietary toMorningstar and/or its content providers; (2) may not be copied or distributed and (3) is not warranted to be accurate, complete or timely. Neither Morningstarnor its content providers are responsible for any damages or losses arising from any use of information. Past performance is no guarantee of futureperformance. Visit our investment website at www.morningstar.com.
ß®
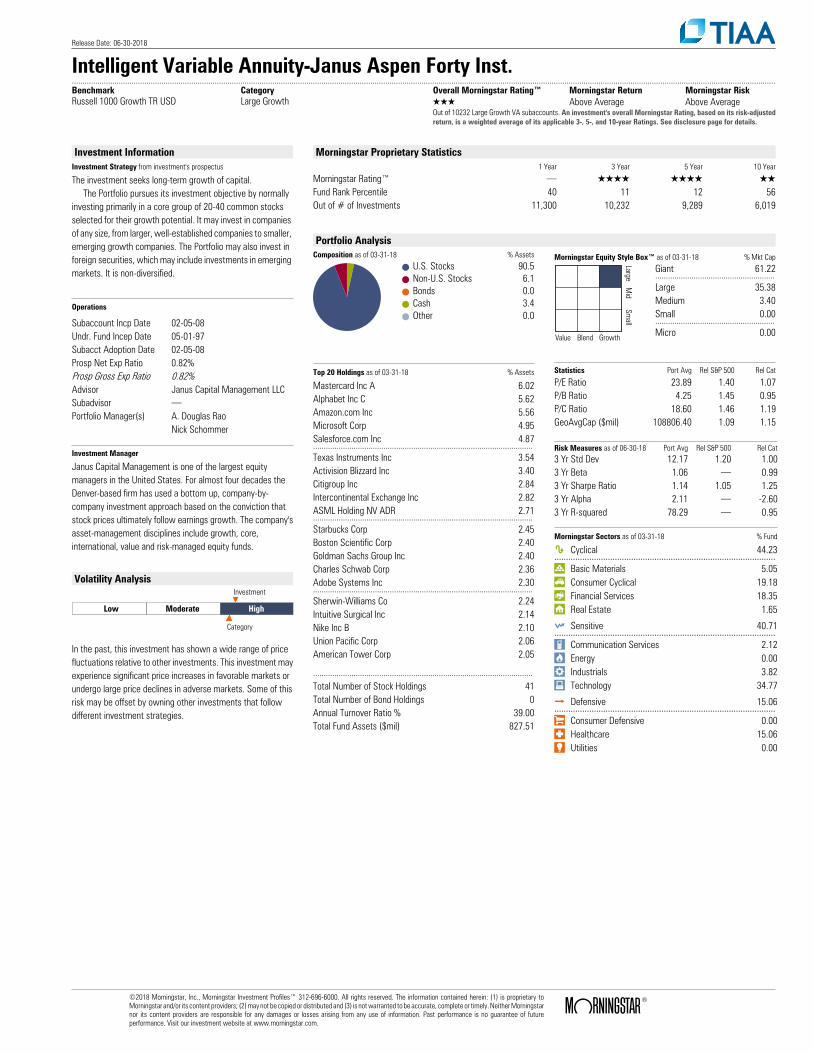
Release Date: 06-30-2018
Intelligent Variable Annuity-Janus Aspen Forty Inst...........................................................................................................................................................................................................................................................................................................................................Benchmark Category Overall Morningstar Rating™ Morningstar Return Morningstar RiskRussell 1000 Growth TR USD Large Growth QQQ Above Average Above Average
Out of 10232 Large Growth VA subaccounts. An investment's overall Morningstar Rating, based on its risk-adjustedreturn, is a weighted average of its applicable 3-, 5-, and 10-year Ratings. See disclosure page for details.
Investment InformationInvestment Strategy from investment's prospectus
The investment seeks long-term growth of capital. The Portfolio pursues its investment objective by normally investing primarily in a core group of 20-40 common stocks selected for their growth potential. It may invest in companies of any size, from larger, well-established companies to smaller, emerging growth companies. The Portfolio may also invest in foreign securities, which may include investments in emerging markets. It is non-diversified.
Operations
Subaccount Incp Date 02-05-08Undr. Fund Incep Date 05-01-97Subacct Adoption Date 02-05-08Prosp Net Exp Ratio 0.82%Prosp Gross Exp Ratio 0.82%Advisor Janus Capital Management LLCSubadvisor .Portfolio Manager(s) A. Douglas Rao
Nick Schommer
Investment Manager
Janus Capital Management is one of the largest equitymanagers in the United States. For almost four decades theDenver-based firm has used a bottom up, company-by-company investment approach based on the conviction thatstock prices ultimately follow earnings growth. The company'sasset-management disciplines include growth, core,international, value and risk-managed equity funds.
Volatility Analysis
Low Moderate High
Investment
Category
In the past, this investment has shown a wide range of pricefluctuations relative to other investments. This investment mayexperience significant price increases in favorable markets orundergo large price declines in adverse markets. Some of thisrisk may be offset by owning other investments that followdifferent investment strategies.
Morningstar Proprietary Statistics1 Year 3 Year 5 Year 10 Year
Morningstar Rating™ . QQQQ QQQQ QQFund Rank Percentile 40 11 12 56Out of # of Investments 11,300 10,232 9,289 6,019
Portfolio AnalysisComposition as of 03-31-18 % Assets
U.S. Stocks 90.5Non-U.S. Stocks 6.1Bonds 0.0Cash 3.4Other 0.0
Morningstar Equity Style Box™ as of 03-31-18 % Mkt Cap
LargeM
idSm
all
Value Blend Growth
Giant 61.22........................................................Large 35.38Medium 3.40Small 0.00........................................................Micro 0.00
Top 20 Holdings as of 03-31-18 % Assets
Mastercard Inc A 6.02Alphabet Inc C 5.62Amazon.com Inc 5.56Microsoft Corp 4.95Salesforce.com Inc 4.87.......................................................................................................Texas Instruments Inc 3.54Activision Blizzard Inc 3.40Citigroup Inc 2.84Intercontinental Exchange Inc 2.82ASML Holding NV ADR 2.71.......................................................................................................Starbucks Corp 2.45Boston Scientific Corp 2.40Goldman Sachs Group Inc 2.40Charles Schwab Corp 2.36Adobe Systems Inc 2.30.......................................................................................................Sherwin-Williams Co 2.24Intuitive Surgical Inc 2.14Nike Inc B 2.10Union Pacific Corp 2.06American Tower Corp 2.05
.......................................................................................................Total Number of Stock Holdings 41Total Number of Bond Holdings 0Annual Turnover Ratio % 39.00Total Fund Assets ($mil) 827.51
Statistics Port Avg Rel S&P 500 Rel Cat
P/E Ratio 23.89 1.40 1.07P/B Ratio 4.25 1.45 0.95P/C Ratio 18.60 1.46 1.19GeoAvgCap ($mil) 108806.40 1.09 1.15
Risk Measures as of 06-30-18 Port Avg Rel S&P 500 Rel Cat3 Yr Std Dev 12.17 1.20 1.003 Yr Beta 1.06 . 0.993 Yr Sharpe Ratio 1.14 1.05 1.253 Yr Alpha 2.11 . -2.603 Yr R-squared 78.29 . 0.95
Morningstar Sectors as of 03-31-18 % Fund
h Cyclical 44.23...............................................................................................r Basic Materials 5.05t Consumer Cyclical 19.18y Financial Services 18.35u Real Estate 1.65
j Sensitive 40.71...............................................................................................i Communication Services 2.12o Energy 0.00p Industrials 3.82a Technology 34.77
k Defensive 15.06...............................................................................................s Consumer Defensive 0.00d Healthcare 15.06f Utilities 0.00
©2018 Morningstar, Inc., Morningstar Investment Profiles™ 312-696-6000. All rights reserved. The information contained herein: (1) is proprietary toMorningstar and/or its content providers; (2) may not be copied or distributed and (3) is not warranted to be accurate, complete or timely. Neither Morningstarnor its content providers are responsible for any damages or losses arising from any use of information. Past performance is no guarantee of futureperformance. Visit our investment website at www.morningstar.com.
ß®

Release Date: 06-30-2018
Intelligent Variable Annuity-Janus Aspen Overseas Inst...........................................................................................................................................................................................................................................................................................................................................Benchmark Category Overall Morningstar Rating™ Morningstar Return Morningstar RiskMSCI ACWI Ex USA NR USD Foreign Large Blend QQ Below Average High
Out of 2661 Foreign Large Blend VA subaccounts. An investment's overall Morningstar Rating, based on its risk-adjusted return, is a weighted average of its applicable 3-, 5-, and 10-year Ratings. See disclosure page for details.
Investment InformationInvestment Strategy from investment's prospectus
The investment seeks long-term growth of capital. The Portfolio pursues its investment objective by investing at least 80% of its net assets in securities of issuers or companies from countries outside of the United States. It normally invests in securities of issuers from several different countries, excluding the United States. Although the Portfolio typically invests 80% or more of its assets in issuers that are economically tied to countries outside the United States, it also may normally invest up to 20% of its net assets, measured at the time of purchase, in U.S. issuers, and it may invest all or substantially all of its assets in a single country.
Operations
Subaccount Incp Date 02-05-08Undr. Fund Incep Date 05-02-94Subacct Adoption Date 02-05-08Prosp Net Exp Ratio 0.57%Prosp Gross Exp Ratio 0.57%Advisor Janus Capital Management LLCSubadvisor .Portfolio Manager(s) George P. Maris
Julian McManusGarth Yettick
Investment Manager
Janus Capital Management is one of the largest equitymanagers in the United States. For almost four decades theDenver-based firm has used a bottom up, company-by-company investment approach based on the conviction thatstock prices ultimately follow earnings growth. The company'sasset-management disciplines include growth, core,international, value and risk-managed equity funds.
Volatility Analysis
Low Moderate High
Investment
Category
In the past, this investment has shown a wide range of pricefluctuations relative to other investments. This investment mayexperience significant price increases in favorable markets orundergo large price declines in adverse markets. Some of thisrisk may be offset by owning other investments that followdifferent investment strategies.
Morningstar Proprietary Statistics1 Year 3 Year 5 Year 10 Year
Morningstar Rating™ . QQ QQ QQFund Rank Percentile 1 87 90 82Out of # of Investments 3,003 2,661 2,265 1,378
Portfolio AnalysisComposition as of 03-31-18 % Assets
U.S. Stocks 6.1Non-U.S. Stocks 93.9Bonds 0.0Cash 0.0Other 0.0
Morningstar Equity Style Box™ as of 03-31-18 % Mkt Cap
LargeM
idSm
all
Value Blend Growth
Giant 63.96........................................................Large 22.54Medium 12.41Small 1.09........................................................Micro 0.00
Top 20 Holdings as of 03-31-18 % Assets
Alibaba Group Holding Ltd ADR 4.82BNP Paribas 4.59Nippon Telegraph & Telephone Corp 3.95Safran SA 3.64Tencent Holdings Ltd 3.56.......................................................................................................ASML Holding NV 3.46Diageo PLC 3.43Mitsubishi UFJ Financial Group Inc 3.35AIA Group Ltd 3.04Eiffage SA 2.98.......................................................................................................ING Groep NV 2.88China Construction Bank Corp H 2.81NEXON Co Ltd 2.74Rio Tinto Ltd 2.64Sony Financial Holdings Inc 2.59.......................................................................................................GVC Holdings PLC 2.57Sony Corp 2.38Ambev SA 2.30Shire PLC 2.27Canadian Natural Resources Ltd 2.26
.......................................................................................................Total Number of Stock Holdings 49Total Number of Bond Holdings 0Annual Turnover Ratio % 33.00Total Fund Assets ($mil) 756.59
Statistics Port Avg Rel S&P 500 Rel Cat
P/E Ratio 13.65 0.80 0.95P/B Ratio 1.36 0.46 0.80P/C Ratio 3.32 0.26 0.62GeoAvgCap ($mil) 48525.89 0.49 1.34
Risk Measures as of 06-30-18 Port Avg Rel S&P 500 Rel Cat3 Yr Std Dev 15.69 1.54 1.333 Yr Beta 1.21 . 1.323 Yr Sharpe Ratio 0.10 0.09 0.403 Yr Alpha -4.45 . 2.563 Yr R-squared 88.14 . 0.99
Morningstar World Regions as of 03-31-18 % Fund
Americas 12.97........................................................................................................North America 8.35Latin America 4.61
Greater Europe 38.23........................................................................................................United Kingdom 9.46Europe Developed 28.77Europe Emerging 0.00Africa/Middle East 0.00
Greater Asia 48.80........................................................................................................Japan 19.37Australasia 2.64Asia Developed 6.52Asia Emerging 20.27
©2018 Morningstar, Inc., Morningstar Investment Profiles™ 312-696-6000. All rights reserved. The information contained herein: (1) is proprietary toMorningstar and/or its content providers; (2) may not be copied or distributed and (3) is not warranted to be accurate, complete or timely. Neither Morningstarnor its content providers are responsible for any damages or losses arising from any use of information. Past performance is no guarantee of futureperformance. Visit our investment website at www.morningstar.com.
ß®
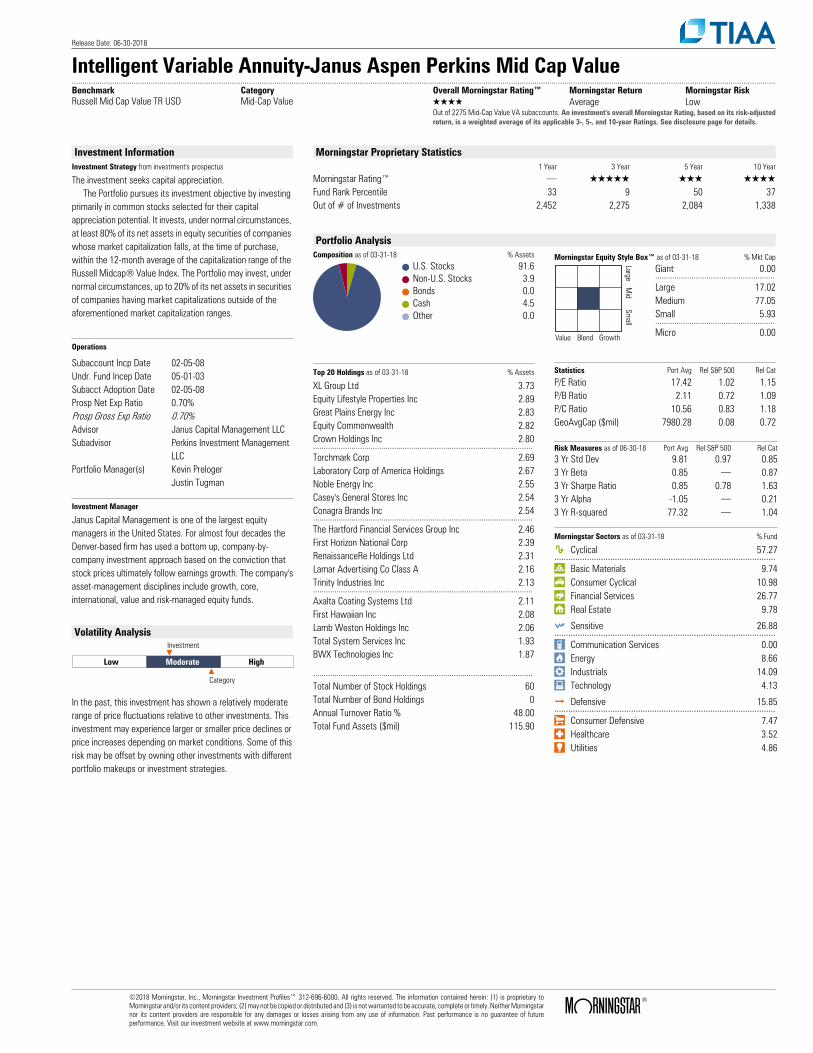
Release Date: 06-30-2018
Intelligent Variable Annuity-Janus Aspen Perkins Mid Cap Value..........................................................................................................................................................................................................................................................................................................................................Benchmark Category Overall Morningstar Rating™ Morningstar Return Morningstar RiskRussell Mid Cap Value TR USD Mid-Cap Value QQQQ Average Low
Out of 2275 Mid-Cap Value VA subaccounts. An investment's overall Morningstar Rating, based on its risk-adjustedreturn, is a weighted average of its applicable 3-, 5-, and 10-year Ratings. See disclosure page for details.
Investment InformationInvestment Strategy from investment's prospectus
The investment seeks capital appreciation. The Portfolio pursues its investment objective by investing primarily in common stocks selected for their capital appreciation potential. It invests, under normal circumstances, at least 80% of its net assets in equity securities of companies whose market capitalization falls, at the time of purchase, within the 12-month average of the capitalization range of the Russell Midcap® Value Index. The Portfolio may invest, under normal circumstances, up to 20% of its net assets in securities of companies having market capitalizations outside of the aforementioned market capitalization ranges.
Operations
Subaccount Incp Date 02-05-08Undr. Fund Incep Date 05-01-03Subacct Adoption Date 02-05-08Prosp Net Exp Ratio 0.70%Prosp Gross Exp Ratio 0.70%Advisor Janus Capital Management LLCSubadvisor Perkins Investment Management
LLCPortfolio Manager(s) Kevin Preloger
Justin Tugman
Investment Manager
Janus Capital Management is one of the largest equitymanagers in the United States. For almost four decades theDenver-based firm has used a bottom up, company-by-company investment approach based on the conviction thatstock prices ultimately follow earnings growth. The company'sasset-management disciplines include growth, core,international, value and risk-managed equity funds.
Volatility Analysis
Low Moderate High
Investment
Category
In the past, this investment has shown a relatively moderaterange of price fluctuations relative to other investments. Thisinvestment may experience larger or smaller price declines orprice increases depending on market conditions. Some of thisrisk may be offset by owning other investments with differentportfolio makeups or investment strategies.
Morningstar Proprietary Statistics1 Year 3 Year 5 Year 10 Year
Morningstar Rating™ . QQQQQ QQQ QQQQFund Rank Percentile 33 9 50 37Out of # of Investments 2,452 2,275 2,084 1,338
Portfolio AnalysisComposition as of 03-31-18 % Assets
U.S. Stocks 91.6Non-U.S. Stocks 3.9Bonds 0.0Cash 4.5Other 0.0
Morningstar Equity Style Box™ as of 03-31-18 % Mkt Cap
LargeM
idSm
all
Value Blend Growth
Giant 0.00........................................................Large 17.02Medium 77.05Small 5.93........................................................Micro 0.00
Top 20 Holdings as of 03-31-18 % Assets
XL Group Ltd 3.73Equity Lifestyle Properties Inc 2.89Great Plains Energy Inc 2.83Equity Commonwealth 2.82Crown Holdings Inc 2.80.......................................................................................................Torchmark Corp 2.69Laboratory Corp of America Holdings 2.67Noble Energy Inc 2.55Casey's General Stores Inc 2.54Conagra Brands Inc 2.54.......................................................................................................The Hartford Financial Services Group Inc 2.46First Horizon National Corp 2.39RenaissanceRe Holdings Ltd 2.31Lamar Advertising Co Class A 2.16Trinity Industries Inc 2.13.......................................................................................................Axalta Coating Systems Ltd 2.11First Hawaiian Inc 2.08Lamb Weston Holdings Inc 2.06Total System Services Inc 1.93BWX Technologies Inc 1.87
.......................................................................................................Total Number of Stock Holdings 60Total Number of Bond Holdings 0Annual Turnover Ratio % 48.00Total Fund Assets ($mil) 115.90
Statistics Port Avg Rel S&P 500 Rel Cat
P/E Ratio 17.42 1.02 1.15P/B Ratio 2.11 0.72 1.09P/C Ratio 10.56 0.83 1.18GeoAvgCap ($mil) 7980.28 0.08 0.72
Risk Measures as of 06-30-18 Port Avg Rel S&P 500 Rel Cat3 Yr Std Dev 9.81 0.97 0.853 Yr Beta 0.85 . 0.873 Yr Sharpe Ratio 0.85 0.78 1.633 Yr Alpha -1.05 . 0.213 Yr R-squared 77.32 . 1.04
Morningstar Sectors as of 03-31-18 % Fund
h Cyclical 57.27...............................................................................................r Basic Materials 9.74t Consumer Cyclical 10.98y Financial Services 26.77u Real Estate 9.78
j Sensitive 26.88...............................................................................................i Communication Services 0.00o Energy 8.66p Industrials 14.09a Technology 4.13
k Defensive 15.85...............................................................................................s Consumer Defensive 7.47d Healthcare 3.52f Utilities 4.86
©2018 Morningstar, Inc., Morningstar Investment Profiles™ 312-696-6000. All rights reserved. The information contained herein: (1) is proprietary toMorningstar and/or its content providers; (2) may not be copied or distributed and (3) is not warranted to be accurate, complete or timely. Neither Morningstarnor its content providers are responsible for any damages or losses arising from any use of information. Past performance is no guarantee of futureperformance. Visit our investment website at www.morningstar.com.
ß®
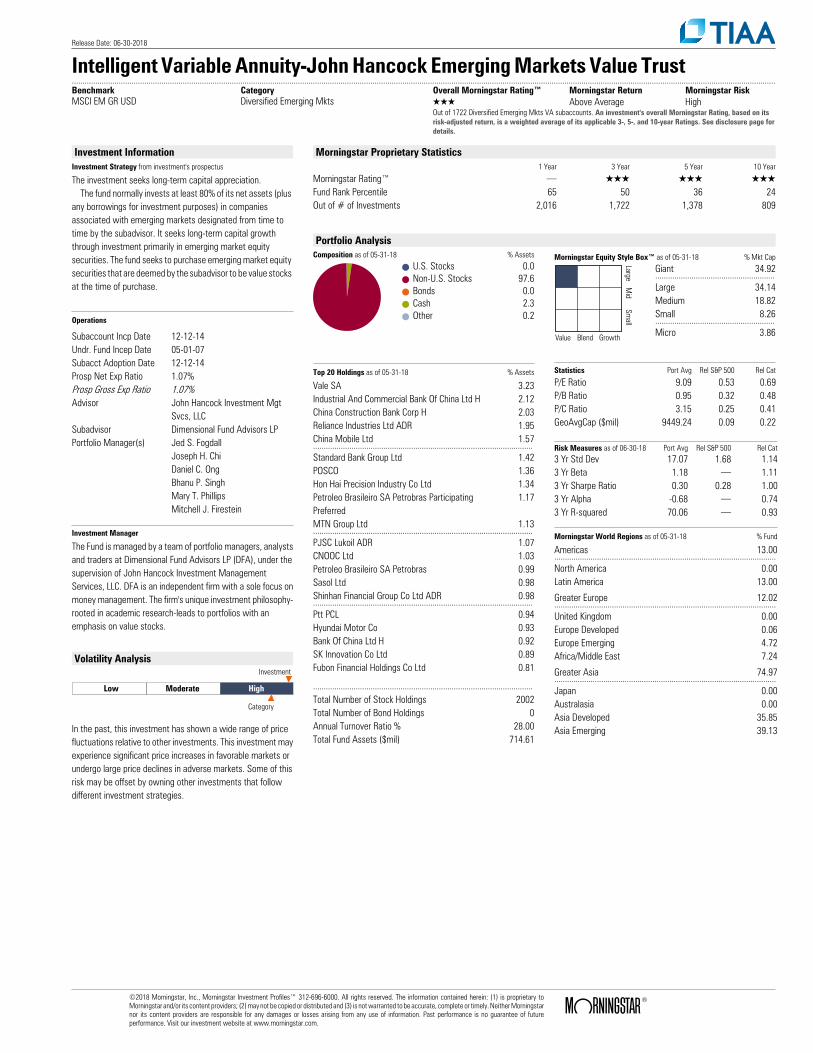
Release Date: 06-30-2018
Intelligent Variable Annuity-John Hancock Emerging Markets Value Trust..........................................................................................................................................................................................................................................................................................................................................Benchmark Category Overall Morningstar Rating™ Morningstar Return Morningstar RiskMSCI EM GR USD Diversified Emerging Mkts QQQ Above Average High
Out of 1722 Diversified Emerging Mkts VA subaccounts. An investment's overall Morningstar Rating, based on itsrisk-adjusted return, is a weighted average of its applicable 3-, 5-, and 10-year Ratings. See disclosure page fordetails.
Investment InformationInvestment Strategy from investment's prospectus
The investment seeks long-term capital appreciation. The fund normally invests at least 80% of its net assets (plus any borrowings for investment purposes) in companies associated with emerging markets designated from time to time by the subadvisor. It seeks long-term capital growth through investment primarily in emerging market equity securities. The fund seeks to purchase emerging market equity securities that are deemed by the subadvisor to be value stocks at the time of purchase.
Operations
Subaccount Incp Date 12-12-14Undr. Fund Incep Date 05-01-07Subacct Adoption Date 12-12-14Prosp Net Exp Ratio 1.07%Prosp Gross Exp Ratio 1.07%Advisor John Hancock Investment Mgt
Svcs, LLCSubadvisor Dimensional Fund Advisors LPPortfolio Manager(s) Jed S. Fogdall
Joseph H. ChiDaniel C. OngBhanu P. SinghMary T. PhillipsMitchell J. Firestein
Investment Manager
The Fund is managed by a team of portfolio managers, analystsand traders at Dimensional Fund Advisors LP (DFA), under thesupervision of John Hancock Investment ManagementServices, LLC. DFA is an independent firm with a sole focus onmoney management. The firm's unique investment philosophy-rooted in academic research-leads to portfolios with anemphasis on value stocks.
Volatility Analysis
Low Moderate High
Investment
Category
In the past, this investment has shown a wide range of pricefluctuations relative to other investments. This investment mayexperience significant price increases in favorable markets orundergo large price declines in adverse markets. Some of thisrisk may be offset by owning other investments that followdifferent investment strategies.
Morningstar Proprietary Statistics1 Year 3 Year 5 Year 10 Year
Morningstar Rating™ . QQQ QQQ QQQFund Rank Percentile 65 50 36 24Out of # of Investments 2,016 1,722 1,378 809
Portfolio AnalysisComposition as of 05-31-18 % Assets
U.S. Stocks 0.0Non-U.S. Stocks 97.6Bonds 0.0Cash 2.3Other 0.2
Morningstar Equity Style Box™ as of 05-31-18 % Mkt Cap
LargeM
idSm
all
Value Blend Growth
Giant 34.92........................................................Large 34.14Medium 18.82Small 8.26........................................................Micro 3.86
Top 20 Holdings as of 05-31-18 % Assets
Vale SA 3.23Industrial And Commercial Bank Of China Ltd H 2.12China Construction Bank Corp H 2.03Reliance Industries Ltd ADR 1.95China Mobile Ltd 1.57.......................................................................................................Standard Bank Group Ltd 1.42POSCO 1.36Hon Hai Precision Industry Co Ltd 1.34Petroleo Brasileiro SA Petrobras Participating Preferred
1.17
MTN Group Ltd 1.13.......................................................................................................PJSC Lukoil ADR 1.07CNOOC Ltd 1.03Petroleo Brasileiro SA Petrobras 0.99Sasol Ltd 0.98Shinhan Financial Group Co Ltd ADR 0.98.......................................................................................................Ptt PCL 0.94Hyundai Motor Co 0.93Bank Of China Ltd H 0.92SK Innovation Co Ltd 0.89Fubon Financial Holdings Co Ltd 0.81
.......................................................................................................Total Number of Stock Holdings 2002Total Number of Bond Holdings 0Annual Turnover Ratio % 28.00Total Fund Assets ($mil) 714.61
Statistics Port Avg Rel S&P 500 Rel Cat
P/E Ratio 9.09 0.53 0.69P/B Ratio 0.95 0.32 0.48P/C Ratio 3.15 0.25 0.41GeoAvgCap ($mil) 9449.24 0.09 0.22
Risk Measures as of 06-30-18 Port Avg Rel S&P 500 Rel Cat3 Yr Std Dev 17.07 1.68 1.143 Yr Beta 1.18 . 1.113 Yr Sharpe Ratio 0.30 0.28 1.003 Yr Alpha -0.68 . 0.743 Yr R-squared 70.06 . 0.93
Morningstar World Regions as of 05-31-18 % Fund
Americas 13.00........................................................................................................North America 0.00Latin America 13.00
Greater Europe 12.02........................................................................................................United Kingdom 0.00Europe Developed 0.06Europe Emerging 4.72Africa/Middle East 7.24
Greater Asia 74.97........................................................................................................Japan 0.00Australasia 0.00Asia Developed 35.85Asia Emerging 39.13
©2018 Morningstar, Inc., Morningstar Investment Profiles™ 312-696-6000. All rights reserved. The information contained herein: (1) is proprietary toMorningstar and/or its content providers; (2) may not be copied or distributed and (3) is not warranted to be accurate, complete or timely. Neither Morningstarnor its content providers are responsible for any damages or losses arising from any use of information. Past performance is no guarantee of futureperformance. Visit our investment website at www.morningstar.com.
ß®
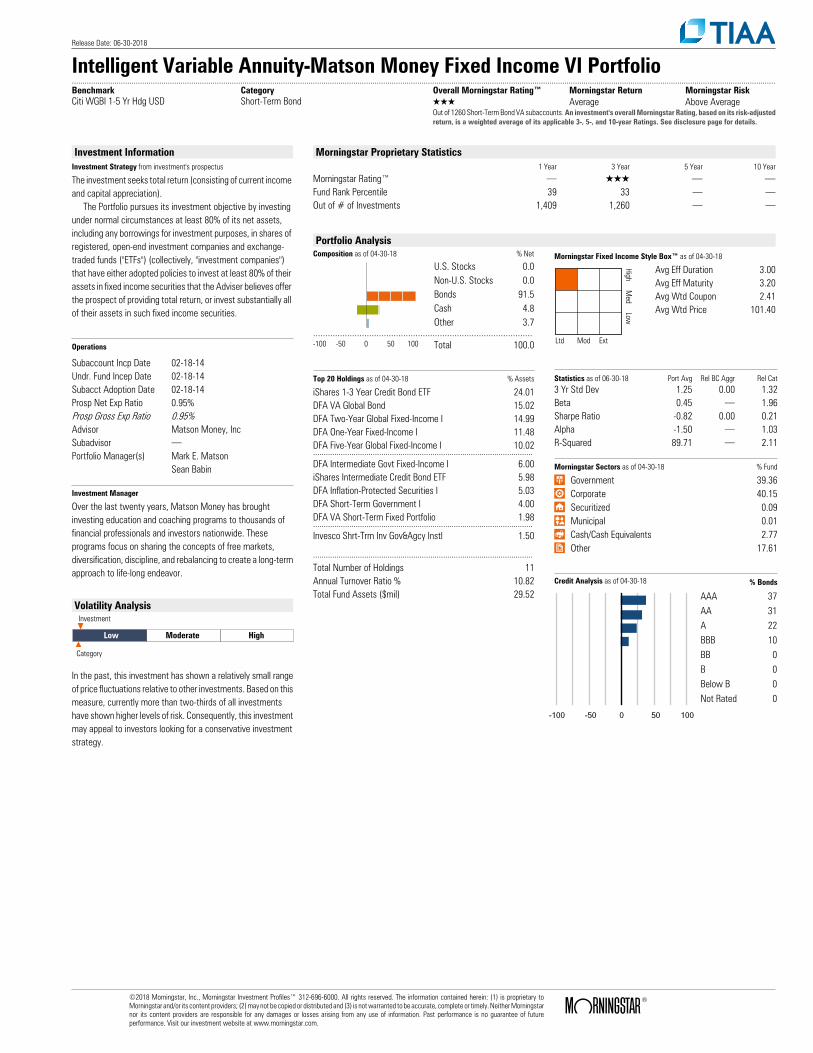
Release Date: 06-30-2018
Intelligent Variable Annuity-Matson Money Fixed Income VI Portfolio..........................................................................................................................................................................................................................................................................................................................................Benchmark Category Overall Morningstar Rating™ Morningstar Return Morningstar RiskCiti WGBI 1-5 Yr Hdg USD Short-Term Bond QQQ Average Above Average
Out of 1260 Short-Term Bond VA subaccounts. An investment's overall Morningstar Rating, based on its risk-adjustedreturn, is a weighted average of its applicable 3-, 5-, and 10-year Ratings. See disclosure page for details.
Investment InformationInvestment Strategy from investment's prospectus
The investment seeks total return (consisting of current income and capital appreciation). The Portfolio pursues its investment objective by investing under normal circumstances at least 80% of its net assets, including any borrowings for investment purposes, in shares of registered, open-end investment companies and exchange-traded funds ("ETFs") (collectively, "investment companies") that have either adopted policies to invest at least 80% of their assets in fixed income securities that the Adviser believes offer the prospect of providing total return, or invest substantially all of their assets in such fixed income securities.
Operations
Subaccount Incp Date 02-18-14Undr. Fund Incep Date 02-18-14Subacct Adoption Date 02-18-14Prosp Net Exp Ratio 0.95%Prosp Gross Exp Ratio 0.95%Advisor Matson Money, IncSubadvisor .Portfolio Manager(s) Mark E. Matson
Sean Babin
Investment Manager
Over the last twenty years, Matson Money has broughtinvesting education and coaching programs to thousands offinancial professionals and investors nationwide. Theseprograms focus on sharing the concepts of free markets,diversification, discipline, and rebalancing to create a long-termapproach to life-long endeavor.
Volatility Analysis
Low Moderate High
Investment
Category
In the past, this investment has shown a relatively small rangeof price fluctuations relative to other investments. Based on thismeasure, currently more than two-thirds of all investmentshave shown higher levels of risk. Consequently, this investmentmay appeal to investors looking for a conservative investmentstrategy.
Morningstar Proprietary Statistics1 Year 3 Year 5 Year 10 Year
Morningstar Rating™ . QQQ . .Fund Rank Percentile 39 33 . .Out of # of Investments 1,409 1,260 . .
Portfolio AnalysisComposition as of 04-30-18 % Net
U.S. Stocks 0.0Non-U.S. Stocks 0.0Bonds 91.5Cash 4.8Other 3.7
..........................................................................................-100 -50 0 50 100 Total 100.0
Morningstar Fixed Income Style Box™ as of 04-30-18
HighM
edLow
Ltd Mod Ext
Avg Eff Duration 3.00Avg Eff Maturity 3.20Avg Wtd Coupon 2.41Avg Wtd Price 101.40
Top 20 Holdings as of 04-30-18 % Assets
iShares 1-3 Year Credit Bond ETF 24.01DFA VA Global Bond 15.02DFA Two-Year Global Fixed-Income I 14.99DFA One-Year Fixed-Income I 11.48DFA Five-Year Global Fixed-Income I 10.02.......................................................................................................DFA Intermediate Govt Fixed-Income I 6.00iShares Intermediate Credit Bond ETF 5.98DFA Inflation-Protected Securities I 5.03DFA Short-Term Government I 4.00DFA VA Short-Term Fixed Portfolio 1.98.......................................................................................................Invesco Shrt-Trm Inv Gov&Agcy Instl 1.50
.......................................................................................................Total Number of Holdings 11Annual Turnover Ratio % 10.82Total Fund Assets ($mil) 29.52
Statistics as of 06-30-18 Port Avg Rel BC Aggr Rel Cat3 Yr Std Dev 1.25 0.00 1.32Beta 0.45 . 1.96Sharpe Ratio -0.82 0.00 0.21Alpha -1.50 . 1.03R-Squared 89.71 . 2.11
Morningstar Sectors as of 04-30-18 % Fund
⁄ Government 39.36› Corporate 40.15€ Securitized 0.09‹ Municipal 0.01fi Cash/Cash Equivalents 2.77± Other 17.61
Credit Analysis as of 04-30-18 % Bonds
-100 -50 0 50 100
AAA 37AA 31A 22BBB 10BB 0B 0Below B 0Not Rated 0
©2018 Morningstar, Inc., Morningstar Investment Profiles™ 312-696-6000. All rights reserved. The information contained herein: (1) is proprietary toMorningstar and/or its content providers; (2) may not be copied or distributed and (3) is not warranted to be accurate, complete or timely. Neither Morningstarnor its content providers are responsible for any damages or losses arising from any use of information. Past performance is no guarantee of futureperformance. Visit our investment website at www.morningstar.com.
ß®
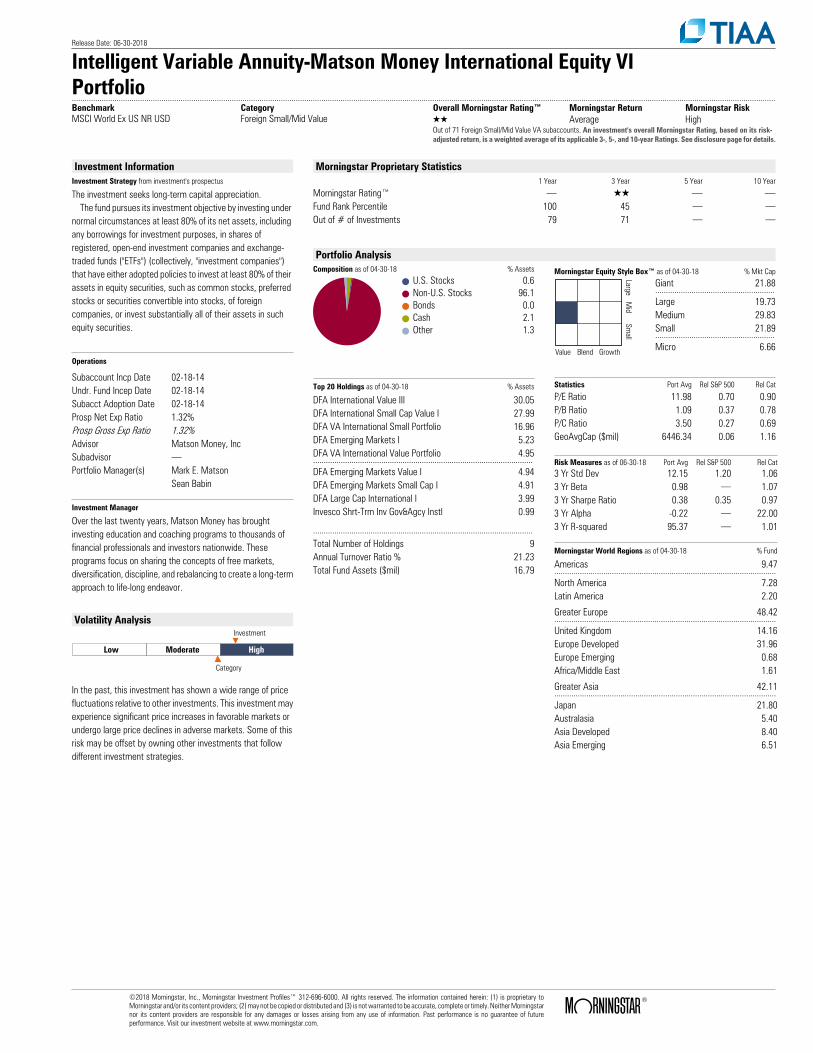
Release Date: 06-30-2018
Intelligent Variable Annuity-Matson Money International Equity VIPortfolio..........................................................................................................................................................................................................................................................................................................................................Benchmark Category Overall Morningstar Rating™ Morningstar Return Morningstar RiskMSCI World Ex US NR USD Foreign Small/Mid Value QQ Average High
Out of 71 Foreign Small/Mid Value VA subaccounts. An investment's overall Morningstar Rating, based on its risk-adjusted return, is a weighted average of its applicable 3-, 5-, and 10-year Ratings. See disclosure page for details.
Investment InformationInvestment Strategy from investment's prospectus
The investment seeks long-term capital appreciation. The fund pursues its investment objective by investing under normal circumstances at least 80% of its net assets, including any borrowings for investment purposes, in shares of registered, open-end investment companies and exchange-traded funds ("ETFs") (collectively, "investment companies") that have either adopted policies to invest at least 80% of their assets in equity securities, such as common stocks, preferred stocks or securities convertible into stocks, of foreign companies, or invest substantially all of their assets in such equity securities.
Operations
Subaccount Incp Date 02-18-14Undr. Fund Incep Date 02-18-14Subacct Adoption Date 02-18-14Prosp Net Exp Ratio 1.32%Prosp Gross Exp Ratio 1.32%Advisor Matson Money, IncSubadvisor .Portfolio Manager(s) Mark E. Matson
Sean Babin
Investment Manager
Over the last twenty years, Matson Money has broughtinvesting education and coaching programs to thousands offinancial professionals and investors nationwide. Theseprograms focus on sharing the concepts of free markets,diversification, discipline, and rebalancing to create a long-termapproach to life-long endeavor.
Volatility Analysis
Low Moderate High
Investment
Category
In the past, this investment has shown a wide range of pricefluctuations relative to other investments. This investment mayexperience significant price increases in favorable markets orundergo large price declines in adverse markets. Some of thisrisk may be offset by owning other investments that followdifferent investment strategies.
Morningstar Proprietary Statistics1 Year 3 Year 5 Year 10 Year
Morningstar Rating™ . QQ . .Fund Rank Percentile 100 45 . .Out of # of Investments 79 71 . .
Portfolio AnalysisComposition as of 04-30-18 % Assets
U.S. Stocks 0.6Non-U.S. Stocks 96.1Bonds 0.0Cash 2.1Other 1.3
Morningstar Equity Style Box™ as of 04-30-18 % Mkt Cap
LargeM
idSm
all
Value Blend Growth
Giant 21.88........................................................Large 19.73Medium 29.83Small 21.89........................................................Micro 6.66
Top 20 Holdings as of 04-30-18 % Assets
DFA International Value III 30.05DFA International Small Cap Value I 27.99DFA VA International Small Portfolio 16.96DFA Emerging Markets I 5.23DFA VA International Value Portfolio 4.95.......................................................................................................DFA Emerging Markets Value I 4.94DFA Emerging Markets Small Cap I 4.91DFA Large Cap International I 3.99Invesco Shrt-Trm Inv Gov&Agcy Instl 0.99
.......................................................................................................Total Number of Holdings 9Annual Turnover Ratio % 21.23Total Fund Assets ($mil) 16.79
Statistics Port Avg Rel S&P 500 Rel Cat
P/E Ratio 11.98 0.70 0.90P/B Ratio 1.09 0.37 0.78P/C Ratio 3.50 0.27 0.69GeoAvgCap ($mil) 6446.34 0.06 1.16
Risk Measures as of 06-30-18 Port Avg Rel S&P 500 Rel Cat3 Yr Std Dev 12.15 1.20 1.063 Yr Beta 0.98 . 1.073 Yr Sharpe Ratio 0.38 0.35 0.973 Yr Alpha -0.22 . 22.003 Yr R-squared 95.37 . 1.01
Morningstar World Regions as of 04-30-18 % Fund
Americas 9.47........................................................................................................North America 7.28Latin America 2.20
Greater Europe 48.42........................................................................................................United Kingdom 14.16Europe Developed 31.96Europe Emerging 0.68Africa/Middle East 1.61
Greater Asia 42.11........................................................................................................Japan 21.80Australasia 5.40Asia Developed 8.40Asia Emerging 6.51
©2018 Morningstar, Inc., Morningstar Investment Profiles™ 312-696-6000. All rights reserved. The information contained herein: (1) is proprietary toMorningstar and/or its content providers; (2) may not be copied or distributed and (3) is not warranted to be accurate, complete or timely. Neither Morningstarnor its content providers are responsible for any damages or losses arising from any use of information. Past performance is no guarantee of futureperformance. Visit our investment website at www.morningstar.com.
ß®
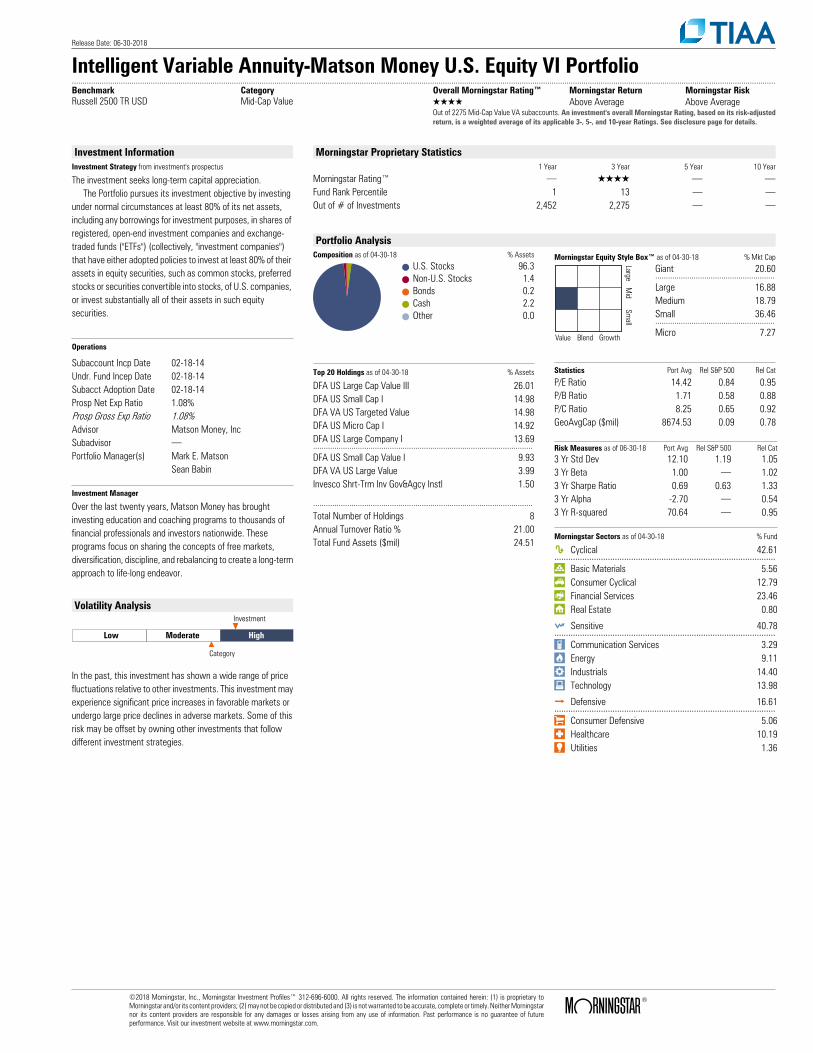
Release Date: 06-30-2018
Intelligent Variable Annuity-Matson Money U.S. Equity VI Portfolio..........................................................................................................................................................................................................................................................................................................................................Benchmark Category Overall Morningstar Rating™ Morningstar Return Morningstar RiskRussell 2500 TR USD Mid-Cap Value QQQQ Above Average Above Average
Out of 2275 Mid-Cap Value VA subaccounts. An investment's overall Morningstar Rating, based on its risk-adjustedreturn, is a weighted average of its applicable 3-, 5-, and 10-year Ratings. See disclosure page for details.
Investment InformationInvestment Strategy from investment's prospectus
The investment seeks long-term capital appreciation. The Portfolio pursues its investment objective by investing under normal circumstances at least 80% of its net assets, including any borrowings for investment purposes, in shares of registered, open-end investment companies and exchange-traded funds ("ETFs") (collectively, "investment companies") that have either adopted policies to invest at least 80% of their assets in equity securities, such as common stocks, preferred stocks or securities convertible into stocks, of U.S. companies, or invest substantially all of their assets in such equity securities.
Operations
Subaccount Incp Date 02-18-14Undr. Fund Incep Date 02-18-14Subacct Adoption Date 02-18-14Prosp Net Exp Ratio 1.08%Prosp Gross Exp Ratio 1.08%Advisor Matson Money, IncSubadvisor .Portfolio Manager(s) Mark E. Matson
Sean Babin
Investment Manager
Over the last twenty years, Matson Money has broughtinvesting education and coaching programs to thousands offinancial professionals and investors nationwide. Theseprograms focus on sharing the concepts of free markets,diversification, discipline, and rebalancing to create a long-termapproach to life-long endeavor.
Volatility Analysis
Low Moderate High
Investment
Category
In the past, this investment has shown a wide range of pricefluctuations relative to other investments. This investment mayexperience significant price increases in favorable markets orundergo large price declines in adverse markets. Some of thisrisk may be offset by owning other investments that followdifferent investment strategies.
Morningstar Proprietary Statistics1 Year 3 Year 5 Year 10 Year
Morningstar Rating™ . QQQQ . .Fund Rank Percentile 1 13 . .Out of # of Investments 2,452 2,275 . .
Portfolio AnalysisComposition as of 04-30-18 % Assets
U.S. Stocks 96.3Non-U.S. Stocks 1.4Bonds 0.2Cash 2.2Other 0.0
Morningstar Equity Style Box™ as of 04-30-18 % Mkt Cap
LargeM
idSm
all
Value Blend Growth
Giant 20.60........................................................Large 16.88Medium 18.79Small 36.46........................................................Micro 7.27
Top 20 Holdings as of 04-30-18 % Assets
DFA US Large Cap Value III 26.01DFA US Small Cap I 14.98DFA VA US Targeted Value 14.98DFA US Micro Cap I 14.92DFA US Large Company I 13.69.......................................................................................................DFA US Small Cap Value I 9.93DFA VA US Large Value 3.99Invesco Shrt-Trm Inv Gov&Agcy Instl 1.50
.......................................................................................................Total Number of Holdings 8Annual Turnover Ratio % 21.00Total Fund Assets ($mil) 24.51
Statistics Port Avg Rel S&P 500 Rel Cat
P/E Ratio 14.42 0.84 0.95P/B Ratio 1.71 0.58 0.88P/C Ratio 8.25 0.65 0.92GeoAvgCap ($mil) 8674.53 0.09 0.78
Risk Measures as of 06-30-18 Port Avg Rel S&P 500 Rel Cat3 Yr Std Dev 12.10 1.19 1.053 Yr Beta 1.00 . 1.023 Yr Sharpe Ratio 0.69 0.63 1.333 Yr Alpha -2.70 . 0.543 Yr R-squared 70.64 . 0.95
Morningstar Sectors as of 04-30-18 % Fund
h Cyclical 42.61...............................................................................................r Basic Materials 5.56t Consumer Cyclical 12.79y Financial Services 23.46u Real Estate 0.80
j Sensitive 40.78...............................................................................................i Communication Services 3.29o Energy 9.11p Industrials 14.40a Technology 13.98
k Defensive 16.61...............................................................................................s Consumer Defensive 5.06d Healthcare 10.19f Utilities 1.36
©2018 Morningstar, Inc., Morningstar Investment Profiles™ 312-696-6000. All rights reserved. The information contained herein: (1) is proprietary toMorningstar and/or its content providers; (2) may not be copied or distributed and (3) is not warranted to be accurate, complete or timely. Neither Morningstarnor its content providers are responsible for any damages or losses arising from any use of information. Past performance is no guarantee of futureperformance. Visit our investment website at www.morningstar.com.
ß®
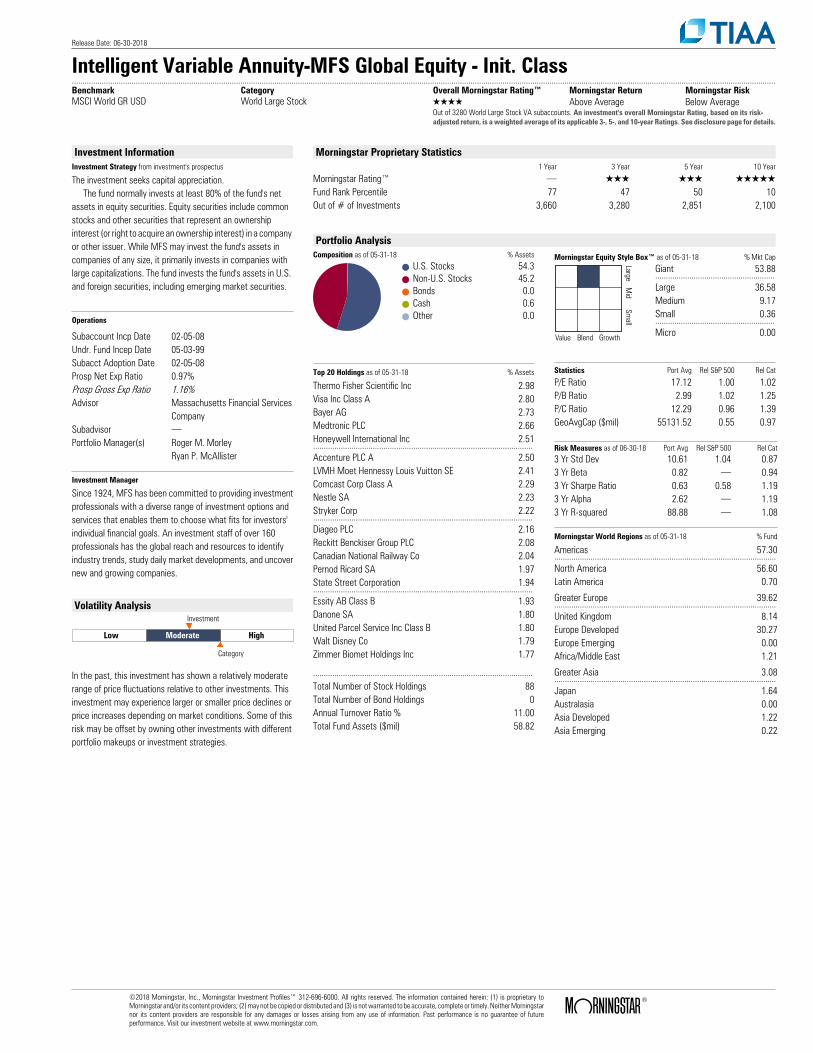
Release Date: 06-30-2018
Intelligent Variable Annuity-MFS Global Equity - Init. Class..........................................................................................................................................................................................................................................................................................................................................Benchmark Category Overall Morningstar Rating™ Morningstar Return Morningstar RiskMSCI World GR USD World Large Stock QQQQ Above Average Below Average
Out of 3280 World Large Stock VA subaccounts. An investment's overall Morningstar Rating, based on its risk-adjusted return, is a weighted average of its applicable 3-, 5-, and 10-year Ratings. See disclosure page for details.
Investment InformationInvestment Strategy from investment's prospectus
The investment seeks capital appreciation. The fund normally invests at least 80% of the fund's net assets in equity securities. Equity securities include common stocks and other securities that represent an ownership interest (or right to acquire an ownership interest) in a company or other issuer. While MFS may invest the fund's assets in companies of any size, it primarily invests in companies with large capitalizations. The fund invests the fund's assets in U.S. and foreign securities, including emerging market securities.
Operations
Subaccount Incp Date 02-05-08Undr. Fund Incep Date 05-03-99Subacct Adoption Date 02-05-08Prosp Net Exp Ratio 0.97%Prosp Gross Exp Ratio 1.16%Advisor Massachusetts Financial Services
CompanySubadvisor .Portfolio Manager(s) Roger M. Morley
Ryan P. McAllister
Investment Manager
Since 1924, MFS has been committed to providing investmentprofessionals with a diverse range of investment options andservices that enables them to choose what fits for investors'individual financial goals. An investment staff of over 160professionals has the global reach and resources to identifyindustry trends, study daily market developments, and uncovernew and growing companies.
Volatility Analysis
Low Moderate High
Investment
Category
In the past, this investment has shown a relatively moderaterange of price fluctuations relative to other investments. Thisinvestment may experience larger or smaller price declines orprice increases depending on market conditions. Some of thisrisk may be offset by owning other investments with differentportfolio makeups or investment strategies.
Morningstar Proprietary Statistics1 Year 3 Year 5 Year 10 Year
Morningstar Rating™ . QQQ QQQ QQQQQFund Rank Percentile 77 47 50 10Out of # of Investments 3,660 3,280 2,851 2,100
Portfolio AnalysisComposition as of 05-31-18 % Assets
U.S. Stocks 54.3Non-U.S. Stocks 45.2Bonds 0.0Cash 0.6Other 0.0
Morningstar Equity Style Box™ as of 05-31-18 % Mkt Cap
LargeM
idSm
all
Value Blend Growth
Giant 53.88........................................................Large 36.58Medium 9.17Small 0.36........................................................Micro 0.00
Top 20 Holdings as of 05-31-18 % Assets
Thermo Fisher Scientific Inc 2.98Visa Inc Class A 2.80Bayer AG 2.73Medtronic PLC 2.66Honeywell International Inc 2.51.......................................................................................................Accenture PLC A 2.50LVMH Moet Hennessy Louis Vuitton SE 2.41Comcast Corp Class A 2.29Nestle SA 2.23Stryker Corp 2.22.......................................................................................................Diageo PLC 2.16Reckitt Benckiser Group PLC 2.08Canadian National Railway Co 2.04Pernod Ricard SA 1.97State Street Corporation 1.94.......................................................................................................Essity AB Class B 1.93Danone SA 1.80United Parcel Service Inc Class B 1.80Walt Disney Co 1.79Zimmer Biomet Holdings Inc 1.77
.......................................................................................................Total Number of Stock Holdings 88Total Number of Bond Holdings 0Annual Turnover Ratio % 11.00Total Fund Assets ($mil) 58.82
Statistics Port Avg Rel S&P 500 Rel Cat
P/E Ratio 17.12 1.00 1.02P/B Ratio 2.99 1.02 1.25P/C Ratio 12.29 0.96 1.39GeoAvgCap ($mil) 55131.52 0.55 0.97
Risk Measures as of 06-30-18 Port Avg Rel S&P 500 Rel Cat3 Yr Std Dev 10.61 1.04 0.873 Yr Beta 0.82 . 0.943 Yr Sharpe Ratio 0.63 0.58 1.193 Yr Alpha 2.62 . 1.193 Yr R-squared 88.88 . 1.08
Morningstar World Regions as of 05-31-18 % Fund
Americas 57.30........................................................................................................North America 56.60Latin America 0.70
Greater Europe 39.62........................................................................................................United Kingdom 8.14Europe Developed 30.27Europe Emerging 0.00Africa/Middle East 1.21
Greater Asia 3.08........................................................................................................Japan 1.64Australasia 0.00Asia Developed 1.22Asia Emerging 0.22
©2018 Morningstar, Inc., Morningstar Investment Profiles™ 312-696-6000. All rights reserved. The information contained herein: (1) is proprietary toMorningstar and/or its content providers; (2) may not be copied or distributed and (3) is not warranted to be accurate, complete or timely. Neither Morningstarnor its content providers are responsible for any damages or losses arising from any use of information. Past performance is no guarantee of futureperformance. Visit our investment website at www.morningstar.com.
ß®
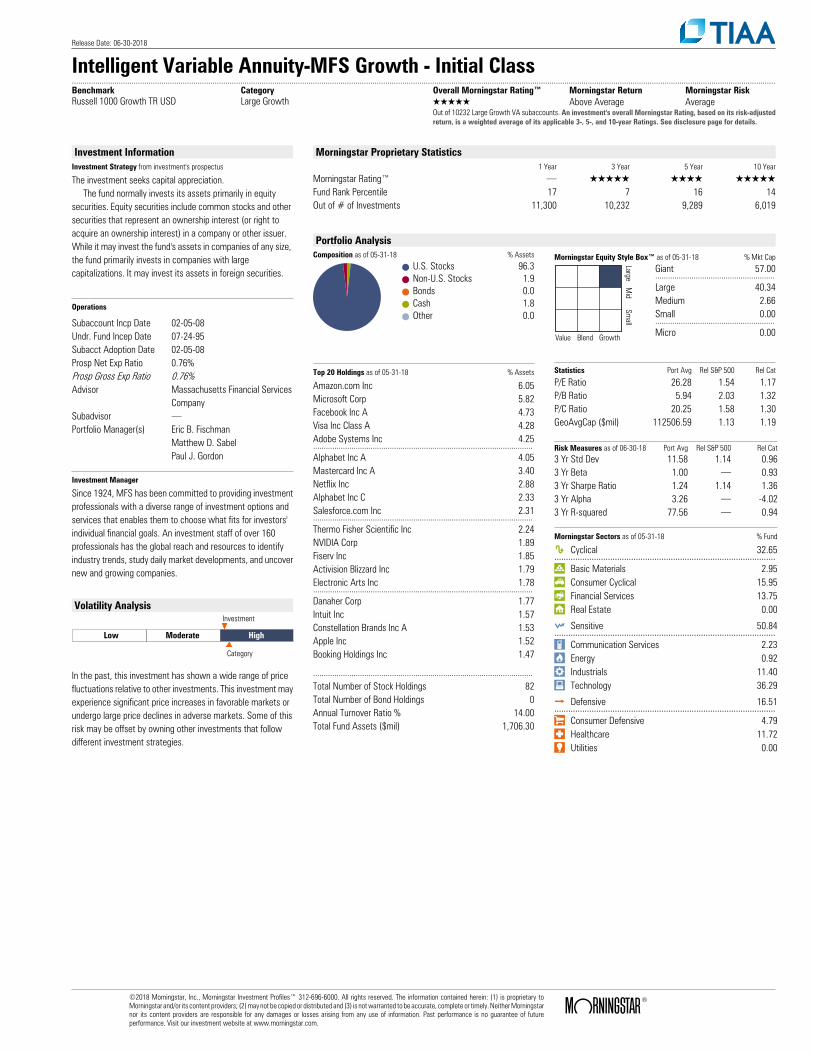
Release Date: 06-30-2018
Intelligent Variable Annuity-MFS Growth - Initial Class..........................................................................................................................................................................................................................................................................................................................................Benchmark Category Overall Morningstar Rating™ Morningstar Return Morningstar RiskRussell 1000 Growth TR USD Large Growth QQQQQ Above Average Average
Out of 10232 Large Growth VA subaccounts. An investment's overall Morningstar Rating, based on its risk-adjustedreturn, is a weighted average of its applicable 3-, 5-, and 10-year Ratings. See disclosure page for details.
Investment InformationInvestment Strategy from investment's prospectus
The investment seeks capital appreciation. The fund normally invests its assets primarily in equity securities. Equity securities include common stocks and other securities that represent an ownership interest (or right to acquire an ownership interest) in a company or other issuer. While it may invest the fund's assets in companies of any size, the fund primarily invests in companies with large capitalizations. It may invest its assets in foreign securities.
Operations
Subaccount Incp Date 02-05-08Undr. Fund Incep Date 07-24-95Subacct Adoption Date 02-05-08Prosp Net Exp Ratio 0.76%Prosp Gross Exp Ratio 0.76%Advisor Massachusetts Financial Services
CompanySubadvisor .Portfolio Manager(s) Eric B. Fischman
Matthew D. SabelPaul J. Gordon
Investment Manager
Since 1924, MFS has been committed to providing investmentprofessionals with a diverse range of investment options andservices that enables them to choose what fits for investors'individual financial goals. An investment staff of over 160professionals has the global reach and resources to identifyindustry trends, study daily market developments, and uncovernew and growing companies.
Volatility Analysis
Low Moderate High
Investment
Category
In the past, this investment has shown a wide range of pricefluctuations relative to other investments. This investment mayexperience significant price increases in favorable markets orundergo large price declines in adverse markets. Some of thisrisk may be offset by owning other investments that followdifferent investment strategies.
Morningstar Proprietary Statistics1 Year 3 Year 5 Year 10 Year
Morningstar Rating™ . QQQQQ QQQQ QQQQQFund Rank Percentile 17 7 16 14Out of # of Investments 11,300 10,232 9,289 6,019
Portfolio AnalysisComposition as of 05-31-18 % Assets
U.S. Stocks 96.3Non-U.S. Stocks 1.9Bonds 0.0Cash 1.8Other 0.0
Morningstar Equity Style Box™ as of 05-31-18 % Mkt Cap
LargeM
idSm
all
Value Blend Growth
Giant 57.00........................................................Large 40.34Medium 2.66Small 0.00........................................................Micro 0.00
Top 20 Holdings as of 05-31-18 % Assets
Amazon.com Inc 6.05Microsoft Corp 5.82Facebook Inc A 4.73Visa Inc Class A 4.28Adobe Systems Inc 4.25.......................................................................................................Alphabet Inc A 4.05Mastercard Inc A 3.40Netflix Inc 2.88Alphabet Inc C 2.33Salesforce.com Inc 2.31.......................................................................................................Thermo Fisher Scientific Inc 2.24NVIDIA Corp 1.89Fiserv Inc 1.85Activision Blizzard Inc 1.79Electronic Arts Inc 1.78.......................................................................................................Danaher Corp 1.77Intuit Inc 1.57Constellation Brands Inc A 1.53Apple Inc 1.52Booking Holdings Inc 1.47
.......................................................................................................Total Number of Stock Holdings 82Total Number of Bond Holdings 0Annual Turnover Ratio % 14.00Total Fund Assets ($mil) 1,706.30
Statistics Port Avg Rel S&P 500 Rel Cat
P/E Ratio 26.28 1.54 1.17P/B Ratio 5.94 2.03 1.32P/C Ratio 20.25 1.58 1.30GeoAvgCap ($mil) 112506.59 1.13 1.19
Risk Measures as of 06-30-18 Port Avg Rel S&P 500 Rel Cat3 Yr Std Dev 11.58 1.14 0.963 Yr Beta 1.00 . 0.933 Yr Sharpe Ratio 1.24 1.14 1.363 Yr Alpha 3.26 . -4.023 Yr R-squared 77.56 . 0.94
Morningstar Sectors as of 05-31-18 % Fund
h Cyclical 32.65...............................................................................................r Basic Materials 2.95t Consumer Cyclical 15.95y Financial Services 13.75u Real Estate 0.00
j Sensitive 50.84...............................................................................................i Communication Services 2.23o Energy 0.92p Industrials 11.40a Technology 36.29
k Defensive 16.51...............................................................................................s Consumer Defensive 4.79d Healthcare 11.72f Utilities 0.00
©2018 Morningstar, Inc., Morningstar Investment Profiles™ 312-696-6000. All rights reserved. The information contained herein: (1) is proprietary toMorningstar and/or its content providers; (2) may not be copied or distributed and (3) is not warranted to be accurate, complete or timely. Neither Morningstarnor its content providers are responsible for any damages or losses arising from any use of information. Past performance is no guarantee of futureperformance. Visit our investment website at www.morningstar.com.
ß®

Release Date: 06-30-2018
Intelligent Variable Annuity-MFS Massachusetts Investors Growth StockPortfolio..........................................................................................................................................................................................................................................................................................................................................Benchmark Category Overall Morningstar Rating™ Morningstar Return Morningstar RiskRussell 1000 Growth TR USD Large Growth QQQQ Above Average Below Average
Out of 10232 Large Growth VA subaccounts. An investment's overall Morningstar Rating, based on its risk-adjustedreturn, is a weighted average of its applicable 3-, 5-, and 10-year Ratings. See disclosure page for details.
Investment InformationInvestment Strategy from investment's prospectus
The investment seeks capital appreciation. The fund normally invests at least 80% of the fund's net assets in stocks. Stocks include common stocks and other securities that represent an ownership interest (or right to acquire an ownership interest) in a company or other issuer. MFS focuses on investing the fund's assets in the stocks of companies the advisor believes to have above average earnings growth potential compared to other companies (growth companies).
Operations
Subaccount Incp Date 03-27-15Undr. Fund Incep Date 05-06-98Subacct Adoption Date 03-27-15Prosp Net Exp Ratio 0.81%Prosp Gross Exp Ratio 0.81%Advisor Massachusetts Financial Services
CompanySubadvisor .Portfolio Manager(s) Jeffrey C. Constantino
Investment Manager
Since 1924, MFS has been committed to providing investmentprofessionals with a diverse range of investment options andservices that enables them to choose what fits for investors'individual financial goals. An investment staff of over 160professionals has the global reach and resources to identifyindustry trends, study daily market developments, and uncovernew and growing companies.
Volatility Analysis
Low Moderate High
Investment
Category
In the past, this investment has shown a relatively moderaterange of price fluctuations relative to other investments. Thisinvestment may experience larger or smaller price declines orprice increases depending on market conditions. Some of thisrisk may be offset by owning other investments with differentportfolio makeups or investment strategies.
Morningstar Proprietary Statistics1 Year 3 Year 5 Year 10 Year
Morningstar Rating™ . QQQ QQQ QQQQFund Rank Percentile 66 56 67 25Out of # of Investments 11,300 10,232 9,289 6,019
Portfolio AnalysisComposition as of 05-31-18 % Assets
U.S. Stocks 89.0Non-U.S. Stocks 9.6Bonds 0.0Cash 1.4Other 0.0
Morningstar Equity Style Box™ as of 05-31-18 % Mkt Cap
LargeM
idSm
all
Value Blend Growth
Giant 47.46........................................................Large 44.60Medium 7.93Small 0.00........................................................Micro 0.00
Top 20 Holdings as of 05-31-18 % Assets
Alphabet Inc A 6.50Microsoft Corp 4.38Accenture PLC A 3.81Visa Inc Class A 3.05Texas Instruments Inc 2.96.......................................................................................................Apple Inc 2.84Nike Inc B 2.80Thermo Fisher Scientific Inc 2.65Starbucks Corp 2.58Verisk Analytics Inc 2.48.......................................................................................................Colgate-Palmolive Co 2.29Mastercard Inc A 2.14Aon PLC 2.13Fidelity National Information Services Inc 2.09Fiserv Inc 2.07.......................................................................................................Comcast Corp Class A 1.99TJX Companies Inc 1.99The Estee Lauder Companies Inc Class A 1.90Abbott Laboratories 1.89Ecolab Inc 1.87
.......................................................................................................Total Number of Stock Holdings 62Total Number of Bond Holdings 0Annual Turnover Ratio % 21.00Total Fund Assets ($mil) 914.27
Statistics Port Avg Rel S&P 500 Rel Cat
P/E Ratio 20.48 1.20 0.92P/B Ratio 4.40 1.50 0.98P/C Ratio 18.46 1.44 1.18GeoAvgCap ($mil) 80413.29 0.81 0.85
Risk Measures as of 06-30-18 Port Avg Rel S&P 500 Rel Cat3 Yr Std Dev 10.73 1.06 0.893 Yr Beta 1.00 . 0.933 Yr Sharpe Ratio 1.02 0.94 1.123 Yr Alpha -0.11 . 0.143 Yr R-squared 89.64 . 1.09
Morningstar Sectors as of 05-31-18 % Fund
h Cyclical 31.95...............................................................................................r Basic Materials 5.31t Consumer Cyclical 14.38y Financial Services 12.26u Real Estate 0.00
j Sensitive 45.66...............................................................................................i Communication Services 1.99o Energy 0.75p Industrials 13.41a Technology 29.51
k Defensive 22.38...............................................................................................s Consumer Defensive 10.32d Healthcare 12.06f Utilities 0.00
©2018 Morningstar, Inc., Morningstar Investment Profiles™ 312-696-6000. All rights reserved. The information contained herein: (1) is proprietary toMorningstar and/or its content providers; (2) may not be copied or distributed and (3) is not warranted to be accurate, complete or timely. Neither Morningstarnor its content providers are responsible for any damages or losses arising from any use of information. Past performance is no guarantee of futureperformance. Visit our investment website at www.morningstar.com.
ß®
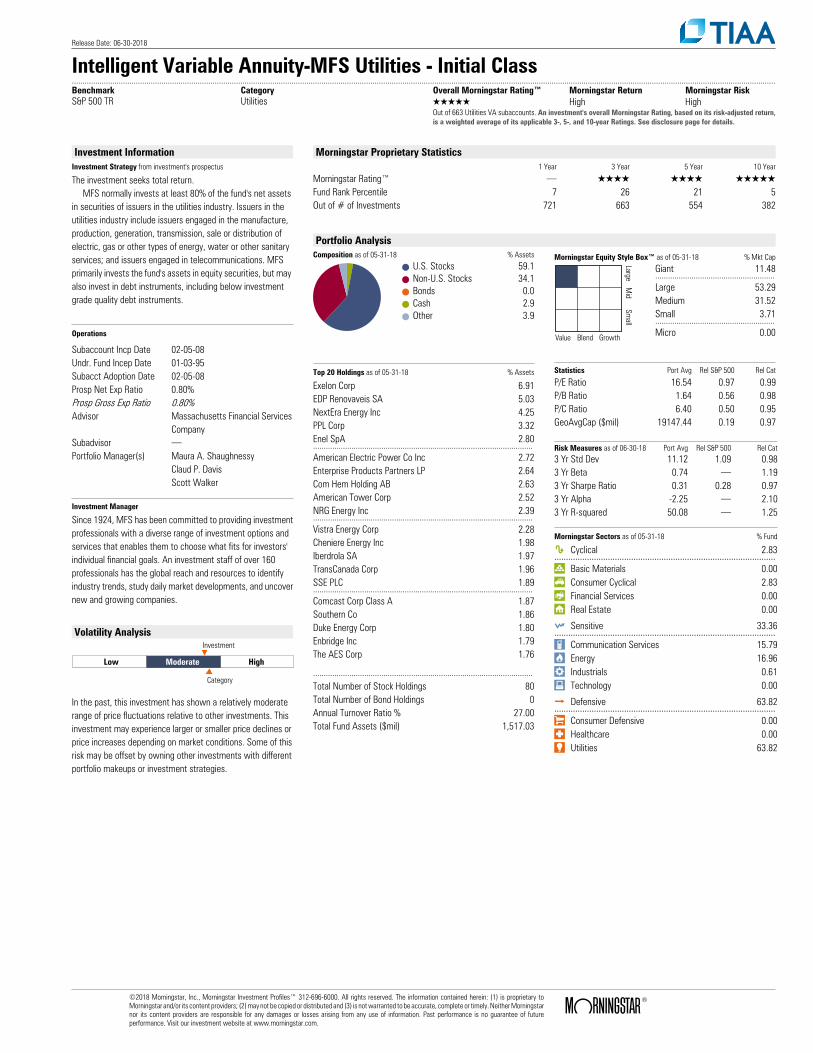
Release Date: 06-30-2018
Intelligent Variable Annuity-MFS Utilities - Initial Class..........................................................................................................................................................................................................................................................................................................................................Benchmark Category Overall Morningstar Rating™ Morningstar Return Morningstar RiskS&P 500 TR Utilities QQQQQ High High
Out of 663 Utilities VA subaccounts. An investment's overall Morningstar Rating, based on its risk-adjusted return,is a weighted average of its applicable 3-, 5-, and 10-year Ratings. See disclosure page for details.
Investment InformationInvestment Strategy from investment's prospectus
The investment seeks total return. MFS normally invests at least 80% of the fund's net assets in securities of issuers in the utilities industry. Issuers in the utilities industry include issuers engaged in the manufacture, production, generation, transmission, sale or distribution of electric, gas or other types of energy, water or other sanitary services; and issuers engaged in telecommunications. MFS primarily invests the fund's assets in equity securities, but may also invest in debt instruments, including below investment grade quality debt instruments.
Operations
Subaccount Incp Date 02-05-08Undr. Fund Incep Date 01-03-95Subacct Adoption Date 02-05-08Prosp Net Exp Ratio 0.80%Prosp Gross Exp Ratio 0.80%Advisor Massachusetts Financial Services
CompanySubadvisor .Portfolio Manager(s) Maura A. Shaughnessy
Claud P. DavisScott Walker
Investment Manager
Since 1924, MFS has been committed to providing investmentprofessionals with a diverse range of investment options andservices that enables them to choose what fits for investors'individual financial goals. An investment staff of over 160professionals has the global reach and resources to identifyindustry trends, study daily market developments, and uncovernew and growing companies.
Volatility Analysis
Low Moderate High
Investment
Category
In the past, this investment has shown a relatively moderaterange of price fluctuations relative to other investments. Thisinvestment may experience larger or smaller price declines orprice increases depending on market conditions. Some of thisrisk may be offset by owning other investments with differentportfolio makeups or investment strategies.
Morningstar Proprietary Statistics1 Year 3 Year 5 Year 10 Year
Morningstar Rating™ . QQQQ QQQQ QQQQQFund Rank Percentile 7 26 21 5Out of # of Investments 721 663 554 382
Portfolio AnalysisComposition as of 05-31-18 % Assets
U.S. Stocks 59.1Non-U.S. Stocks 34.1Bonds 0.0Cash 2.9Other 3.9
Morningstar Equity Style Box™ as of 05-31-18 % Mkt Cap
LargeM
idSm
all
Value Blend Growth
Giant 11.48........................................................Large 53.29Medium 31.52Small 3.71........................................................Micro 0.00
Top 20 Holdings as of 05-31-18 % Assets
Exelon Corp 6.91EDP Renovaveis SA 5.03NextEra Energy Inc 4.25PPL Corp 3.32Enel SpA 2.80.......................................................................................................American Electric Power Co Inc 2.72Enterprise Products Partners LP 2.64Com Hem Holding AB 2.63American Tower Corp 2.52NRG Energy Inc 2.39.......................................................................................................Vistra Energy Corp 2.28Cheniere Energy Inc 1.98Iberdrola SA 1.97TransCanada Corp 1.96SSE PLC 1.89.......................................................................................................Comcast Corp Class A 1.87Southern Co 1.86Duke Energy Corp 1.80Enbridge Inc 1.79The AES Corp 1.76
.......................................................................................................Total Number of Stock Holdings 80Total Number of Bond Holdings 0Annual Turnover Ratio % 27.00Total Fund Assets ($mil) 1,517.03
Statistics Port Avg Rel S&P 500 Rel Cat
P/E Ratio 16.54 0.97 0.99P/B Ratio 1.64 0.56 0.98P/C Ratio 6.40 0.50 0.95GeoAvgCap ($mil) 19147.44 0.19 0.97
Risk Measures as of 06-30-18 Port Avg Rel S&P 500 Rel Cat3 Yr Std Dev 11.12 1.09 0.983 Yr Beta 0.74 . 1.193 Yr Sharpe Ratio 0.31 0.28 0.973 Yr Alpha -2.25 . 2.103 Yr R-squared 50.08 . 1.25
Morningstar Sectors as of 05-31-18 % Fund
h Cyclical 2.83...............................................................................................r Basic Materials 0.00t Consumer Cyclical 2.83y Financial Services 0.00u Real Estate 0.00
j Sensitive 33.36...............................................................................................i Communication Services 15.79o Energy 16.96p Industrials 0.61a Technology 0.00
k Defensive 63.82...............................................................................................s Consumer Defensive 0.00d Healthcare 0.00f Utilities 63.82
©2018 Morningstar, Inc., Morningstar Investment Profiles™ 312-696-6000. All rights reserved. The information contained herein: (1) is proprietary toMorningstar and/or its content providers; (2) may not be copied or distributed and (3) is not warranted to be accurate, complete or timely. Neither Morningstarnor its content providers are responsible for any damages or losses arising from any use of information. Past performance is no guarantee of futureperformance. Visit our investment website at www.morningstar.com.
ß®
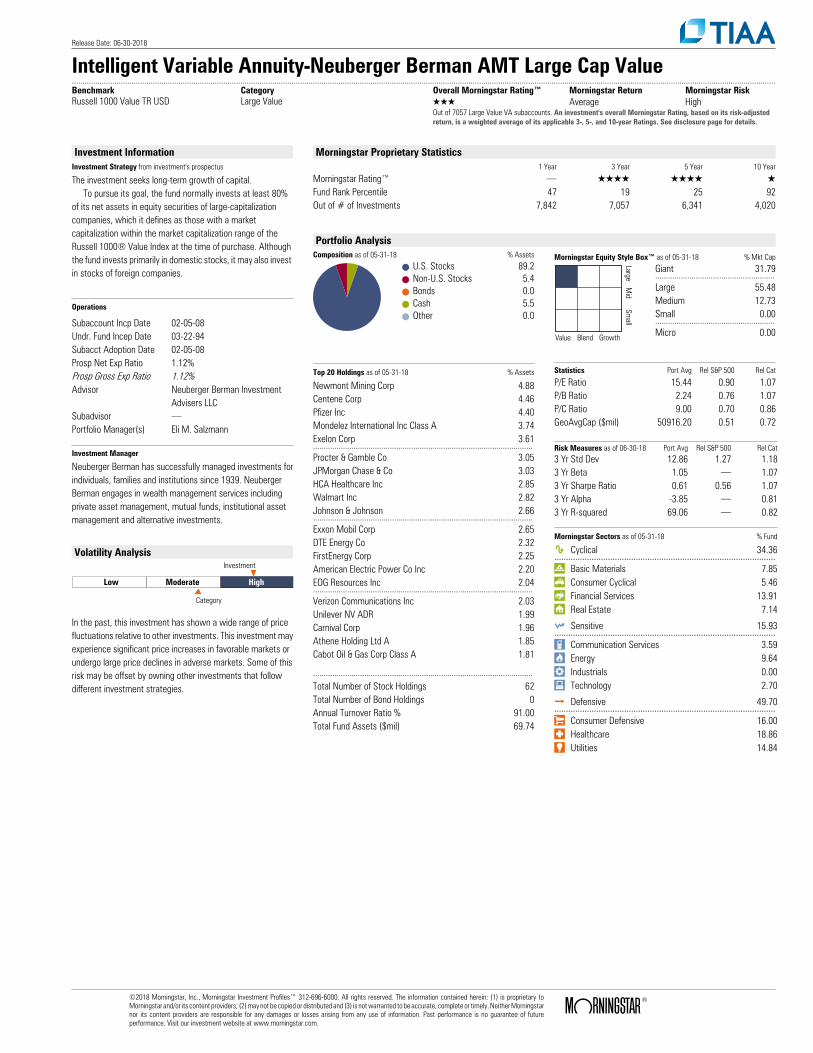
Release Date: 06-30-2018
Intelligent Variable Annuity-Neuberger Berman AMT Large Cap Value..........................................................................................................................................................................................................................................................................................................................................Benchmark Category Overall Morningstar Rating™ Morningstar Return Morningstar RiskRussell 1000 Value TR USD Large Value QQQ Average High
Out of 7057 Large Value VA subaccounts. An investment's overall Morningstar Rating, based on its risk-adjustedreturn, is a weighted average of its applicable 3-, 5-, and 10-year Ratings. See disclosure page for details.
Investment InformationInvestment Strategy from investment's prospectus
The investment seeks long-term growth of capital. To pursue its goal, the fund normally invests at least 80% of its net assets in equity securities of large-capitalization companies, which it defines as those with a market capitalization within the market capitalization range of the Russell 1000® Value Index at the time of purchase. Although the fund invests primarily in domestic stocks, it may also invest in stocks of foreign companies.
Operations
Subaccount Incp Date 02-05-08Undr. Fund Incep Date 03-22-94Subacct Adoption Date 02-05-08Prosp Net Exp Ratio 1.12%Prosp Gross Exp Ratio 1.12%Advisor Neuberger Berman Investment
Advisers LLCSubadvisor .Portfolio Manager(s) Eli M. Salzmann
Investment Manager
Neuberger Berman has successfully managed investments forindividuals, families and institutions since 1939. NeubergerBerman engages in wealth management services includingprivate asset management, mutual funds, institutional assetmanagement and alternative investments.
Volatility Analysis
Low Moderate High
Investment
Category
In the past, this investment has shown a wide range of pricefluctuations relative to other investments. This investment mayexperience significant price increases in favorable markets orundergo large price declines in adverse markets. Some of thisrisk may be offset by owning other investments that followdifferent investment strategies.
Morningstar Proprietary Statistics1 Year 3 Year 5 Year 10 Year
Morningstar Rating™ . QQQQ QQQQ QFund Rank Percentile 47 19 25 92Out of # of Investments 7,842 7,057 6,341 4,020
Portfolio AnalysisComposition as of 05-31-18 % Assets
U.S. Stocks 89.2Non-U.S. Stocks 5.4Bonds 0.0Cash 5.5Other 0.0
Morningstar Equity Style Box™ as of 05-31-18 % Mkt Cap
LargeM
idSm
all
Value Blend Growth
Giant 31.79........................................................Large 55.48Medium 12.73Small 0.00........................................................Micro 0.00
Top 20 Holdings as of 05-31-18 % Assets
Newmont Mining Corp 4.88Centene Corp 4.46Pfizer Inc 4.40Mondelez International Inc Class A 3.74Exelon Corp 3.61.......................................................................................................Procter & Gamble Co 3.05JPMorgan Chase & Co 3.03HCA Healthcare Inc 2.85Walmart Inc 2.82Johnson & Johnson 2.66.......................................................................................................Exxon Mobil Corp 2.65DTE Energy Co 2.32FirstEnergy Corp 2.25American Electric Power Co Inc 2.20EOG Resources Inc 2.04.......................................................................................................Verizon Communications Inc 2.03Unilever NV ADR 1.99Carnival Corp 1.96Athene Holding Ltd A 1.85Cabot Oil & Gas Corp Class A 1.81
.......................................................................................................Total Number of Stock Holdings 62Total Number of Bond Holdings 0Annual Turnover Ratio % 91.00Total Fund Assets ($mil) 69.74
Statistics Port Avg Rel S&P 500 Rel Cat
P/E Ratio 15.44 0.90 1.07P/B Ratio 2.24 0.76 1.07P/C Ratio 9.00 0.70 0.86GeoAvgCap ($mil) 50916.20 0.51 0.72
Risk Measures as of 06-30-18 Port Avg Rel S&P 500 Rel Cat3 Yr Std Dev 12.86 1.27 1.183 Yr Beta 1.05 . 1.073 Yr Sharpe Ratio 0.61 0.56 1.073 Yr Alpha -3.85 . 0.813 Yr R-squared 69.06 . 0.82
Morningstar Sectors as of 05-31-18 % Fund
h Cyclical 34.36...............................................................................................r Basic Materials 7.85t Consumer Cyclical 5.46y Financial Services 13.91u Real Estate 7.14
j Sensitive 15.93...............................................................................................i Communication Services 3.59o Energy 9.64p Industrials 0.00a Technology 2.70
k Defensive 49.70...............................................................................................s Consumer Defensive 16.00d Healthcare 18.86f Utilities 14.84
©2018 Morningstar, Inc., Morningstar Investment Profiles™ 312-696-6000. All rights reserved. The information contained herein: (1) is proprietary toMorningstar and/or its content providers; (2) may not be copied or distributed and (3) is not warranted to be accurate, complete or timely. Neither Morningstarnor its content providers are responsible for any damages or losses arising from any use of information. Past performance is no guarantee of futureperformance. Visit our investment website at www.morningstar.com.
ß®
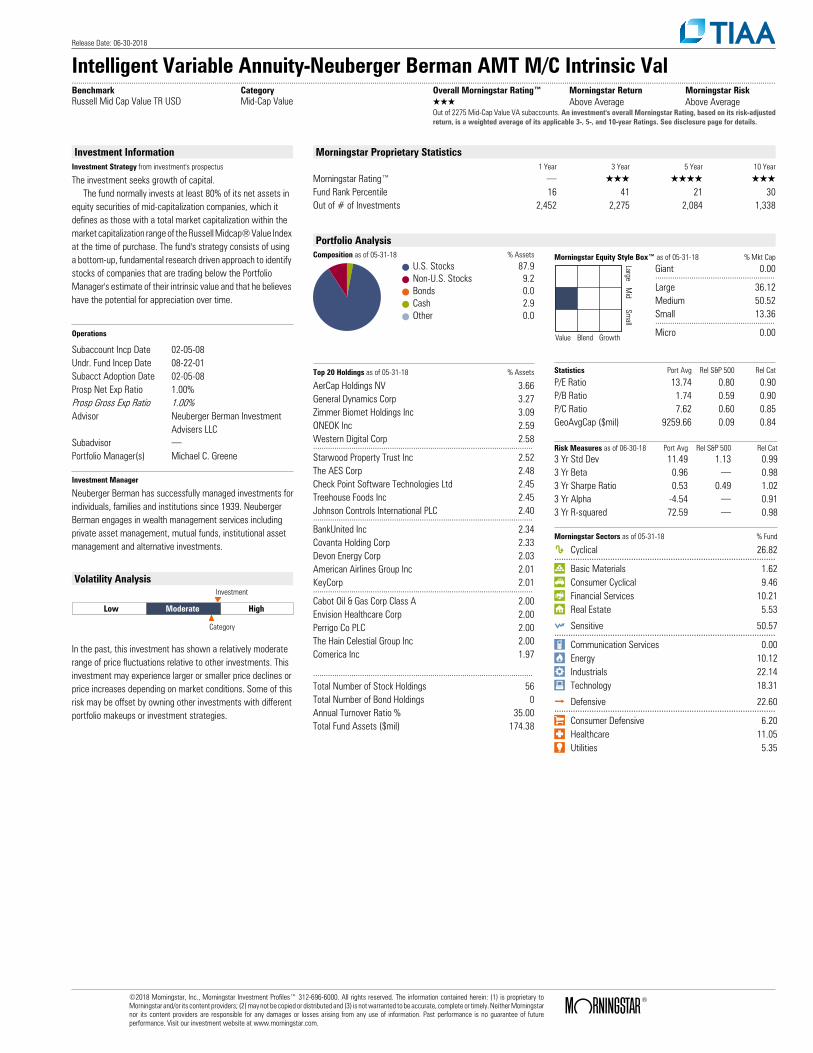
Release Date: 06-30-2018
Intelligent Variable Annuity-Neuberger Berman AMT M/C Intrinsic Val..........................................................................................................................................................................................................................................................................................................................................Benchmark Category Overall Morningstar Rating™ Morningstar Return Morningstar RiskRussell Mid Cap Value TR USD Mid-Cap Value QQQ Above Average Above Average
Out of 2275 Mid-Cap Value VA subaccounts. An investment's overall Morningstar Rating, based on its risk-adjustedreturn, is a weighted average of its applicable 3-, 5-, and 10-year Ratings. See disclosure page for details.
Investment InformationInvestment Strategy from investment's prospectus
The investment seeks growth of capital. The fund normally invests at least 80% of its net assets in equity securities of mid-capitalization companies, which it defines as those with a total market capitalization within the market capitalization range of the Russell Midcap® Value Index at the time of purchase. The fund's strategy consists of using a bottom-up, fundamental research driven approach to identify stocks of companies that are trading below the Portfolio Manager's estimate of their intrinsic value and that he believes have the potential for appreciation over time.
Operations
Subaccount Incp Date 02-05-08Undr. Fund Incep Date 08-22-01Subacct Adoption Date 02-05-08Prosp Net Exp Ratio 1.00%Prosp Gross Exp Ratio 1.00%Advisor Neuberger Berman Investment
Advisers LLCSubadvisor .Portfolio Manager(s) Michael C. Greene
Investment Manager
Neuberger Berman has successfully managed investments forindividuals, families and institutions since 1939. NeubergerBerman engages in wealth management services includingprivate asset management, mutual funds, institutional assetmanagement and alternative investments.
Volatility Analysis
Low Moderate High
Investment
Category
In the past, this investment has shown a relatively moderaterange of price fluctuations relative to other investments. Thisinvestment may experience larger or smaller price declines orprice increases depending on market conditions. Some of thisrisk may be offset by owning other investments with differentportfolio makeups or investment strategies.
Morningstar Proprietary Statistics1 Year 3 Year 5 Year 10 Year
Morningstar Rating™ . QQQ QQQQ QQQFund Rank Percentile 16 41 21 30Out of # of Investments 2,452 2,275 2,084 1,338
Portfolio AnalysisComposition as of 05-31-18 % Assets
U.S. Stocks 87.9Non-U.S. Stocks 9.2Bonds 0.0Cash 2.9Other 0.0
Morningstar Equity Style Box™ as of 05-31-18 % Mkt Cap
LargeM
idSm
all
Value Blend Growth
Giant 0.00........................................................Large 36.12Medium 50.52Small 13.36........................................................Micro 0.00
Top 20 Holdings as of 05-31-18 % Assets
AerCap Holdings NV 3.66General Dynamics Corp 3.27Zimmer Biomet Holdings Inc 3.09ONEOK Inc 2.59Western Digital Corp 2.58.......................................................................................................Starwood Property Trust Inc 2.52The AES Corp 2.48Check Point Software Technologies Ltd 2.45Treehouse Foods Inc 2.45Johnson Controls International PLC 2.40.......................................................................................................BankUnited Inc 2.34Covanta Holding Corp 2.33Devon Energy Corp 2.03American Airlines Group Inc 2.01KeyCorp 2.01.......................................................................................................Cabot Oil & Gas Corp Class A 2.00Envision Healthcare Corp 2.00Perrigo Co PLC 2.00The Hain Celestial Group Inc 2.00Comerica Inc 1.97
.......................................................................................................Total Number of Stock Holdings 56Total Number of Bond Holdings 0Annual Turnover Ratio % 35.00Total Fund Assets ($mil) 174.38
Statistics Port Avg Rel S&P 500 Rel Cat
P/E Ratio 13.74 0.80 0.90P/B Ratio 1.74 0.59 0.90P/C Ratio 7.62 0.60 0.85GeoAvgCap ($mil) 9259.66 0.09 0.84
Risk Measures as of 06-30-18 Port Avg Rel S&P 500 Rel Cat3 Yr Std Dev 11.49 1.13 0.993 Yr Beta 0.96 . 0.983 Yr Sharpe Ratio 0.53 0.49 1.023 Yr Alpha -4.54 . 0.913 Yr R-squared 72.59 . 0.98
Morningstar Sectors as of 05-31-18 % Fund
h Cyclical 26.82...............................................................................................r Basic Materials 1.62t Consumer Cyclical 9.46y Financial Services 10.21u Real Estate 5.53
j Sensitive 50.57...............................................................................................i Communication Services 0.00o Energy 10.12p Industrials 22.14a Technology 18.31
k Defensive 22.60...............................................................................................s Consumer Defensive 6.20d Healthcare 11.05f Utilities 5.35
©2018 Morningstar, Inc., Morningstar Investment Profiles™ 312-696-6000. All rights reserved. The information contained herein: (1) is proprietary toMorningstar and/or its content providers; (2) may not be copied or distributed and (3) is not warranted to be accurate, complete or timely. Neither Morningstarnor its content providers are responsible for any damages or losses arising from any use of information. Past performance is no guarantee of futureperformance. Visit our investment website at www.morningstar.com.
ß®
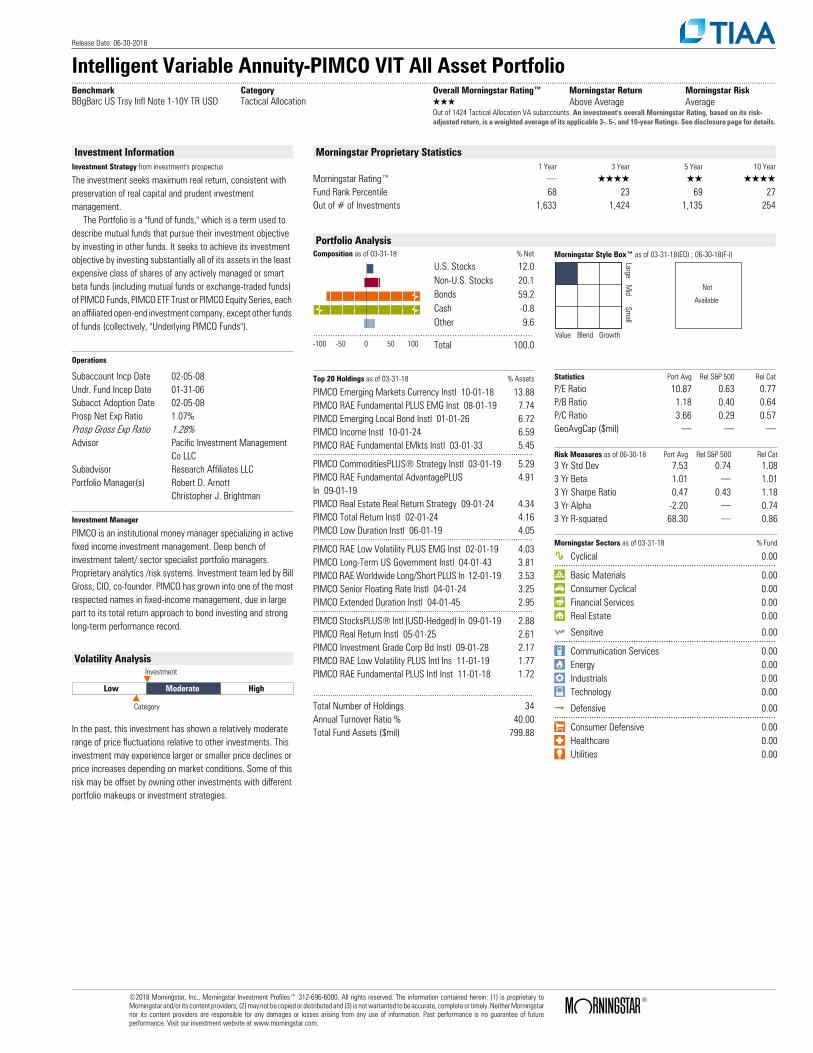
Release Date: 06-30-2018
Intelligent Variable Annuity-PIMCO VIT All Asset Portfolio..........................................................................................................................................................................................................................................................................................................................................Benchmark Category Overall Morningstar Rating™ Morningstar Return Morningstar RiskBBgBarc US Trsy Infl Note 1-10Y TR USD Tactical Allocation QQQ Above Average Average
Out of 1424 Tactical Allocation VA subaccounts. An investment's overall Morningstar Rating, based on its risk-adjusted return, is a weighted average of its applicable 3-, 5-, and 10-year Ratings. See disclosure page for details.
Investment InformationInvestment Strategy from investment's prospectus
The investment seeks maximum real return, consistent with preservation of real capital and prudent investment management. The Portfolio is a "fund of funds," which is a term used to describe mutual funds that pursue their investment objective by investing in other funds. It seeks to achieve its investment objective by investing substantially all of its assets in the least expensive class of shares of any actively managed or smart beta funds (including mutual funds or exchange-traded funds) of PIMCO Funds, PIMCO ETF Trust or PIMCO Equity Series, each an affiliated open-end investment company, except other funds of funds (collectively, "Underlying PIMCO Funds").
Operations
Subaccount Incp Date 02-05-08Undr. Fund Incep Date 01-31-06Subacct Adoption Date 02-05-08Prosp Net Exp Ratio 1.07%Prosp Gross Exp Ratio 1.28%Advisor Pacific Investment Management
Co LLCSubadvisor Research Affiliates LLCPortfolio Manager(s) Robert D. Arnott
Christopher J. Brightman
Investment Manager
PIMCO is an institutional money manager specializing in activefixed income investment management. Deep bench ofinvestment talent/ sector specialist portfolio managers.Proprietary analytics /risk systems. Investment team led by BillGross, CIO, co-founder. PIMCO has grown into one of the mostrespected names in fixed-income management, due in largepart to its total return approach to bond investing and stronglong-term performance record.
Volatility Analysis
Low Moderate High
Investment
Category
In the past, this investment has shown a relatively moderaterange of price fluctuations relative to other investments. Thisinvestment may experience larger or smaller price declines orprice increases depending on market conditions. Some of thisrisk may be offset by owning other investments with differentportfolio makeups or investment strategies.
Morningstar Proprietary Statistics1 Year 3 Year 5 Year 10 Year
Morningstar Rating™ . QQQQ QQ QQQQFund Rank Percentile 68 23 69 27Out of # of Investments 1,633 1,424 1,135 254
Portfolio AnalysisComposition as of 03-31-18 % Net
U.S. Stocks 12.0Non-U.S. Stocks 20.1Bonds 59.2Cash -0.8Other 9.6
..........................................................................................-100 -50 0 50 100 Total 100.0
Morningstar Style Box™ as of 03-31-18(EQ) ; 06-30-18(F-I)
LargeM
idSm
all
Value Blend Growth
Not
Available
Top 20 Holdings as of 03-31-18 % Assets
PIMCO Emerging Markets Currency Instl 10-01-18 13.88PIMCO RAE Fundamental PLUS EMG Inst 08-01-19 7.74PIMCO Emerging Local Bond Instl 01-01-26 6.72PIMCO Income Instl 10-01-24 6.59PIMCO RAE Fundamental EMkts Instl 03-01-33 5.45.......................................................................................................PIMCO CommoditiesPLUS® Strategy Instl 03-01-19 5.29PIMCO RAE Fundamental AdvantagePLUS In 09-01-19
4.91
PIMCO Real Estate Real Return Strategy 09-01-24 4.34PIMCO Total Return Instl 02-01-24 4.16PIMCO Low Duration Instl 06-01-19 4.05.......................................................................................................PIMCO RAE Low Volatility PLUS EMG Inst 02-01-19 4.03PIMCO Long-Term US Government Instl 04-01-43 3.81PIMCO RAE Worldwide Long/Short PLUS In 12-01-19 3.53PIMCO Senior Floating Rate Instl 04-01-24 3.25PIMCO Extended Duration Instl 04-01-45 2.95.......................................................................................................PIMCO StocksPLUS® Intl (USD-Hedged) In 09-01-19 2.88PIMCO Real Return Instl 05-01-25 2.61PIMCO Investment Grade Corp Bd Instl 09-01-28 2.17PIMCO RAE Low Volatility PLUS Intl Ins 11-01-19 1.77PIMCO RAE Fundamental PLUS Intl Inst 11-01-18 1.72
.......................................................................................................Total Number of Holdings 34Annual Turnover Ratio % 40.00Total Fund Assets ($mil) 799.88
Statistics Port Avg Rel S&P 500 Rel Cat
P/E Ratio 10.87 0.63 0.77P/B Ratio 1.18 0.40 0.64P/C Ratio 3.66 0.29 0.57GeoAvgCap ($mil) . . .
Risk Measures as of 06-30-18 Port Avg Rel S&P 500 Rel Cat3 Yr Std Dev 7.53 0.74 1.083 Yr Beta 1.01 . 1.013 Yr Sharpe Ratio 0.47 0.43 1.183 Yr Alpha -2.20 . 0.743 Yr R-squared 68.30 . 0.86
Morningstar Sectors as of 03-31-18 % Fund
h Cyclical 0.00...............................................................................................r Basic Materials 0.00t Consumer Cyclical 0.00y Financial Services 0.00u Real Estate 0.00
j Sensitive 0.00...............................................................................................i Communication Services 0.00o Energy 0.00p Industrials 0.00a Technology 0.00
k Defensive 0.00...............................................................................................s Consumer Defensive 0.00d Healthcare 0.00f Utilities 0.00
©2018 Morningstar, Inc., Morningstar Investment Profiles™ 312-696-6000. All rights reserved. The information contained herein: (1) is proprietary toMorningstar and/or its content providers; (2) may not be copied or distributed and (3) is not warranted to be accurate, complete or timely. Neither Morningstarnor its content providers are responsible for any damages or losses arising from any use of information. Past performance is no guarantee of futureperformance. Visit our investment website at www.morningstar.com.
ß®
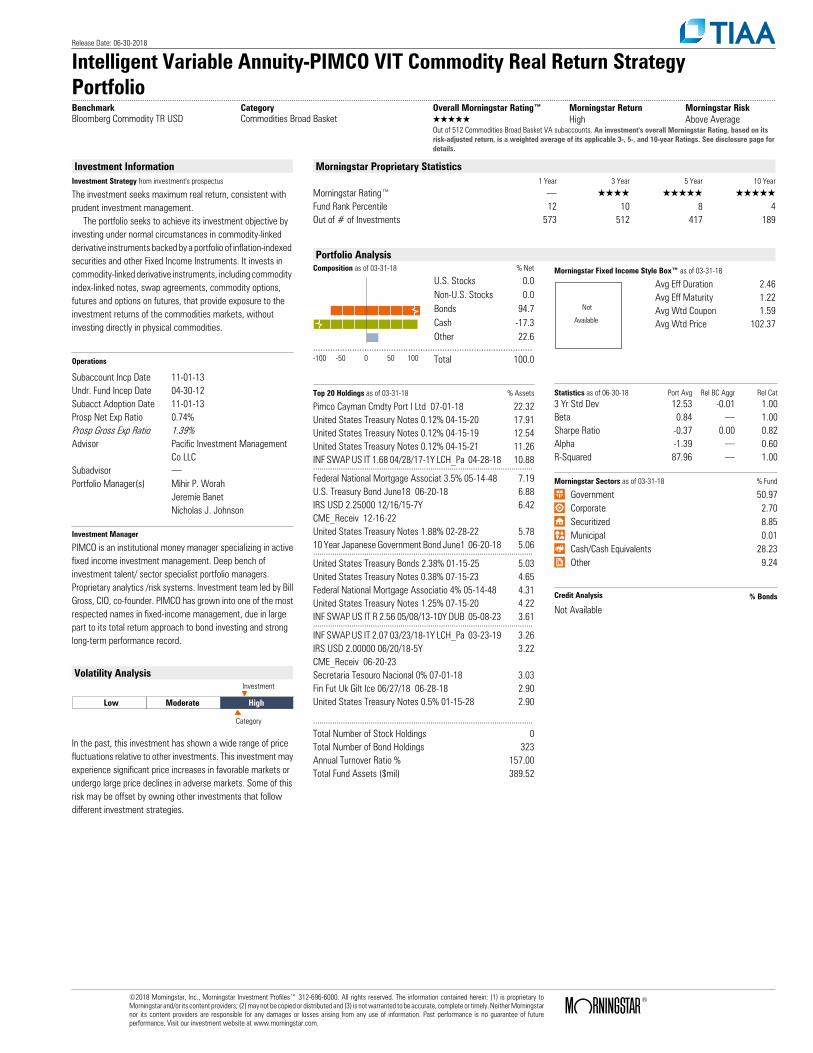
Release Date: 06-30-2018
Intelligent Variable Annuity-PIMCO VIT Commodity Real Return StrategyPortfolio..........................................................................................................................................................................................................................................................................................................................................Benchmark Category Overall Morningstar Rating™ Morningstar Return Morningstar RiskBloomberg Commodity TR USD Commodities Broad Basket QQQQQ High Above Average
Out of 512 Commodities Broad Basket VA subaccounts. An investment's overall Morningstar Rating, based on itsrisk-adjusted return, is a weighted average of its applicable 3-, 5-, and 10-year Ratings. See disclosure page fordetails.
Investment InformationInvestment Strategy from investment's prospectus
The investment seeks maximum real return, consistent with prudent investment management. The portfolio seeks to achieve its investment objective by investing under normal circumstances in commodity-linked derivative instruments backed by a portfolio of inflation-indexed securities and other Fixed Income Instruments. It invests in commodity-linked derivative instruments, including commodity index-linked notes, swap agreements, commodity options, futures and options on futures, that provide exposure to the investment returns of the commodities markets, without investing directly in physical commodities.
Operations
Subaccount Incp Date 11-01-13Undr. Fund Incep Date 04-30-12Subacct Adoption Date 11-01-13Prosp Net Exp Ratio 0.74%Prosp Gross Exp Ratio 1.39%Advisor Pacific Investment Management
Co LLCSubadvisor .Portfolio Manager(s) Mihir P. Worah
Jeremie BanetNicholas J. Johnson
Investment Manager
PIMCO is an institutional money manager specializing in activefixed income investment management. Deep bench ofinvestment talent/ sector specialist portfolio managers.Proprietary analytics /risk systems. Investment team led by BillGross, CIO, co-founder. PIMCO has grown into one of the mostrespected names in fixed-income management, due in largepart to its total return approach to bond investing and stronglong-term performance record.
Volatility Analysis
Low Moderate High
Investment
Category
In the past, this investment has shown a wide range of pricefluctuations relative to other investments. This investment mayexperience significant price increases in favorable markets orundergo large price declines in adverse markets. Some of thisrisk may be offset by owning other investments that followdifferent investment strategies.
Morningstar Proprietary Statistics1 Year 3 Year 5 Year 10 Year
Morningstar Rating™ . QQQQ QQQQQ QQQQQFund Rank Percentile 12 10 8 4Out of # of Investments 573 512 417 189
Portfolio AnalysisComposition as of 03-31-18 % Net
U.S. Stocks 0.0Non-U.S. Stocks 0.0Bonds 94.7Cash -17.3Other 22.6
..........................................................................................-100 -50 0 50 100 Total 100.0
Morningstar Fixed Income Style Box™ as of 03-31-18
Not
Available
Avg Eff Duration 2.46Avg Eff Maturity 1.22Avg Wtd Coupon 1.59Avg Wtd Price 102.37
Top 20 Holdings as of 03-31-18 % Assets
Pimco Cayman Cmdty Port I Ltd 07-01-18 22.32United States Treasury Notes 0.12% 04-15-20 17.91United States Treasury Notes 0.12% 04-15-19 12.54United States Treasury Notes 0.12% 04-15-21 11.26INF SWAP US IT 1.68 04/28/17-1Y LCH_Pa 04-28-18 10.88.......................................................................................................Federal National Mortgage Associat 3.5% 05-14-48 7.19U.S. Treasury Bond June18 06-20-18 6.88IRS USD 2.25000 12/16/15-7Y CME_Receiv 12-16-22
6.42
United States Treasury Notes 1.88% 02-28-22 5.7810 Year Japanese Government Bond June1 06-20-18 5.06.......................................................................................................United States Treasury Bonds 2.38% 01-15-25 5.03United States Treasury Notes 0.38% 07-15-23 4.65Federal National Mortgage Associatio 4% 05-14-48 4.31United States Treasury Notes 1.25% 07-15-20 4.22INF SWAP US IT R 2.56 05/08/13-10Y DUB 05-08-23 3.61.......................................................................................................INF SWAP US IT 2.07 03/23/18-1Y LCH_Pa 03-23-19 3.26IRS USD 2.00000 06/20/18-5Y CME_Receiv 06-20-23
3.22
Secretaria Tesouro Nacional 0% 07-01-18 3.03Fin Fut Uk Gilt Ice 06/27/18 06-28-18 2.90United States Treasury Notes 0.5% 01-15-28 2.90
.......................................................................................................Total Number of Stock Holdings 0Total Number of Bond Holdings 323Annual Turnover Ratio % 157.00Total Fund Assets ($mil) 389.52
Statistics as of 06-30-18 Port Avg Rel BC Aggr Rel Cat3 Yr Std Dev 12.53 -0.01 1.00Beta 0.84 . 1.00Sharpe Ratio -0.37 0.00 0.82Alpha -1.39 . 0.60R-Squared 87.96 . 1.00
Morningstar Sectors as of 03-31-18 % Fund
⁄ Government 50.97› Corporate 2.70€ Securitized 8.85‹ Municipal 0.01fi Cash/Cash Equivalents 28.23± Other 9.24
Credit Analysis % Bonds
Not Available
©2018 Morningstar, Inc., Morningstar Investment Profiles™ 312-696-6000. All rights reserved. The information contained herein: (1) is proprietary toMorningstar and/or its content providers; (2) may not be copied or distributed and (3) is not warranted to be accurate, complete or timely. Neither Morningstarnor its content providers are responsible for any damages or losses arising from any use of information. Past performance is no guarantee of futureperformance. Visit our investment website at www.morningstar.com.
ß®
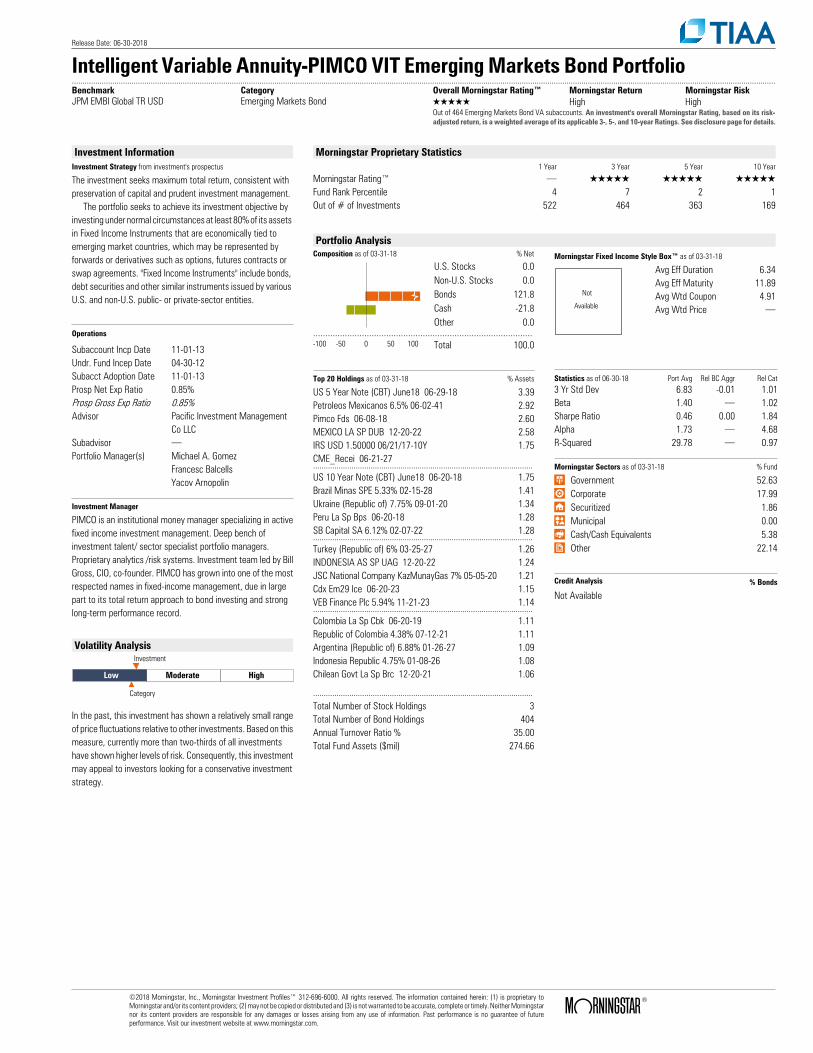
Release Date: 06-30-2018
Intelligent Variable Annuity-PIMCO VIT Emerging Markets Bond Portfolio..........................................................................................................................................................................................................................................................................................................................................Benchmark Category Overall Morningstar Rating™ Morningstar Return Morningstar RiskJPM EMBI Global TR USD Emerging Markets Bond QQQQQ High High
Out of 464 Emerging Markets Bond VA subaccounts. An investment's overall Morningstar Rating, based on its risk-adjusted return, is a weighted average of its applicable 3-, 5-, and 10-year Ratings. See disclosure page for details.
Investment InformationInvestment Strategy from investment's prospectus
The investment seeks maximum total return, consistent with preservation of capital and prudent investment management. The portfolio seeks to achieve its investment objective by investing under normal circumstances at least 80% of its assets in Fixed Income Instruments that are economically tied to emerging market countries, which may be represented by forwards or derivatives such as options, futures contracts or swap agreements. "Fixed Income Instruments" include bonds, debt securities and other similar instruments issued by various U.S. and non-U.S. public- or private-sector entities.
Operations
Subaccount Incp Date 11-01-13Undr. Fund Incep Date 04-30-12Subacct Adoption Date 11-01-13Prosp Net Exp Ratio 0.85%Prosp Gross Exp Ratio 0.85%Advisor Pacific Investment Management
Co LLCSubadvisor .Portfolio Manager(s) Michael A. Gomez
Francesc BalcellsYacov Arnopolin
Investment Manager
PIMCO is an institutional money manager specializing in activefixed income investment management. Deep bench ofinvestment talent/ sector specialist portfolio managers.Proprietary analytics /risk systems. Investment team led by BillGross, CIO, co-founder. PIMCO has grown into one of the mostrespected names in fixed-income management, due in largepart to its total return approach to bond investing and stronglong-term performance record.
Volatility Analysis
Low Moderate High
Investment
Category
In the past, this investment has shown a relatively small rangeof price fluctuations relative to other investments. Based on thismeasure, currently more than two-thirds of all investmentshave shown higher levels of risk. Consequently, this investmentmay appeal to investors looking for a conservative investmentstrategy.
Morningstar Proprietary Statistics1 Year 3 Year 5 Year 10 Year
Morningstar Rating™ . QQQQQ QQQQQ QQQQQFund Rank Percentile 4 7 2 1Out of # of Investments 522 464 363 169
Portfolio AnalysisComposition as of 03-31-18 % Net
U.S. Stocks 0.0Non-U.S. Stocks 0.0Bonds 121.8Cash -21.8Other 0.0
..........................................................................................-100 -50 0 50 100 Total 100.0
Morningstar Fixed Income Style Box™ as of 03-31-18
Not
Available
Avg Eff Duration 6.34Avg Eff Maturity 11.89Avg Wtd Coupon 4.91Avg Wtd Price .
Top 20 Holdings as of 03-31-18 % Assets
US 5 Year Note (CBT) June18 06-29-18 3.39Petroleos Mexicanos 6.5% 06-02-41 2.92Pimco Fds 06-08-18 2.60MEXICO LA SP DUB 12-20-22 2.58IRS USD 1.50000 06/21/17-10Y CME_Recei 06-21-27
1.75
.......................................................................................................US 10 Year Note (CBT) June18 06-20-18 1.75Brazil Minas SPE 5.33% 02-15-28 1.41Ukraine (Republic of) 7.75% 09-01-20 1.34Peru La Sp Bps 06-20-18 1.28SB Capital SA 6.12% 02-07-22 1.28.......................................................................................................Turkey (Republic of) 6% 03-25-27 1.26INDONESIA AS SP UAG 12-20-22 1.24JSC National Company KazMunayGas 7% 05-05-20 1.21Cdx Em29 Ice 06-20-23 1.15VEB Finance Plc 5.94% 11-21-23 1.14.......................................................................................................Colombia La Sp Cbk 06-20-19 1.11Republic of Colombia 4.38% 07-12-21 1.11Argentina (Republic of) 6.88% 01-26-27 1.09Indonesia Republic 4.75% 01-08-26 1.08Chilean Govt La Sp Brc 12-20-21 1.06
.......................................................................................................Total Number of Stock Holdings 3Total Number of Bond Holdings 404Annual Turnover Ratio % 35.00Total Fund Assets ($mil) 274.66
Statistics as of 06-30-18 Port Avg Rel BC Aggr Rel Cat3 Yr Std Dev 6.83 -0.01 1.01Beta 1.40 . 1.02Sharpe Ratio 0.46 0.00 1.84Alpha 1.73 . 4.68R-Squared 29.78 . 0.97
Morningstar Sectors as of 03-31-18 % Fund
⁄ Government 52.63› Corporate 17.99€ Securitized 1.86‹ Municipal 0.00fi Cash/Cash Equivalents 5.38± Other 22.14
Credit Analysis % Bonds
Not Available
©2018 Morningstar, Inc., Morningstar Investment Profiles™ 312-696-6000. All rights reserved. The information contained herein: (1) is proprietary toMorningstar and/or its content providers; (2) may not be copied or distributed and (3) is not warranted to be accurate, complete or timely. Neither Morningstarnor its content providers are responsible for any damages or losses arising from any use of information. Past performance is no guarantee of futureperformance. Visit our investment website at www.morningstar.com.
ß®
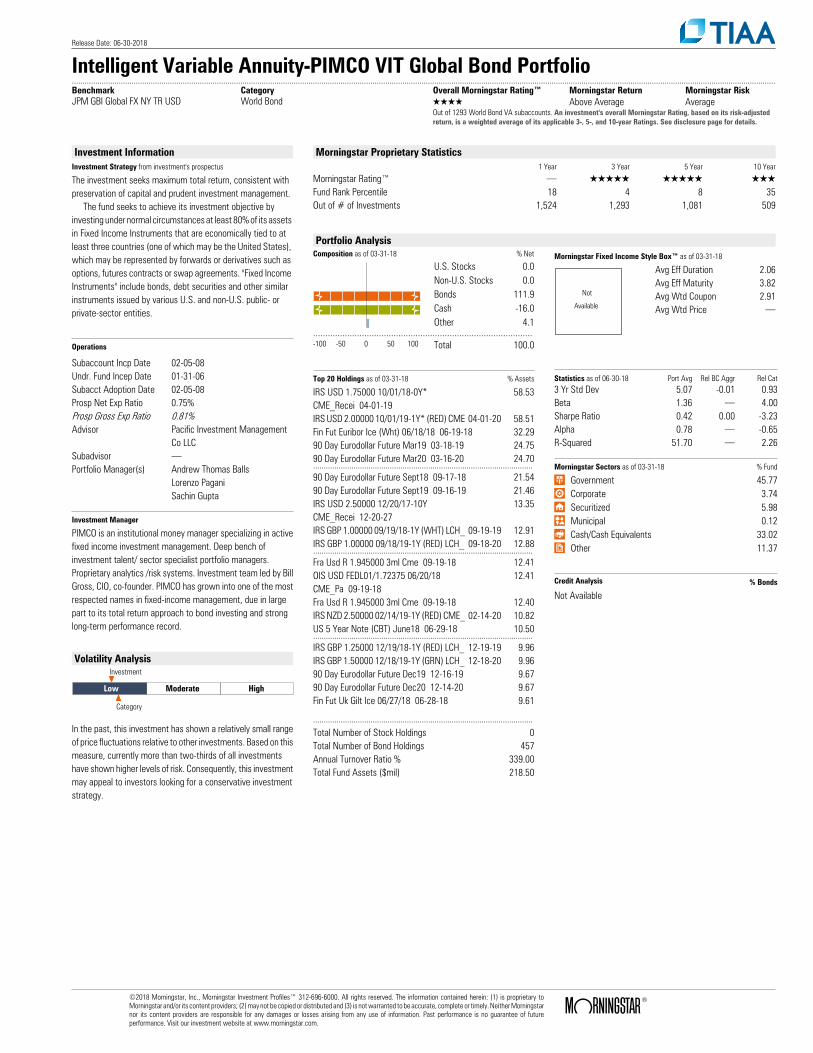
Release Date: 06-30-2018
Intelligent Variable Annuity-PIMCO VIT Global Bond Portfolio..........................................................................................................................................................................................................................................................................................................................................Benchmark Category Overall Morningstar Rating™ Morningstar Return Morningstar RiskJPM GBI Global FX NY TR USD World Bond QQQQ Above Average Average
Out of 1293 World Bond VA subaccounts. An investment's overall Morningstar Rating, based on its risk-adjustedreturn, is a weighted average of its applicable 3-, 5-, and 10-year Ratings. See disclosure page for details.
Investment InformationInvestment Strategy from investment's prospectus
The investment seeks maximum total return, consistent with preservation of capital and prudent investment management. The fund seeks to achieve its investment objective by investing under normal circumstances at least 80% of its assets in Fixed Income Instruments that are economically tied to at least three countries (one of which may be the United States), which may be represented by forwards or derivatives such as options, futures contracts or swap agreements. "Fixed Income Instruments" include bonds, debt securities and other similar instruments issued by various U.S. and non-U.S. public- or private-sector entities.
Operations
Subaccount Incp Date 02-05-08Undr. Fund Incep Date 01-31-06Subacct Adoption Date 02-05-08Prosp Net Exp Ratio 0.75%Prosp Gross Exp Ratio 0.81%Advisor Pacific Investment Management
Co LLCSubadvisor .Portfolio Manager(s) Andrew Thomas Balls
Lorenzo PaganiSachin Gupta
Investment Manager
PIMCO is an institutional money manager specializing in activefixed income investment management. Deep bench ofinvestment talent/ sector specialist portfolio managers.Proprietary analytics /risk systems. Investment team led by BillGross, CIO, co-founder. PIMCO has grown into one of the mostrespected names in fixed-income management, due in largepart to its total return approach to bond investing and stronglong-term performance record.
Volatility Analysis
Low Moderate High
Investment
Category
In the past, this investment has shown a relatively small rangeof price fluctuations relative to other investments. Based on thismeasure, currently more than two-thirds of all investmentshave shown higher levels of risk. Consequently, this investmentmay appeal to investors looking for a conservative investmentstrategy.
Morningstar Proprietary Statistics1 Year 3 Year 5 Year 10 Year
Morningstar Rating™ . QQQQQ QQQQQ QQQFund Rank Percentile 18 4 8 35Out of # of Investments 1,524 1,293 1,081 509
Portfolio AnalysisComposition as of 03-31-18 % Net
U.S. Stocks 0.0Non-U.S. Stocks 0.0Bonds 111.9Cash -16.0Other 4.1
..........................................................................................-100 -50 0 50 100 Total 100.0
Morningstar Fixed Income Style Box™ as of 03-31-18
Not
Available
Avg Eff Duration 2.06Avg Eff Maturity 3.82Avg Wtd Coupon 2.91Avg Wtd Price .
Top 20 Holdings as of 03-31-18 % Assets
IRS USD 1.75000 10/01/18-0Y* CME_Recei 04-01-19
58.53
IRS USD 2.00000 10/01/19-1Y* (RED) CME 04-01-20 58.51Fin Fut Euribor Ice (Wht) 06/18/18 06-19-18 32.2990 Day Eurodollar Future Mar19 03-18-19 24.7590 Day Eurodollar Future Mar20 03-16-20 24.70.......................................................................................................90 Day Eurodollar Future Sept18 09-17-18 21.5490 Day Eurodollar Future Sept19 09-16-19 21.46IRS USD 2.50000 12/20/17-10Y CME_Recei 12-20-27
13.35
IRS GBP 1.00000 09/19/18-1Y (WHT) LCH_ 09-19-19 12.91IRS GBP 1.00000 09/18/19-1Y (RED) LCH_ 09-18-20 12.88.......................................................................................................Fra Usd R 1.945000 3ml Cme 09-19-18 12.41OIS USD FEDL01/1.72375 06/20/18 CME_Pa 09-19-18
12.41
Fra Usd R 1.945000 3ml Cme 09-19-18 12.40IRS NZD 2.50000 02/14/19-1Y (RED) CME_ 02-14-20 10.82US 5 Year Note (CBT) June18 06-29-18 10.50.......................................................................................................IRS GBP 1.25000 12/19/18-1Y (RED) LCH_ 12-19-19 9.96IRS GBP 1.50000 12/18/19-1Y (GRN) LCH_ 12-18-20 9.9690 Day Eurodollar Future Dec19 12-16-19 9.6790 Day Eurodollar Future Dec20 12-14-20 9.67Fin Fut Uk Gilt Ice 06/27/18 06-28-18 9.61
.......................................................................................................Total Number of Stock Holdings 0Total Number of Bond Holdings 457Annual Turnover Ratio % 339.00Total Fund Assets ($mil) 218.50
Statistics as of 06-30-18 Port Avg Rel BC Aggr Rel Cat3 Yr Std Dev 5.07 -0.01 0.93Beta 1.36 . 4.00Sharpe Ratio 0.42 0.00 -3.23Alpha 0.78 . -0.65R-Squared 51.70 . 2.26
Morningstar Sectors as of 03-31-18 % Fund
⁄ Government 45.77› Corporate 3.74€ Securitized 5.98‹ Municipal 0.12fi Cash/Cash Equivalents 33.02± Other 11.37
Credit Analysis % Bonds
Not Available
©2018 Morningstar, Inc., Morningstar Investment Profiles™ 312-696-6000. All rights reserved. The information contained herein: (1) is proprietary toMorningstar and/or its content providers; (2) may not be copied or distributed and (3) is not warranted to be accurate, complete or timely. Neither Morningstarnor its content providers are responsible for any damages or losses arising from any use of information. Past performance is no guarantee of futureperformance. Visit our investment website at www.morningstar.com.
ß®
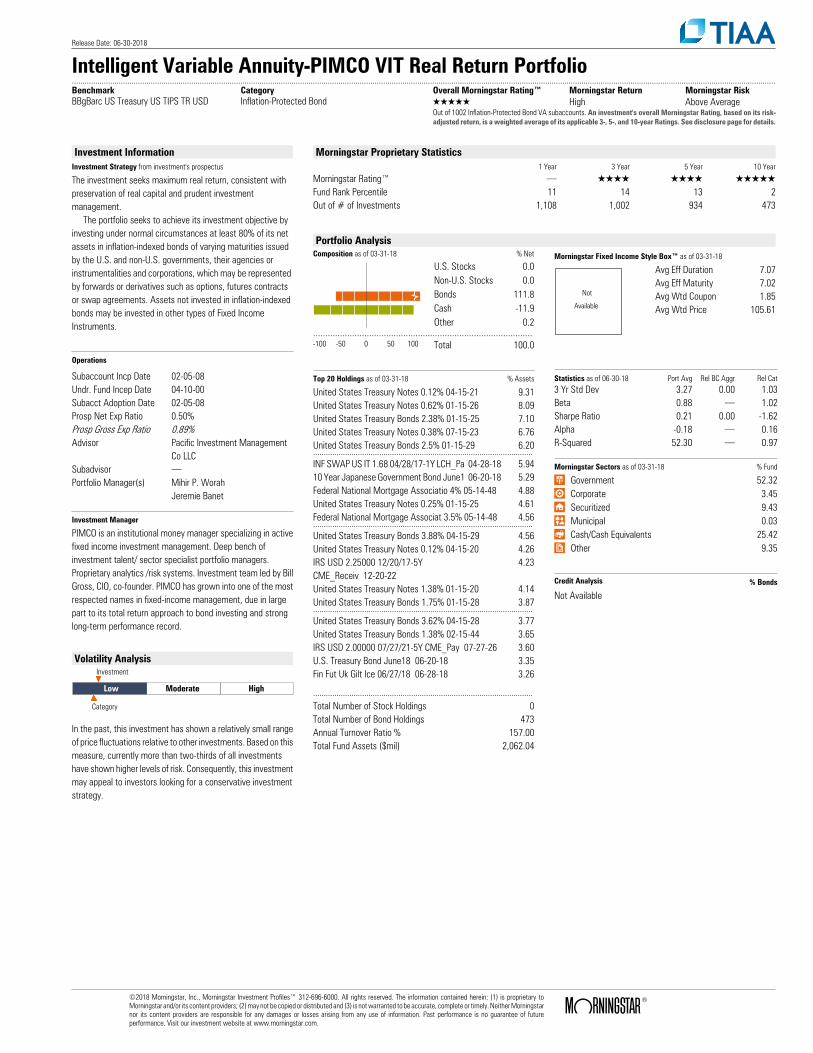
Release Date: 06-30-2018
Intelligent Variable Annuity-PIMCO VIT Real Return Portfolio..........................................................................................................................................................................................................................................................................................................................................Benchmark Category Overall Morningstar Rating™ Morningstar Return Morningstar RiskBBgBarc US Treasury US TIPS TR USD Inflation-Protected Bond QQQQQ High Above Average
Out of 1002 Inflation-Protected Bond VA subaccounts. An investment's overall Morningstar Rating, based on its risk-adjusted return, is a weighted average of its applicable 3-, 5-, and 10-year Ratings. See disclosure page for details.
Investment InformationInvestment Strategy from investment's prospectus
The investment seeks maximum real return, consistent with preservation of real capital and prudent investment management. The portfolio seeks to achieve its investment objective by investing under normal circumstances at least 80% of its net assets in inflation-indexed bonds of varying maturities issued by the U.S. and non-U.S. governments, their agencies or instrumentalities and corporations, which may be represented by forwards or derivatives such as options, futures contracts or swap agreements. Assets not invested in inflation-indexed bonds may be invested in other types of Fixed Income Instruments.
Operations
Subaccount Incp Date 02-05-08Undr. Fund Incep Date 04-10-00Subacct Adoption Date 02-05-08Prosp Net Exp Ratio 0.50%Prosp Gross Exp Ratio 0.89%Advisor Pacific Investment Management
Co LLCSubadvisor .Portfolio Manager(s) Mihir P. Worah
Jeremie Banet
Investment Manager
PIMCO is an institutional money manager specializing in activefixed income investment management. Deep bench ofinvestment talent/ sector specialist portfolio managers.Proprietary analytics /risk systems. Investment team led by BillGross, CIO, co-founder. PIMCO has grown into one of the mostrespected names in fixed-income management, due in largepart to its total return approach to bond investing and stronglong-term performance record.
Volatility Analysis
Low Moderate High
Investment
Category
In the past, this investment has shown a relatively small rangeof price fluctuations relative to other investments. Based on thismeasure, currently more than two-thirds of all investmentshave shown higher levels of risk. Consequently, this investmentmay appeal to investors looking for a conservative investmentstrategy.
Morningstar Proprietary Statistics1 Year 3 Year 5 Year 10 Year
Morningstar Rating™ . QQQQ QQQQ QQQQQFund Rank Percentile 11 14 13 2Out of # of Investments 1,108 1,002 934 473
Portfolio AnalysisComposition as of 03-31-18 % Net
U.S. Stocks 0.0Non-U.S. Stocks 0.0Bonds 111.8Cash -11.9Other 0.2
..........................................................................................-100 -50 0 50 100 Total 100.0
Morningstar Fixed Income Style Box™ as of 03-31-18
Not
Available
Avg Eff Duration 7.07Avg Eff Maturity 7.02Avg Wtd Coupon 1.85Avg Wtd Price 105.61
Top 20 Holdings as of 03-31-18 % Assets
United States Treasury Notes 0.12% 04-15-21 9.31United States Treasury Notes 0.62% 01-15-26 8.09United States Treasury Bonds 2.38% 01-15-25 7.10United States Treasury Notes 0.38% 07-15-23 6.76United States Treasury Bonds 2.5% 01-15-29 6.20.......................................................................................................INF SWAP US IT 1.68 04/28/17-1Y LCH_Pa 04-28-18 5.9410 Year Japanese Government Bond June1 06-20-18 5.29Federal National Mortgage Associatio 4% 05-14-48 4.88United States Treasury Notes 0.25% 01-15-25 4.61Federal National Mortgage Associat 3.5% 05-14-48 4.56.......................................................................................................United States Treasury Bonds 3.88% 04-15-29 4.56United States Treasury Notes 0.12% 04-15-20 4.26IRS USD 2.25000 12/20/17-5Y CME_Receiv 12-20-22
4.23
United States Treasury Notes 1.38% 01-15-20 4.14United States Treasury Bonds 1.75% 01-15-28 3.87.......................................................................................................United States Treasury Bonds 3.62% 04-15-28 3.77United States Treasury Bonds 1.38% 02-15-44 3.65IRS USD 2.00000 07/27/21-5Y CME_Pay 07-27-26 3.60U.S. Treasury Bond June18 06-20-18 3.35Fin Fut Uk Gilt Ice 06/27/18 06-28-18 3.26
.......................................................................................................Total Number of Stock Holdings 0Total Number of Bond Holdings 473Annual Turnover Ratio % 157.00Total Fund Assets ($mil) 2,062.04
Statistics as of 06-30-18 Port Avg Rel BC Aggr Rel Cat3 Yr Std Dev 3.27 0.00 1.03Beta 0.88 . 1.02Sharpe Ratio 0.21 0.00 -1.62Alpha -0.18 . 0.16R-Squared 52.30 . 0.97
Morningstar Sectors as of 03-31-18 % Fund
⁄ Government 52.32› Corporate 3.45€ Securitized 9.43‹ Municipal 0.03fi Cash/Cash Equivalents 25.42± Other 9.35
Credit Analysis % Bonds
Not Available
©2018 Morningstar, Inc., Morningstar Investment Profiles™ 312-696-6000. All rights reserved. The information contained herein: (1) is proprietary toMorningstar and/or its content providers; (2) may not be copied or distributed and (3) is not warranted to be accurate, complete or timely. Neither Morningstarnor its content providers are responsible for any damages or losses arising from any use of information. Past performance is no guarantee of futureperformance. Visit our investment website at www.morningstar.com.
ß®
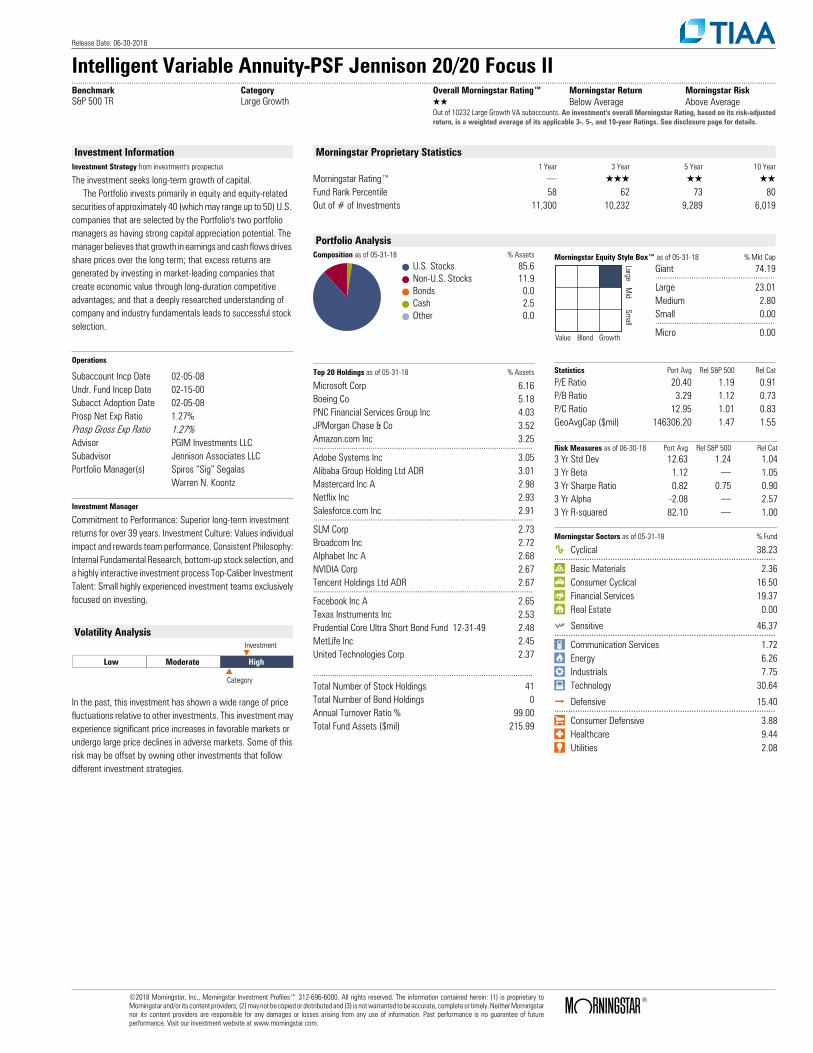
Release Date: 06-30-2018
Intelligent Variable Annuity-PSF Jennison 20/20 Focus II..........................................................................................................................................................................................................................................................................................................................................Benchmark Category Overall Morningstar Rating™ Morningstar Return Morningstar RiskS&P 500 TR Large Growth QQ Below Average Above Average
Out of 10232 Large Growth VA subaccounts. An investment's overall Morningstar Rating, based on its risk-adjustedreturn, is a weighted average of its applicable 3-, 5-, and 10-year Ratings. See disclosure page for details.
Investment InformationInvestment Strategy from investment's prospectus
The investment seeks long-term growth of capital. The Portfolio invests primarily in equity and equity-related securities of approximately 40 (which may range up to 50) U.S. companies that are selected by the Portfolio's two portfolio managers as having strong capital appreciation potential. The manager believes that growth in earnings and cash flows drives share prices over the long term; that excess returns are generated by investing in market-leading companies that create economic value through long-duration competitive advantages; and that a deeply researched understanding of company and industry fundamentals leads to successful stock selection.
Operations
Subaccount Incp Date 02-05-08Undr. Fund Incep Date 02-15-00Subacct Adoption Date 02-05-08Prosp Net Exp Ratio 1.27%Prosp Gross Exp Ratio 1.27%Advisor PGIM Investments LLCSubadvisor Jennison Associates LLCPortfolio Manager(s) Spiros “Sig” Segalas
Warren N. Koontz
Investment Manager
Commitment to Performance: Superior long-term investmentreturns for over 39 years. Investment Culture: Values individualimpact and rewards team performance. Consistent Philosophy:Internal Fundamental Research, bottom-up stock selection, anda highly interactive investment process Top-Caliber InvestmentTalent: Small highly experienced investment teams exclusivelyfocused on investing.
Volatility Analysis
Low Moderate High
Investment
Category
In the past, this investment has shown a wide range of pricefluctuations relative to other investments. This investment mayexperience significant price increases in favorable markets orundergo large price declines in adverse markets. Some of thisrisk may be offset by owning other investments that followdifferent investment strategies.
Morningstar Proprietary Statistics1 Year 3 Year 5 Year 10 Year
Morningstar Rating™ . QQQ QQ QQFund Rank Percentile 58 62 73 80Out of # of Investments 11,300 10,232 9,289 6,019
Portfolio AnalysisComposition as of 05-31-18 % Assets
U.S. Stocks 85.6Non-U.S. Stocks 11.9Bonds 0.0Cash 2.5Other 0.0
Morningstar Equity Style Box™ as of 05-31-18 % Mkt Cap
LargeM
idSm
all
Value Blend Growth
Giant 74.19........................................................Large 23.01Medium 2.80Small 0.00........................................................Micro 0.00
Top 20 Holdings as of 05-31-18 % Assets
Microsoft Corp 6.16Boeing Co 5.18PNC Financial Services Group Inc 4.03JPMorgan Chase & Co 3.52Amazon.com Inc 3.25.......................................................................................................Adobe Systems Inc 3.05Alibaba Group Holding Ltd ADR 3.01Mastercard Inc A 2.98Netflix Inc 2.93Salesforce.com Inc 2.91.......................................................................................................SLM Corp 2.73Broadcom Inc 2.72Alphabet Inc A 2.68NVIDIA Corp 2.67Tencent Holdings Ltd ADR 2.67.......................................................................................................Facebook Inc A 2.65Texas Instruments Inc 2.53Prudential Core Ultra Short Bond Fund 12-31-49 2.48MetLife Inc 2.45United Technologies Corp 2.37
.......................................................................................................Total Number of Stock Holdings 41Total Number of Bond Holdings 0Annual Turnover Ratio % 99.00Total Fund Assets ($mil) 215.99
Statistics Port Avg Rel S&P 500 Rel Cat
P/E Ratio 20.40 1.19 0.91P/B Ratio 3.29 1.12 0.73P/C Ratio 12.95 1.01 0.83GeoAvgCap ($mil) 146306.20 1.47 1.55
Risk Measures as of 06-30-18 Port Avg Rel S&P 500 Rel Cat3 Yr Std Dev 12.63 1.24 1.043 Yr Beta 1.12 . 1.053 Yr Sharpe Ratio 0.82 0.75 0.903 Yr Alpha -2.08 . 2.573 Yr R-squared 82.10 . 1.00
Morningstar Sectors as of 05-31-18 % Fund
h Cyclical 38.23...............................................................................................r Basic Materials 2.36t Consumer Cyclical 16.50y Financial Services 19.37u Real Estate 0.00
j Sensitive 46.37...............................................................................................i Communication Services 1.72o Energy 6.26p Industrials 7.75a Technology 30.64
k Defensive 15.40...............................................................................................s Consumer Defensive 3.88d Healthcare 9.44f Utilities 2.08
©2018 Morningstar, Inc., Morningstar Investment Profiles™ 312-696-6000. All rights reserved. The information contained herein: (1) is proprietary toMorningstar and/or its content providers; (2) may not be copied or distributed and (3) is not warranted to be accurate, complete or timely. Neither Morningstarnor its content providers are responsible for any damages or losses arising from any use of information. Past performance is no guarantee of futureperformance. Visit our investment website at www.morningstar.com.
ß®
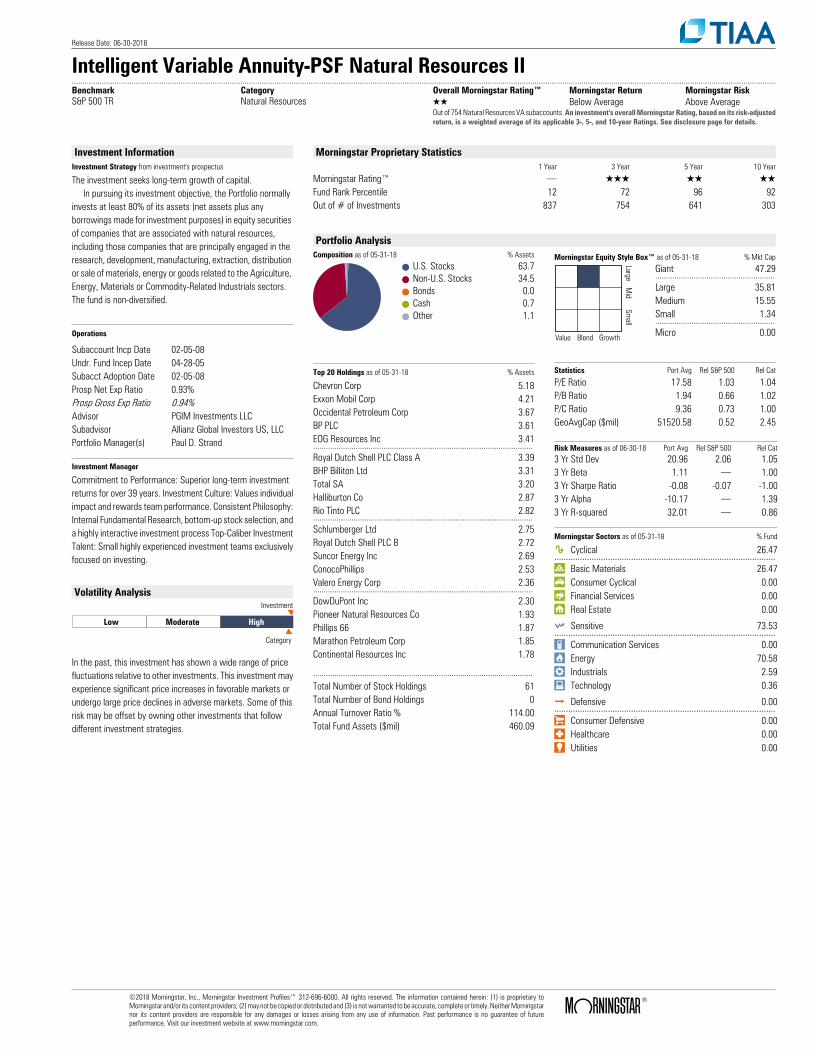
Release Date: 06-30-2018
Intelligent Variable Annuity-PSF Natural Resources II..........................................................................................................................................................................................................................................................................................................................................Benchmark Category Overall Morningstar Rating™ Morningstar Return Morningstar RiskS&P 500 TR Natural Resources QQ Below Average Above Average
Out of 754 Natural Resources VA subaccounts. An investment's overall Morningstar Rating, based on its risk-adjustedreturn, is a weighted average of its applicable 3-, 5-, and 10-year Ratings. See disclosure page for details.
Investment InformationInvestment Strategy from investment's prospectus
The investment seeks long-term growth of capital. In pursuing its investment objective, the Portfolio normally invests at least 80% of its assets (net assets plus any borrowings made for investment purposes) in equity securities of companies that are associated with natural resources, including those companies that are principally engaged in the research, development, manufacturing, extraction, distribution or sale of materials, energy or goods related to the Agriculture, Energy, Materials or Commodity-Related Industrials sectors. The fund is non-diversified.
Operations
Subaccount Incp Date 02-05-08Undr. Fund Incep Date 04-28-05Subacct Adoption Date 02-05-08Prosp Net Exp Ratio 0.93%Prosp Gross Exp Ratio 0.94%Advisor PGIM Investments LLCSubadvisor Allianz Global Investors US, LLCPortfolio Manager(s) Paul D. Strand
Investment Manager
Commitment to Performance: Superior long-term investmentreturns for over 39 years. Investment Culture: Values individualimpact and rewards team performance. Consistent Philosophy:Internal Fundamental Research, bottom-up stock selection, anda highly interactive investment process Top-Caliber InvestmentTalent: Small highly experienced investment teams exclusivelyfocused on investing.
Volatility Analysis
Low Moderate High
Investment
Category
In the past, this investment has shown a wide range of pricefluctuations relative to other investments. This investment mayexperience significant price increases in favorable markets orundergo large price declines in adverse markets. Some of thisrisk may be offset by owning other investments that followdifferent investment strategies.
Morningstar Proprietary Statistics1 Year 3 Year 5 Year 10 Year
Morningstar Rating™ . QQQ QQ QQFund Rank Percentile 12 72 96 92Out of # of Investments 837 754 641 303
Portfolio AnalysisComposition as of 05-31-18 % Assets
U.S. Stocks 63.7Non-U.S. Stocks 34.5Bonds 0.0Cash 0.7Other 1.1
Morningstar Equity Style Box™ as of 05-31-18 % Mkt Cap
LargeM
idSm
all
Value Blend Growth
Giant 47.29........................................................Large 35.81Medium 15.55Small 1.34........................................................Micro 0.00
Top 20 Holdings as of 05-31-18 % Assets
Chevron Corp 5.18Exxon Mobil Corp 4.21Occidental Petroleum Corp 3.67BP PLC 3.61EOG Resources Inc 3.41.......................................................................................................Royal Dutch Shell PLC Class A 3.39BHP Billiton Ltd 3.31Total SA 3.20Halliburton Co 2.87Rio Tinto PLC 2.82.......................................................................................................Schlumberger Ltd 2.75Royal Dutch Shell PLC B 2.72Suncor Energy Inc 2.69ConocoPhillips 2.53Valero Energy Corp 2.36.......................................................................................................DowDuPont Inc 2.30Pioneer Natural Resources Co 1.93Phillips 66 1.87Marathon Petroleum Corp 1.85Continental Resources Inc 1.78
.......................................................................................................Total Number of Stock Holdings 61Total Number of Bond Holdings 0Annual Turnover Ratio % 114.00Total Fund Assets ($mil) 460.09
Statistics Port Avg Rel S&P 500 Rel Cat
P/E Ratio 17.58 1.03 1.04P/B Ratio 1.94 0.66 1.02P/C Ratio 9.36 0.73 1.00GeoAvgCap ($mil) 51520.58 0.52 2.45
Risk Measures as of 06-30-18 Port Avg Rel S&P 500 Rel Cat3 Yr Std Dev 20.96 2.06 1.053 Yr Beta 1.11 . 1.003 Yr Sharpe Ratio -0.08 -0.07 -1.003 Yr Alpha -10.17 . 1.393 Yr R-squared 32.01 . 0.86
Morningstar Sectors as of 05-31-18 % Fund
h Cyclical 26.47...............................................................................................r Basic Materials 26.47t Consumer Cyclical 0.00y Financial Services 0.00u Real Estate 0.00
j Sensitive 73.53...............................................................................................i Communication Services 0.00o Energy 70.58p Industrials 2.59a Technology 0.36
k Defensive 0.00...............................................................................................s Consumer Defensive 0.00d Healthcare 0.00f Utilities 0.00
©2018 Morningstar, Inc., Morningstar Investment Profiles™ 312-696-6000. All rights reserved. The information contained herein: (1) is proprietary toMorningstar and/or its content providers; (2) may not be copied or distributed and (3) is not warranted to be accurate, complete or timely. Neither Morningstarnor its content providers are responsible for any damages or losses arising from any use of information. Past performance is no guarantee of futureperformance. Visit our investment website at www.morningstar.com.
ß®
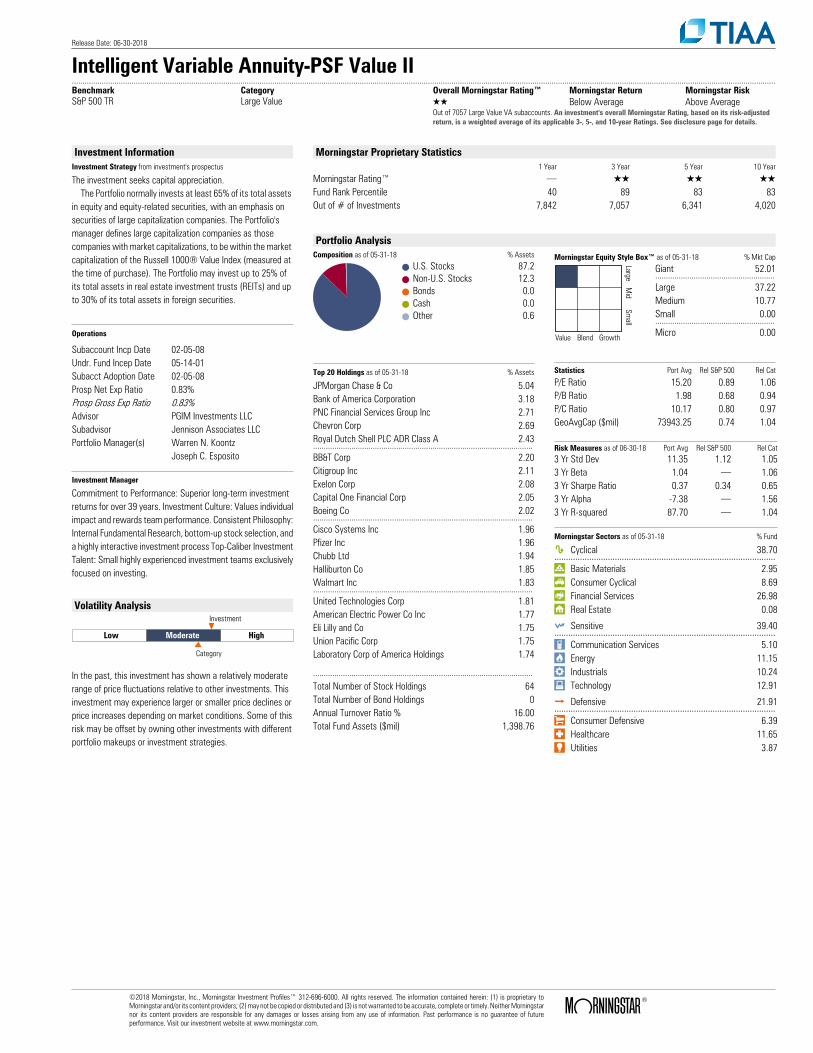
Release Date: 06-30-2018
Intelligent Variable Annuity-PSF Value II..........................................................................................................................................................................................................................................................................................................................................Benchmark Category Overall Morningstar Rating™ Morningstar Return Morningstar RiskS&P 500 TR Large Value QQ Below Average Above Average
Out of 7057 Large Value VA subaccounts. An investment's overall Morningstar Rating, based on its risk-adjustedreturn, is a weighted average of its applicable 3-, 5-, and 10-year Ratings. See disclosure page for details.
Investment InformationInvestment Strategy from investment's prospectus
The investment seeks capital appreciation. The Portfolio normally invests at least 65% of its total assets in equity and equity-related securities, with an emphasis on securities of large capitalization companies. The Portfolio's manager defines large capitalization companies as those companies with market capitalizations, to be within the market capitalization of the Russell 1000® Value Index (measured at the time of purchase). The Portfolio may invest up to 25% of its total assets in real estate investment trusts (REITs) and up to 30% of its total assets in foreign securities.
Operations
Subaccount Incp Date 02-05-08Undr. Fund Incep Date 05-14-01Subacct Adoption Date 02-05-08Prosp Net Exp Ratio 0.83%Prosp Gross Exp Ratio 0.83%Advisor PGIM Investments LLCSubadvisor Jennison Associates LLCPortfolio Manager(s) Warren N. Koontz
Joseph C. Esposito
Investment Manager
Commitment to Performance: Superior long-term investmentreturns for over 39 years. Investment Culture: Values individualimpact and rewards team performance. Consistent Philosophy:Internal Fundamental Research, bottom-up stock selection, anda highly interactive investment process Top-Caliber InvestmentTalent: Small highly experienced investment teams exclusivelyfocused on investing.
Volatility Analysis
Low Moderate High
Investment
Category
In the past, this investment has shown a relatively moderaterange of price fluctuations relative to other investments. Thisinvestment may experience larger or smaller price declines orprice increases depending on market conditions. Some of thisrisk may be offset by owning other investments with differentportfolio makeups or investment strategies.
Morningstar Proprietary Statistics1 Year 3 Year 5 Year 10 Year
Morningstar Rating™ . QQ QQ QQFund Rank Percentile 40 89 83 83Out of # of Investments 7,842 7,057 6,341 4,020
Portfolio AnalysisComposition as of 05-31-18 % Assets
U.S. Stocks 87.2Non-U.S. Stocks 12.3Bonds 0.0Cash 0.0Other 0.6
Morningstar Equity Style Box™ as of 05-31-18 % Mkt Cap
LargeM
idSm
all
Value Blend Growth
Giant 52.01........................................................Large 37.22Medium 10.77Small 0.00........................................................Micro 0.00
Top 20 Holdings as of 05-31-18 % Assets
JPMorgan Chase & Co 5.04Bank of America Corporation 3.18PNC Financial Services Group Inc 2.71Chevron Corp 2.69Royal Dutch Shell PLC ADR Class A 2.43.......................................................................................................BB&T Corp 2.20Citigroup Inc 2.11Exelon Corp 2.08Capital One Financial Corp 2.05Boeing Co 2.02.......................................................................................................Cisco Systems Inc 1.96Pfizer Inc 1.96Chubb Ltd 1.94Halliburton Co 1.85Walmart Inc 1.83.......................................................................................................United Technologies Corp 1.81American Electric Power Co Inc 1.77Eli Lilly and Co 1.75Union Pacific Corp 1.75Laboratory Corp of America Holdings 1.74
.......................................................................................................Total Number of Stock Holdings 64Total Number of Bond Holdings 0Annual Turnover Ratio % 16.00Total Fund Assets ($mil) 1,398.76
Statistics Port Avg Rel S&P 500 Rel Cat
P/E Ratio 15.20 0.89 1.06P/B Ratio 1.98 0.68 0.94P/C Ratio 10.17 0.80 0.97GeoAvgCap ($mil) 73943.25 0.74 1.04
Risk Measures as of 06-30-18 Port Avg Rel S&P 500 Rel Cat3 Yr Std Dev 11.35 1.12 1.053 Yr Beta 1.04 . 1.063 Yr Sharpe Ratio 0.37 0.34 0.653 Yr Alpha -7.38 . 1.563 Yr R-squared 87.70 . 1.04
Morningstar Sectors as of 05-31-18 % Fund
h Cyclical 38.70...............................................................................................r Basic Materials 2.95t Consumer Cyclical 8.69y Financial Services 26.98u Real Estate 0.08
j Sensitive 39.40...............................................................................................i Communication Services 5.10o Energy 11.15p Industrials 10.24a Technology 12.91
k Defensive 21.91...............................................................................................s Consumer Defensive 6.39d Healthcare 11.65f Utilities 3.87
©2018 Morningstar, Inc., Morningstar Investment Profiles™ 312-696-6000. All rights reserved. The information contained herein: (1) is proprietary toMorningstar and/or its content providers; (2) may not be copied or distributed and (3) is not warranted to be accurate, complete or timely. Neither Morningstarnor its content providers are responsible for any damages or losses arising from any use of information. Past performance is no guarantee of futureperformance. Visit our investment website at www.morningstar.com.
ß®
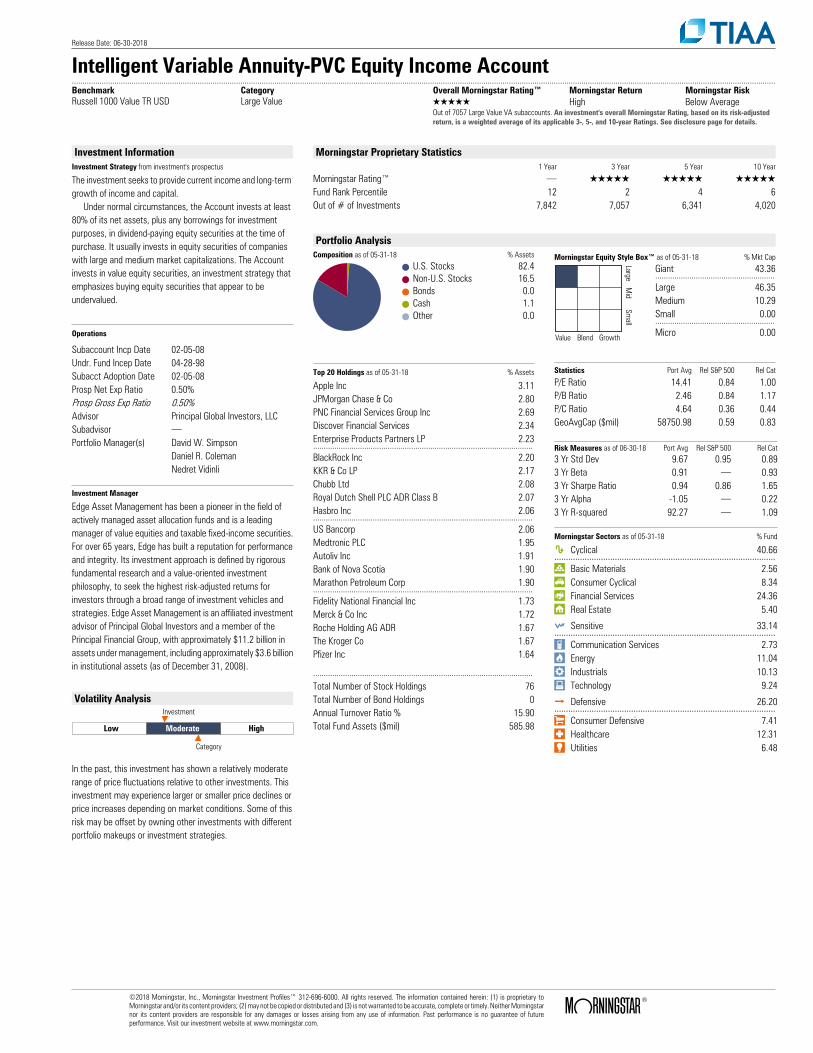
Release Date: 06-30-2018
Intelligent Variable Annuity-PVC Equity Income Account..........................................................................................................................................................................................................................................................................................................................................Benchmark Category Overall Morningstar Rating™ Morningstar Return Morningstar RiskRussell 1000 Value TR USD Large Value QQQQQ High Below Average
Out of 7057 Large Value VA subaccounts. An investment's overall Morningstar Rating, based on its risk-adjustedreturn, is a weighted average of its applicable 3-, 5-, and 10-year Ratings. See disclosure page for details.
Investment InformationInvestment Strategy from investment's prospectus
The investment seeks to provide current income and long-term growth of income and capital. Under normal circumstances, the Account invests at least 80% of its net assets, plus any borrowings for investment purposes, in dividend-paying equity securities at the time of purchase. It usually invests in equity securities of companies with large and medium market capitalizations. The Account invests in value equity securities, an investment strategy that emphasizes buying equity securities that appear to be undervalued.
Operations
Subaccount Incp Date 02-05-08Undr. Fund Incep Date 04-28-98Subacct Adoption Date 02-05-08Prosp Net Exp Ratio 0.50%Prosp Gross Exp Ratio 0.50%Advisor Principal Global Investors, LLCSubadvisor .Portfolio Manager(s) David W. Simpson
Daniel R. ColemanNedret Vidinli
Investment Manager
Edge Asset Management has been a pioneer in the field ofactively managed asset allocation funds and is a leadingmanager of value equities and taxable fixed-income securities.For over 65 years, Edge has built a reputation for performanceand integrity. Its investment approach is defined by rigorousfundamental research and a value-oriented investmentphilosophy, to seek the highest risk-adjusted returns forinvestors through a broad range of investment vehicles andstrategies. Edge Asset Management is an affiliated investmentadvisor of Principal Global Investors and a member of thePrincipal Financial Group, with approximately $11.2 billion inassets under management, including approximately $3.6 billionin institutional assets (as of December 31, 2008).
Volatility Analysis
Low Moderate High
Investment
Category
In the past, this investment has shown a relatively moderaterange of price fluctuations relative to other investments. Thisinvestment may experience larger or smaller price declines orprice increases depending on market conditions. Some of thisrisk may be offset by owning other investments with differentportfolio makeups or investment strategies.
Morningstar Proprietary Statistics1 Year 3 Year 5 Year 10 Year
Morningstar Rating™ . QQQQQ QQQQQ QQQQQFund Rank Percentile 12 2 4 6Out of # of Investments 7,842 7,057 6,341 4,020
Portfolio AnalysisComposition as of 05-31-18 % Assets
U.S. Stocks 82.4Non-U.S. Stocks 16.5Bonds 0.0Cash 1.1Other 0.0
Morningstar Equity Style Box™ as of 05-31-18 % Mkt Cap
LargeM
idSm
all
Value Blend Growth
Giant 43.36........................................................Large 46.35Medium 10.29Small 0.00........................................................Micro 0.00
Top 20 Holdings as of 05-31-18 % Assets
Apple Inc 3.11JPMorgan Chase & Co 2.80PNC Financial Services Group Inc 2.69Discover Financial Services 2.34Enterprise Products Partners LP 2.23.......................................................................................................BlackRock Inc 2.20KKR & Co LP 2.17Chubb Ltd 2.08Royal Dutch Shell PLC ADR Class B 2.07Hasbro Inc 2.06.......................................................................................................US Bancorp 2.06Medtronic PLC 1.95Autoliv Inc 1.91Bank of Nova Scotia 1.90Marathon Petroleum Corp 1.90.......................................................................................................Fidelity National Financial Inc 1.73Merck & Co Inc 1.72Roche Holding AG ADR 1.67The Kroger Co 1.67Pfizer Inc 1.64
.......................................................................................................Total Number of Stock Holdings 76Total Number of Bond Holdings 0Annual Turnover Ratio % 15.90Total Fund Assets ($mil) 585.98
Statistics Port Avg Rel S&P 500 Rel Cat
P/E Ratio 14.41 0.84 1.00P/B Ratio 2.46 0.84 1.17P/C Ratio 4.64 0.36 0.44GeoAvgCap ($mil) 58750.98 0.59 0.83
Risk Measures as of 06-30-18 Port Avg Rel S&P 500 Rel Cat3 Yr Std Dev 9.67 0.95 0.893 Yr Beta 0.91 . 0.933 Yr Sharpe Ratio 0.94 0.86 1.653 Yr Alpha -1.05 . 0.223 Yr R-squared 92.27 . 1.09
Morningstar Sectors as of 05-31-18 % Fund
h Cyclical 40.66...............................................................................................r Basic Materials 2.56t Consumer Cyclical 8.34y Financial Services 24.36u Real Estate 5.40
j Sensitive 33.14...............................................................................................i Communication Services 2.73o Energy 11.04p Industrials 10.13a Technology 9.24
k Defensive 26.20...............................................................................................s Consumer Defensive 7.41d Healthcare 12.31f Utilities 6.48
©2018 Morningstar, Inc., Morningstar Investment Profiles™ 312-696-6000. All rights reserved. The information contained herein: (1) is proprietary toMorningstar and/or its content providers; (2) may not be copied or distributed and (3) is not warranted to be accurate, complete or timely. Neither Morningstarnor its content providers are responsible for any damages or losses arising from any use of information. Past performance is no guarantee of futureperformance. Visit our investment website at www.morningstar.com.
ß®
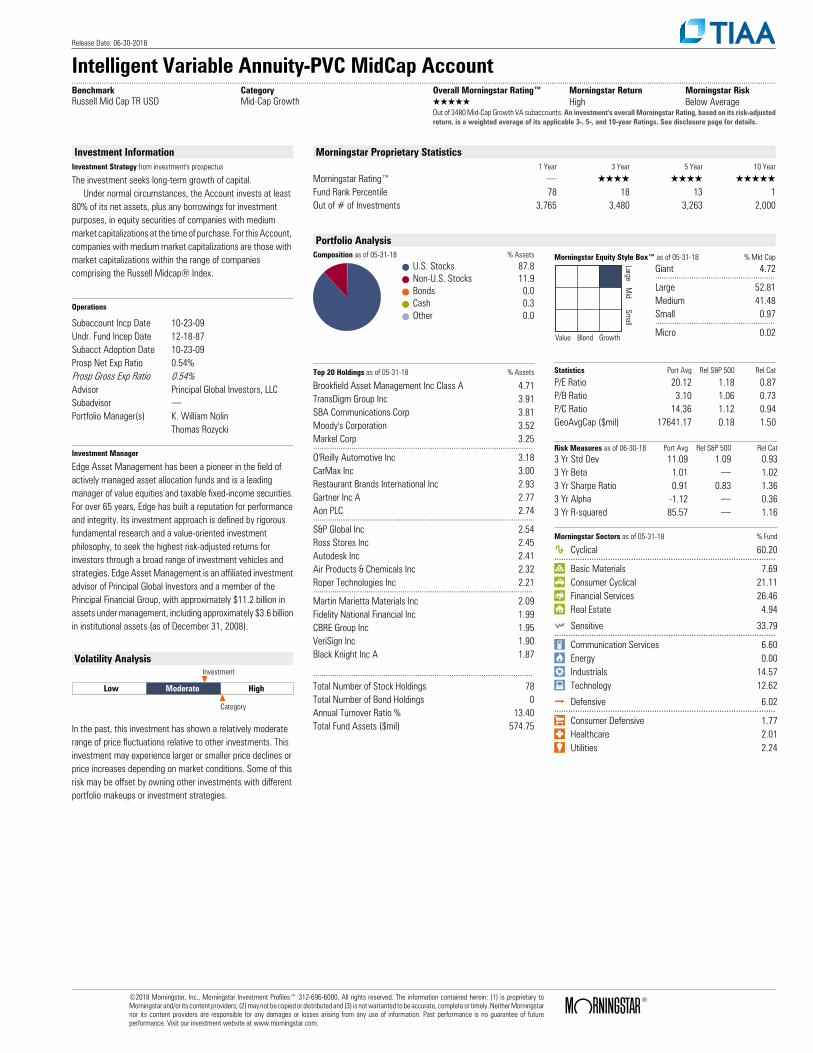
Release Date: 06-30-2018
Intelligent Variable Annuity-PVC MidCap Account..........................................................................................................................................................................................................................................................................................................................................Benchmark Category Overall Morningstar Rating™ Morningstar Return Morningstar RiskRussell Mid Cap TR USD Mid-Cap Growth QQQQQ High Below Average
Out of 3480 Mid-Cap Growth VA subaccounts. An investment's overall Morningstar Rating, based on its risk-adjustedreturn, is a weighted average of its applicable 3-, 5-, and 10-year Ratings. See disclosure page for details.
Investment InformationInvestment Strategy from investment's prospectus
The investment seeks long-term growth of capital. Under normal circumstances, the Account invests at least 80% of its net assets, plus any borrowings for investment purposes, in equity securities of companies with medium market capitalizations at the time of purchase. For this Account, companies with medium market capitalizations are those with market capitalizations within the range of companies comprising the Russell Midcap® Index.
Operations
Subaccount Incp Date 10-23-09Undr. Fund Incep Date 12-18-87Subacct Adoption Date 10-23-09Prosp Net Exp Ratio 0.54%Prosp Gross Exp Ratio 0.54%Advisor Principal Global Investors, LLCSubadvisor .Portfolio Manager(s) K. William Nolin
Thomas Rozycki
Investment Manager
Edge Asset Management has been a pioneer in the field ofactively managed asset allocation funds and is a leadingmanager of value equities and taxable fixed-income securities.For over 65 years, Edge has built a reputation for performanceand integrity. Its investment approach is defined by rigorousfundamental research and a value-oriented investmentphilosophy, to seek the highest risk-adjusted returns forinvestors through a broad range of investment vehicles andstrategies. Edge Asset Management is an affiliated investmentadvisor of Principal Global Investors and a member of thePrincipal Financial Group, with approximately $11.2 billion inassets under management, including approximately $3.6 billionin institutional assets (as of December 31, 2008).
Volatility Analysis
Low Moderate High
Investment
Category
In the past, this investment has shown a relatively moderaterange of price fluctuations relative to other investments. Thisinvestment may experience larger or smaller price declines orprice increases depending on market conditions. Some of thisrisk may be offset by owning other investments with differentportfolio makeups or investment strategies.
Morningstar Proprietary Statistics1 Year 3 Year 5 Year 10 Year
Morningstar Rating™ . QQQQ QQQQ QQQQQFund Rank Percentile 78 18 13 1Out of # of Investments 3,765 3,480 3,263 2,000
Portfolio AnalysisComposition as of 05-31-18 % Assets
U.S. Stocks 87.8Non-U.S. Stocks 11.9Bonds 0.0Cash 0.3Other 0.0
Morningstar Equity Style Box™ as of 05-31-18 % Mkt Cap
LargeM
idSm
all
Value Blend Growth
Giant 4.72........................................................Large 52.81Medium 41.48Small 0.97........................................................Micro 0.02
Top 20 Holdings as of 05-31-18 % Assets
Brookfield Asset Management Inc Class A 4.71TransDigm Group Inc 3.91SBA Communications Corp 3.81Moody's Corporation 3.52Markel Corp 3.25.......................................................................................................O'Reilly Automotive Inc 3.18CarMax Inc 3.00Restaurant Brands International Inc 2.93Gartner Inc A 2.77Aon PLC 2.74.......................................................................................................S&P Global Inc 2.54Ross Stores Inc 2.45Autodesk Inc 2.41Air Products & Chemicals Inc 2.32Roper Technologies Inc 2.21.......................................................................................................Martin Marietta Materials Inc 2.09Fidelity National Financial Inc 1.99CBRE Group Inc 1.95VeriSign Inc 1.90Black Knight Inc A 1.87
.......................................................................................................Total Number of Stock Holdings 78Total Number of Bond Holdings 0Annual Turnover Ratio % 13.40Total Fund Assets ($mil) 574.75
Statistics Port Avg Rel S&P 500 Rel Cat
P/E Ratio 20.12 1.18 0.87P/B Ratio 3.10 1.06 0.73P/C Ratio 14.36 1.12 0.94GeoAvgCap ($mil) 17641.17 0.18 1.50
Risk Measures as of 06-30-18 Port Avg Rel S&P 500 Rel Cat3 Yr Std Dev 11.09 1.09 0.933 Yr Beta 1.01 . 1.023 Yr Sharpe Ratio 0.91 0.83 1.363 Yr Alpha -1.12 . 0.363 Yr R-squared 85.57 . 1.16
Morningstar Sectors as of 05-31-18 % Fund
h Cyclical 60.20...............................................................................................r Basic Materials 7.69t Consumer Cyclical 21.11y Financial Services 26.46u Real Estate 4.94
j Sensitive 33.79...............................................................................................i Communication Services 6.60o Energy 0.00p Industrials 14.57a Technology 12.62
k Defensive 6.02...............................................................................................s Consumer Defensive 1.77d Healthcare 2.01f Utilities 2.24
©2018 Morningstar, Inc., Morningstar Investment Profiles™ 312-696-6000. All rights reserved. The information contained herein: (1) is proprietary toMorningstar and/or its content providers; (2) may not be copied or distributed and (3) is not warranted to be accurate, complete or timely. Neither Morningstarnor its content providers are responsible for any damages or losses arising from any use of information. Past performance is no guarantee of futureperformance. Visit our investment website at www.morningstar.com.
ß®
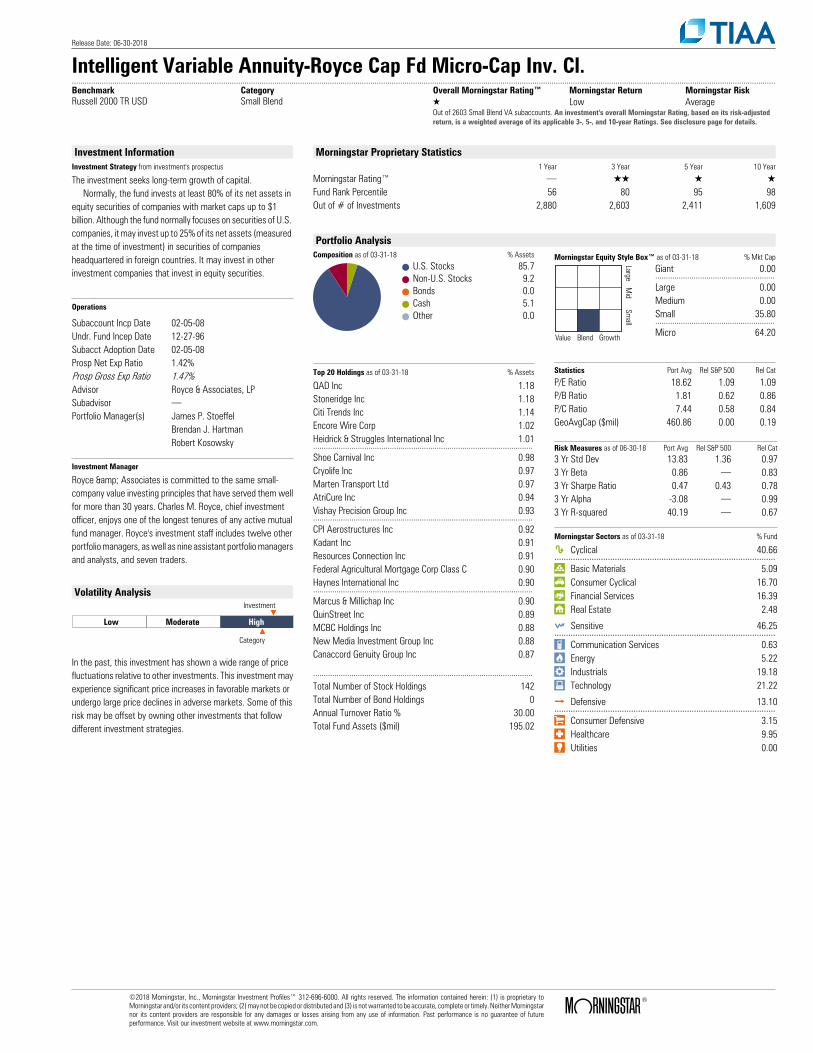
Release Date: 06-30-2018
Intelligent Variable Annuity-Royce Cap Fd Micro-Cap Inv. Cl...........................................................................................................................................................................................................................................................................................................................................Benchmark Category Overall Morningstar Rating™ Morningstar Return Morningstar RiskRussell 2000 TR USD Small Blend Q Low Average
Out of 2603 Small Blend VA subaccounts. An investment's overall Morningstar Rating, based on its risk-adjustedreturn, is a weighted average of its applicable 3-, 5-, and 10-year Ratings. See disclosure page for details.
Investment InformationInvestment Strategy from investment's prospectus
The investment seeks long-term growth of capital. Normally, the fund invests at least 80% of its net assets in equity securities of companies with market caps up to $1 billion. Although the fund normally focuses on securities of U.S. companies, it may invest up to 25% of its net assets (measured at the time of investment) in securities of companies headquartered in foreign countries. It may invest in other investment companies that invest in equity securities.
Operations
Subaccount Incp Date 02-05-08Undr. Fund Incep Date 12-27-96Subacct Adoption Date 02-05-08Prosp Net Exp Ratio 1.42%Prosp Gross Exp Ratio 1.47%Advisor Royce & Associates, LPSubadvisor .Portfolio Manager(s) James P. Stoeffel
Brendan J. HartmanRobert Kosowsky
Investment Manager
Royce & Associates is committed to the same small-company value investing principles that have served them wellfor more than 30 years. Charles M. Royce, chief investmentofficer, enjoys one of the longest tenures of any active mutualfund manager. Royce's investment staff includes twelve otherportfolio managers, as well as nine assistant portfolio managersand analysts, and seven traders.
Volatility Analysis
Low Moderate High
Investment
Category
In the past, this investment has shown a wide range of pricefluctuations relative to other investments. This investment mayexperience significant price increases in favorable markets orundergo large price declines in adverse markets. Some of thisrisk may be offset by owning other investments that followdifferent investment strategies.
Morningstar Proprietary Statistics1 Year 3 Year 5 Year 10 Year
Morningstar Rating™ . QQ Q QFund Rank Percentile 56 80 95 98Out of # of Investments 2,880 2,603 2,411 1,609
Portfolio AnalysisComposition as of 03-31-18 % Assets
U.S. Stocks 85.7Non-U.S. Stocks 9.2Bonds 0.0Cash 5.1Other 0.0
Morningstar Equity Style Box™ as of 03-31-18 % Mkt Cap
LargeM
idSm
all
Value Blend Growth
Giant 0.00........................................................Large 0.00Medium 0.00Small 35.80........................................................Micro 64.20
Top 20 Holdings as of 03-31-18 % Assets
QAD Inc 1.18Stoneridge Inc 1.18Citi Trends Inc 1.14Encore Wire Corp 1.02Heidrick & Struggles International Inc 1.01.......................................................................................................Shoe Carnival Inc 0.98Cryolife Inc 0.97Marten Transport Ltd 0.97AtriCure Inc 0.94Vishay Precision Group Inc 0.93.......................................................................................................CPI Aerostructures Inc 0.92Kadant Inc 0.91Resources Connection Inc 0.91Federal Agricultural Mortgage Corp Class C 0.90Haynes International Inc 0.90.......................................................................................................Marcus & Millichap Inc 0.90QuinStreet Inc 0.89MCBC Holdings Inc 0.88New Media Investment Group Inc 0.88Canaccord Genuity Group Inc 0.87
.......................................................................................................Total Number of Stock Holdings 142Total Number of Bond Holdings 0Annual Turnover Ratio % 30.00Total Fund Assets ($mil) 195.02
Statistics Port Avg Rel S&P 500 Rel Cat
P/E Ratio 18.62 1.09 1.09P/B Ratio 1.81 0.62 0.86P/C Ratio 7.44 0.58 0.84GeoAvgCap ($mil) 460.86 0.00 0.19
Risk Measures as of 06-30-18 Port Avg Rel S&P 500 Rel Cat3 Yr Std Dev 13.83 1.36 0.973 Yr Beta 0.86 . 0.833 Yr Sharpe Ratio 0.47 0.43 0.783 Yr Alpha -3.08 . 0.993 Yr R-squared 40.19 . 0.67
Morningstar Sectors as of 03-31-18 % Fund
h Cyclical 40.66...............................................................................................r Basic Materials 5.09t Consumer Cyclical 16.70y Financial Services 16.39u Real Estate 2.48
j Sensitive 46.25...............................................................................................i Communication Services 0.63o Energy 5.22p Industrials 19.18a Technology 21.22
k Defensive 13.10...............................................................................................s Consumer Defensive 3.15d Healthcare 9.95f Utilities 0.00
©2018 Morningstar, Inc., Morningstar Investment Profiles™ 312-696-6000. All rights reserved. The information contained herein: (1) is proprietary toMorningstar and/or its content providers; (2) may not be copied or distributed and (3) is not warranted to be accurate, complete or timely. Neither Morningstarnor its content providers are responsible for any damages or losses arising from any use of information. Past performance is no guarantee of futureperformance. Visit our investment website at www.morningstar.com.
ß®
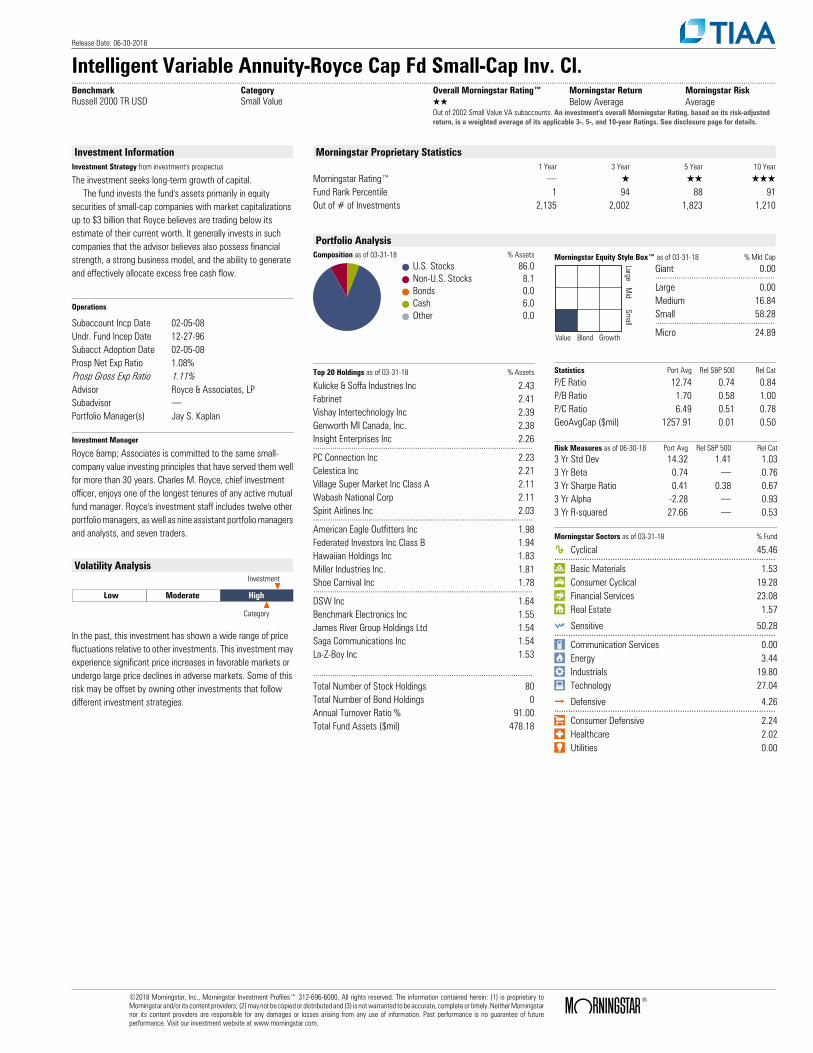
Release Date: 06-30-2018
Intelligent Variable Annuity-Royce Cap Fd Small-Cap Inv. Cl...........................................................................................................................................................................................................................................................................................................................................Benchmark Category Overall Morningstar Rating™ Morningstar Return Morningstar RiskRussell 2000 TR USD Small Value QQ Below Average Average
Out of 2002 Small Value VA subaccounts. An investment's overall Morningstar Rating, based on its risk-adjustedreturn, is a weighted average of its applicable 3-, 5-, and 10-year Ratings. See disclosure page for details.
Investment InformationInvestment Strategy from investment's prospectus
The investment seeks long-term growth of capital. The fund invests the fund's assets primarily in equity securities of small-cap companies with market capitalizations up to $3 billion that Royce believes are trading below its estimate of their current worth. It generally invests in such companies that the advisor believes also possess financial strength, a strong business model, and the ability to generate and effectively allocate excess free cash flow.
Operations
Subaccount Incp Date 02-05-08Undr. Fund Incep Date 12-27-96Subacct Adoption Date 02-05-08Prosp Net Exp Ratio 1.08%Prosp Gross Exp Ratio 1.11%Advisor Royce & Associates, LPSubadvisor .Portfolio Manager(s) Jay S. Kaplan
Investment Manager
Royce & Associates is committed to the same small-company value investing principles that have served them wellfor more than 30 years. Charles M. Royce, chief investmentofficer, enjoys one of the longest tenures of any active mutualfund manager. Royce's investment staff includes twelve otherportfolio managers, as well as nine assistant portfolio managersand analysts, and seven traders.
Volatility Analysis
Low Moderate High
Investment
Category
In the past, this investment has shown a wide range of pricefluctuations relative to other investments. This investment mayexperience significant price increases in favorable markets orundergo large price declines in adverse markets. Some of thisrisk may be offset by owning other investments that followdifferent investment strategies.
Morningstar Proprietary Statistics1 Year 3 Year 5 Year 10 Year
Morningstar Rating™ . Q QQ QQQFund Rank Percentile 1 94 88 91Out of # of Investments 2,135 2,002 1,823 1,210
Portfolio AnalysisComposition as of 03-31-18 % Assets
U.S. Stocks 86.0Non-U.S. Stocks 8.1Bonds 0.0Cash 6.0Other 0.0
Morningstar Equity Style Box™ as of 03-31-18 % Mkt Cap
LargeM
idSm
all
Value Blend Growth
Giant 0.00........................................................Large 0.00Medium 16.84Small 58.28........................................................Micro 24.89
Top 20 Holdings as of 03-31-18 % Assets
Kulicke & Soffa Industries Inc 2.43Fabrinet 2.41Vishay Intertechnology Inc 2.39Genworth MI Canada, Inc. 2.38Insight Enterprises Inc 2.26.......................................................................................................PC Connection Inc 2.23Celestica Inc 2.21Village Super Market Inc Class A 2.11Wabash National Corp 2.11Spirit Airlines Inc 2.03.......................................................................................................American Eagle Outfitters Inc 1.98Federated Investors Inc Class B 1.94Hawaiian Holdings Inc 1.83Miller Industries Inc. 1.81Shoe Carnival Inc 1.78.......................................................................................................DSW Inc 1.64Benchmark Electronics Inc 1.55James River Group Holdings Ltd 1.54Saga Communications Inc 1.54La-Z-Boy Inc 1.53
.......................................................................................................Total Number of Stock Holdings 80Total Number of Bond Holdings 0Annual Turnover Ratio % 91.00Total Fund Assets ($mil) 478.18
Statistics Port Avg Rel S&P 500 Rel Cat
P/E Ratio 12.74 0.74 0.84P/B Ratio 1.70 0.58 1.00P/C Ratio 6.49 0.51 0.78GeoAvgCap ($mil) 1257.91 0.01 0.50
Risk Measures as of 06-30-18 Port Avg Rel S&P 500 Rel Cat3 Yr Std Dev 14.32 1.41 1.033 Yr Beta 0.74 . 0.763 Yr Sharpe Ratio 0.41 0.38 0.673 Yr Alpha -2.28 . 0.933 Yr R-squared 27.66 . 0.53
Morningstar Sectors as of 03-31-18 % Fund
h Cyclical 45.46...............................................................................................r Basic Materials 1.53t Consumer Cyclical 19.28y Financial Services 23.08u Real Estate 1.57
j Sensitive 50.28...............................................................................................i Communication Services 0.00o Energy 3.44p Industrials 19.80a Technology 27.04
k Defensive 4.26...............................................................................................s Consumer Defensive 2.24d Healthcare 2.02f Utilities 0.00
©2018 Morningstar, Inc., Morningstar Investment Profiles™ 312-696-6000. All rights reserved. The information contained herein: (1) is proprietary toMorningstar and/or its content providers; (2) may not be copied or distributed and (3) is not warranted to be accurate, complete or timely. Neither Morningstarnor its content providers are responsible for any damages or losses arising from any use of information. Past performance is no guarantee of futureperformance. Visit our investment website at www.morningstar.com.
ß®
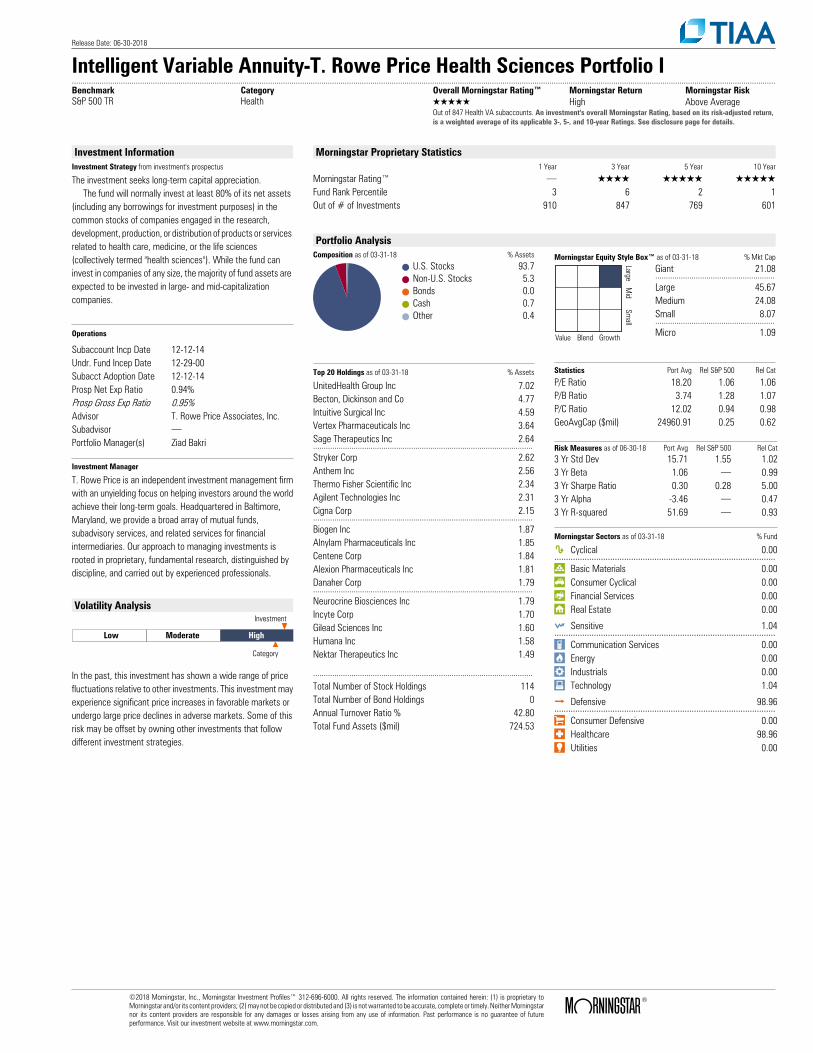
Release Date: 06-30-2018
Intelligent Variable Annuity-T. Rowe Price Health Sciences Portfolio I..........................................................................................................................................................................................................................................................................................................................................Benchmark Category Overall Morningstar Rating™ Morningstar Return Morningstar RiskS&P 500 TR Health QQQQQ High Above Average
Out of 847 Health VA subaccounts. An investment's overall Morningstar Rating, based on its risk-adjusted return,is a weighted average of its applicable 3-, 5-, and 10-year Ratings. See disclosure page for details.
Investment InformationInvestment Strategy from investment's prospectus
The investment seeks long-term capital appreciation. The fund will normally invest at least 80% of its net assets (including any borrowings for investment purposes) in the common stocks of companies engaged in the research, development, production, or distribution of products or services related to health care, medicine, or the life sciences (collectively termed "health sciences"). While the fund can invest in companies of any size, the majority of fund assets are expected to be invested in large- and mid-capitalization companies.
Operations
Subaccount Incp Date 12-12-14Undr. Fund Incep Date 12-29-00Subacct Adoption Date 12-12-14Prosp Net Exp Ratio 0.94%Prosp Gross Exp Ratio 0.95%Advisor T. Rowe Price Associates, Inc.Subadvisor .Portfolio Manager(s) Ziad Bakri
Investment Manager
T. Rowe Price is an independent investment management firmwith an unyielding focus on helping investors around the worldachieve their long-term goals. Headquartered in Baltimore,Maryland, we provide a broad array of mutual funds,subadvisory services, and related services for financialintermediaries. Our approach to managing investments isrooted in proprietary, fundamental research, distinguished bydiscipline, and carried out by experienced professionals.
Volatility Analysis
Low Moderate High
Investment
Category
In the past, this investment has shown a wide range of pricefluctuations relative to other investments. This investment mayexperience significant price increases in favorable markets orundergo large price declines in adverse markets. Some of thisrisk may be offset by owning other investments that followdifferent investment strategies.
Morningstar Proprietary Statistics1 Year 3 Year 5 Year 10 Year
Morningstar Rating™ . QQQQ QQQQQ QQQQQFund Rank Percentile 3 6 2 1Out of # of Investments 910 847 769 601
Portfolio AnalysisComposition as of 03-31-18 % Assets
U.S. Stocks 93.7Non-U.S. Stocks 5.3Bonds 0.0Cash 0.7Other 0.4
Morningstar Equity Style Box™ as of 03-31-18 % Mkt Cap
LargeM
idSm
all
Value Blend Growth
Giant 21.08........................................................Large 45.67Medium 24.08Small 8.07........................................................Micro 1.09
Top 20 Holdings as of 03-31-18 % Assets
UnitedHealth Group Inc 7.02Becton, Dickinson and Co 4.77Intuitive Surgical Inc 4.59Vertex Pharmaceuticals Inc 3.64Sage Therapeutics Inc 2.64.......................................................................................................Stryker Corp 2.62Anthem Inc 2.56Thermo Fisher Scientific Inc 2.34Agilent Technologies Inc 2.31Cigna Corp 2.15.......................................................................................................Biogen Inc 1.87Alnylam Pharmaceuticals Inc 1.85Centene Corp 1.84Alexion Pharmaceuticals Inc 1.81Danaher Corp 1.79.......................................................................................................Neurocrine Biosciences Inc 1.79Incyte Corp 1.70Gilead Sciences Inc 1.60Humana Inc 1.58Nektar Therapeutics Inc 1.49
.......................................................................................................Total Number of Stock Holdings 114Total Number of Bond Holdings 0Annual Turnover Ratio % 42.80Total Fund Assets ($mil) 724.53
Statistics Port Avg Rel S&P 500 Rel Cat
P/E Ratio 18.20 1.06 1.06P/B Ratio 3.74 1.28 1.07P/C Ratio 12.02 0.94 0.98GeoAvgCap ($mil) 24960.91 0.25 0.62
Risk Measures as of 06-30-18 Port Avg Rel S&P 500 Rel Cat3 Yr Std Dev 15.71 1.55 1.023 Yr Beta 1.06 . 0.993 Yr Sharpe Ratio 0.30 0.28 5.003 Yr Alpha -3.46 . 0.473 Yr R-squared 51.69 . 0.93
Morningstar Sectors as of 03-31-18 % Fund
h Cyclical 0.00...............................................................................................r Basic Materials 0.00t Consumer Cyclical 0.00y Financial Services 0.00u Real Estate 0.00
j Sensitive 1.04...............................................................................................i Communication Services 0.00o Energy 0.00p Industrials 0.00a Technology 1.04
k Defensive 98.96...............................................................................................s Consumer Defensive 0.00d Healthcare 98.96f Utilities 0.00
©2018 Morningstar, Inc., Morningstar Investment Profiles™ 312-696-6000. All rights reserved. The information contained herein: (1) is proprietary toMorningstar and/or its content providers; (2) may not be copied or distributed and (3) is not warranted to be accurate, complete or timely. Neither Morningstarnor its content providers are responsible for any damages or losses arising from any use of information. Past performance is no guarantee of futureperformance. Visit our investment website at www.morningstar.com.
ß®
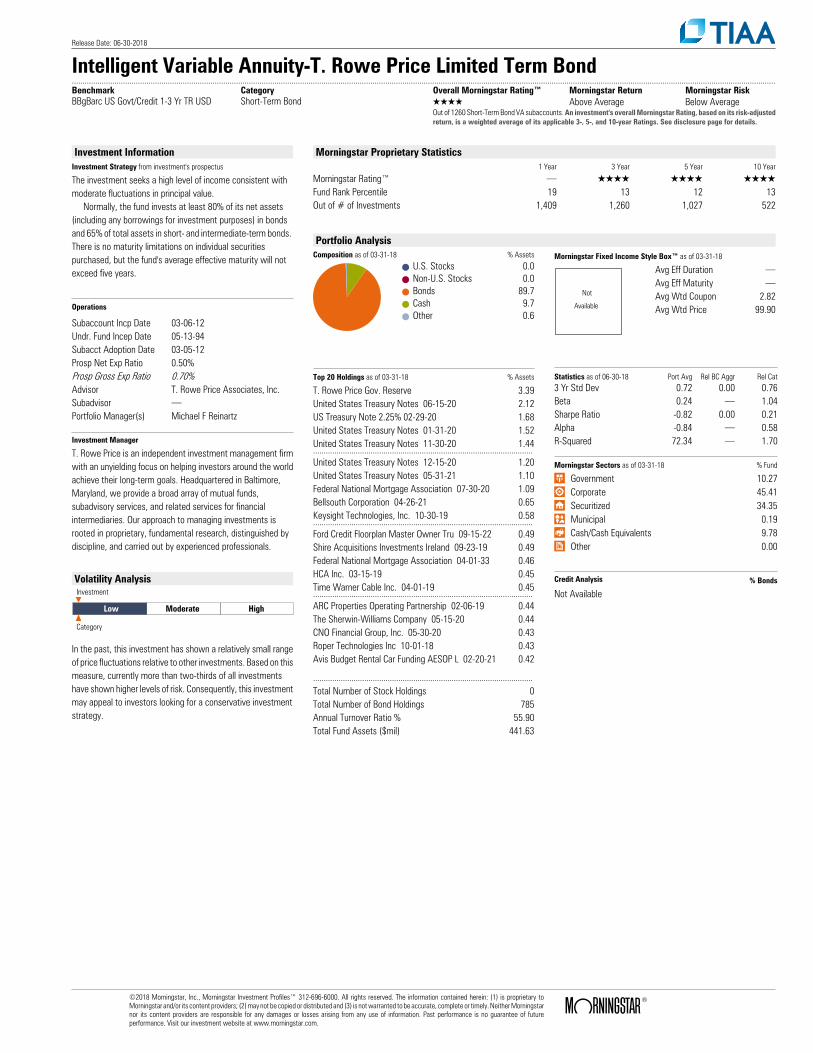
Release Date: 06-30-2018
Intelligent Variable Annuity-T. Rowe Price Limited Term Bond..........................................................................................................................................................................................................................................................................................................................................Benchmark Category Overall Morningstar Rating™ Morningstar Return Morningstar RiskBBgBarc US Govt/Credit 1-3 Yr TR USD Short-Term Bond QQQQ Above Average Below Average
Out of 1260 Short-Term Bond VA subaccounts. An investment's overall Morningstar Rating, based on its risk-adjustedreturn, is a weighted average of its applicable 3-, 5-, and 10-year Ratings. See disclosure page for details.
Investment InformationInvestment Strategy from investment's prospectus
The investment seeks a high level of income consistent with moderate fluctuations in principal value. Normally, the fund invests at least 80% of its net assets (including any borrowings for investment purposes) in bonds and 65% of total assets in short- and intermediate-term bonds. There is no maturity limitations on individual securities purchased, but the fund's average effective maturity will not exceed five years.
Operations
Subaccount Incp Date 03-06-12Undr. Fund Incep Date 05-13-94Subacct Adoption Date 03-05-12Prosp Net Exp Ratio 0.50%Prosp Gross Exp Ratio 0.70%Advisor T. Rowe Price Associates, Inc.Subadvisor .Portfolio Manager(s) Michael F Reinartz
Investment Manager
T. Rowe Price is an independent investment management firmwith an unyielding focus on helping investors around the worldachieve their long-term goals. Headquartered in Baltimore,Maryland, we provide a broad array of mutual funds,subadvisory services, and related services for financialintermediaries. Our approach to managing investments isrooted in proprietary, fundamental research, distinguished bydiscipline, and carried out by experienced professionals.
Volatility Analysis
Low Moderate High
Investment
Category
In the past, this investment has shown a relatively small rangeof price fluctuations relative to other investments. Based on thismeasure, currently more than two-thirds of all investmentshave shown higher levels of risk. Consequently, this investmentmay appeal to investors looking for a conservative investmentstrategy.
Morningstar Proprietary Statistics1 Year 3 Year 5 Year 10 Year
Morningstar Rating™ . QQQQ QQQQ QQQQFund Rank Percentile 19 13 12 13Out of # of Investments 1,409 1,260 1,027 522
Portfolio AnalysisComposition as of 03-31-18 % Assets
U.S. Stocks 0.0Non-U.S. Stocks 0.0Bonds 89.7Cash 9.7Other 0.6
Morningstar Fixed Income Style Box™ as of 03-31-18
Not
Available
Avg Eff Duration .Avg Eff Maturity .Avg Wtd Coupon 2.82Avg Wtd Price 99.90
Top 20 Holdings as of 03-31-18 % Assets
T. Rowe Price Gov. Reserve 3.39United States Treasury Notes 06-15-20 2.12US Treasury Note 2.25% 02-29-20 1.68United States Treasury Notes 01-31-20 1.52United States Treasury Notes 11-30-20 1.44.......................................................................................................United States Treasury Notes 12-15-20 1.20United States Treasury Notes 05-31-21 1.10Federal National Mortgage Association 07-30-20 1.09Bellsouth Corporation 04-26-21 0.65Keysight Technologies, Inc. 10-30-19 0.58.......................................................................................................Ford Credit Floorplan Master Owner Tru 09-15-22 0.49Shire Acquisitions Investments Ireland 09-23-19 0.49Federal National Mortgage Association 04-01-33 0.46HCA Inc. 03-15-19 0.45Time Warner Cable Inc. 04-01-19 0.45.......................................................................................................ARC Properties Operating Partnership 02-06-19 0.44The Sherwin-Williams Company 05-15-20 0.44CNO Financial Group, Inc. 05-30-20 0.43Roper Technologies Inc 10-01-18 0.43Avis Budget Rental Car Funding AESOP L 02-20-21 0.42
.......................................................................................................Total Number of Stock Holdings 0Total Number of Bond Holdings 785Annual Turnover Ratio % 55.90Total Fund Assets ($mil) 441.63
Statistics as of 06-30-18 Port Avg Rel BC Aggr Rel Cat3 Yr Std Dev 0.72 0.00 0.76Beta 0.24 . 1.04Sharpe Ratio -0.82 0.00 0.21Alpha -0.84 . 0.58R-Squared 72.34 . 1.70
Morningstar Sectors as of 03-31-18 % Fund
⁄ Government 10.27› Corporate 45.41€ Securitized 34.35‹ Municipal 0.19fi Cash/Cash Equivalents 9.78± Other 0.00
Credit Analysis % Bonds
Not Available
©2018 Morningstar, Inc., Morningstar Investment Profiles™ 312-696-6000. All rights reserved. The information contained herein: (1) is proprietary toMorningstar and/or its content providers; (2) may not be copied or distributed and (3) is not warranted to be accurate, complete or timely. Neither Morningstarnor its content providers are responsible for any damages or losses arising from any use of information. Past performance is no guarantee of futureperformance. Visit our investment website at www.morningstar.com.
ß®
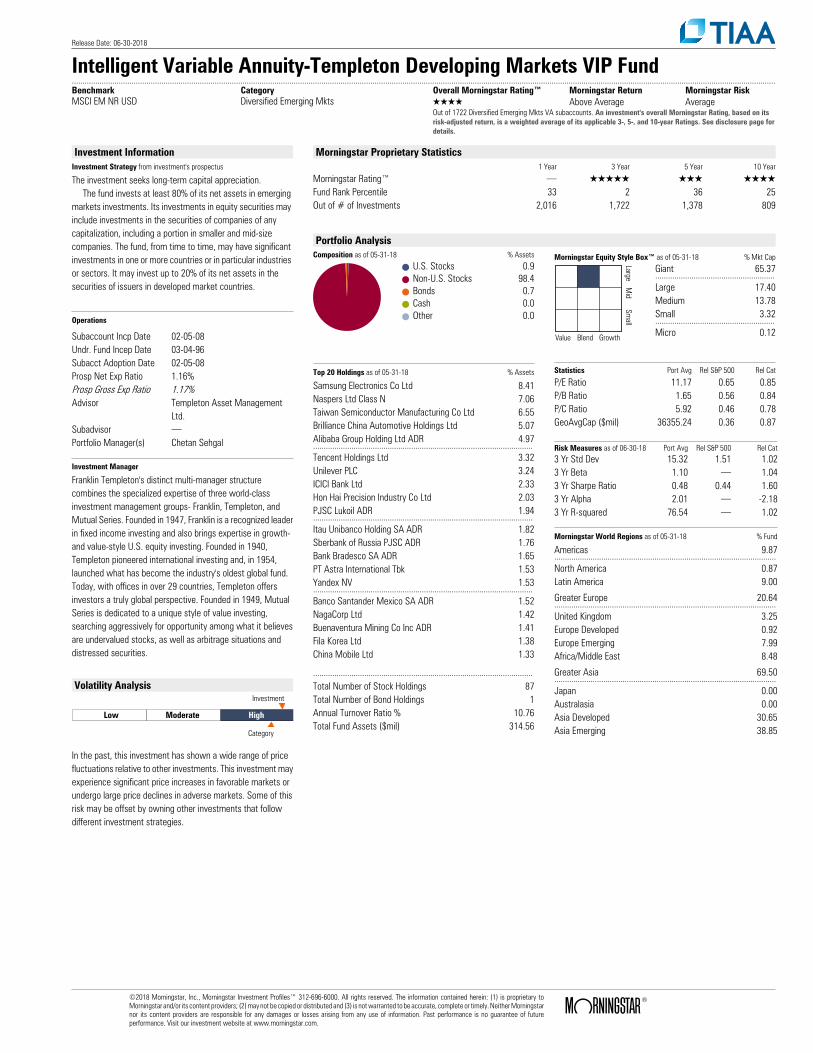
Release Date: 06-30-2018
Intelligent Variable Annuity-Templeton Developing Markets VIP Fund..........................................................................................................................................................................................................................................................................................................................................Benchmark Category Overall Morningstar Rating™ Morningstar Return Morningstar RiskMSCI EM NR USD Diversified Emerging Mkts QQQQ Above Average Average
Out of 1722 Diversified Emerging Mkts VA subaccounts. An investment's overall Morningstar Rating, based on itsrisk-adjusted return, is a weighted average of its applicable 3-, 5-, and 10-year Ratings. See disclosure page fordetails.
Investment InformationInvestment Strategy from investment's prospectus
The investment seeks long-term capital appreciation. The fund invests at least 80% of its net assets in emerging markets investments. Its investments in equity securities may include investments in the securities of companies of any capitalization, including a portion in smaller and mid-size companies. The fund, from time to time, may have significant investments in one or more countries or in particular industries or sectors. It may invest up to 20% of its net assets in the securities of issuers in developed market countries.
Operations
Subaccount Incp Date 02-05-08Undr. Fund Incep Date 03-04-96Subacct Adoption Date 02-05-08Prosp Net Exp Ratio 1.16%Prosp Gross Exp Ratio 1.17%Advisor Templeton Asset Management
Ltd.Subadvisor .Portfolio Manager(s) Chetan Sehgal
Investment Manager
Franklin Templeton's distinct multi-manager structurecombines the specialized expertise of three world-classinvestment management groups- Franklin, Templeton, andMutual Series. Founded in 1947, Franklin is a recognized leaderin fixed income investing and also brings expertise in growth-and value-style U.S. equity investing. Founded in 1940,Templeton pioneered international investing and, in 1954,launched what has become the industry's oldest global fund.Today, with offices in over 29 countries, Templeton offersinvestors a truly global perspective. Founded in 1949, MutualSeries is dedicated to a unique style of value investing,searching aggressively for opportunity among what it believesare undervalued stocks, as well as arbitrage situations anddistressed securities.
Volatility Analysis
Low Moderate High
Investment
Category
In the past, this investment has shown a wide range of pricefluctuations relative to other investments. This investment mayexperience significant price increases in favorable markets orundergo large price declines in adverse markets. Some of thisrisk may be offset by owning other investments that followdifferent investment strategies.
Morningstar Proprietary Statistics1 Year 3 Year 5 Year 10 Year
Morningstar Rating™ . QQQQQ QQQ QQQQFund Rank Percentile 33 2 36 25Out of # of Investments 2,016 1,722 1,378 809
Portfolio AnalysisComposition as of 05-31-18 % Assets
U.S. Stocks 0.9Non-U.S. Stocks 98.4Bonds 0.7Cash 0.0Other 0.0
Morningstar Equity Style Box™ as of 05-31-18 % Mkt Cap
LargeM
idSm
all
Value Blend Growth
Giant 65.37........................................................Large 17.40Medium 13.78Small 3.32........................................................Micro 0.12
Top 20 Holdings as of 05-31-18 % Assets
Samsung Electronics Co Ltd 8.41Naspers Ltd Class N 7.06Taiwan Semiconductor Manufacturing Co Ltd 6.55Brilliance China Automotive Holdings Ltd 5.07Alibaba Group Holding Ltd ADR 4.97.......................................................................................................Tencent Holdings Ltd 3.32Unilever PLC 3.24ICICI Bank Ltd 2.33Hon Hai Precision Industry Co Ltd 2.03PJSC Lukoil ADR 1.94.......................................................................................................Itau Unibanco Holding SA ADR 1.82Sberbank of Russia PJSC ADR 1.76Bank Bradesco SA ADR 1.65PT Astra International Tbk 1.53Yandex NV 1.53.......................................................................................................Banco Santander Mexico SA ADR 1.52NagaCorp Ltd 1.42Buenaventura Mining Co Inc ADR 1.41Fila Korea Ltd 1.38China Mobile Ltd 1.33
.......................................................................................................Total Number of Stock Holdings 87Total Number of Bond Holdings 1Annual Turnover Ratio % 10.76Total Fund Assets ($mil) 314.56
Statistics Port Avg Rel S&P 500 Rel Cat
P/E Ratio 11.17 0.65 0.85P/B Ratio 1.65 0.56 0.84P/C Ratio 5.92 0.46 0.78GeoAvgCap ($mil) 36355.24 0.36 0.87
Risk Measures as of 06-30-18 Port Avg Rel S&P 500 Rel Cat3 Yr Std Dev 15.32 1.51 1.023 Yr Beta 1.10 . 1.043 Yr Sharpe Ratio 0.48 0.44 1.603 Yr Alpha 2.01 . -2.183 Yr R-squared 76.54 . 1.02
Morningstar World Regions as of 05-31-18 % Fund
Americas 9.87........................................................................................................North America 0.87Latin America 9.00
Greater Europe 20.64........................................................................................................United Kingdom 3.25Europe Developed 0.92Europe Emerging 7.99Africa/Middle East 8.48
Greater Asia 69.50........................................................................................................Japan 0.00Australasia 0.00Asia Developed 30.65Asia Emerging 38.85
©2018 Morningstar, Inc., Morningstar Investment Profiles™ 312-696-6000. All rights reserved. The information contained herein: (1) is proprietary toMorningstar and/or its content providers; (2) may not be copied or distributed and (3) is not warranted to be accurate, complete or timely. Neither Morningstarnor its content providers are responsible for any damages or losses arising from any use of information. Past performance is no guarantee of futureperformance. Visit our investment website at www.morningstar.com.
ß®
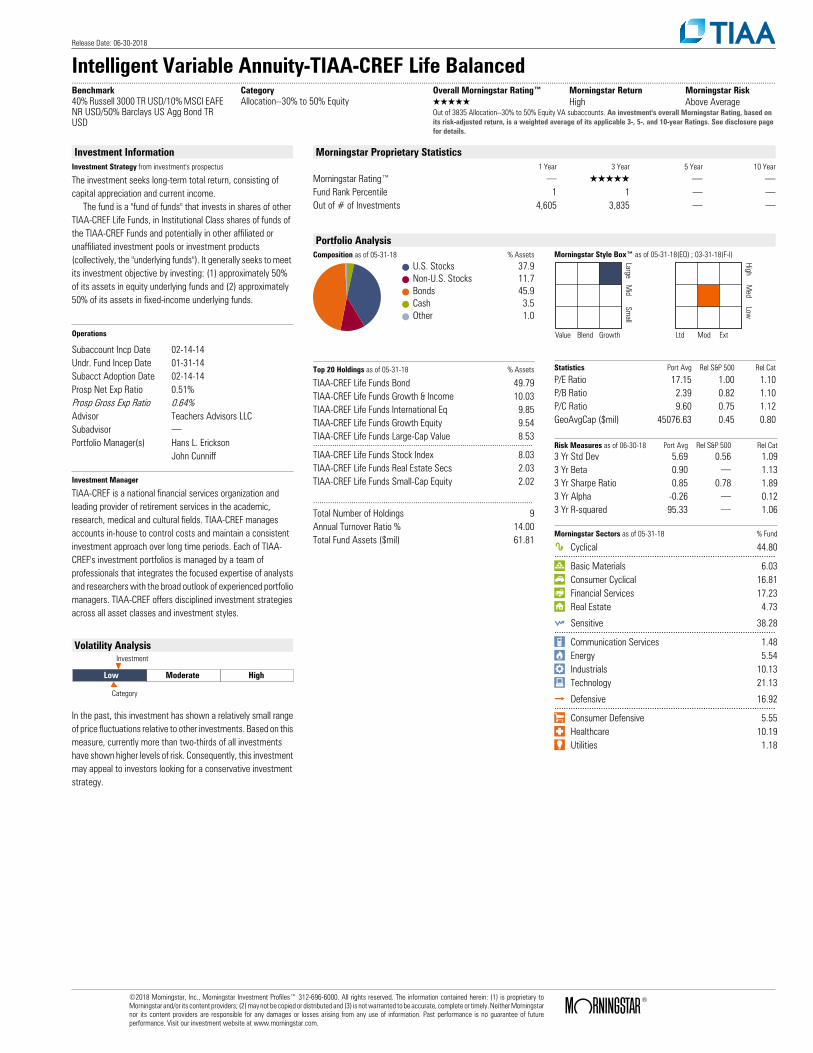
Release Date: 06-30-2018
Intelligent Variable Annuity-TIAA-CREF Life Balanced..........................................................................................................................................................................................................................................................................................................................................Benchmark Category Overall Morningstar Rating™ Morningstar Return Morningstar Risk40% Russell 3000 TR USD/10% MSCI EAFENR USD/50% Barclays US Agg Bond TRUSD
Allocation--30% to 50% Equity QQQQQ High Above AverageOut of 3835 Allocation--30% to 50% Equity VA subaccounts. An investment's overall Morningstar Rating, based onits risk-adjusted return, is a weighted average of its applicable 3-, 5-, and 10-year Ratings. See disclosure pagefor details.
Investment InformationInvestment Strategy from investment's prospectus
The investment seeks long-term total return, consisting of capital appreciation and current income. The fund is a "fund of funds" that invests in shares of other TIAA-CREF Life Funds, in Institutional Class shares of funds of the TIAA-CREF Funds and potentially in other affiliated or unaffiliated investment pools or investment products (collectively, the "underlying funds"). It generally seeks to meet its investment objective by investing: (1) approximately 50% of its assets in equity underlying funds and (2) approximately 50% of its assets in fixed-income underlying funds.
Operations
Subaccount Incp Date 02-14-14Undr. Fund Incep Date 01-31-14Subacct Adoption Date 02-14-14Prosp Net Exp Ratio 0.51%Prosp Gross Exp Ratio 0.64%Advisor Teachers Advisors LLCSubadvisor .Portfolio Manager(s) Hans L. Erickson
John Cunniff
Investment Manager
TIAA-CREF is a national financial services organization andleading provider of retirement services in the academic,research, medical and cultural fields. TIAA-CREF managesaccounts in-house to control costs and maintain a consistentinvestment approach over long time periods. Each of TIAA-CREF's investment portfolios is managed by a team ofprofessionals that integrates the focused expertise of analystsand researchers with the broad outlook of experienced portfoliomanagers. TIAA-CREF offers disciplined investment strategiesacross all asset classes and investment styles.
Volatility Analysis
Low Moderate High
Investment
Category
In the past, this investment has shown a relatively small rangeof price fluctuations relative to other investments. Based on thismeasure, currently more than two-thirds of all investmentshave shown higher levels of risk. Consequently, this investmentmay appeal to investors looking for a conservative investmentstrategy.
Morningstar Proprietary Statistics1 Year 3 Year 5 Year 10 Year
Morningstar Rating™ . QQQQQ . .Fund Rank Percentile 1 1 . .Out of # of Investments 4,605 3,835 . .
Portfolio AnalysisComposition as of 05-31-18 % Assets
U.S. Stocks 37.9Non-U.S. Stocks 11.7Bonds 45.9Cash 3.5Other 1.0
Morningstar Style Box™ as of 05-31-18(EQ) ; 03-31-18(F-I)
LargeM
idSm
all
Value Blend Growth
HighM
edLow
Ltd Mod Ext
Top 20 Holdings as of 05-31-18 % Assets
TIAA-CREF Life Funds Bond 49.79TIAA-CREF Life Funds Growth & Income 10.03TIAA-CREF Life Funds International Eq 9.85TIAA-CREF Life Funds Growth Equity 9.54TIAA-CREF Life Funds Large-Cap Value 8.53.......................................................................................................TIAA-CREF Life Funds Stock Index 8.03TIAA-CREF Life Funds Real Estate Secs 2.03TIAA-CREF Life Funds Small-Cap Equity 2.02
.......................................................................................................Total Number of Holdings 9Annual Turnover Ratio % 14.00Total Fund Assets ($mil) 61.81
Statistics Port Avg Rel S&P 500 Rel Cat
P/E Ratio 17.15 1.00 1.10P/B Ratio 2.39 0.82 1.10P/C Ratio 9.60 0.75 1.12GeoAvgCap ($mil) 45076.63 0.45 0.80
Risk Measures as of 06-30-18 Port Avg Rel S&P 500 Rel Cat3 Yr Std Dev 5.69 0.56 1.093 Yr Beta 0.90 . 1.133 Yr Sharpe Ratio 0.85 0.78 1.893 Yr Alpha -0.26 . 0.123 Yr R-squared 95.33 . 1.06
Morningstar Sectors as of 05-31-18 % Fund
h Cyclical 44.80...............................................................................................r Basic Materials 6.03t Consumer Cyclical 16.81y Financial Services 17.23u Real Estate 4.73
j Sensitive 38.28...............................................................................................i Communication Services 1.48o Energy 5.54p Industrials 10.13a Technology 21.13
k Defensive 16.92...............................................................................................s Consumer Defensive 5.55d Healthcare 10.19f Utilities 1.18
©2018 Morningstar, Inc., Morningstar Investment Profiles™ 312-696-6000. All rights reserved. The information contained herein: (1) is proprietary toMorningstar and/or its content providers; (2) may not be copied or distributed and (3) is not warranted to be accurate, complete or timely. Neither Morningstarnor its content providers are responsible for any damages or losses arising from any use of information. Past performance is no guarantee of futureperformance. Visit our investment website at www.morningstar.com.
ß®
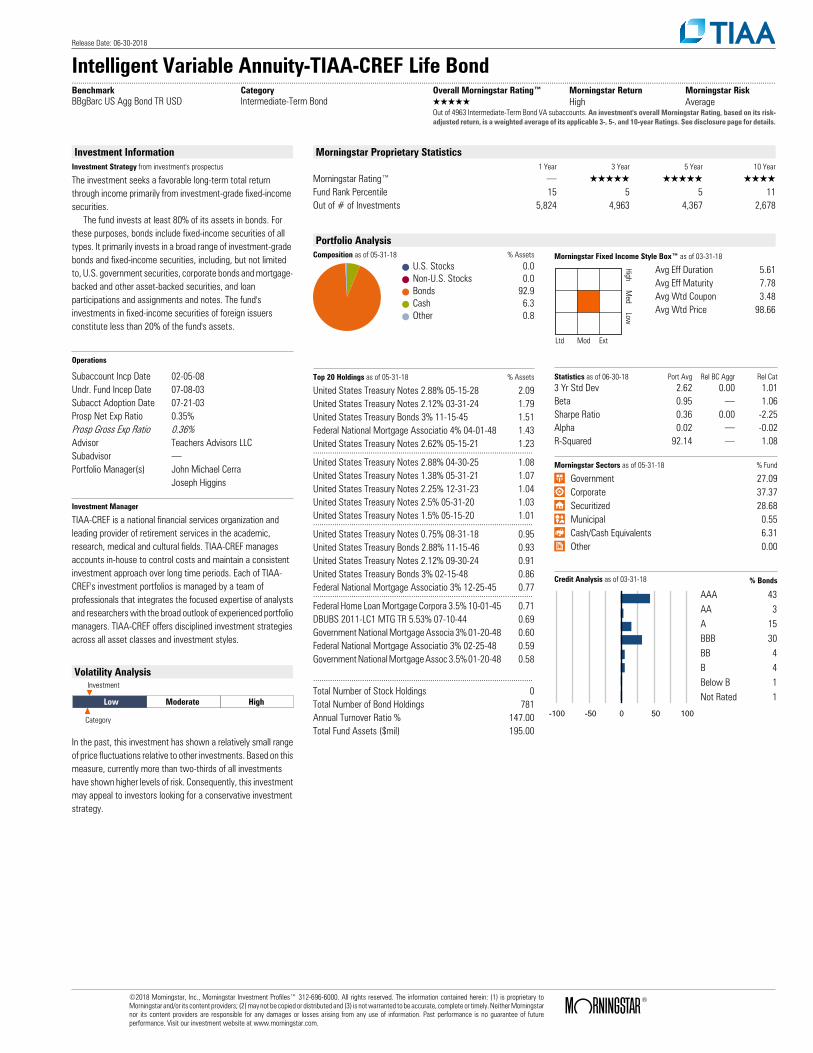
Release Date: 06-30-2018
Intelligent Variable Annuity-TIAA-CREF Life Bond..........................................................................................................................................................................................................................................................................................................................................Benchmark Category Overall Morningstar Rating™ Morningstar Return Morningstar RiskBBgBarc US Agg Bond TR USD Intermediate-Term Bond QQQQQ High Average
Out of 4963 Intermediate-Term Bond VA subaccounts. An investment's overall Morningstar Rating, based on its risk-adjusted return, is a weighted average of its applicable 3-, 5-, and 10-year Ratings. See disclosure page for details.
Investment InformationInvestment Strategy from investment's prospectus
The investment seeks a favorable long-term total return through income primarily from investment-grade fixed-income securities. The fund invests at least 80% of its assets in bonds. For these purposes, bonds include fixed-income securities of all types. It primarily invests in a broad range of investment-grade bonds and fixed-income securities, including, but not limited to, U.S. government securities, corporate bonds and mortgage-backed and other asset-backed securities, and loan participations and assignments and notes. The fund's investments in fixed-income securities of foreign issuers constitute less than 20% of the fund's assets.
Operations
Subaccount Incp Date 02-05-08Undr. Fund Incep Date 07-08-03Subacct Adoption Date 07-21-03Prosp Net Exp Ratio 0.35%Prosp Gross Exp Ratio 0.36%Advisor Teachers Advisors LLCSubadvisor .Portfolio Manager(s) John Michael Cerra
Joseph Higgins
Investment Manager
TIAA-CREF is a national financial services organization andleading provider of retirement services in the academic,research, medical and cultural fields. TIAA-CREF managesaccounts in-house to control costs and maintain a consistentinvestment approach over long time periods. Each of TIAA-CREF's investment portfolios is managed by a team ofprofessionals that integrates the focused expertise of analystsand researchers with the broad outlook of experienced portfoliomanagers. TIAA-CREF offers disciplined investment strategiesacross all asset classes and investment styles.
Volatility Analysis
Low Moderate High
Investment
Category
In the past, this investment has shown a relatively small rangeof price fluctuations relative to other investments. Based on thismeasure, currently more than two-thirds of all investmentshave shown higher levels of risk. Consequently, this investmentmay appeal to investors looking for a conservative investmentstrategy.
Morningstar Proprietary Statistics1 Year 3 Year 5 Year 10 Year
Morningstar Rating™ . QQQQQ QQQQQ QQQQFund Rank Percentile 15 5 5 11Out of # of Investments 5,824 4,963 4,367 2,678
Portfolio AnalysisComposition as of 05-31-18 % Assets
U.S. Stocks 0.0Non-U.S. Stocks 0.0Bonds 92.9Cash 6.3Other 0.8
Morningstar Fixed Income Style Box™ as of 03-31-18
HighM
edLow
Ltd Mod Ext
Avg Eff Duration 5.61Avg Eff Maturity 7.78Avg Wtd Coupon 3.48Avg Wtd Price 98.66
Top 20 Holdings as of 05-31-18 % Assets
United States Treasury Notes 2.88% 05-15-28 2.09United States Treasury Notes 2.12% 03-31-24 1.79United States Treasury Bonds 3% 11-15-45 1.51Federal National Mortgage Associatio 4% 04-01-48 1.43United States Treasury Notes 2.62% 05-15-21 1.23.......................................................................................................United States Treasury Notes 2.88% 04-30-25 1.08United States Treasury Notes 1.38% 05-31-21 1.07United States Treasury Notes 2.25% 12-31-23 1.04United States Treasury Notes 2.5% 05-31-20 1.03United States Treasury Notes 1.5% 05-15-20 1.01.......................................................................................................United States Treasury Notes 0.75% 08-31-18 0.95United States Treasury Bonds 2.88% 11-15-46 0.93United States Treasury Notes 2.12% 09-30-24 0.91United States Treasury Bonds 3% 02-15-48 0.86Federal National Mortgage Associatio 3% 12-25-45 0.77.......................................................................................................Federal Home Loan Mortgage Corpora 3.5% 10-01-45 0.71DBUBS 2011-LC1 MTG TR 5.53% 07-10-44 0.69Government National Mortgage Associa 3% 01-20-48 0.60Federal National Mortgage Associatio 3% 02-25-48 0.59Government National Mortgage Assoc 3.5% 01-20-48 0.58
.......................................................................................................Total Number of Stock Holdings 0Total Number of Bond Holdings 781Annual Turnover Ratio % 147.00Total Fund Assets ($mil) 195.00
Statistics as of 06-30-18 Port Avg Rel BC Aggr Rel Cat3 Yr Std Dev 2.62 0.00 1.01Beta 0.95 . 1.06Sharpe Ratio 0.36 0.00 -2.25Alpha 0.02 . -0.02R-Squared 92.14 . 1.08
Morningstar Sectors as of 05-31-18 % Fund
⁄ Government 27.09› Corporate 37.37€ Securitized 28.68‹ Municipal 0.55fi Cash/Cash Equivalents 6.31± Other 0.00
Credit Analysis as of 03-31-18 % Bonds
-100 -50 0 50 100
AAA 43AA 3A 15BBB 30BB 4B 4Below B 1Not Rated 1
©2018 Morningstar, Inc., Morningstar Investment Profiles™ 312-696-6000. All rights reserved. The information contained herein: (1) is proprietary toMorningstar and/or its content providers; (2) may not be copied or distributed and (3) is not warranted to be accurate, complete or timely. Neither Morningstarnor its content providers are responsible for any damages or losses arising from any use of information. Past performance is no guarantee of futureperformance. Visit our investment website at www.morningstar.com.
ß®

Release Date: 06-30-2018
Intelligent Variable Annuity-TIAA-CREF Life Growth & Income..........................................................................................................................................................................................................................................................................................................................................Benchmark Category Overall Morningstar Rating™ Morningstar Return Morningstar RiskS&P 500 TR Large Growth QQQQ Above Average Below Average
Out of 10232 Large Growth VA subaccounts. An investment's overall Morningstar Rating, based on its risk-adjustedreturn, is a weighted average of its applicable 3-, 5-, and 10-year Ratings. See disclosure page for details.
Investment InformationInvestment Strategy from investment's prospectus
The investment seeks a favorable long-term total return, through both capital appreciation and investment income, primarily from income-producing equity securities. Under normal circumstances, the fund invests at least 80% of its assets in equity securities. In seeking a favorable long-term total return, it will invest in securities which the fund's investment adviser, Teachers Advisors, LLC ("Advisors"), believes have the potential for capital appreciation, dividend income, or both. It may invest up to 20% of its assets in foreign issuers when Advisors believes these issuers offer more attractive investment opportunities.
Operations
Subaccount Incp Date 02-05-08Undr. Fund Incep Date 04-03-00Subacct Adoption Date 04-03-00Prosp Net Exp Ratio 0.52%Prosp Gross Exp Ratio 0.58%Advisor Teachers Advisors LLCSubadvisor .Portfolio Manager(s) Susan Kempler
Investment Manager
TIAA-CREF is a national financial services organization andleading provider of retirement services in the academic,research, medical and cultural fields. TIAA-CREF managesaccounts in-house to control costs and maintain a consistentinvestment approach over long time periods. Each of TIAA-CREF's investment portfolios is managed by a team ofprofessionals that integrates the focused expertise of analystsand researchers with the broad outlook of experienced portfoliomanagers. TIAA-CREF offers disciplined investment strategiesacross all asset classes and investment styles.
Volatility Analysis
Low Moderate High
Investment
Category
In the past, this investment has shown a relatively moderaterange of price fluctuations relative to other investments. Thisinvestment may experience larger or smaller price declines orprice increases depending on market conditions. Some of thisrisk may be offset by owning other investments with differentportfolio makeups or investment strategies.
Morningstar Proprietary Statistics1 Year 3 Year 5 Year 10 Year
Morningstar Rating™ . QQQ QQQ QQQQFund Rank Percentile 69 62 63 24Out of # of Investments 11,300 10,232 9,289 6,019
Portfolio AnalysisComposition as of 05-31-18 % Assets
U.S. Stocks 92.5Non-U.S. Stocks 7.0Bonds 0.0Cash 0.5Other 0.0
Morningstar Equity Style Box™ as of 05-31-18 % Mkt Cap
LargeM
idSm
all
Value Blend Growth
Giant 49.75........................................................Large 30.39Medium 18.78Small 1.08........................................................Micro 0.00
Top 20 Holdings as of 05-31-18 % Assets
Apple Inc 3.79Microsoft Corp 3.59Amazon.com Inc 3.07Alphabet Inc C 2.54JPMorgan Chase & Co 2.14.......................................................................................................Bank of America Corporation 1.84Facebook Inc A 1.69Intel Corp 1.53The Home Depot Inc 1.52Chevron Corp 1.50.......................................................................................................Cisco Systems Inc 1.34Mastercard Inc A 1.24Netflix Inc 1.18Citigroup Inc 1.17DowDuPont Inc 1.17.......................................................................................................Honeywell International Inc 1.16NVIDIA Corp 1.12Salesforce.com Inc 1.09EOG Resources Inc 0.99Caterpillar Inc 0.94
.......................................................................................................Total Number of Stock Holdings 189Total Number of Bond Holdings 0Annual Turnover Ratio % 70.00Total Fund Assets ($mil) 148.14
Statistics Port Avg Rel S&P 500 Rel Cat
P/E Ratio 18.43 1.08 0.82P/B Ratio 3.02 1.03 0.67P/C Ratio 14.85 1.16 0.95GeoAvgCap ($mil) 70219.52 0.70 0.74
Risk Measures as of 06-30-18 Port Avg Rel S&P 500 Rel Cat3 Yr Std Dev 10.78 1.06 0.893 Yr Beta 1.04 . 0.973 Yr Sharpe Ratio 0.94 0.86 1.033 Yr Alpha -1.36 . 1.683 Yr R-squared 96.34 . 1.17
Morningstar Sectors as of 05-31-18 % Fund
h Cyclical 31.03...............................................................................................r Basic Materials 3.66t Consumer Cyclical 13.45y Financial Services 13.79u Real Estate 0.13
j Sensitive 44.15...............................................................................................i Communication Services 0.74o Energy 6.85p Industrials 10.09a Technology 26.47
k Defensive 24.83...............................................................................................s Consumer Defensive 8.76d Healthcare 14.60f Utilities 1.47
©2018 Morningstar, Inc., Morningstar Investment Profiles™ 312-696-6000. All rights reserved. The information contained herein: (1) is proprietary toMorningstar and/or its content providers; (2) may not be copied or distributed and (3) is not warranted to be accurate, complete or timely. Neither Morningstarnor its content providers are responsible for any damages or losses arising from any use of information. Past performance is no guarantee of futureperformance. Visit our investment website at www.morningstar.com.
ß®

Release Date: 06-30-2018
Intelligent Variable Annuity-TIAA-CREF Life Growth Equity..........................................................................................................................................................................................................................................................................................................................................Benchmark Category Overall Morningstar Rating™ Morningstar Return Morningstar RiskRussell 1000 Growth TR USD Large Growth QQQQ Above Average Above Average
Out of 10232 Large Growth VA subaccounts. An investment's overall Morningstar Rating, based on its risk-adjustedreturn, is a weighted average of its applicable 3-, 5-, and 10-year Ratings. See disclosure page for details.
Investment InformationInvestment Strategy from investment's prospectus
The investment seeks a favorable long-term return, mainly through capital appreciation, primarily from equity securities. Under normal circumstances, the fund invests at least 80% of its assets in equity securities. It invests primarily in equity securities that Teachers Advisors, LLC ("Advisors") believes present the opportunity for growth. Generally, these equity securities will be those of large capitalization companies in new and emerging areas of the economy and companies with distinctive products or promising markets. The fund may invest up to 20% of its assets in foreign investments.
Operations
Subaccount Incp Date 02-05-08Undr. Fund Incep Date 04-03-00Subacct Adoption Date 04-03-00Prosp Net Exp Ratio 0.52%Prosp Gross Exp Ratio 0.59%Advisor Teachers Advisors LLCSubadvisor .Portfolio Manager(s) Susan Hirsch
Terrence Kontos
Investment Manager
TIAA-CREF is a national financial services organization andleading provider of retirement services in the academic,research, medical and cultural fields. TIAA-CREF managesaccounts in-house to control costs and maintain a consistentinvestment approach over long time periods. Each of TIAA-CREF's investment portfolios is managed by a team ofprofessionals that integrates the focused expertise of analystsand researchers with the broad outlook of experienced portfoliomanagers. TIAA-CREF offers disciplined investment strategiesacross all asset classes and investment styles.
Volatility Analysis
Low Moderate High
Investment
Category
In the past, this investment has shown a wide range of pricefluctuations relative to other investments. This investment mayexperience significant price increases in favorable markets orundergo large price declines in adverse markets. Some of thisrisk may be offset by owning other investments that followdifferent investment strategies.
Morningstar Proprietary Statistics1 Year 3 Year 5 Year 10 Year
Morningstar Rating™ . QQQQ QQQQQ QQQQFund Rank Percentile 13 16 7 12Out of # of Investments 11,300 10,232 9,289 6,019
Portfolio AnalysisComposition as of 05-31-18 % Assets
U.S. Stocks 90.0Non-U.S. Stocks 9.2Bonds 0.0Cash 0.8Other 0.1
Morningstar Equity Style Box™ as of 05-31-18 % Mkt Cap
LargeM
idSm
all
Value Blend Growth
Giant 58.25........................................................Large 35.93Medium 5.82Small 0.00........................................................Micro 0.00
Top 20 Holdings as of 05-31-18 % Assets
Microsoft Corp 5.75Amazon.com Inc 5.37Facebook Inc A 3.26Adobe Systems Inc 3.05Alphabet Inc C 3.05.......................................................................................................Intuit Inc 2.89Mastercard Inc A 2.80Salesforce.com Inc 2.76Visa Inc Class A 2.70Apple Inc 2.49.......................................................................................................Netflix Inc 2.23Intuitive Surgical Inc 2.19Broadcom Inc 2.06Boeing Co 1.97The Home Depot Inc 1.96.......................................................................................................PayPal Holdings Inc 1.92Alphabet Inc A 1.85Starbucks Corp 1.80Alibaba Group Holding Ltd ADR 1.53Marriott International Inc Class A 1.52
.......................................................................................................Total Number of Stock Holdings 76Total Number of Bond Holdings 0Annual Turnover Ratio % 81.00Total Fund Assets ($mil) 110.06
Statistics Port Avg Rel S&P 500 Rel Cat
P/E Ratio 26.04 1.52 1.16P/B Ratio 6.36 2.17 1.42P/C Ratio 18.64 1.46 1.19GeoAvgCap ($mil) 111122.49 1.11 1.18
Risk Measures as of 06-30-18 Port Avg Rel S&P 500 Rel Cat3 Yr Std Dev 12.47 1.23 1.033 Yr Beta 1.09 . 1.023 Yr Sharpe Ratio 1.08 0.99 1.193 Yr Alpha 1.47 . -1.813 Yr R-squared 78.72 . 0.96
Morningstar Sectors as of 05-31-18 % Fund
h Cyclical 33.64...............................................................................................r Basic Materials 2.22t Consumer Cyclical 22.47y Financial Services 8.46u Real Estate 0.49
j Sensitive 52.54...............................................................................................i Communication Services 0.00o Energy 1.68p Industrials 8.77a Technology 42.09
k Defensive 13.82...............................................................................................s Consumer Defensive 2.24d Healthcare 11.58f Utilities 0.00
©2018 Morningstar, Inc., Morningstar Investment Profiles™ 312-696-6000. All rights reserved. The information contained herein: (1) is proprietary toMorningstar and/or its content providers; (2) may not be copied or distributed and (3) is not warranted to be accurate, complete or timely. Neither Morningstarnor its content providers are responsible for any damages or losses arising from any use of information. Past performance is no guarantee of futureperformance. Visit our investment website at www.morningstar.com.
ß®
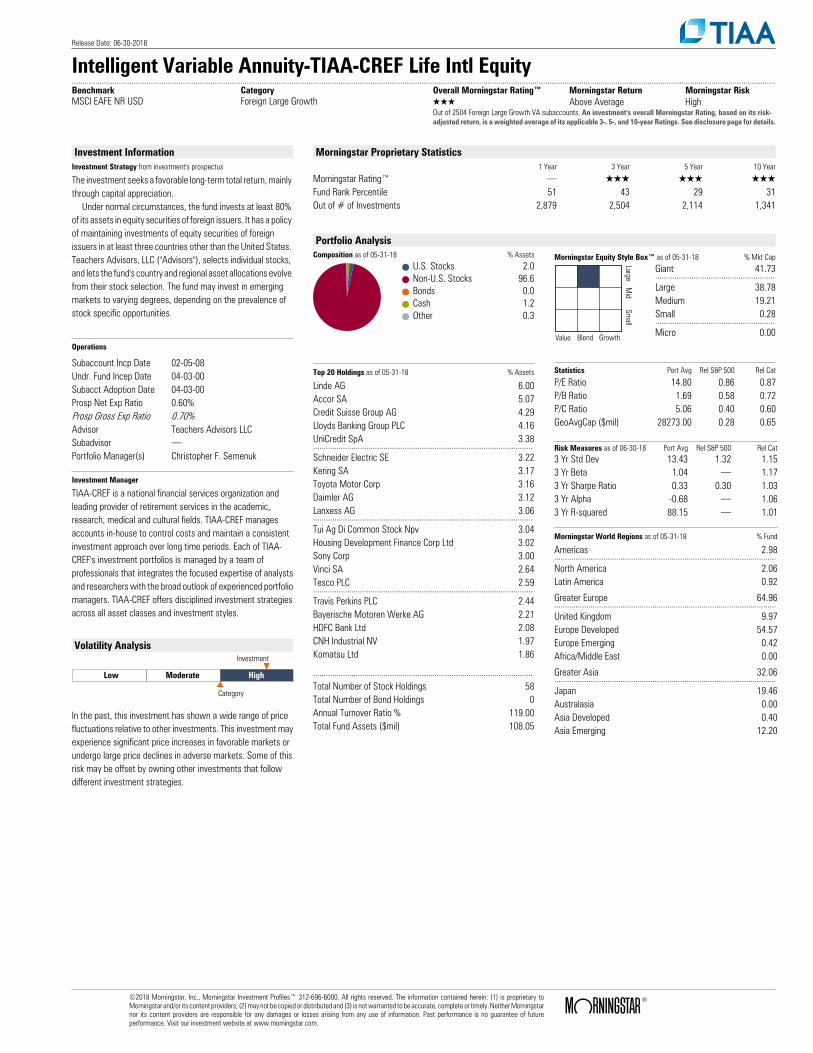
Release Date: 06-30-2018
Intelligent Variable Annuity-TIAA-CREF Life Intl Equity..........................................................................................................................................................................................................................................................................................................................................Benchmark Category Overall Morningstar Rating™ Morningstar Return Morningstar RiskMSCI EAFE NR USD Foreign Large Growth QQQ Above Average High
Out of 2504 Foreign Large Growth VA subaccounts. An investment's overall Morningstar Rating, based on its risk-adjusted return, is a weighted average of its applicable 3-, 5-, and 10-year Ratings. See disclosure page for details.
Investment InformationInvestment Strategy from investment's prospectus
The investment seeks a favorable long-term total return, mainly through capital appreciation. Under normal circumstances, the fund invests at least 80% of its assets in equity securities of foreign issuers. It has a policy of maintaining investments of equity securities of foreign issuers in at least three countries other than the United States. Teachers Advisors, LLC ("Advisors"), selects individual stocks, and lets the fund's country and regional asset allocations evolve from their stock selection. The fund may invest in emerging markets to varying degrees, depending on the prevalence of stock specific opportunities.
Operations
Subaccount Incp Date 02-05-08Undr. Fund Incep Date 04-03-00Subacct Adoption Date 04-03-00Prosp Net Exp Ratio 0.60%Prosp Gross Exp Ratio 0.70%Advisor Teachers Advisors LLCSubadvisor .Portfolio Manager(s) Christopher F. Semenuk
Investment Manager
TIAA-CREF is a national financial services organization andleading provider of retirement services in the academic,research, medical and cultural fields. TIAA-CREF managesaccounts in-house to control costs and maintain a consistentinvestment approach over long time periods. Each of TIAA-CREF's investment portfolios is managed by a team ofprofessionals that integrates the focused expertise of analystsand researchers with the broad outlook of experienced portfoliomanagers. TIAA-CREF offers disciplined investment strategiesacross all asset classes and investment styles.
Volatility Analysis
Low Moderate High
Investment
Category
In the past, this investment has shown a wide range of pricefluctuations relative to other investments. This investment mayexperience significant price increases in favorable markets orundergo large price declines in adverse markets. Some of thisrisk may be offset by owning other investments that followdifferent investment strategies.
Morningstar Proprietary Statistics1 Year 3 Year 5 Year 10 Year
Morningstar Rating™ . QQQ QQQ QQQFund Rank Percentile 51 43 29 31Out of # of Investments 2,879 2,504 2,114 1,341
Portfolio AnalysisComposition as of 05-31-18 % Assets
U.S. Stocks 2.0Non-U.S. Stocks 96.6Bonds 0.0Cash 1.2Other 0.3
Morningstar Equity Style Box™ as of 05-31-18 % Mkt Cap
LargeM
idSm
all
Value Blend Growth
Giant 41.73........................................................Large 38.78Medium 19.21Small 0.28........................................................Micro 0.00
Top 20 Holdings as of 05-31-18 % Assets
Linde AG 6.00Accor SA 5.07Credit Suisse Group AG 4.29Lloyds Banking Group PLC 4.16UniCredit SpA 3.38.......................................................................................................Schneider Electric SE 3.22Kering SA 3.17Toyota Motor Corp 3.16Daimler AG 3.12Lanxess AG 3.06.......................................................................................................Tui Ag Di Common Stock Npv 3.04Housing Development Finance Corp Ltd 3.02Sony Corp 3.00Vinci SA 2.64Tesco PLC 2.59.......................................................................................................Travis Perkins PLC 2.44Bayerische Motoren Werke AG 2.21HDFC Bank Ltd 2.08CNH Industrial NV 1.97Komatsu Ltd 1.86
.......................................................................................................Total Number of Stock Holdings 58Total Number of Bond Holdings 0Annual Turnover Ratio % 119.00Total Fund Assets ($mil) 108.05
Statistics Port Avg Rel S&P 500 Rel Cat
P/E Ratio 14.80 0.86 0.87P/B Ratio 1.69 0.58 0.72P/C Ratio 5.06 0.40 0.60GeoAvgCap ($mil) 28273.00 0.28 0.65
Risk Measures as of 06-30-18 Port Avg Rel S&P 500 Rel Cat3 Yr Std Dev 13.43 1.32 1.153 Yr Beta 1.04 . 1.173 Yr Sharpe Ratio 0.33 0.30 1.033 Yr Alpha -0.68 . 1.063 Yr R-squared 88.15 . 1.01
Morningstar World Regions as of 05-31-18 % Fund
Americas 2.98........................................................................................................North America 2.06Latin America 0.92
Greater Europe 64.96........................................................................................................United Kingdom 9.97Europe Developed 54.57Europe Emerging 0.42Africa/Middle East 0.00
Greater Asia 32.06........................................................................................................Japan 19.46Australasia 0.00Asia Developed 0.40Asia Emerging 12.20
©2018 Morningstar, Inc., Morningstar Investment Profiles™ 312-696-6000. All rights reserved. The information contained herein: (1) is proprietary toMorningstar and/or its content providers; (2) may not be copied or distributed and (3) is not warranted to be accurate, complete or timely. Neither Morningstarnor its content providers are responsible for any damages or losses arising from any use of information. Past performance is no guarantee of futureperformance. Visit our investment website at www.morningstar.com.
ß®
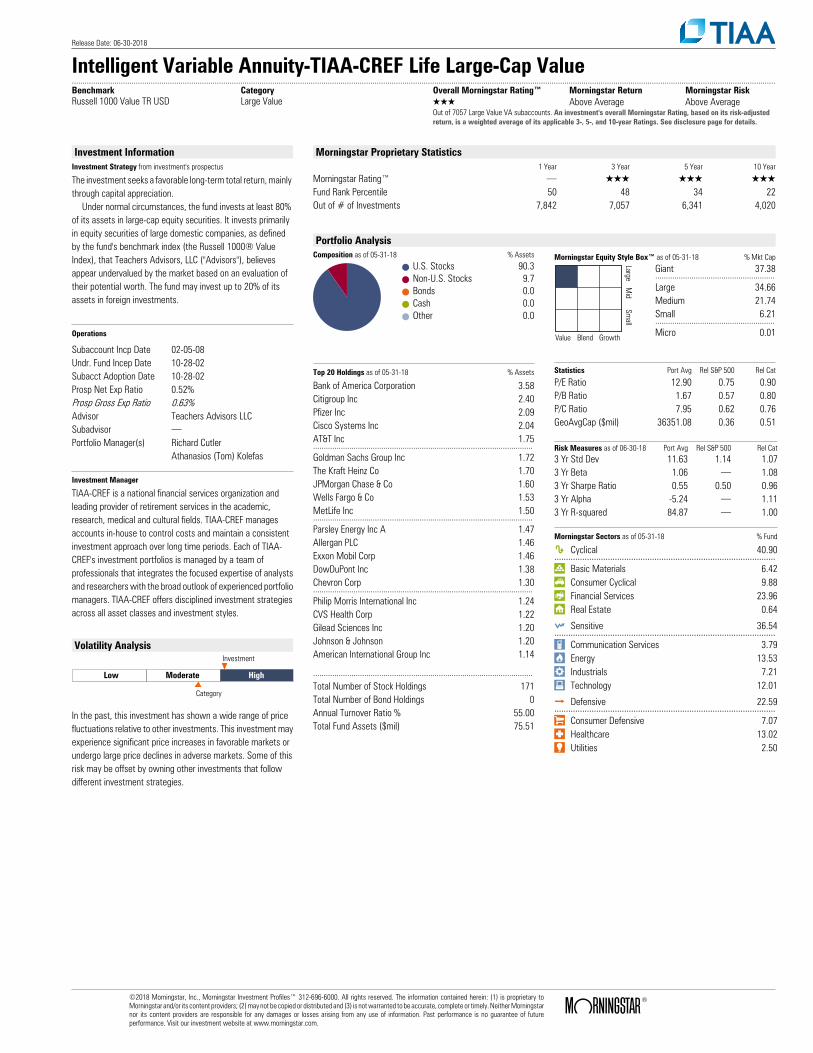
Release Date: 06-30-2018
Intelligent Variable Annuity-TIAA-CREF Life Large-Cap Value..........................................................................................................................................................................................................................................................................................................................................Benchmark Category Overall Morningstar Rating™ Morningstar Return Morningstar RiskRussell 1000 Value TR USD Large Value QQQ Above Average Above Average
Out of 7057 Large Value VA subaccounts. An investment's overall Morningstar Rating, based on its risk-adjustedreturn, is a weighted average of its applicable 3-, 5-, and 10-year Ratings. See disclosure page for details.
Investment InformationInvestment Strategy from investment's prospectus
The investment seeks a favorable long-term total return, mainly through capital appreciation. Under normal circumstances, the fund invests at least 80% of its assets in large-cap equity securities. It invests primarily in equity securities of large domestic companies, as defined by the fund's benchmark index (the Russell 1000® Value Index), that Teachers Advisors, LLC ("Advisors"), believes appear undervalued by the market based on an evaluation of their potential worth. The fund may invest up to 20% of its assets in foreign investments.
Operations
Subaccount Incp Date 02-05-08Undr. Fund Incep Date 10-28-02Subacct Adoption Date 10-28-02Prosp Net Exp Ratio 0.52%Prosp Gross Exp Ratio 0.63%Advisor Teachers Advisors LLCSubadvisor .Portfolio Manager(s) Richard Cutler
Athanasios (Tom) Kolefas
Investment Manager
TIAA-CREF is a national financial services organization andleading provider of retirement services in the academic,research, medical and cultural fields. TIAA-CREF managesaccounts in-house to control costs and maintain a consistentinvestment approach over long time periods. Each of TIAA-CREF's investment portfolios is managed by a team ofprofessionals that integrates the focused expertise of analystsand researchers with the broad outlook of experienced portfoliomanagers. TIAA-CREF offers disciplined investment strategiesacross all asset classes and investment styles.
Volatility Analysis
Low Moderate High
Investment
Category
In the past, this investment has shown a wide range of pricefluctuations relative to other investments. This investment mayexperience significant price increases in favorable markets orundergo large price declines in adverse markets. Some of thisrisk may be offset by owning other investments that followdifferent investment strategies.
Morningstar Proprietary Statistics1 Year 3 Year 5 Year 10 Year
Morningstar Rating™ . QQQ QQQ QQQFund Rank Percentile 50 48 34 22Out of # of Investments 7,842 7,057 6,341 4,020
Portfolio AnalysisComposition as of 05-31-18 % Assets
U.S. Stocks 90.3Non-U.S. Stocks 9.7Bonds 0.0Cash 0.0Other 0.0
Morningstar Equity Style Box™ as of 05-31-18 % Mkt Cap
LargeM
idSm
all
Value Blend Growth
Giant 37.38........................................................Large 34.66Medium 21.74Small 6.21........................................................Micro 0.01
Top 20 Holdings as of 05-31-18 % Assets
Bank of America Corporation 3.58Citigroup Inc 2.40Pfizer Inc 2.09Cisco Systems Inc 2.04AT&T Inc 1.75.......................................................................................................Goldman Sachs Group Inc 1.72The Kraft Heinz Co 1.70JPMorgan Chase & Co 1.60Wells Fargo & Co 1.53MetLife Inc 1.50.......................................................................................................Parsley Energy Inc A 1.47Allergan PLC 1.46Exxon Mobil Corp 1.46DowDuPont Inc 1.38Chevron Corp 1.30.......................................................................................................Philip Morris International Inc 1.24CVS Health Corp 1.22Gilead Sciences Inc 1.20Johnson & Johnson 1.20American International Group Inc 1.14
.......................................................................................................Total Number of Stock Holdings 171Total Number of Bond Holdings 0Annual Turnover Ratio % 55.00Total Fund Assets ($mil) 75.51
Statistics Port Avg Rel S&P 500 Rel Cat
P/E Ratio 12.90 0.75 0.90P/B Ratio 1.67 0.57 0.80P/C Ratio 7.95 0.62 0.76GeoAvgCap ($mil) 36351.08 0.36 0.51
Risk Measures as of 06-30-18 Port Avg Rel S&P 500 Rel Cat3 Yr Std Dev 11.63 1.14 1.073 Yr Beta 1.06 . 1.083 Yr Sharpe Ratio 0.55 0.50 0.963 Yr Alpha -5.24 . 1.113 Yr R-squared 84.87 . 1.00
Morningstar Sectors as of 05-31-18 % Fund
h Cyclical 40.90...............................................................................................r Basic Materials 6.42t Consumer Cyclical 9.88y Financial Services 23.96u Real Estate 0.64
j Sensitive 36.54...............................................................................................i Communication Services 3.79o Energy 13.53p Industrials 7.21a Technology 12.01
k Defensive 22.59...............................................................................................s Consumer Defensive 7.07d Healthcare 13.02f Utilities 2.50
©2018 Morningstar, Inc., Morningstar Investment Profiles™ 312-696-6000. All rights reserved. The information contained herein: (1) is proprietary toMorningstar and/or its content providers; (2) may not be copied or distributed and (3) is not warranted to be accurate, complete or timely. Neither Morningstarnor its content providers are responsible for any damages or losses arising from any use of information. Past performance is no guarantee of futureperformance. Visit our investment website at www.morningstar.com.
ß®
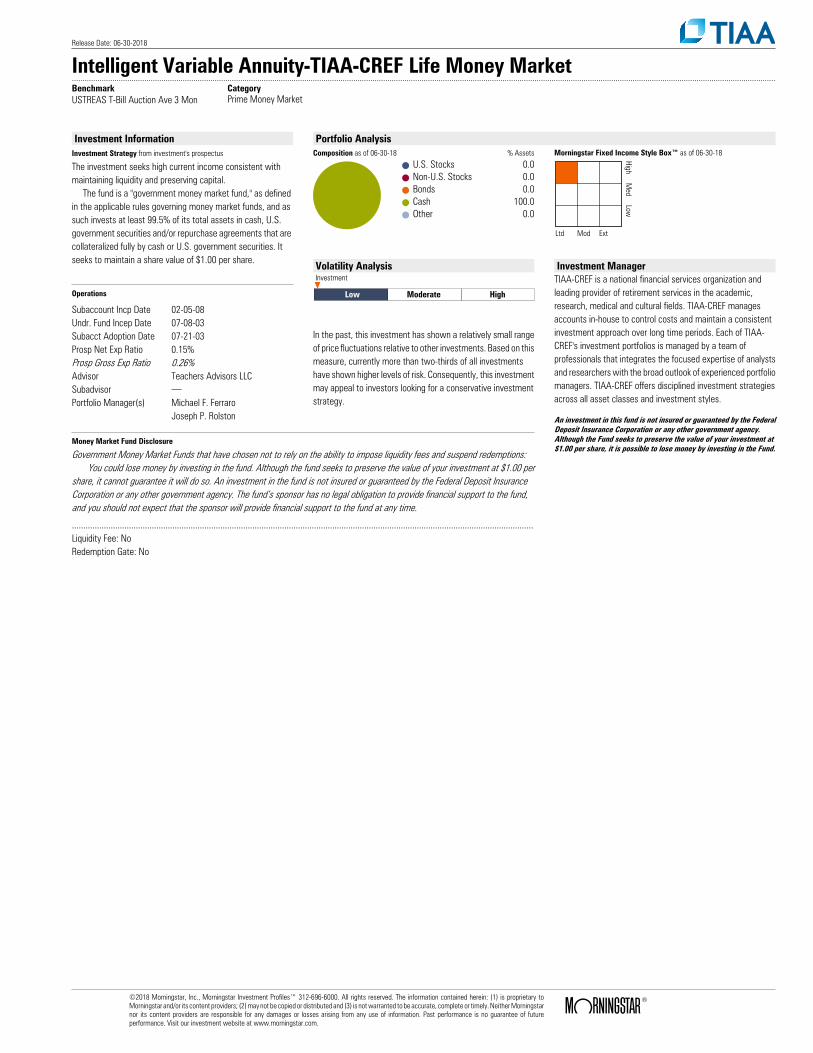
Release Date: 06-30-2018
Intelligent Variable Annuity-TIAA-CREF Life Money Market..........................................................................................................................................................................................................................................................................................................................................Benchmark CategoryUSTREAS T-Bill Auction Ave 3 Mon Prime Money Market
Investment InformationInvestment Strategy from investment's prospectus
The investment seeks high current income consistent with maintaining liquidity and preserving capital. The fund is a "government money market fund," as defined in the applicable rules governing money market funds, and as such invests at least 99.5% of its total assets in cash, U.S. government securities and/or repurchase agreements that are collateralized fully by cash or U.S. government securities. It seeks to maintain a share value of $1.00 per share.
Operations
Subaccount Incp Date 02-05-08Undr. Fund Incep Date 07-08-03Subacct Adoption Date 07-21-03Prosp Net Exp Ratio 0.15%Prosp Gross Exp Ratio 0.26%Advisor Teachers Advisors LLCSubadvisor .Portfolio Manager(s) Michael F. Ferraro
Joseph P. Rolston
Money Market Fund Disclosure
Government Money Market Funds that have chosen not to rely on the ability to impose liquidity fees and suspend redemptions:You could lose money by investing in the fund. Although the fund seeks to preserve the value of your investment at $1.00 per
share, it cannot guarantee it will do so. An investment in the fund is not insured or guaranteed by the Federal Deposit InsuranceCorporation or any other government agency. The fund’s sponsor has no legal obligation to provide financial support to the fund,and you should not expect that the sponsor will provide financial support to the fund at any time.
..........................................................................................................................................................................................................Liquidity Fee: NoRedemption Gate: No
Portfolio AnalysisComposition as of 06-30-18 % Assets
U.S. Stocks 0.0Non-U.S. Stocks 0.0Bonds 0.0Cash 100.0Other 0.0
Morningstar Fixed Income Style Box™ as of 06-30-18
HighM
edLow
Ltd Mod Ext
Volatility Analysis
Low Moderate High
Investment
Category
In the past, this investment has shown a relatively small rangeof price fluctuations relative to other investments. Based on thismeasure, currently more than two-thirds of all investmentshave shown higher levels of risk. Consequently, this investmentmay appeal to investors looking for a conservative investmentstrategy.
Investment ManagerTIAA-CREF is a national financial services organization andleading provider of retirement services in the academic,research, medical and cultural fields. TIAA-CREF managesaccounts in-house to control costs and maintain a consistentinvestment approach over long time periods. Each of TIAA-CREF's investment portfolios is managed by a team ofprofessionals that integrates the focused expertise of analystsand researchers with the broad outlook of experienced portfoliomanagers. TIAA-CREF offers disciplined investment strategiesacross all asset classes and investment styles.
An investment in this fund is not insured or guaranteed by the FederalDeposit Insurance Corporation or any other government agency.Although the Fund seeks to preserve the value of your investment at$1.00 per share, it is possible to lose money by investing in the Fund.
©2018 Morningstar, Inc., Morningstar Investment Profiles™ 312-696-6000. All rights reserved. The information contained herein: (1) is proprietary toMorningstar and/or its content providers; (2) may not be copied or distributed and (3) is not warranted to be accurate, complete or timely. Neither Morningstarnor its content providers are responsible for any damages or losses arising from any use of information. Past performance is no guarantee of futureperformance. Visit our investment website at www.morningstar.com.
ß®
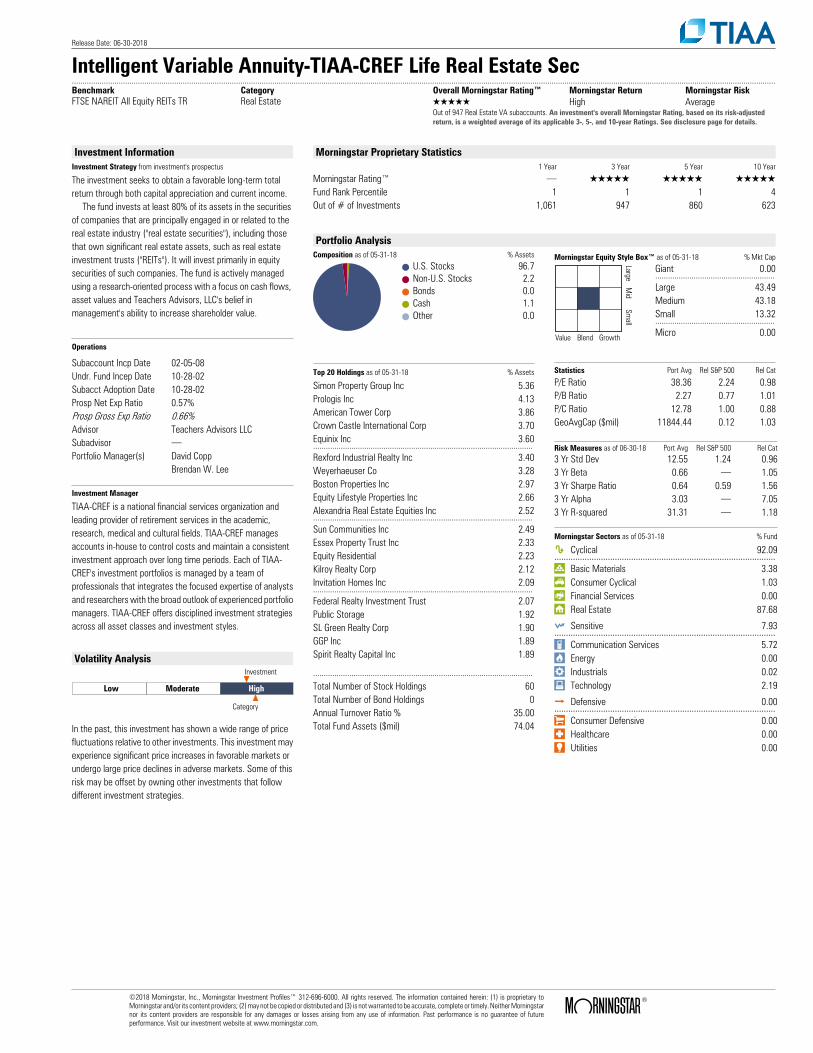
Release Date: 06-30-2018
Intelligent Variable Annuity-TIAA-CREF Life Real Estate Sec..........................................................................................................................................................................................................................................................................................................................................Benchmark Category Overall Morningstar Rating™ Morningstar Return Morningstar RiskFTSE NAREIT All Equity REITs TR Real Estate QQQQQ High Average
Out of 947 Real Estate VA subaccounts. An investment's overall Morningstar Rating, based on its risk-adjustedreturn, is a weighted average of its applicable 3-, 5-, and 10-year Ratings. See disclosure page for details.
Investment InformationInvestment Strategy from investment's prospectus
The investment seeks to obtain a favorable long-term total return through both capital appreciation and current income. The fund invests at least 80% of its assets in the securities of companies that are principally engaged in or related to the real estate industry ("real estate securities"), including those that own significant real estate assets, such as real estate investment trusts ("REITs"). It will invest primarily in equity securities of such companies. The fund is actively managed using a research-oriented process with a focus on cash flows, asset values and Teachers Advisors, LLC's belief in management's ability to increase shareholder value.
Operations
Subaccount Incp Date 02-05-08Undr. Fund Incep Date 10-28-02Subacct Adoption Date 10-28-02Prosp Net Exp Ratio 0.57%Prosp Gross Exp Ratio 0.66%Advisor Teachers Advisors LLCSubadvisor .Portfolio Manager(s) David Copp
Brendan W. Lee
Investment Manager
TIAA-CREF is a national financial services organization andleading provider of retirement services in the academic,research, medical and cultural fields. TIAA-CREF managesaccounts in-house to control costs and maintain a consistentinvestment approach over long time periods. Each of TIAA-CREF's investment portfolios is managed by a team ofprofessionals that integrates the focused expertise of analystsand researchers with the broad outlook of experienced portfoliomanagers. TIAA-CREF offers disciplined investment strategiesacross all asset classes and investment styles.
Volatility Analysis
Low Moderate High
Investment
Category
In the past, this investment has shown a wide range of pricefluctuations relative to other investments. This investment mayexperience significant price increases in favorable markets orundergo large price declines in adverse markets. Some of thisrisk may be offset by owning other investments that followdifferent investment strategies.
Morningstar Proprietary Statistics1 Year 3 Year 5 Year 10 Year
Morningstar Rating™ . QQQQQ QQQQQ QQQQQFund Rank Percentile 1 1 1 4Out of # of Investments 1,061 947 860 623
Portfolio AnalysisComposition as of 05-31-18 % Assets
U.S. Stocks 96.7Non-U.S. Stocks 2.2Bonds 0.0Cash 1.1Other 0.0
Morningstar Equity Style Box™ as of 05-31-18 % Mkt Cap
LargeM
idSm
all
Value Blend Growth
Giant 0.00........................................................Large 43.49Medium 43.18Small 13.32........................................................Micro 0.00
Top 20 Holdings as of 05-31-18 % Assets
Simon Property Group Inc 5.36Prologis Inc 4.13American Tower Corp 3.86Crown Castle International Corp 3.70Equinix Inc 3.60.......................................................................................................Rexford Industrial Realty Inc 3.40Weyerhaeuser Co 3.28Boston Properties Inc 2.97Equity Lifestyle Properties Inc 2.66Alexandria Real Estate Equities Inc 2.52.......................................................................................................Sun Communities Inc 2.49Essex Property Trust Inc 2.33Equity Residential 2.23Kilroy Realty Corp 2.12Invitation Homes Inc 2.09.......................................................................................................Federal Realty Investment Trust 2.07Public Storage 1.92SL Green Realty Corp 1.90GGP Inc 1.89Spirit Realty Capital Inc 1.89
.......................................................................................................Total Number of Stock Holdings 60Total Number of Bond Holdings 0Annual Turnover Ratio % 35.00Total Fund Assets ($mil) 74.04
Statistics Port Avg Rel S&P 500 Rel Cat
P/E Ratio 38.36 2.24 0.98P/B Ratio 2.27 0.77 1.01P/C Ratio 12.78 1.00 0.88GeoAvgCap ($mil) 11844.44 0.12 1.03
Risk Measures as of 06-30-18 Port Avg Rel S&P 500 Rel Cat3 Yr Std Dev 12.55 1.24 0.963 Yr Beta 0.66 . 1.053 Yr Sharpe Ratio 0.64 0.59 1.563 Yr Alpha 3.03 . 7.053 Yr R-squared 31.31 . 1.18
Morningstar Sectors as of 05-31-18 % Fund
h Cyclical 92.09...............................................................................................r Basic Materials 3.38t Consumer Cyclical 1.03y Financial Services 0.00u Real Estate 87.68
j Sensitive 7.93...............................................................................................i Communication Services 5.72o Energy 0.00p Industrials 0.02a Technology 2.19
k Defensive 0.00...............................................................................................s Consumer Defensive 0.00d Healthcare 0.00f Utilities 0.00
©2018 Morningstar, Inc., Morningstar Investment Profiles™ 312-696-6000. All rights reserved. The information contained herein: (1) is proprietary toMorningstar and/or its content providers; (2) may not be copied or distributed and (3) is not warranted to be accurate, complete or timely. Neither Morningstarnor its content providers are responsible for any damages or losses arising from any use of information. Past performance is no guarantee of futureperformance. Visit our investment website at www.morningstar.com.
ß®

Release Date: 06-30-2018
Intelligent Variable Annuity-TIAA-CREF Life Small-Cap Equity..........................................................................................................................................................................................................................................................................................................................................Benchmark Category Overall Morningstar Rating™ Morningstar Return Morningstar RiskRussell 2000 TR USD Small Growth QQQ Average Average
Out of 2859 Small Growth VA subaccounts. An investment's overall Morningstar Rating, based on its risk-adjustedreturn, is a weighted average of its applicable 3-, 5-, and 10-year Ratings. See disclosure page for details.
Investment InformationInvestment Strategy from investment's prospectus
The investment seeks a favorable long-term total return, mainly through capital appreciation. The fund normally invests at least 80% of its assets in small-cap equity securities. A small-cap equity security is a security within the capitalization range of the companies included in the fund's benchmark index, the Russell 2000® Index, at the time of purchase. It invests primarily in equity securities of smaller domestic companies across a wide range of sectors, growth rates and valuations.
Operations
Subaccount Incp Date 02-05-08Undr. Fund Incep Date 10-28-02Subacct Adoption Date 10-28-02Prosp Net Exp Ratio 0.53%Prosp Gross Exp Ratio 0.71%Advisor Teachers Advisors LLCSubadvisor .Portfolio Manager(s) Adam Cao
Pei Chen
Investment Manager
TIAA-CREF is a national financial services organization andleading provider of retirement services in the academic,research, medical and cultural fields. TIAA-CREF managesaccounts in-house to control costs and maintain a consistentinvestment approach over long time periods. Each of TIAA-CREF's investment portfolios is managed by a team ofprofessionals that integrates the focused expertise of analystsand researchers with the broad outlook of experienced portfoliomanagers. TIAA-CREF offers disciplined investment strategiesacross all asset classes and investment styles.
Volatility Analysis
Low Moderate High
Investment
Category
In the past, this investment has shown a wide range of pricefluctuations relative to other investments. This investment mayexperience significant price increases in favorable markets orundergo large price declines in adverse markets. Some of thisrisk may be offset by owning other investments that followdifferent investment strategies.
Morningstar Proprietary Statistics1 Year 3 Year 5 Year 10 Year
Morningstar Rating™ . QQQ QQQQ QQQFund Rank Percentile 92 38 39 47Out of # of Investments 3,043 2,859 2,645 1,746
Portfolio AnalysisComposition as of 05-31-18 % Assets
U.S. Stocks 99.0Non-U.S. Stocks 0.4Bonds 0.0Cash 0.3Other 0.4
Morningstar Equity Style Box™ as of 05-31-18 % Mkt Cap
LargeM
idSm
all
Value Blend Growth
Giant 0.00........................................................Large 0.00Medium 42.71Small 54.93........................................................Micro 2.37
Top 20 Holdings as of 05-31-18 % Assets
iShares Russell 2000 ETF 1.40Grand Canyon Education Inc 0.91Evercore Inc A 0.83EMCOR Group Inc 0.76CACI International Inc Class A 0.74.......................................................................................................Curtiss-Wright Corp 0.72Insperity Inc 0.72Masimo Corp 0.72Delek US Holdings Inc 0.71Fair Isaac Corp 0.70.......................................................................................................Wintrust Financial Corp 0.70Hancock Whitney Corp 0.69American Equity Investment Life Holding Co 0.66iShares Micro-Cap ETF 0.66United Community Banks Inc 0.66.......................................................................................................Nektar Therapeutics Inc 0.65Vonage Holdings Corp 0.65Walker & Dunlop Inc 0.65Zendesk Inc 0.65Umpqua Holdings Corp 0.63
.......................................................................................................Total Number of Stock Holdings 277Total Number of Bond Holdings 0Annual Turnover Ratio % 77.00Total Fund Assets ($mil) 57.86
Statistics Port Avg Rel S&P 500 Rel Cat
P/E Ratio 17.53 1.02 0.76P/B Ratio 2.52 0.86 0.74P/C Ratio 9.69 0.76 0.72GeoAvgCap ($mil) 2706.03 0.03 0.79
Risk Measures as of 06-30-18 Port Avg Rel S&P 500 Rel Cat3 Yr Std Dev 14.04 1.38 1.013 Yr Beta 1.11 . 1.033 Yr Sharpe Ratio 0.71 0.65 1.013 Yr Alpha -2.41 . 1.023 Yr R-squared 64.94 . 1.02
Morningstar Sectors as of 05-31-18 % Fund
h Cyclical 39.47...............................................................................................r Basic Materials 7.07t Consumer Cyclical 9.95y Financial Services 15.80u Real Estate 6.65
j Sensitive 37.98...............................................................................................i Communication Services 0.98o Energy 3.93p Industrials 13.57a Technology 19.50
k Defensive 22.54...............................................................................................s Consumer Defensive 3.31d Healthcare 16.12f Utilities 3.11
©2018 Morningstar, Inc., Morningstar Investment Profiles™ 312-696-6000. All rights reserved. The information contained herein: (1) is proprietary toMorningstar and/or its content providers; (2) may not be copied or distributed and (3) is not warranted to be accurate, complete or timely. Neither Morningstarnor its content providers are responsible for any damages or losses arising from any use of information. Past performance is no guarantee of futureperformance. Visit our investment website at www.morningstar.com.
ß®
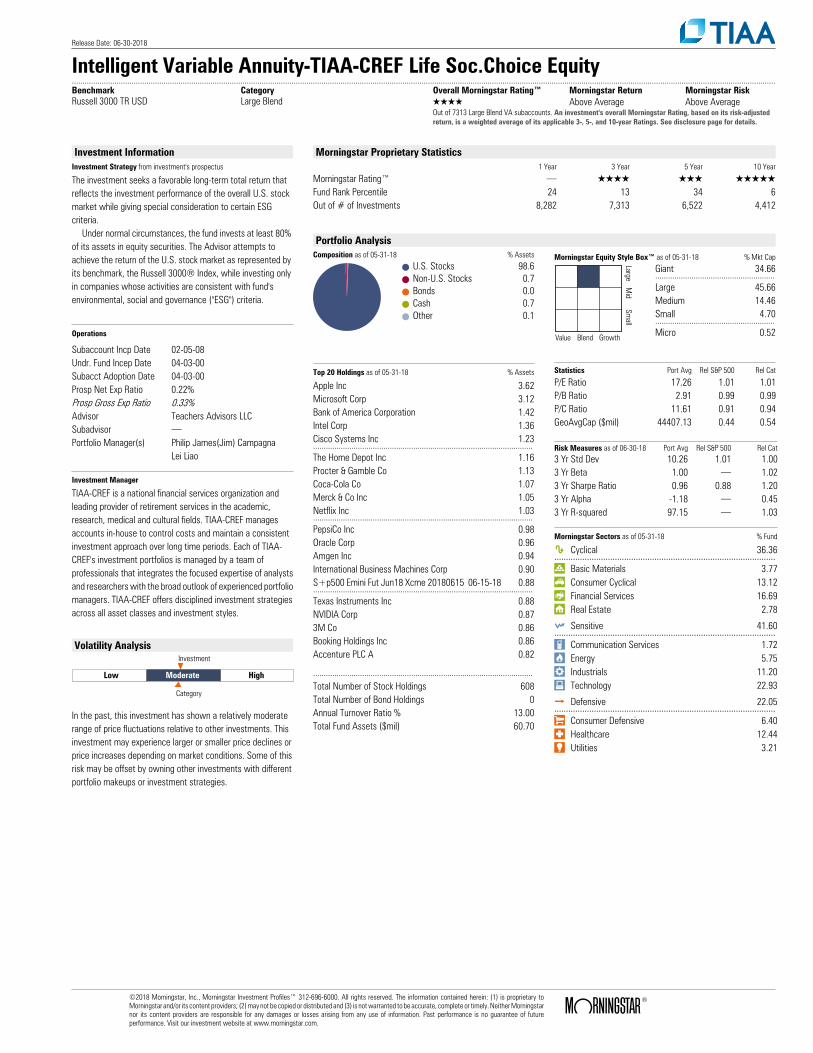
Release Date: 06-30-2018
Intelligent Variable Annuity-TIAA-CREF Life Soc.Choice Equity..........................................................................................................................................................................................................................................................................................................................................Benchmark Category Overall Morningstar Rating™ Morningstar Return Morningstar RiskRussell 3000 TR USD Large Blend QQQQ Above Average Above Average
Out of 7313 Large Blend VA subaccounts. An investment's overall Morningstar Rating, based on its risk-adjustedreturn, is a weighted average of its applicable 3-, 5-, and 10-year Ratings. See disclosure page for details.
Investment InformationInvestment Strategy from investment's prospectus
The investment seeks a favorable long-term total return that reflects the investment performance of the overall U.S. stock market while giving special consideration to certain ESG criteria. Under normal circumstances, the fund invests at least 80% of its assets in equity securities. The Advisor attempts to achieve the return of the U.S. stock market as represented by its benchmark, the Russell 3000® Index, while investing only in companies whose activities are consistent with fund's environmental, social and governance ("ESG") criteria.
Operations
Subaccount Incp Date 02-05-08Undr. Fund Incep Date 04-03-00Subacct Adoption Date 04-03-00Prosp Net Exp Ratio 0.22%Prosp Gross Exp Ratio 0.33%Advisor Teachers Advisors LLCSubadvisor .Portfolio Manager(s) Philip James(Jim) Campagna
Lei Liao
Investment Manager
TIAA-CREF is a national financial services organization andleading provider of retirement services in the academic,research, medical and cultural fields. TIAA-CREF managesaccounts in-house to control costs and maintain a consistentinvestment approach over long time periods. Each of TIAA-CREF's investment portfolios is managed by a team ofprofessionals that integrates the focused expertise of analystsand researchers with the broad outlook of experienced portfoliomanagers. TIAA-CREF offers disciplined investment strategiesacross all asset classes and investment styles.
Volatility Analysis
Low Moderate High
Investment
Category
In the past, this investment has shown a relatively moderaterange of price fluctuations relative to other investments. Thisinvestment may experience larger or smaller price declines orprice increases depending on market conditions. Some of thisrisk may be offset by owning other investments with differentportfolio makeups or investment strategies.
Morningstar Proprietary Statistics1 Year 3 Year 5 Year 10 Year
Morningstar Rating™ . QQQQ QQQ QQQQQFund Rank Percentile 24 13 34 6Out of # of Investments 8,282 7,313 6,522 4,412
Portfolio AnalysisComposition as of 05-31-18 % Assets
U.S. Stocks 98.6Non-U.S. Stocks 0.7Bonds 0.0Cash 0.7Other 0.1
Morningstar Equity Style Box™ as of 05-31-18 % Mkt Cap
LargeM
idSm
all
Value Blend Growth
Giant 34.66........................................................Large 45.66Medium 14.46Small 4.70........................................................Micro 0.52
Top 20 Holdings as of 05-31-18 % Assets
Apple Inc 3.62Microsoft Corp 3.12Bank of America Corporation 1.42Intel Corp 1.36Cisco Systems Inc 1.23.......................................................................................................The Home Depot Inc 1.16Procter & Gamble Co 1.13Coca-Cola Co 1.07Merck & Co Inc 1.05Netflix Inc 1.03.......................................................................................................PepsiCo Inc 0.98Oracle Corp 0.96Amgen Inc 0.94International Business Machines Corp 0.90S+p500 Emini Fut Jun18 Xcme 20180615 06-15-18 0.88.......................................................................................................Texas Instruments Inc 0.88NVIDIA Corp 0.873M Co 0.86Booking Holdings Inc 0.86Accenture PLC A 0.82
.......................................................................................................Total Number of Stock Holdings 608Total Number of Bond Holdings 0Annual Turnover Ratio % 13.00Total Fund Assets ($mil) 60.70
Statistics Port Avg Rel S&P 500 Rel Cat
P/E Ratio 17.26 1.01 1.01P/B Ratio 2.91 0.99 0.99P/C Ratio 11.61 0.91 0.94GeoAvgCap ($mil) 44407.13 0.44 0.54
Risk Measures as of 06-30-18 Port Avg Rel S&P 500 Rel Cat3 Yr Std Dev 10.26 1.01 1.003 Yr Beta 1.00 . 1.023 Yr Sharpe Ratio 0.96 0.88 1.203 Yr Alpha -1.18 . 0.453 Yr R-squared 97.15 . 1.03
Morningstar Sectors as of 05-31-18 % Fund
h Cyclical 36.36...............................................................................................r Basic Materials 3.77t Consumer Cyclical 13.12y Financial Services 16.69u Real Estate 2.78
j Sensitive 41.60...............................................................................................i Communication Services 1.72o Energy 5.75p Industrials 11.20a Technology 22.93
k Defensive 22.05...............................................................................................s Consumer Defensive 6.40d Healthcare 12.44f Utilities 3.21
©2018 Morningstar, Inc., Morningstar Investment Profiles™ 312-696-6000. All rights reserved. The information contained herein: (1) is proprietary toMorningstar and/or its content providers; (2) may not be copied or distributed and (3) is not warranted to be accurate, complete or timely. Neither Morningstarnor its content providers are responsible for any damages or losses arising from any use of information. Past performance is no guarantee of futureperformance. Visit our investment website at www.morningstar.com.
ß®
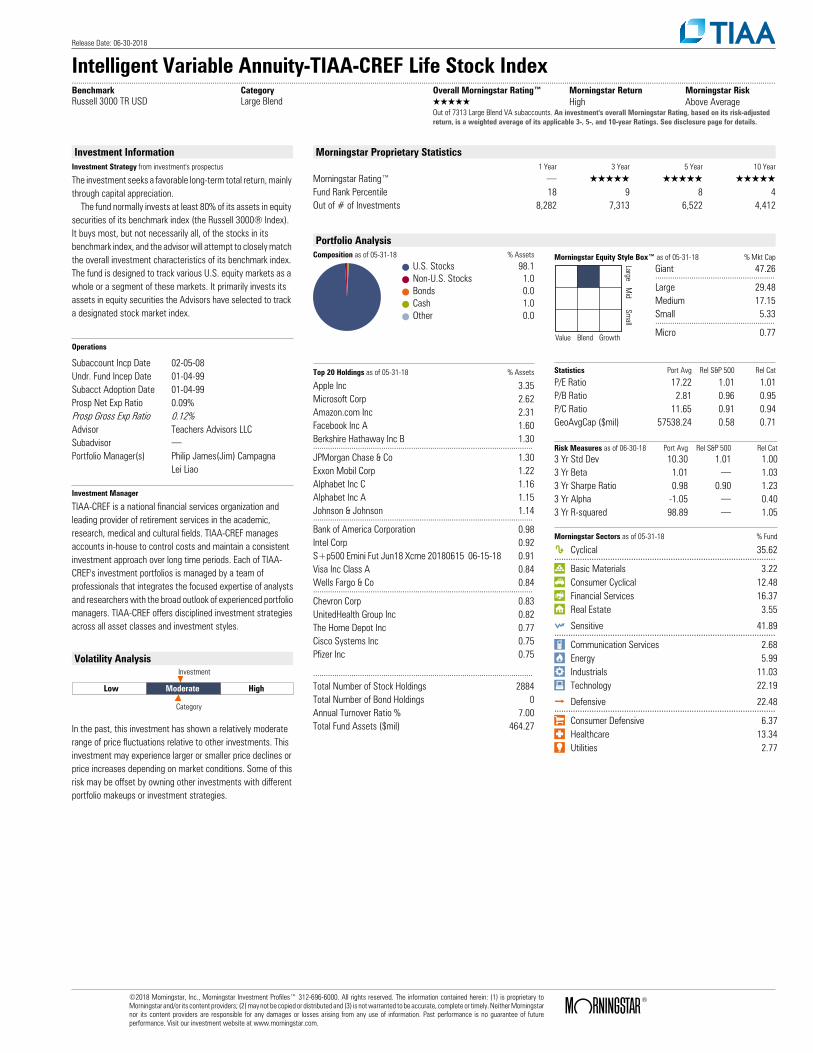
Release Date: 06-30-2018
Intelligent Variable Annuity-TIAA-CREF Life Stock Index..........................................................................................................................................................................................................................................................................................................................................Benchmark Category Overall Morningstar Rating™ Morningstar Return Morningstar RiskRussell 3000 TR USD Large Blend QQQQQ High Above Average
Out of 7313 Large Blend VA subaccounts. An investment's overall Morningstar Rating, based on its risk-adjustedreturn, is a weighted average of its applicable 3-, 5-, and 10-year Ratings. See disclosure page for details.
Investment InformationInvestment Strategy from investment's prospectus
The investment seeks a favorable long-term total return, mainly through capital appreciation. The fund normally invests at least 80% of its assets in equity securities of its benchmark index (the Russell 3000® Index). It buys most, but not necessarily all, of the stocks in its benchmark index, and the advisor will attempt to closely match the overall investment characteristics of its benchmark index. The fund is designed to track various U.S. equity markets as a whole or a segment of these markets. It primarily invests its assets in equity securities the Advisors have selected to track a designated stock market index.
Operations
Subaccount Incp Date 02-05-08Undr. Fund Incep Date 01-04-99Subacct Adoption Date 01-04-99Prosp Net Exp Ratio 0.09%Prosp Gross Exp Ratio 0.12%Advisor Teachers Advisors LLCSubadvisor .Portfolio Manager(s) Philip James(Jim) Campagna
Lei Liao
Investment Manager
TIAA-CREF is a national financial services organization andleading provider of retirement services in the academic,research, medical and cultural fields. TIAA-CREF managesaccounts in-house to control costs and maintain a consistentinvestment approach over long time periods. Each of TIAA-CREF's investment portfolios is managed by a team ofprofessionals that integrates the focused expertise of analystsand researchers with the broad outlook of experienced portfoliomanagers. TIAA-CREF offers disciplined investment strategiesacross all asset classes and investment styles.
Volatility Analysis
Low Moderate High
Investment
Category
In the past, this investment has shown a relatively moderaterange of price fluctuations relative to other investments. Thisinvestment may experience larger or smaller price declines orprice increases depending on market conditions. Some of thisrisk may be offset by owning other investments with differentportfolio makeups or investment strategies.
Morningstar Proprietary Statistics1 Year 3 Year 5 Year 10 Year
Morningstar Rating™ . QQQQQ QQQQQ QQQQQFund Rank Percentile 18 9 8 4Out of # of Investments 8,282 7,313 6,522 4,412
Portfolio AnalysisComposition as of 05-31-18 % Assets
U.S. Stocks 98.1Non-U.S. Stocks 1.0Bonds 0.0Cash 1.0Other 0.0
Morningstar Equity Style Box™ as of 05-31-18 % Mkt Cap
LargeM
idSm
all
Value Blend Growth
Giant 47.26........................................................Large 29.48Medium 17.15Small 5.33........................................................Micro 0.77
Top 20 Holdings as of 05-31-18 % Assets
Apple Inc 3.35Microsoft Corp 2.62Amazon.com Inc 2.31Facebook Inc A 1.60Berkshire Hathaway Inc B 1.30.......................................................................................................JPMorgan Chase & Co 1.30Exxon Mobil Corp 1.22Alphabet Inc C 1.16Alphabet Inc A 1.15Johnson & Johnson 1.14.......................................................................................................Bank of America Corporation 0.98Intel Corp 0.92S+p500 Emini Fut Jun18 Xcme 20180615 06-15-18 0.91Visa Inc Class A 0.84Wells Fargo & Co 0.84.......................................................................................................Chevron Corp 0.83UnitedHealth Group Inc 0.82The Home Depot Inc 0.77Cisco Systems Inc 0.75Pfizer Inc 0.75
.......................................................................................................Total Number of Stock Holdings 2884Total Number of Bond Holdings 0Annual Turnover Ratio % 7.00Total Fund Assets ($mil) 464.27
Statistics Port Avg Rel S&P 500 Rel Cat
P/E Ratio 17.22 1.01 1.01P/B Ratio 2.81 0.96 0.95P/C Ratio 11.65 0.91 0.94GeoAvgCap ($mil) 57538.24 0.58 0.71
Risk Measures as of 06-30-18 Port Avg Rel S&P 500 Rel Cat3 Yr Std Dev 10.30 1.01 1.003 Yr Beta 1.01 . 1.033 Yr Sharpe Ratio 0.98 0.90 1.233 Yr Alpha -1.05 . 0.403 Yr R-squared 98.89 . 1.05
Morningstar Sectors as of 05-31-18 % Fund
h Cyclical 35.62...............................................................................................r Basic Materials 3.22t Consumer Cyclical 12.48y Financial Services 16.37u Real Estate 3.55
j Sensitive 41.89...............................................................................................i Communication Services 2.68o Energy 5.99p Industrials 11.03a Technology 22.19
k Defensive 22.48...............................................................................................s Consumer Defensive 6.37d Healthcare 13.34f Utilities 2.77
©2018 Morningstar, Inc., Morningstar Investment Profiles™ 312-696-6000. All rights reserved. The information contained herein: (1) is proprietary toMorningstar and/or its content providers; (2) may not be copied or distributed and (3) is not warranted to be accurate, complete or timely. Neither Morningstarnor its content providers are responsible for any damages or losses arising from any use of information. Past performance is no guarantee of futureperformance. Visit our investment website at www.morningstar.com.
ß®
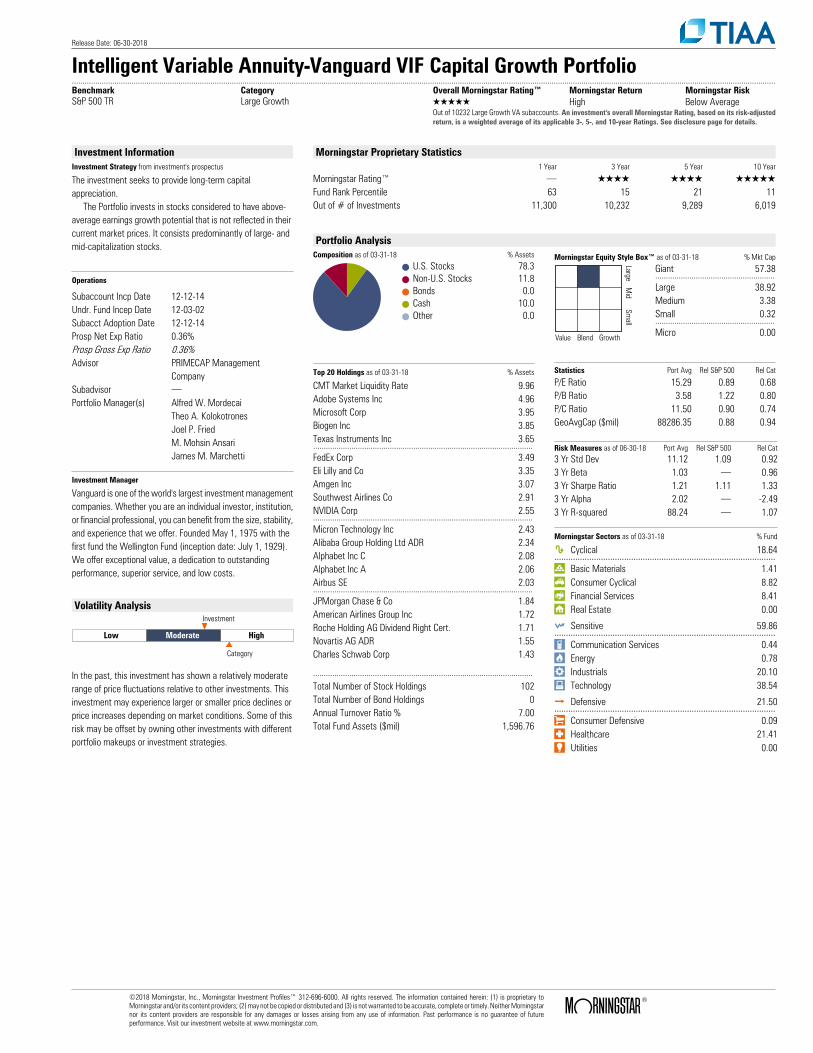
Release Date: 06-30-2018
Intelligent Variable Annuity-Vanguard VIF Capital Growth Portfolio..........................................................................................................................................................................................................................................................................................................................................Benchmark Category Overall Morningstar Rating™ Morningstar Return Morningstar RiskS&P 500 TR Large Growth QQQQQ High Below Average
Out of 10232 Large Growth VA subaccounts. An investment's overall Morningstar Rating, based on its risk-adjustedreturn, is a weighted average of its applicable 3-, 5-, and 10-year Ratings. See disclosure page for details.
Investment InformationInvestment Strategy from investment's prospectus
The investment seeks to provide long-term capital appreciation. The Portfolio invests in stocks considered to have above-average earnings growth potential that is not reflected in their current market prices. It consists predominantly of large- and mid-capitalization stocks.
Operations
Subaccount Incp Date 12-12-14Undr. Fund Incep Date 12-03-02Subacct Adoption Date 12-12-14Prosp Net Exp Ratio 0.36%Prosp Gross Exp Ratio 0.36%Advisor PRIMECAP Management
CompanySubadvisor .Portfolio Manager(s) Alfred W. Mordecai
Theo A. KolokotronesJoel P. FriedM. Mohsin AnsariJames M. Marchetti
Investment Manager
Vanguard is one of the world's largest investment managementcompanies. Whether you are an individual investor, institution,or financial professional, you can benefit from the size, stability,and experience that we offer. Founded May 1, 1975 with thefirst fund the Wellington Fund (inception date: July 1, 1929).We offer exceptional value, a dedication to outstandingperformance, superior service, and low costs.
Volatility Analysis
Low Moderate High
Investment
Category
In the past, this investment has shown a relatively moderaterange of price fluctuations relative to other investments. Thisinvestment may experience larger or smaller price declines orprice increases depending on market conditions. Some of thisrisk may be offset by owning other investments with differentportfolio makeups or investment strategies.
Morningstar Proprietary Statistics1 Year 3 Year 5 Year 10 Year
Morningstar Rating™ . QQQQ QQQQ QQQQQFund Rank Percentile 63 15 21 11Out of # of Investments 11,300 10,232 9,289 6,019
Portfolio AnalysisComposition as of 03-31-18 % Assets
U.S. Stocks 78.3Non-U.S. Stocks 11.8Bonds 0.0Cash 10.0Other 0.0
Morningstar Equity Style Box™ as of 03-31-18 % Mkt Cap
LargeM
idSm
all
Value Blend Growth
Giant 57.38........................................................Large 38.92Medium 3.38Small 0.32........................................................Micro 0.00
Top 20 Holdings as of 03-31-18 % Assets
CMT Market Liquidity Rate 9.96Adobe Systems Inc 4.96Microsoft Corp 3.95Biogen Inc 3.85Texas Instruments Inc 3.65.......................................................................................................FedEx Corp 3.49Eli Lilly and Co 3.35Amgen Inc 3.07Southwest Airlines Co 2.91NVIDIA Corp 2.55.......................................................................................................Micron Technology Inc 2.43Alibaba Group Holding Ltd ADR 2.34Alphabet Inc C 2.08Alphabet Inc A 2.06Airbus SE 2.03.......................................................................................................JPMorgan Chase & Co 1.84American Airlines Group Inc 1.72Roche Holding AG Dividend Right Cert. 1.71Novartis AG ADR 1.55Charles Schwab Corp 1.43
.......................................................................................................Total Number of Stock Holdings 102Total Number of Bond Holdings 0Annual Turnover Ratio % 7.00Total Fund Assets ($mil) 1,596.76
Statistics Port Avg Rel S&P 500 Rel Cat
P/E Ratio 15.29 0.89 0.68P/B Ratio 3.58 1.22 0.80P/C Ratio 11.50 0.90 0.74GeoAvgCap ($mil) 88286.35 0.88 0.94
Risk Measures as of 06-30-18 Port Avg Rel S&P 500 Rel Cat3 Yr Std Dev 11.12 1.09 0.923 Yr Beta 1.03 . 0.963 Yr Sharpe Ratio 1.21 1.11 1.333 Yr Alpha 2.02 . -2.493 Yr R-squared 88.24 . 1.07
Morningstar Sectors as of 03-31-18 % Fund
h Cyclical 18.64...............................................................................................r Basic Materials 1.41t Consumer Cyclical 8.82y Financial Services 8.41u Real Estate 0.00
j Sensitive 59.86...............................................................................................i Communication Services 0.44o Energy 0.78p Industrials 20.10a Technology 38.54
k Defensive 21.50...............................................................................................s Consumer Defensive 0.09d Healthcare 21.41f Utilities 0.00
©2018 Morningstar, Inc., Morningstar Investment Profiles™ 312-696-6000. All rights reserved. The information contained herein: (1) is proprietary toMorningstar and/or its content providers; (2) may not be copied or distributed and (3) is not warranted to be accurate, complete or timely. Neither Morningstarnor its content providers are responsible for any damages or losses arising from any use of information. Past performance is no guarantee of futureperformance. Visit our investment website at www.morningstar.com.
ß®
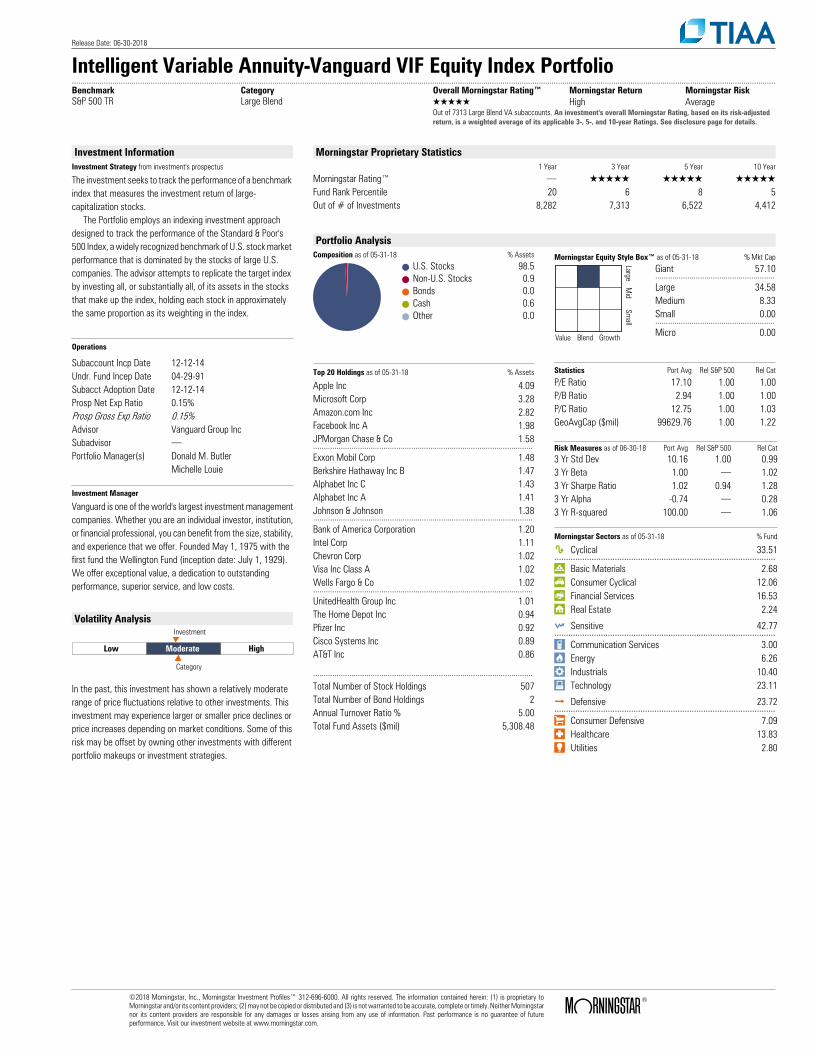
Release Date: 06-30-2018
Intelligent Variable Annuity-Vanguard VIF Equity Index Portfolio..........................................................................................................................................................................................................................................................................................................................................Benchmark Category Overall Morningstar Rating™ Morningstar Return Morningstar RiskS&P 500 TR Large Blend QQQQQ High Average
Out of 7313 Large Blend VA subaccounts. An investment's overall Morningstar Rating, based on its risk-adjustedreturn, is a weighted average of its applicable 3-, 5-, and 10-year Ratings. See disclosure page for details.
Investment InformationInvestment Strategy from investment's prospectus
The investment seeks to track the performance of a benchmark index that measures the investment return of large-capitalization stocks. The Portfolio employs an indexing investment approach designed to track the performance of the Standard & Poor's 500 Index, a widely recognized benchmark of U.S. stock market performance that is dominated by the stocks of large U.S. companies. The advisor attempts to replicate the target index by investing all, or substantially all, of its assets in the stocks that make up the index, holding each stock in approximately the same proportion as its weighting in the index.
Operations
Subaccount Incp Date 12-12-14Undr. Fund Incep Date 04-29-91Subacct Adoption Date 12-12-14Prosp Net Exp Ratio 0.15%Prosp Gross Exp Ratio 0.15%Advisor Vanguard Group IncSubadvisor .Portfolio Manager(s) Donald M. Butler
Michelle Louie
Investment Manager
Vanguard is one of the world's largest investment managementcompanies. Whether you are an individual investor, institution,or financial professional, you can benefit from the size, stability,and experience that we offer. Founded May 1, 1975 with thefirst fund the Wellington Fund (inception date: July 1, 1929).We offer exceptional value, a dedication to outstandingperformance, superior service, and low costs.
Volatility Analysis
Low Moderate High
Investment
Category
In the past, this investment has shown a relatively moderaterange of price fluctuations relative to other investments. Thisinvestment may experience larger or smaller price declines orprice increases depending on market conditions. Some of thisrisk may be offset by owning other investments with differentportfolio makeups or investment strategies.
Morningstar Proprietary Statistics1 Year 3 Year 5 Year 10 Year
Morningstar Rating™ . QQQQQ QQQQQ QQQQQFund Rank Percentile 20 6 8 5Out of # of Investments 8,282 7,313 6,522 4,412
Portfolio AnalysisComposition as of 05-31-18 % Assets
U.S. Stocks 98.5Non-U.S. Stocks 0.9Bonds 0.0Cash 0.6Other 0.0
Morningstar Equity Style Box™ as of 05-31-18 % Mkt Cap
LargeM
idSm
all
Value Blend Growth
Giant 57.10........................................................Large 34.58Medium 8.33Small 0.00........................................................Micro 0.00
Top 20 Holdings as of 05-31-18 % Assets
Apple Inc 4.09Microsoft Corp 3.28Amazon.com Inc 2.82Facebook Inc A 1.98JPMorgan Chase & Co 1.58.......................................................................................................Exxon Mobil Corp 1.48Berkshire Hathaway Inc B 1.47Alphabet Inc C 1.43Alphabet Inc A 1.41Johnson & Johnson 1.38.......................................................................................................Bank of America Corporation 1.20Intel Corp 1.11Chevron Corp 1.02Visa Inc Class A 1.02Wells Fargo & Co 1.02.......................................................................................................UnitedHealth Group Inc 1.01The Home Depot Inc 0.94Pfizer Inc 0.92Cisco Systems Inc 0.89AT&T Inc 0.86
.......................................................................................................Total Number of Stock Holdings 507Total Number of Bond Holdings 2Annual Turnover Ratio % 5.00Total Fund Assets ($mil) 5,308.48
Statistics Port Avg Rel S&P 500 Rel Cat
P/E Ratio 17.10 1.00 1.00P/B Ratio 2.94 1.00 1.00P/C Ratio 12.75 1.00 1.03GeoAvgCap ($mil) 99629.76 1.00 1.22
Risk Measures as of 06-30-18 Port Avg Rel S&P 500 Rel Cat3 Yr Std Dev 10.16 1.00 0.993 Yr Beta 1.00 . 1.023 Yr Sharpe Ratio 1.02 0.94 1.283 Yr Alpha -0.74 . 0.283 Yr R-squared 100.00 . 1.06
Morningstar Sectors as of 05-31-18 % Fund
h Cyclical 33.51...............................................................................................r Basic Materials 2.68t Consumer Cyclical 12.06y Financial Services 16.53u Real Estate 2.24
j Sensitive 42.77...............................................................................................i Communication Services 3.00o Energy 6.26p Industrials 10.40a Technology 23.11
k Defensive 23.72...............................................................................................s Consumer Defensive 7.09d Healthcare 13.83f Utilities 2.80
©2018 Morningstar, Inc., Morningstar Investment Profiles™ 312-696-6000. All rights reserved. The information contained herein: (1) is proprietary toMorningstar and/or its content providers; (2) may not be copied or distributed and (3) is not warranted to be accurate, complete or timely. Neither Morningstarnor its content providers are responsible for any damages or losses arising from any use of information. Past performance is no guarantee of futureperformance. Visit our investment website at www.morningstar.com.
ß®
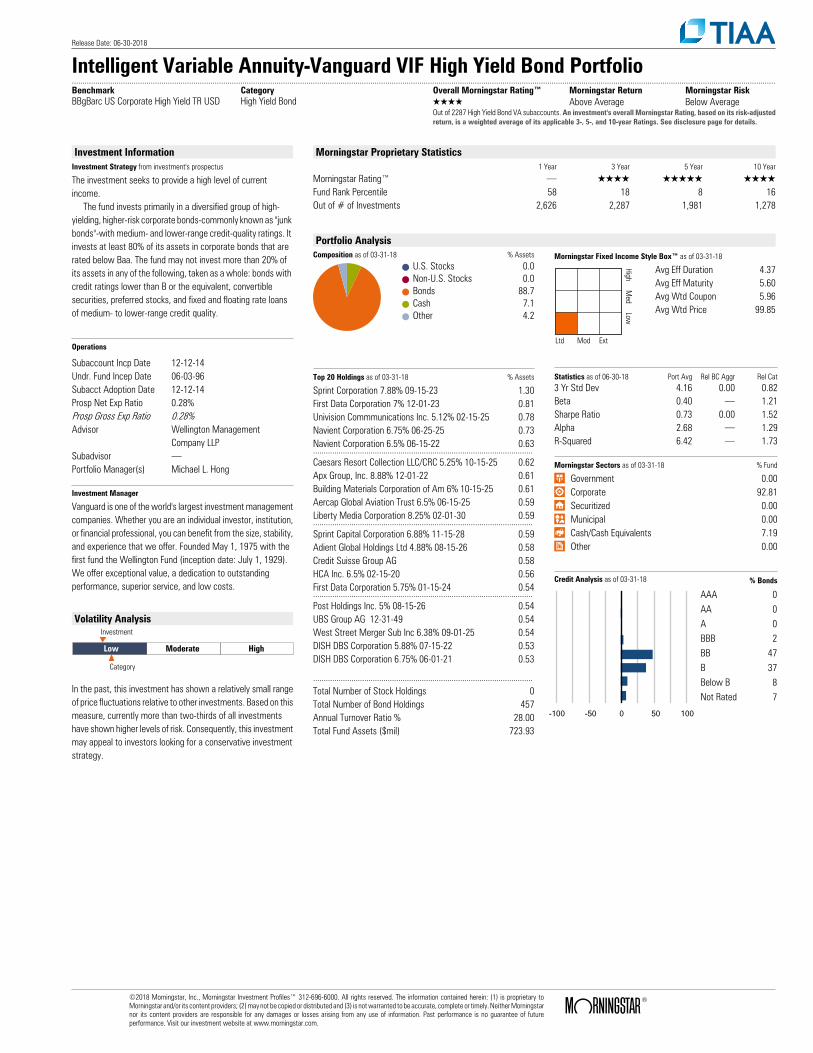
Release Date: 06-30-2018
Intelligent Variable Annuity-Vanguard VIF High Yield Bond Portfolio..........................................................................................................................................................................................................................................................................................................................................Benchmark Category Overall Morningstar Rating™ Morningstar Return Morningstar RiskBBgBarc US Corporate High Yield TR USD High Yield Bond QQQQ Above Average Below Average
Out of 2287 High Yield Bond VA subaccounts. An investment's overall Morningstar Rating, based on its risk-adjustedreturn, is a weighted average of its applicable 3-, 5-, and 10-year Ratings. See disclosure page for details.
Investment InformationInvestment Strategy from investment's prospectus
The investment seeks to provide a high level of current income. The fund invests primarily in a diversified group of high-yielding, higher-risk corporate bonds-commonly known as "junk bonds"-with medium- and lower-range credit-quality ratings. It invests at least 80% of its assets in corporate bonds that are rated below Baa. The fund may not invest more than 20% of its assets in any of the following, taken as a whole: bonds with credit ratings lower than B or the equivalent, convertible securities, preferred stocks, and fixed and floating rate loans of medium- to lower-range credit quality.
Operations
Subaccount Incp Date 12-12-14Undr. Fund Incep Date 06-03-96Subacct Adoption Date 12-12-14Prosp Net Exp Ratio 0.28%Prosp Gross Exp Ratio 0.28%Advisor Wellington Management
Company LLPSubadvisor .Portfolio Manager(s) Michael L. Hong
Investment Manager
Vanguard is one of the world's largest investment managementcompanies. Whether you are an individual investor, institution,or financial professional, you can benefit from the size, stability,and experience that we offer. Founded May 1, 1975 with thefirst fund the Wellington Fund (inception date: July 1, 1929).We offer exceptional value, a dedication to outstandingperformance, superior service, and low costs.
Volatility Analysis
Low Moderate High
Investment
Category
In the past, this investment has shown a relatively small rangeof price fluctuations relative to other investments. Based on thismeasure, currently more than two-thirds of all investmentshave shown higher levels of risk. Consequently, this investmentmay appeal to investors looking for a conservative investmentstrategy.
Morningstar Proprietary Statistics1 Year 3 Year 5 Year 10 Year
Morningstar Rating™ . QQQQ QQQQQ QQQQFund Rank Percentile 58 18 8 16Out of # of Investments 2,626 2,287 1,981 1,278
Portfolio AnalysisComposition as of 03-31-18 % Assets
U.S. Stocks 0.0Non-U.S. Stocks 0.0Bonds 88.7Cash 7.1Other 4.2
Morningstar Fixed Income Style Box™ as of 03-31-18
HighM
edLow
Ltd Mod Ext
Avg Eff Duration 4.37Avg Eff Maturity 5.60Avg Wtd Coupon 5.96Avg Wtd Price 99.85
Top 20 Holdings as of 03-31-18 % Assets
Sprint Corporation 7.88% 09-15-23 1.30First Data Corporation 7% 12-01-23 0.81Univision Commmunications Inc. 5.12% 02-15-25 0.78Navient Corporation 6.75% 06-25-25 0.73Navient Corporation 6.5% 06-15-22 0.63.......................................................................................................Caesars Resort Collection LLC/CRC 5.25% 10-15-25 0.62Apx Group, Inc. 8.88% 12-01-22 0.61Building Materials Corporation of Am 6% 10-15-25 0.61Aercap Global Aviation Trust 6.5% 06-15-25 0.59Liberty Media Corporation 8.25% 02-01-30 0.59.......................................................................................................Sprint Capital Corporation 6.88% 11-15-28 0.59Adient Global Holdings Ltd 4.88% 08-15-26 0.58Credit Suisse Group AG 0.58HCA Inc. 6.5% 02-15-20 0.56First Data Corporation 5.75% 01-15-24 0.54.......................................................................................................Post Holdings Inc. 5% 08-15-26 0.54UBS Group AG 12-31-49 0.54West Street Merger Sub Inc 6.38% 09-01-25 0.54DISH DBS Corporation 5.88% 07-15-22 0.53DISH DBS Corporation 6.75% 06-01-21 0.53
.......................................................................................................Total Number of Stock Holdings 0Total Number of Bond Holdings 457Annual Turnover Ratio % 28.00Total Fund Assets ($mil) 723.93
Statistics as of 06-30-18 Port Avg Rel BC Aggr Rel Cat3 Yr Std Dev 4.16 0.00 0.82Beta 0.40 . 1.21Sharpe Ratio 0.73 0.00 1.52Alpha 2.68 . 1.29R-Squared 6.42 . 1.73
Morningstar Sectors as of 03-31-18 % Fund
⁄ Government 0.00› Corporate 92.81€ Securitized 0.00‹ Municipal 0.00fi Cash/Cash Equivalents 7.19± Other 0.00
Credit Analysis as of 03-31-18 % Bonds
-100 -50 0 50 100
AAA 0AA 0A 0BBB 2BB 47B 37Below B 8Not Rated 7
©2018 Morningstar, Inc., Morningstar Investment Profiles™ 312-696-6000. All rights reserved. The information contained herein: (1) is proprietary toMorningstar and/or its content providers; (2) may not be copied or distributed and (3) is not warranted to be accurate, complete or timely. Neither Morningstarnor its content providers are responsible for any damages or losses arising from any use of information. Past performance is no guarantee of futureperformance. Visit our investment website at www.morningstar.com.
ß®
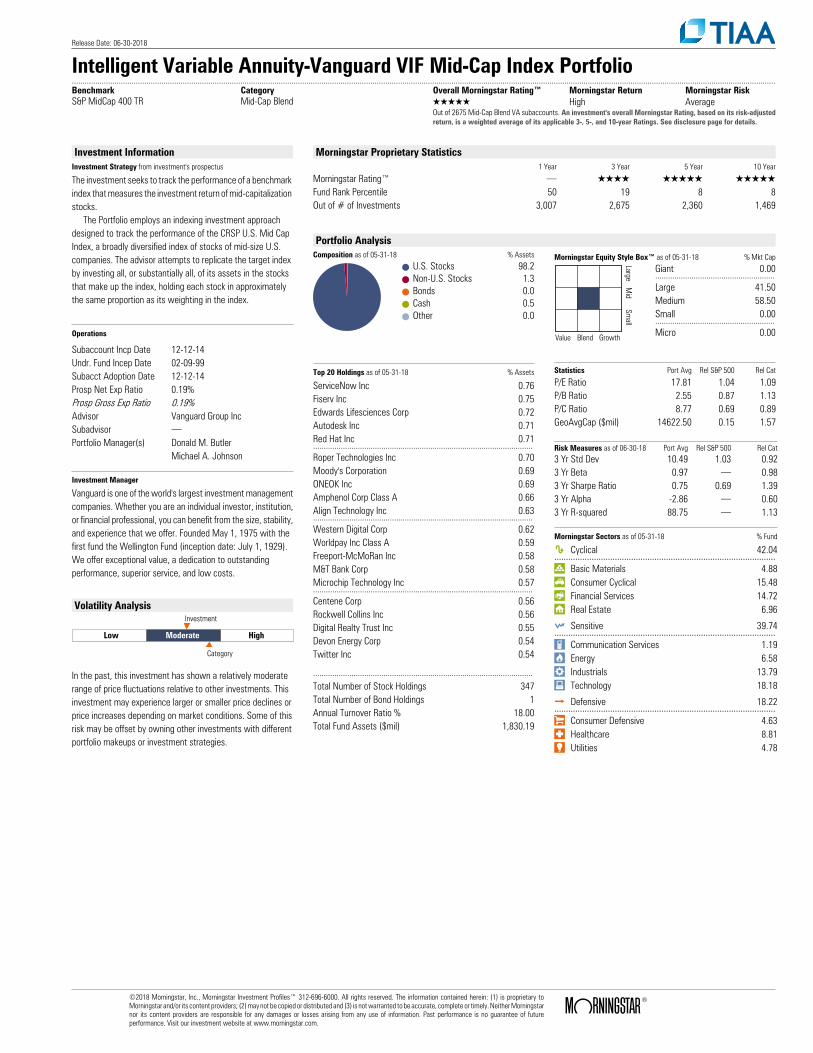
Release Date: 06-30-2018
Intelligent Variable Annuity-Vanguard VIF Mid-Cap Index Portfolio..........................................................................................................................................................................................................................................................................................................................................Benchmark Category Overall Morningstar Rating™ Morningstar Return Morningstar RiskS&P MidCap 400 TR Mid-Cap Blend QQQQQ High Average
Out of 2675 Mid-Cap Blend VA subaccounts. An investment's overall Morningstar Rating, based on its risk-adjustedreturn, is a weighted average of its applicable 3-, 5-, and 10-year Ratings. See disclosure page for details.
Investment InformationInvestment Strategy from investment's prospectus
The investment seeks to track the performance of a benchmark index that measures the investment return of mid-capitalization stocks. The Portfolio employs an indexing investment approach designed to track the performance of the CRSP U.S. Mid Cap Index, a broadly diversified index of stocks of mid-size U.S. companies. The advisor attempts to replicate the target index by investing all, or substantially all, of its assets in the stocks that make up the index, holding each stock in approximately the same proportion as its weighting in the index.
Operations
Subaccount Incp Date 12-12-14Undr. Fund Incep Date 02-09-99Subacct Adoption Date 12-12-14Prosp Net Exp Ratio 0.19%Prosp Gross Exp Ratio 0.19%Advisor Vanguard Group IncSubadvisor .Portfolio Manager(s) Donald M. Butler
Michael A. Johnson
Investment Manager
Vanguard is one of the world's largest investment managementcompanies. Whether you are an individual investor, institution,or financial professional, you can benefit from the size, stability,and experience that we offer. Founded May 1, 1975 with thefirst fund the Wellington Fund (inception date: July 1, 1929).We offer exceptional value, a dedication to outstandingperformance, superior service, and low costs.
Volatility Analysis
Low Moderate High
Investment
Category
In the past, this investment has shown a relatively moderaterange of price fluctuations relative to other investments. Thisinvestment may experience larger or smaller price declines orprice increases depending on market conditions. Some of thisrisk may be offset by owning other investments with differentportfolio makeups or investment strategies.
Morningstar Proprietary Statistics1 Year 3 Year 5 Year 10 Year
Morningstar Rating™ . QQQQ QQQQQ QQQQQFund Rank Percentile 50 19 8 8Out of # of Investments 3,007 2,675 2,360 1,469
Portfolio AnalysisComposition as of 05-31-18 % Assets
U.S. Stocks 98.2Non-U.S. Stocks 1.3Bonds 0.0Cash 0.5Other 0.0
Morningstar Equity Style Box™ as of 05-31-18 % Mkt Cap
LargeM
idSm
all
Value Blend Growth
Giant 0.00........................................................Large 41.50Medium 58.50Small 0.00........................................................Micro 0.00
Top 20 Holdings as of 05-31-18 % Assets
ServiceNow Inc 0.76Fiserv Inc 0.75Edwards Lifesciences Corp 0.72Autodesk Inc 0.71Red Hat Inc 0.71.......................................................................................................Roper Technologies Inc 0.70Moody's Corporation 0.69ONEOK Inc 0.69Amphenol Corp Class A 0.66Align Technology Inc 0.63.......................................................................................................Western Digital Corp 0.62Worldpay Inc Class A 0.59Freeport-McMoRan Inc 0.58M&T Bank Corp 0.58Microchip Technology Inc 0.57.......................................................................................................Centene Corp 0.56Rockwell Collins Inc 0.56Digital Realty Trust Inc 0.55Devon Energy Corp 0.54Twitter Inc 0.54
.......................................................................................................Total Number of Stock Holdings 347Total Number of Bond Holdings 1Annual Turnover Ratio % 18.00Total Fund Assets ($mil) 1,830.19
Statistics Port Avg Rel S&P 500 Rel Cat
P/E Ratio 17.81 1.04 1.09P/B Ratio 2.55 0.87 1.13P/C Ratio 8.77 0.69 0.89GeoAvgCap ($mil) 14622.50 0.15 1.57
Risk Measures as of 06-30-18 Port Avg Rel S&P 500 Rel Cat3 Yr Std Dev 10.49 1.03 0.923 Yr Beta 0.97 . 0.983 Yr Sharpe Ratio 0.75 0.69 1.393 Yr Alpha -2.86 . 0.603 Yr R-squared 88.75 . 1.13
Morningstar Sectors as of 05-31-18 % Fund
h Cyclical 42.04...............................................................................................r Basic Materials 4.88t Consumer Cyclical 15.48y Financial Services 14.72u Real Estate 6.96
j Sensitive 39.74...............................................................................................i Communication Services 1.19o Energy 6.58p Industrials 13.79a Technology 18.18
k Defensive 18.22...............................................................................................s Consumer Defensive 4.63d Healthcare 8.81f Utilities 4.78
©2018 Morningstar, Inc., Morningstar Investment Profiles™ 312-696-6000. All rights reserved. The information contained herein: (1) is proprietary toMorningstar and/or its content providers; (2) may not be copied or distributed and (3) is not warranted to be accurate, complete or timely. Neither Morningstarnor its content providers are responsible for any damages or losses arising from any use of information. Past performance is no guarantee of futureperformance. Visit our investment website at www.morningstar.com.
ß®
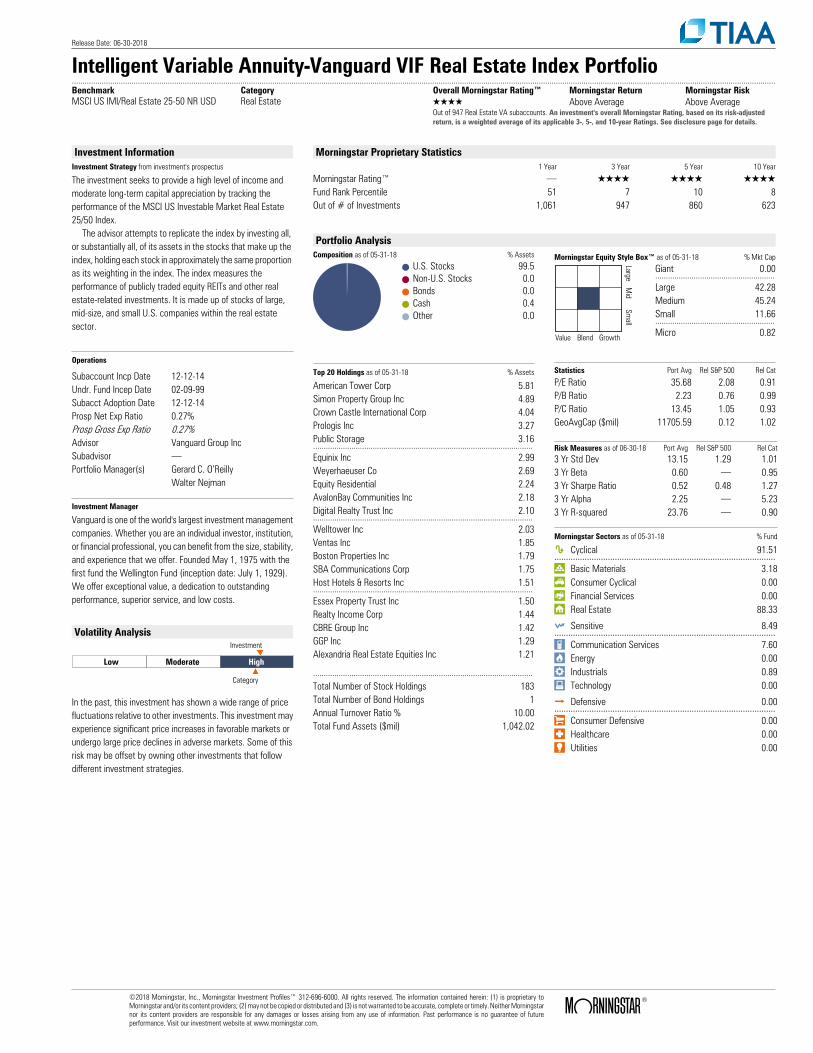
Release Date: 06-30-2018
Intelligent Variable Annuity-Vanguard VIF Real Estate Index Portfolio..........................................................................................................................................................................................................................................................................................................................................Benchmark Category Overall Morningstar Rating™ Morningstar Return Morningstar RiskMSCI US IMI/Real Estate 25-50 NR USD Real Estate QQQQ Above Average Above Average
Out of 947 Real Estate VA subaccounts. An investment's overall Morningstar Rating, based on its risk-adjustedreturn, is a weighted average of its applicable 3-, 5-, and 10-year Ratings. See disclosure page for details.
Investment InformationInvestment Strategy from investment's prospectus
The investment seeks to provide a high level of income and moderate long-term capital appreciation by tracking the performance of the MSCI US Investable Market Real Estate 25/50 Index. The advisor attempts to replicate the index by investing all, or substantially all, of its assets in the stocks that make up the index, holding each stock in approximately the same proportion as its weighting in the index. The index measures the performance of publicly traded equity REITs and other real estate-related investments. It is made up of stocks of large, mid-size, and small U.S. companies within the real estate sector.
Operations
Subaccount Incp Date 12-12-14Undr. Fund Incep Date 02-09-99Subacct Adoption Date 12-12-14Prosp Net Exp Ratio 0.27%Prosp Gross Exp Ratio 0.27%Advisor Vanguard Group IncSubadvisor .Portfolio Manager(s) Gerard C. O’Reilly
Walter Nejman
Investment Manager
Vanguard is one of the world's largest investment managementcompanies. Whether you are an individual investor, institution,or financial professional, you can benefit from the size, stability,and experience that we offer. Founded May 1, 1975 with thefirst fund the Wellington Fund (inception date: July 1, 1929).We offer exceptional value, a dedication to outstandingperformance, superior service, and low costs.
Volatility Analysis
Low Moderate High
Investment
Category
In the past, this investment has shown a wide range of pricefluctuations relative to other investments. This investment mayexperience significant price increases in favorable markets orundergo large price declines in adverse markets. Some of thisrisk may be offset by owning other investments that followdifferent investment strategies.
Morningstar Proprietary Statistics1 Year 3 Year 5 Year 10 Year
Morningstar Rating™ . QQQQ QQQQ QQQQFund Rank Percentile 51 7 10 8Out of # of Investments 1,061 947 860 623
Portfolio AnalysisComposition as of 05-31-18 % Assets
U.S. Stocks 99.5Non-U.S. Stocks 0.0Bonds 0.0Cash 0.4Other 0.0
Morningstar Equity Style Box™ as of 05-31-18 % Mkt Cap
LargeM
idSm
all
Value Blend Growth
Giant 0.00........................................................Large 42.28Medium 45.24Small 11.66........................................................Micro 0.82
Top 20 Holdings as of 05-31-18 % Assets
American Tower Corp 5.81Simon Property Group Inc 4.89Crown Castle International Corp 4.04Prologis Inc 3.27Public Storage 3.16.......................................................................................................Equinix Inc 2.99Weyerhaeuser Co 2.69Equity Residential 2.24AvalonBay Communities Inc 2.18Digital Realty Trust Inc 2.10.......................................................................................................Welltower Inc 2.03Ventas Inc 1.85Boston Properties Inc 1.79SBA Communications Corp 1.75Host Hotels & Resorts Inc 1.51.......................................................................................................Essex Property Trust Inc 1.50Realty Income Corp 1.44CBRE Group Inc 1.42GGP Inc 1.29Alexandria Real Estate Equities Inc 1.21
.......................................................................................................Total Number of Stock Holdings 183Total Number of Bond Holdings 1Annual Turnover Ratio % 10.00Total Fund Assets ($mil) 1,042.02
Statistics Port Avg Rel S&P 500 Rel Cat
P/E Ratio 35.68 2.08 0.91P/B Ratio 2.23 0.76 0.99P/C Ratio 13.45 1.05 0.93GeoAvgCap ($mil) 11705.59 0.12 1.02
Risk Measures as of 06-30-18 Port Avg Rel S&P 500 Rel Cat3 Yr Std Dev 13.15 1.29 1.013 Yr Beta 0.60 . 0.953 Yr Sharpe Ratio 0.52 0.48 1.273 Yr Alpha 2.25 . 5.233 Yr R-squared 23.76 . 0.90
Morningstar Sectors as of 05-31-18 % Fund
h Cyclical 91.51...............................................................................................r Basic Materials 3.18t Consumer Cyclical 0.00y Financial Services 0.00u Real Estate 88.33
j Sensitive 8.49...............................................................................................i Communication Services 7.60o Energy 0.00p Industrials 0.89a Technology 0.00
k Defensive 0.00...............................................................................................s Consumer Defensive 0.00d Healthcare 0.00f Utilities 0.00
©2018 Morningstar, Inc., Morningstar Investment Profiles™ 312-696-6000. All rights reserved. The information contained herein: (1) is proprietary toMorningstar and/or its content providers; (2) may not be copied or distributed and (3) is not warranted to be accurate, complete or timely. Neither Morningstarnor its content providers are responsible for any damages or losses arising from any use of information. Past performance is no guarantee of futureperformance. Visit our investment website at www.morningstar.com.
ß®
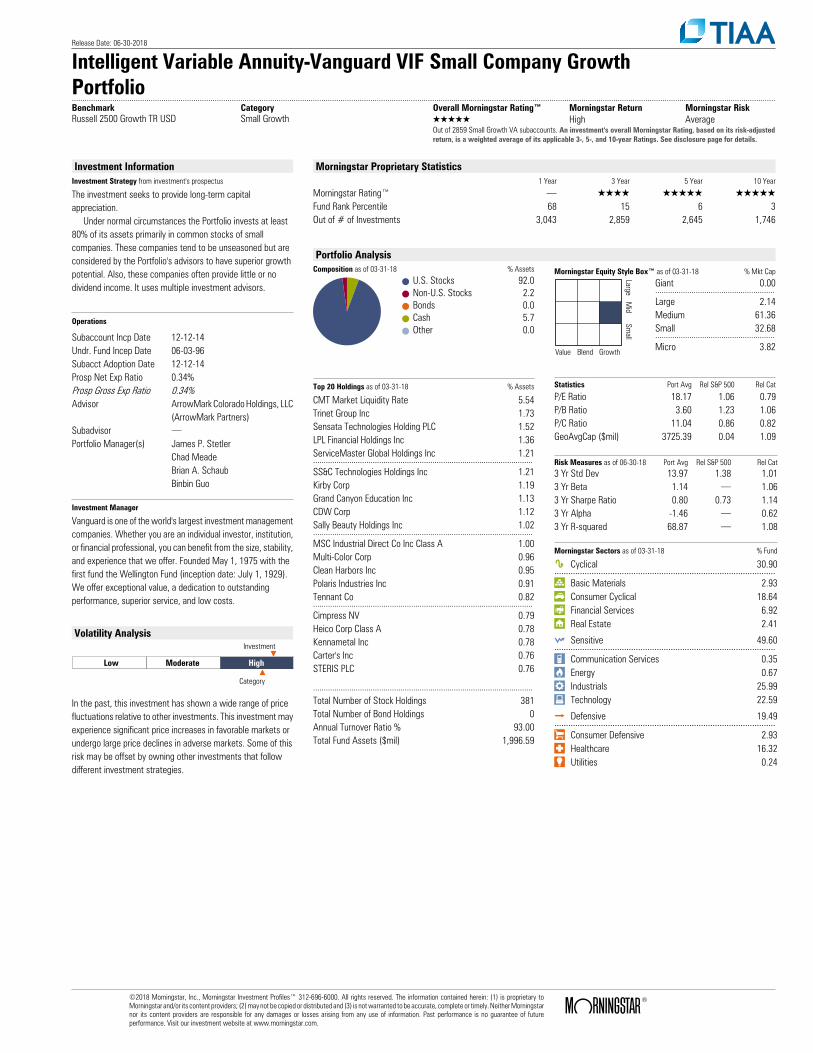
Release Date: 06-30-2018
Intelligent Variable Annuity-Vanguard VIF Small Company GrowthPortfolio..........................................................................................................................................................................................................................................................................................................................................Benchmark Category Overall Morningstar Rating™ Morningstar Return Morningstar RiskRussell 2500 Growth TR USD Small Growth QQQQQ High Average
Out of 2859 Small Growth VA subaccounts. An investment's overall Morningstar Rating, based on its risk-adjustedreturn, is a weighted average of its applicable 3-, 5-, and 10-year Ratings. See disclosure page for details.
Investment InformationInvestment Strategy from investment's prospectus
The investment seeks to provide long-term capital appreciation. Under normal circumstances the Portfolio invests at least 80% of its assets primarily in common stocks of small companies. These companies tend to be unseasoned but are considered by the Portfolio's advisors to have superior growth potential. Also, these companies often provide little or no dividend income. It uses multiple investment advisors.
Operations
Subaccount Incp Date 12-12-14Undr. Fund Incep Date 06-03-96Subacct Adoption Date 12-12-14Prosp Net Exp Ratio 0.34%Prosp Gross Exp Ratio 0.34%Advisor ArrowMark Colorado Holdings, LLC
(ArrowMark Partners)Subadvisor .Portfolio Manager(s) James P. Stetler
Chad MeadeBrian A. SchaubBinbin Guo
Investment Manager
Vanguard is one of the world's largest investment managementcompanies. Whether you are an individual investor, institution,or financial professional, you can benefit from the size, stability,and experience that we offer. Founded May 1, 1975 with thefirst fund the Wellington Fund (inception date: July 1, 1929).We offer exceptional value, a dedication to outstandingperformance, superior service, and low costs.
Volatility Analysis
Low Moderate High
Investment
Category
In the past, this investment has shown a wide range of pricefluctuations relative to other investments. This investment mayexperience significant price increases in favorable markets orundergo large price declines in adverse markets. Some of thisrisk may be offset by owning other investments that followdifferent investment strategies.
Morningstar Proprietary Statistics1 Year 3 Year 5 Year 10 Year
Morningstar Rating™ . QQQQ QQQQQ QQQQQFund Rank Percentile 68 15 6 3Out of # of Investments 3,043 2,859 2,645 1,746
Portfolio AnalysisComposition as of 03-31-18 % Assets
U.S. Stocks 92.0Non-U.S. Stocks 2.2Bonds 0.0Cash 5.7Other 0.0
Morningstar Equity Style Box™ as of 03-31-18 % Mkt Cap
LargeM
idSm
all
Value Blend Growth
Giant 0.00........................................................Large 2.14Medium 61.36Small 32.68........................................................Micro 3.82
Top 20 Holdings as of 03-31-18 % Assets
CMT Market Liquidity Rate 5.54Trinet Group Inc 1.73Sensata Technologies Holding PLC 1.52LPL Financial Holdings Inc 1.36ServiceMaster Global Holdings Inc 1.21.......................................................................................................SS&C Technologies Holdings Inc 1.21Kirby Corp 1.19Grand Canyon Education Inc 1.13CDW Corp 1.12Sally Beauty Holdings Inc 1.02.......................................................................................................MSC Industrial Direct Co Inc Class A 1.00Multi-Color Corp 0.96Clean Harbors Inc 0.95Polaris Industries Inc 0.91Tennant Co 0.82.......................................................................................................Cimpress NV 0.79Heico Corp Class A 0.78Kennametal Inc 0.78Carter's Inc 0.76STERIS PLC 0.76
.......................................................................................................Total Number of Stock Holdings 381Total Number of Bond Holdings 0Annual Turnover Ratio % 93.00Total Fund Assets ($mil) 1,996.59
Statistics Port Avg Rel S&P 500 Rel Cat
P/E Ratio 18.17 1.06 0.79P/B Ratio 3.60 1.23 1.06P/C Ratio 11.04 0.86 0.82GeoAvgCap ($mil) 3725.39 0.04 1.09
Risk Measures as of 06-30-18 Port Avg Rel S&P 500 Rel Cat3 Yr Std Dev 13.97 1.38 1.013 Yr Beta 1.14 . 1.063 Yr Sharpe Ratio 0.80 0.73 1.143 Yr Alpha -1.46 . 0.623 Yr R-squared 68.87 . 1.08
Morningstar Sectors as of 03-31-18 % Fund
h Cyclical 30.90...............................................................................................r Basic Materials 2.93t Consumer Cyclical 18.64y Financial Services 6.92u Real Estate 2.41
j Sensitive 49.60...............................................................................................i Communication Services 0.35o Energy 0.67p Industrials 25.99a Technology 22.59
k Defensive 19.49...............................................................................................s Consumer Defensive 2.93d Healthcare 16.32f Utilities 0.24
©2018 Morningstar, Inc., Morningstar Investment Profiles™ 312-696-6000. All rights reserved. The information contained herein: (1) is proprietary toMorningstar and/or its content providers; (2) may not be copied or distributed and (3) is not warranted to be accurate, complete or timely. Neither Morningstarnor its content providers are responsible for any damages or losses arising from any use of information. Past performance is no guarantee of futureperformance. Visit our investment website at www.morningstar.com.
ß®
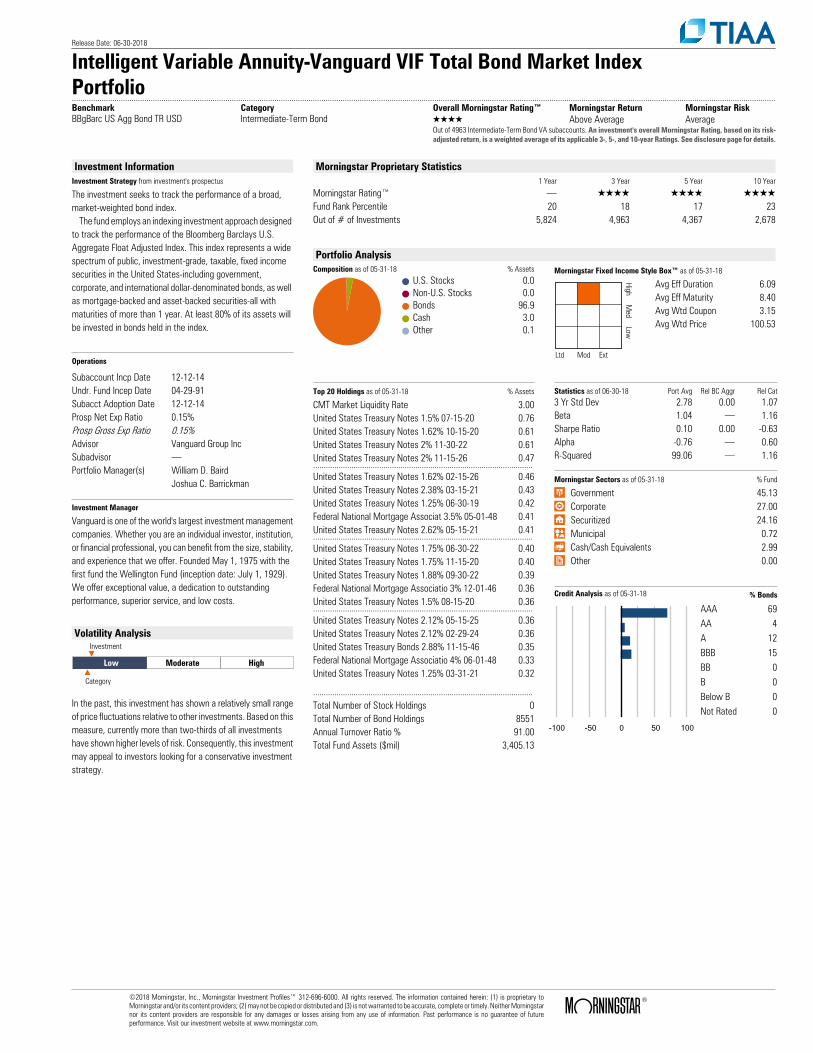
Release Date: 06-30-2018
Intelligent Variable Annuity-Vanguard VIF Total Bond Market IndexPortfolio..........................................................................................................................................................................................................................................................................................................................................Benchmark Category Overall Morningstar Rating™ Morningstar Return Morningstar RiskBBgBarc US Agg Bond TR USD Intermediate-Term Bond QQQQ Above Average Average
Out of 4963 Intermediate-Term Bond VA subaccounts. An investment's overall Morningstar Rating, based on its risk-adjusted return, is a weighted average of its applicable 3-, 5-, and 10-year Ratings. See disclosure page for details.
Investment InformationInvestment Strategy from investment's prospectus
The investment seeks to track the performance of a broad, market-weighted bond index. The fund employs an indexing investment approach designed to track the performance of the Bloomberg Barclays U.S. Aggregate Float Adjusted Index. This index represents a wide spectrum of public, investment-grade, taxable, fixed income securities in the United States-including government, corporate, and international dollar-denominated bonds, as well as mortgage-backed and asset-backed securities-all with maturities of more than 1 year. At least 80% of its assets will be invested in bonds held in the index.
Operations
Subaccount Incp Date 12-12-14Undr. Fund Incep Date 04-29-91Subacct Adoption Date 12-12-14Prosp Net Exp Ratio 0.15%Prosp Gross Exp Ratio 0.15%Advisor Vanguard Group IncSubadvisor .Portfolio Manager(s) William D. Baird
Joshua C. Barrickman
Investment Manager
Vanguard is one of the world's largest investment managementcompanies. Whether you are an individual investor, institution,or financial professional, you can benefit from the size, stability,and experience that we offer. Founded May 1, 1975 with thefirst fund the Wellington Fund (inception date: July 1, 1929).We offer exceptional value, a dedication to outstandingperformance, superior service, and low costs.
Volatility Analysis
Low Moderate High
Investment
Category
In the past, this investment has shown a relatively small rangeof price fluctuations relative to other investments. Based on thismeasure, currently more than two-thirds of all investmentshave shown higher levels of risk. Consequently, this investmentmay appeal to investors looking for a conservative investmentstrategy.
Morningstar Proprietary Statistics1 Year 3 Year 5 Year 10 Year
Morningstar Rating™ . QQQQ QQQQ QQQQFund Rank Percentile 20 18 17 23Out of # of Investments 5,824 4,963 4,367 2,678
Portfolio AnalysisComposition as of 05-31-18 % Assets
U.S. Stocks 0.0Non-U.S. Stocks 0.0Bonds 96.9Cash 3.0Other 0.1
Morningstar Fixed Income Style Box™ as of 05-31-18
HighM
edLow
Ltd Mod Ext
Avg Eff Duration 6.09Avg Eff Maturity 8.40Avg Wtd Coupon 3.15Avg Wtd Price 100.53
Top 20 Holdings as of 05-31-18 % Assets
CMT Market Liquidity Rate 3.00United States Treasury Notes 1.5% 07-15-20 0.76United States Treasury Notes 1.62% 10-15-20 0.61United States Treasury Notes 2% 11-30-22 0.61United States Treasury Notes 2% 11-15-26 0.47.......................................................................................................United States Treasury Notes 1.62% 02-15-26 0.46United States Treasury Notes 2.38% 03-15-21 0.43United States Treasury Notes 1.25% 06-30-19 0.42Federal National Mortgage Associat 3.5% 05-01-48 0.41United States Treasury Notes 2.62% 05-15-21 0.41.......................................................................................................United States Treasury Notes 1.75% 06-30-22 0.40United States Treasury Notes 1.75% 11-15-20 0.40United States Treasury Notes 1.88% 09-30-22 0.39Federal National Mortgage Associatio 3% 12-01-46 0.36United States Treasury Notes 1.5% 08-15-20 0.36.......................................................................................................United States Treasury Notes 2.12% 05-15-25 0.36United States Treasury Notes 2.12% 02-29-24 0.36United States Treasury Bonds 2.88% 11-15-46 0.35Federal National Mortgage Associatio 4% 06-01-48 0.33United States Treasury Notes 1.25% 03-31-21 0.32
.......................................................................................................Total Number of Stock Holdings 0Total Number of Bond Holdings 8551Annual Turnover Ratio % 91.00Total Fund Assets ($mil) 3,405.13
Statistics as of 06-30-18 Port Avg Rel BC Aggr Rel Cat3 Yr Std Dev 2.78 0.00 1.07Beta 1.04 . 1.16Sharpe Ratio 0.10 0.00 -0.63Alpha -0.76 . 0.60R-Squared 99.06 . 1.16
Morningstar Sectors as of 05-31-18 % Fund
⁄ Government 45.13› Corporate 27.00€ Securitized 24.16‹ Municipal 0.72fi Cash/Cash Equivalents 2.99± Other 0.00
Credit Analysis as of 05-31-18 % Bonds
-100 -50 0 50 100
AAA 69AA 4A 12BBB 15BB 0B 0Below B 0Not Rated 0
©2018 Morningstar, Inc., Morningstar Investment Profiles™ 312-696-6000. All rights reserved. The information contained herein: (1) is proprietary toMorningstar and/or its content providers; (2) may not be copied or distributed and (3) is not warranted to be accurate, complete or timely. Neither Morningstarnor its content providers are responsible for any damages or losses arising from any use of information. Past performance is no guarantee of futureperformance. Visit our investment website at www.morningstar.com.
ß®
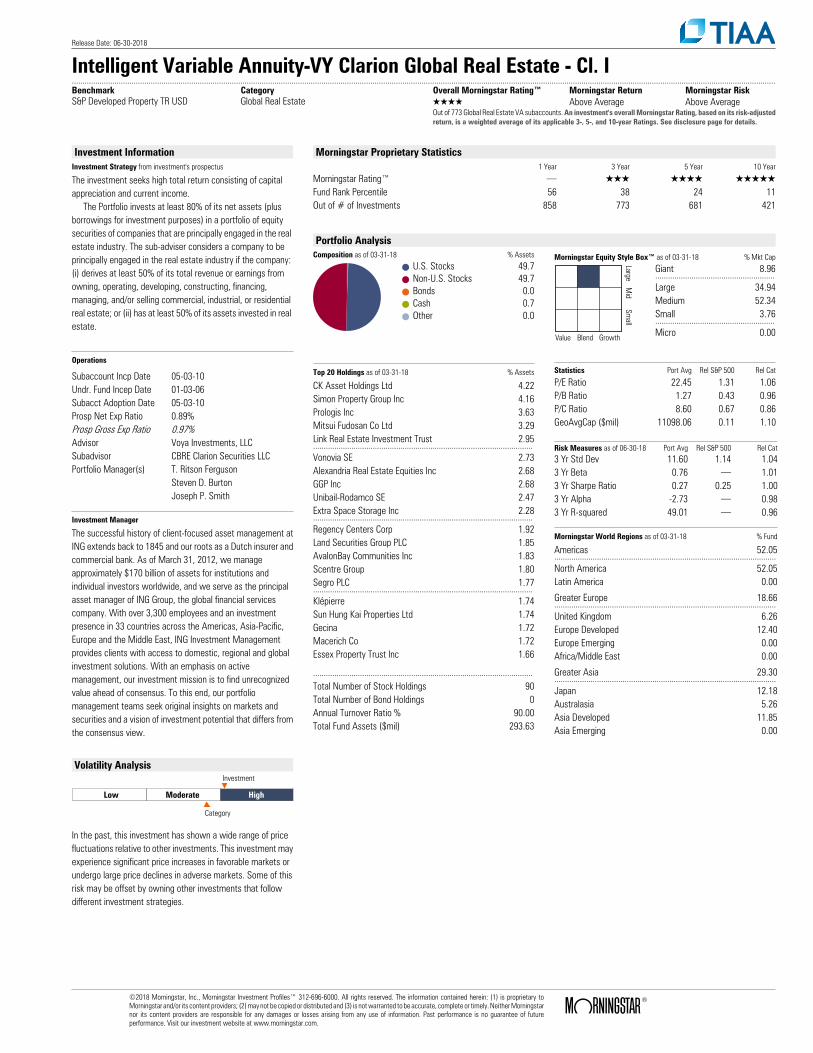
Release Date: 06-30-2018
Intelligent Variable Annuity-VY Clarion Global Real Estate - Cl. I..........................................................................................................................................................................................................................................................................................................................................Benchmark Category Overall Morningstar Rating™ Morningstar Return Morningstar RiskS&P Developed Property TR USD Global Real Estate QQQQ Above Average Above Average
Out of 773 Global Real Estate VA subaccounts. An investment's overall Morningstar Rating, based on its risk-adjustedreturn, is a weighted average of its applicable 3-, 5-, and 10-year Ratings. See disclosure page for details.
Investment InformationInvestment Strategy from investment's prospectus
The investment seeks high total return consisting of capital appreciation and current income. The Portfolio invests at least 80% of its net assets (plus borrowings for investment purposes) in a portfolio of equity securities of companies that are principally engaged in the real estate industry. The sub-adviser considers a company to be principally engaged in the real estate industry if the company: (i) derives at least 50% of its total revenue or earnings from owning, operating, developing, constructing, financing, managing, and/or selling commercial, industrial, or residential real estate; or (ii) has at least 50% of its assets invested in real estate.
Operations
Subaccount Incp Date 05-03-10Undr. Fund Incep Date 01-03-06Subacct Adoption Date 05-03-10Prosp Net Exp Ratio 0.89%Prosp Gross Exp Ratio 0.97%Advisor Voya Investments, LLCSubadvisor CBRE Clarion Securities LLCPortfolio Manager(s) T. Ritson Ferguson
Steven D. BurtonJoseph P. Smith
Investment Manager
The successful history of client-focused asset management atING extends back to 1845 and our roots as a Dutch insurer andcommercial bank. As of March 31, 2012, we manageapproximately $170 billion of assets for institutions andindividual investors worldwide, and we serve as the principalasset manager of ING Group, the global financial servicescompany. With over 3,300 employees and an investmentpresence in 33 countries across the Americas, Asia-Pacific,Europe and the Middle East, ING Investment Managementprovides clients with access to domestic, regional and globalinvestment solutions. With an emphasis on activemanagement, our investment mission is to find unrecognizedvalue ahead of consensus. To this end, our portfoliomanagement teams seek original insights on markets andsecurities and a vision of investment potential that differs fromthe consensus view.
Volatility Analysis
Low Moderate High
Investment
Category
In the past, this investment has shown a wide range of pricefluctuations relative to other investments. This investment mayexperience significant price increases in favorable markets orundergo large price declines in adverse markets. Some of thisrisk may be offset by owning other investments that followdifferent investment strategies.
Morningstar Proprietary Statistics1 Year 3 Year 5 Year 10 Year
Morningstar Rating™ . QQQ QQQQ QQQQQFund Rank Percentile 56 38 24 11Out of # of Investments 858 773 681 421
Portfolio AnalysisComposition as of 03-31-18 % Assets
U.S. Stocks 49.7Non-U.S. Stocks 49.7Bonds 0.0Cash 0.7Other 0.0
Morningstar Equity Style Box™ as of 03-31-18 % Mkt Cap
LargeM
idSm
all
Value Blend Growth
Giant 8.96........................................................Large 34.94Medium 52.34Small 3.76........................................................Micro 0.00
Top 20 Holdings as of 03-31-18 % Assets
CK Asset Holdings Ltd 4.22Simon Property Group Inc 4.16Prologis Inc 3.63Mitsui Fudosan Co Ltd 3.29Link Real Estate Investment Trust 2.95.......................................................................................................Vonovia SE 2.73Alexandria Real Estate Equities Inc 2.68GGP Inc 2.68Unibail-Rodamco SE 2.47Extra Space Storage Inc 2.28.......................................................................................................Regency Centers Corp 1.92Land Securities Group PLC 1.85AvalonBay Communities Inc 1.83Scentre Group 1.80Segro PLC 1.77.......................................................................................................Klépierre 1.74Sun Hung Kai Properties Ltd 1.74Gecina 1.72Macerich Co 1.72Essex Property Trust Inc 1.66
.......................................................................................................Total Number of Stock Holdings 90Total Number of Bond Holdings 0Annual Turnover Ratio % 90.00Total Fund Assets ($mil) 293.63
Statistics Port Avg Rel S&P 500 Rel Cat
P/E Ratio 22.45 1.31 1.06P/B Ratio 1.27 0.43 0.96P/C Ratio 8.60 0.67 0.86GeoAvgCap ($mil) 11098.06 0.11 1.10
Risk Measures as of 06-30-18 Port Avg Rel S&P 500 Rel Cat3 Yr Std Dev 11.60 1.14 1.043 Yr Beta 0.76 . 1.013 Yr Sharpe Ratio 0.27 0.25 1.003 Yr Alpha -2.73 . 0.983 Yr R-squared 49.01 . 0.96
Morningstar World Regions as of 03-31-18 % Fund
Americas 52.05........................................................................................................North America 52.05Latin America 0.00
Greater Europe 18.66........................................................................................................United Kingdom 6.26Europe Developed 12.40Europe Emerging 0.00Africa/Middle East 0.00
Greater Asia 29.30........................................................................................................Japan 12.18Australasia 5.26Asia Developed 11.85Asia Emerging 0.00
©2018 Morningstar, Inc., Morningstar Investment Profiles™ 312-696-6000. All rights reserved. The information contained herein: (1) is proprietary toMorningstar and/or its content providers; (2) may not be copied or distributed and (3) is not warranted to be accurate, complete or timely. Neither Morningstarnor its content providers are responsible for any damages or losses arising from any use of information. Past performance is no guarantee of futureperformance. Visit our investment website at www.morningstar.com.
ß®

Release Date: 06-30-2018
Intelligent Variable Annuity-Wanger International..........................................................................................................................................................................................................................................................................................................................................Benchmark Category Overall Morningstar Rating™ Morningstar Return Morningstar RiskS&P Global Ex US Small TR USD Foreign Small/Mid Growth QQQQQ High Average
Out of 190 Foreign Small/Mid Growth VA subaccounts. An investment's overall Morningstar Rating, based on its risk-adjusted return, is a weighted average of its applicable 3-, 5-, and 10-year Ratings. See disclosure page for details.
Investment InformationInvestment Strategy from investment's prospectus
The investment seeks long-term capital appreciation. Under normal circumstances, the fund invests at least 65% of its net assets in foreign companies in developed markets (for example, Japan, Canada and the United Kingdom) and in emerging markets (for example, China, India and Brazil). Under normal circumstances, the fund invests a majority of its net assets in the common stock of small- and mid-sized companies with market capitalizations under $5 billion at the time of initial investment.
Operations
Subaccount Incp Date 02-05-08Undr. Fund Incep Date 05-03-95Subacct Adoption Date 02-05-08Prosp Net Exp Ratio 1.15%Prosp Gross Exp Ratio 1.20%Advisor Columbia Wanger Asset
Management LLCSubadvisor .Portfolio Manager(s) Louis J. Mendes
Tae Han (Simon) Kim
Investment Manager
Adherence to the Growth at a Reasonable Price (GARP) stylehas caused the firm to correctly react to valuation extremes inthe market. Experienced team of professionals following aresearch-driven investment process that blends bottom-up andtop-down analysis. Consistent investment process sinceinception of Columbia Acorn Fund in 1970. Columbia WangerAsset Management, L.P. is a registered investment adviser andan indirect, wholly owned subsidiary of Bank of AmericaCorporation. CWAM is a part of Columbia Management.
Volatility Analysis
Low Moderate High
Investment
Category
In the past, this investment has shown a wide range of pricefluctuations relative to other investments. This investment mayexperience significant price increases in favorable markets orundergo large price declines in adverse markets. Some of thisrisk may be offset by owning other investments that followdifferent investment strategies.
Morningstar Proprietary Statistics1 Year 3 Year 5 Year 10 Year
Morningstar Rating™ . QQQQQ QQQQ QQQQQFund Rank Percentile 6 5 27 6Out of # of Investments 194 190 187 123
Portfolio AnalysisComposition as of 05-31-18 % Assets
U.S. Stocks 1.1Non-U.S. Stocks 97.9Bonds 0.0Cash 0.1Other 1.0
Morningstar Equity Style Box™ as of 05-31-18 % Mkt Cap
LargeM
idSm
all
Value Blend Growth
Giant 0.00........................................................Large 7.56Medium 63.63Small 26.99........................................................Micro 1.82
Top 20 Holdings as of 05-31-18 % Assets
SimCorp A/S 2.66Nemetschek SE 2.62Brembo SpA 1.76Kindred Group PLC DR 1.65NagaCorp Ltd 1.61.......................................................................................................WH Smith PLC 1.57Vitasoy International Holdings Ltd 1.54Atea ASA 1.51Rightmove PLC 1.45Hastings Group Holdings PLC 1.40.......................................................................................................Restaurant Brands NZ Ltd 1.40Ascential PLC 1.36CAE Inc 1.35Domino's Pizza Group PLC 1.35Fuji Oil Holdings Inc 1.35.......................................................................................................Seria Co Ltd 1.35cocokara fine Inc 1.34Industria Macchine Automatiche SpA 1.33Sweco AB B 1.29Aalberts Industries NV 1.24
.......................................................................................................Total Number of Stock Holdings 109Total Number of Bond Holdings 0Annual Turnover Ratio % 55.00Total Fund Assets ($mil) 537.37
Statistics Port Avg Rel S&P 500 Rel Cat
P/E Ratio 20.59 1.20 1.08P/B Ratio 3.23 1.10 1.25P/C Ratio 13.85 1.08 1.32GeoAvgCap ($mil) 2397.48 0.02 0.40
Risk Measures as of 06-30-18 Port Avg Rel S&P 500 Rel Cat3 Yr Std Dev 11.58 1.14 0.963 Yr Beta 0.85 . 0.973 Yr Sharpe Ratio 0.54 0.50 1.353 Yr Alpha 2.04 . 6.383 Yr R-squared 80.24 . 1.00
Morningstar World Regions as of 05-31-18 % Fund
Americas 6.67........................................................................................................North America 5.52Latin America 1.15
Greater Europe 46.55........................................................................................................United Kingdom 13.22Europe Developed 29.34Europe Emerging 1.70Africa/Middle East 2.29
Greater Asia 46.79........................................................................................................Japan 22.41Australasia 2.37Asia Developed 11.13Asia Emerging 10.86
©2018 Morningstar, Inc., Morningstar Investment Profiles™ 312-696-6000. All rights reserved. The information contained herein: (1) is proprietary toMorningstar and/or its content providers; (2) may not be copied or distributed and (3) is not warranted to be accurate, complete or timely. Neither Morningstarnor its content providers are responsible for any damages or losses arising from any use of information. Past performance is no guarantee of futureperformance. Visit our investment website at www.morningstar.com.
ß®
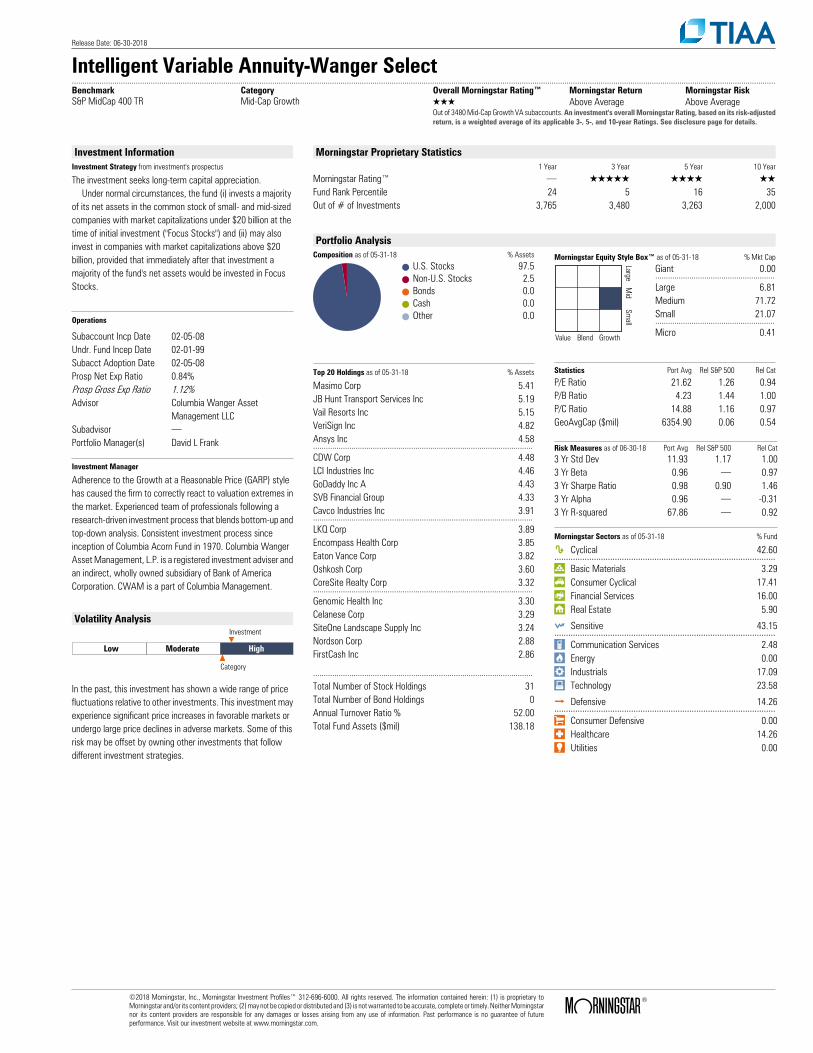
Release Date: 06-30-2018
Intelligent Variable Annuity-Wanger Select..........................................................................................................................................................................................................................................................................................................................................Benchmark Category Overall Morningstar Rating™ Morningstar Return Morningstar RiskS&P MidCap 400 TR Mid-Cap Growth QQQ Above Average Above Average
Out of 3480 Mid-Cap Growth VA subaccounts. An investment's overall Morningstar Rating, based on its risk-adjustedreturn, is a weighted average of its applicable 3-, 5-, and 10-year Ratings. See disclosure page for details.
Investment InformationInvestment Strategy from investment's prospectus
The investment seeks long-term capital appreciation. Under normal circumstances, the fund (i) invests a majority of its net assets in the common stock of small- and mid-sized companies with market capitalizations under $20 billion at the time of initial investment ("Focus Stocks") and (ii) may also invest in companies with market capitalizations above $20 billion, provided that immediately after that investment a majority of the fund's net assets would be invested in Focus Stocks.
Operations
Subaccount Incp Date 02-05-08Undr. Fund Incep Date 02-01-99Subacct Adoption Date 02-05-08Prosp Net Exp Ratio 0.84%Prosp Gross Exp Ratio 1.12%Advisor Columbia Wanger Asset
Management LLCSubadvisor .Portfolio Manager(s) David L Frank
Investment Manager
Adherence to the Growth at a Reasonable Price (GARP) stylehas caused the firm to correctly react to valuation extremes inthe market. Experienced team of professionals following aresearch-driven investment process that blends bottom-up andtop-down analysis. Consistent investment process sinceinception of Columbia Acorn Fund in 1970. Columbia WangerAsset Management, L.P. is a registered investment adviser andan indirect, wholly owned subsidiary of Bank of AmericaCorporation. CWAM is a part of Columbia Management.
Volatility Analysis
Low Moderate High
Investment
Category
In the past, this investment has shown a wide range of pricefluctuations relative to other investments. This investment mayexperience significant price increases in favorable markets orundergo large price declines in adverse markets. Some of thisrisk may be offset by owning other investments that followdifferent investment strategies.
Morningstar Proprietary Statistics1 Year 3 Year 5 Year 10 Year
Morningstar Rating™ . QQQQQ QQQQ QQFund Rank Percentile 24 5 16 35Out of # of Investments 3,765 3,480 3,263 2,000
Portfolio AnalysisComposition as of 05-31-18 % Assets
U.S. Stocks 97.5Non-U.S. Stocks 2.5Bonds 0.0Cash 0.0Other 0.0
Morningstar Equity Style Box™ as of 05-31-18 % Mkt Cap
LargeM
idSm
all
Value Blend Growth
Giant 0.00........................................................Large 6.81Medium 71.72Small 21.07........................................................Micro 0.41
Top 20 Holdings as of 05-31-18 % Assets
Masimo Corp 5.41JB Hunt Transport Services Inc 5.19Vail Resorts Inc 5.15VeriSign Inc 4.82Ansys Inc 4.58.......................................................................................................CDW Corp 4.48LCI Industries Inc 4.46GoDaddy Inc A 4.43SVB Financial Group 4.33Cavco Industries Inc 3.91.......................................................................................................LKQ Corp 3.89Encompass Health Corp 3.85Eaton Vance Corp 3.82Oshkosh Corp 3.60CoreSite Realty Corp 3.32.......................................................................................................Genomic Health Inc 3.30Celanese Corp 3.29SiteOne Landscape Supply Inc 3.24Nordson Corp 2.88FirstCash Inc 2.86
.......................................................................................................Total Number of Stock Holdings 31Total Number of Bond Holdings 0Annual Turnover Ratio % 52.00Total Fund Assets ($mil) 138.18
Statistics Port Avg Rel S&P 500 Rel Cat
P/E Ratio 21.62 1.26 0.94P/B Ratio 4.23 1.44 1.00P/C Ratio 14.88 1.16 0.97GeoAvgCap ($mil) 6354.90 0.06 0.54
Risk Measures as of 06-30-18 Port Avg Rel S&P 500 Rel Cat3 Yr Std Dev 11.93 1.17 1.003 Yr Beta 0.96 . 0.973 Yr Sharpe Ratio 0.98 0.90 1.463 Yr Alpha 0.96 . -0.313 Yr R-squared 67.86 . 0.92
Morningstar Sectors as of 05-31-18 % Fund
h Cyclical 42.60...............................................................................................r Basic Materials 3.29t Consumer Cyclical 17.41y Financial Services 16.00u Real Estate 5.90
j Sensitive 43.15...............................................................................................i Communication Services 2.48o Energy 0.00p Industrials 17.09a Technology 23.58
k Defensive 14.26...............................................................................................s Consumer Defensive 0.00d Healthcare 14.26f Utilities 0.00
©2018 Morningstar, Inc., Morningstar Investment Profiles™ 312-696-6000. All rights reserved. The information contained herein: (1) is proprietary toMorningstar and/or its content providers; (2) may not be copied or distributed and (3) is not warranted to be accurate, complete or timely. Neither Morningstarnor its content providers are responsible for any damages or losses arising from any use of information. Past performance is no guarantee of futureperformance. Visit our investment website at www.morningstar.com.
ß®
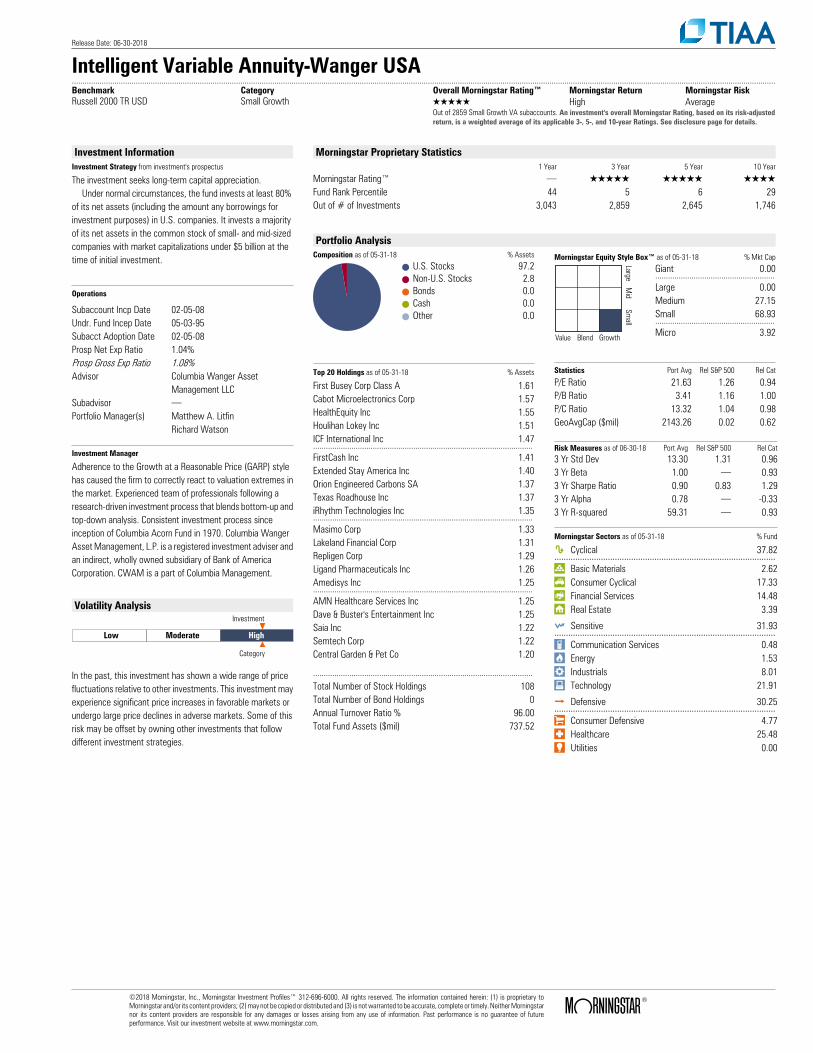
Release Date: 06-30-2018
Intelligent Variable Annuity-Wanger USA..........................................................................................................................................................................................................................................................................................................................................Benchmark Category Overall Morningstar Rating™ Morningstar Return Morningstar RiskRussell 2000 TR USD Small Growth QQQQQ High Average
Out of 2859 Small Growth VA subaccounts. An investment's overall Morningstar Rating, based on its risk-adjustedreturn, is a weighted average of its applicable 3-, 5-, and 10-year Ratings. See disclosure page for details.
Investment InformationInvestment Strategy from investment's prospectus
The investment seeks long-term capital appreciation. Under normal circumstances, the fund invests at least 80% of its net assets (including the amount any borrowings for investment purposes) in U.S. companies. It invests a majority of its net assets in the common stock of small- and mid-sized companies with market capitalizations under $5 billion at the time of initial investment.
Operations
Subaccount Incp Date 02-05-08Undr. Fund Incep Date 05-03-95Subacct Adoption Date 02-05-08Prosp Net Exp Ratio 1.04%Prosp Gross Exp Ratio 1.08%Advisor Columbia Wanger Asset
Management LLCSubadvisor .Portfolio Manager(s) Matthew A. Litfin
Richard Watson
Investment Manager
Adherence to the Growth at a Reasonable Price (GARP) stylehas caused the firm to correctly react to valuation extremes inthe market. Experienced team of professionals following aresearch-driven investment process that blends bottom-up andtop-down analysis. Consistent investment process sinceinception of Columbia Acorn Fund in 1970. Columbia WangerAsset Management, L.P. is a registered investment adviser andan indirect, wholly owned subsidiary of Bank of AmericaCorporation. CWAM is a part of Columbia Management.
Volatility Analysis
Low Moderate High
Investment
Category
In the past, this investment has shown a wide range of pricefluctuations relative to other investments. This investment mayexperience significant price increases in favorable markets orundergo large price declines in adverse markets. Some of thisrisk may be offset by owning other investments that followdifferent investment strategies.
Morningstar Proprietary Statistics1 Year 3 Year 5 Year 10 Year
Morningstar Rating™ . QQQQQ QQQQQ QQQQFund Rank Percentile 44 5 6 29Out of # of Investments 3,043 2,859 2,645 1,746
Portfolio AnalysisComposition as of 05-31-18 % Assets
U.S. Stocks 97.2Non-U.S. Stocks 2.8Bonds 0.0Cash 0.0Other 0.0
Morningstar Equity Style Box™ as of 05-31-18 % Mkt Cap
LargeM
idSm
all
Value Blend Growth
Giant 0.00........................................................Large 0.00Medium 27.15Small 68.93........................................................Micro 3.92
Top 20 Holdings as of 05-31-18 % Assets
First Busey Corp Class A 1.61Cabot Microelectronics Corp 1.57HealthEquity Inc 1.55Houlihan Lokey Inc 1.51ICF International Inc 1.47.......................................................................................................FirstCash Inc 1.41Extended Stay America Inc 1.40Orion Engineered Carbons SA 1.37Texas Roadhouse Inc 1.37iRhythm Technologies Inc 1.35.......................................................................................................Masimo Corp 1.33Lakeland Financial Corp 1.31Repligen Corp 1.29Ligand Pharmaceuticals Inc 1.26Amedisys Inc 1.25.......................................................................................................AMN Healthcare Services Inc 1.25Dave & Buster's Entertainment Inc 1.25Saia Inc 1.22Semtech Corp 1.22Central Garden & Pet Co 1.20
.......................................................................................................Total Number of Stock Holdings 108Total Number of Bond Holdings 0Annual Turnover Ratio % 96.00Total Fund Assets ($mil) 737.52
Statistics Port Avg Rel S&P 500 Rel Cat
P/E Ratio 21.63 1.26 0.94P/B Ratio 3.41 1.16 1.00P/C Ratio 13.32 1.04 0.98GeoAvgCap ($mil) 2143.26 0.02 0.62
Risk Measures as of 06-30-18 Port Avg Rel S&P 500 Rel Cat3 Yr Std Dev 13.30 1.31 0.963 Yr Beta 1.00 . 0.933 Yr Sharpe Ratio 0.90 0.83 1.293 Yr Alpha 0.78 . -0.333 Yr R-squared 59.31 . 0.93
Morningstar Sectors as of 05-31-18 % Fund
h Cyclical 37.82...............................................................................................r Basic Materials 2.62t Consumer Cyclical 17.33y Financial Services 14.48u Real Estate 3.39
j Sensitive 31.93...............................................................................................i Communication Services 0.48o Energy 1.53p Industrials 8.01a Technology 21.91
k Defensive 30.25...............................................................................................s Consumer Defensive 4.77d Healthcare 25.48f Utilities 0.00
©2018 Morningstar, Inc., Morningstar Investment Profiles™ 312-696-6000. All rights reserved. The information contained herein: (1) is proprietary toMorningstar and/or its content providers; (2) may not be copied or distributed and (3) is not warranted to be accurate, complete or timely. Neither Morningstarnor its content providers are responsible for any damages or losses arising from any use of information. Past performance is no guarantee of futureperformance. Visit our investment website at www.morningstar.com.
ß®
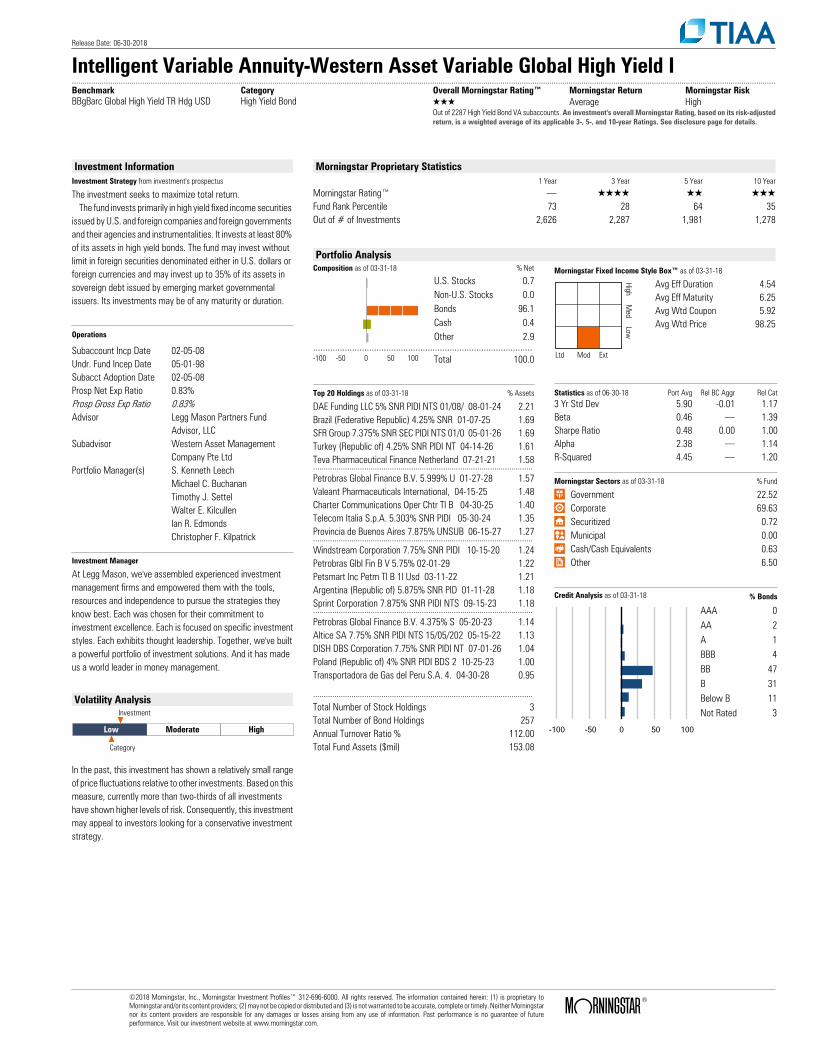
Release Date: 06-30-2018
Intelligent Variable Annuity-Western Asset Variable Global High Yield I..........................................................................................................................................................................................................................................................................................................................................Benchmark Category Overall Morningstar Rating™ Morningstar Return Morningstar RiskBBgBarc Global High Yield TR Hdg USD High Yield Bond QQQ Average High
Out of 2287 High Yield Bond VA subaccounts. An investment's overall Morningstar Rating, based on its risk-adjustedreturn, is a weighted average of its applicable 3-, 5-, and 10-year Ratings. See disclosure page for details.
Investment InformationInvestment Strategy from investment's prospectus
The investment seeks to maximize total return. The fund invests primarily in high yield fixed income securities issued by U.S. and foreign companies and foreign governments and their agencies and instrumentalities. It invests at least 80% of its assets in high yield bonds. The fund may invest without limit in foreign securities denominated either in U.S. dollars or foreign currencies and may invest up to 35% of its assets in sovereign debt issued by emerging market governmental issuers. Its investments may be of any maturity or duration.
Operations
Subaccount Incp Date 02-05-08Undr. Fund Incep Date 05-01-98Subacct Adoption Date 02-05-08Prosp Net Exp Ratio 0.83%Prosp Gross Exp Ratio 0.83%Advisor Legg Mason Partners Fund
Advisor, LLCSubadvisor Western Asset Management
Company Pte LtdPortfolio Manager(s) S. Kenneth Leech
Michael C. BuchananTimothy J. SettelWalter E. KilcullenIan R. EdmondsChristopher F. Kilpatrick
Investment Manager
At Legg Mason, we've assembled experienced investmentmanagement firms and empowered them with the tools,resources and independence to pursue the strategies theyknow best. Each was chosen for their commitment toinvestment excellence. Each is focused on specific investmentstyles. Each exhibits thought leadership. Together, we've builta powerful portfolio of investment solutions. And it has madeus a world leader in money management.
Volatility Analysis
Low Moderate High
Investment
Category
In the past, this investment has shown a relatively small rangeof price fluctuations relative to other investments. Based on thismeasure, currently more than two-thirds of all investmentshave shown higher levels of risk. Consequently, this investmentmay appeal to investors looking for a conservative investmentstrategy.
Morningstar Proprietary Statistics1 Year 3 Year 5 Year 10 Year
Morningstar Rating™ . QQQQ QQ QQQFund Rank Percentile 73 28 64 35Out of # of Investments 2,626 2,287 1,981 1,278
Portfolio AnalysisComposition as of 03-31-18 % Net
U.S. Stocks 0.7Non-U.S. Stocks 0.0Bonds 96.1Cash 0.4Other 2.9
..........................................................................................-100 -50 0 50 100 Total 100.0
Morningstar Fixed Income Style Box™ as of 03-31-18
HighM
edLow
Ltd Mod Ext
Avg Eff Duration 4.54Avg Eff Maturity 6.25Avg Wtd Coupon 5.92Avg Wtd Price 98.25
Top 20 Holdings as of 03-31-18 % Assets
DAE Funding LLC 5% SNR PIDI NTS 01/08/ 08-01-24 2.21Brazil (Federative Republic) 4.25% SNR 01-07-25 1.69SFR Group 7.375% SNR SEC PIDI NTS 01/0 05-01-26 1.69Turkey (Republic of) 4.25% SNR PIDI NT 04-14-26 1.61Teva Pharmaceutical Finance Netherland 07-21-21 1.58.......................................................................................................Petrobras Global Finance B.V. 5.999% U 01-27-28 1.57Valeant Pharmaceuticals International, 04-15-25 1.48Charter Communications Oper Chtr Tl B 04-30-25 1.40Telecom Italia S.p.A. 5.303% SNR PIDI 05-30-24 1.35Provincia de Buenos Aires 7.875% UNSUB 06-15-27 1.27.......................................................................................................Windstream Corporation 7.75% SNR PIDI 10-15-20 1.24Petrobras Glbl Fin B V 5.75% 02-01-29 1.22Petsmart Inc Petm Tl B 1l Usd 03-11-22 1.21Argentina (Republic of) 5.875% SNR PID 01-11-28 1.18Sprint Corporation 7.875% SNR PIDI NTS 09-15-23 1.18.......................................................................................................Petrobras Global Finance B.V. 4.375% S 05-20-23 1.14Altice SA 7.75% SNR PIDI NTS 15/05/202 05-15-22 1.13DISH DBS Corporation 7.75% SNR PIDI NT 07-01-26 1.04Poland (Republic of) 4% SNR PIDI BDS 2 10-25-23 1.00Transportadora de Gas del Peru S.A. 4. 04-30-28 0.95
.......................................................................................................Total Number of Stock Holdings 3Total Number of Bond Holdings 257Annual Turnover Ratio % 112.00Total Fund Assets ($mil) 153.08
Statistics as of 06-30-18 Port Avg Rel BC Aggr Rel Cat3 Yr Std Dev 5.90 -0.01 1.17Beta 0.46 . 1.39Sharpe Ratio 0.48 0.00 1.00Alpha 2.38 . 1.14R-Squared 4.45 . 1.20
Morningstar Sectors as of 03-31-18 % Fund
⁄ Government 22.52› Corporate 69.63€ Securitized 0.72‹ Municipal 0.00fi Cash/Cash Equivalents 0.63± Other 6.50
Credit Analysis as of 03-31-18 % Bonds
-100 -50 0 50 100
AAA 0AA 2A 1BBB 4BB 47B 31Below B 11Not Rated 3
©2018 Morningstar, Inc., Morningstar Investment Profiles™ 312-696-6000. All rights reserved. The information contained herein: (1) is proprietary toMorningstar and/or its content providers; (2) may not be copied or distributed and (3) is not warranted to be accurate, complete or timely. Neither Morningstarnor its content providers are responsible for any damages or losses arising from any use of information. Past performance is no guarantee of futureperformance. Visit our investment website at www.morningstar.com.
ß®
Additional Information All investment vehicles are subject to market and other riskfactors, which could result in loss of principal.Investmentobjectives, risks, charges, expenses, and otherimportant information about a portfolio are contained inthe prospectus; read it carefully before investing.
Prospectus Gross Expense Ratio This is the percentage of fund assets paid for operatingexpenses and management fees. The expense ratio typicallyincludes the following types of fees: accounting, administrator,advisor, auditor, board of directors, custodial, distribution(12b-1), legal, organizational, professional, registration,shareholder reporting, subadvisor, and transfer agency. Theexpense ratio does not reflect the fund's brokerage costs or anyinvestor sales charges. In contrast to the net expense ratio, thegross expense ratio does not reflect any fee waivers in effectduring the time period. Also known as the Total Annual Fund Operating ExpenseRatio, Morningstar pulls the prospectus gross expense ratiofrom the fund's most recent prospectus. Prospectus expenseratios reflect material changes to the expense structure for thecurrent period.
Prospectus Net Expense Ratio This is the percentage of fund assets paid for operatingexpenses and management fees. The expense ratio typicallyincludes the following types of fees: accounting, administrator,advisor, auditor, board of directors, custodial, distribution(12b-1), legal, organizational, professional, registration,shareholder reporting, subadvisor, and transfer agency. Theexpense ratio does not reflect the fund's brokerage costs or anyinvestor sales charges. In contrast to the gross expense ratio,the net expense ratio does reflect fee waivers in effect duringthe time period. Also known as the Total Annual Fund Operating Expense RatioNet of Reimbursements, Morningstar pulls the prospectus netexpense ratio from the fund's most recent prospectus.Prospectus expense ratios reflect material changes to theexpense structure for the current period, while annual reportexpense ratios reflect the actual fees charged during a particularfiscal year.
Morningstar Rating™, Return, and RiskThe Morningstar Rating™ for funds, or "star rating", is calculatedfor funds and separate accounts with at least a three-yearhistory. Exchange-traded funds and open-ended mutual fundsare considered a single population for comparative purposes. Itis calculated based on a Morningstar Risk-Adjusted Returnmeasure that accounts for variation in a managed product'smonthly excess performance, placing more emphasis ondownward variations and rewarding consistent performance.The Morningstar Rating does not include any adjustment forsales loads. The top 10% of products in each product categoryreceive 5 stars, the next 22.5% receive 4 stars, the next 35%receive 3 stars, the next 22.5% receive 2 stars, and the bottom10% receive 1 star. The Overall Morningstar Rating for amanaged product is derived from a weighted average of theperformance figures associated with its three-, five-, and 10-year (if applicable) Morningstar Rating metrics. The Morningstar Return rates a fund’s performance relativeto other managed products in its Morningstar Category. It is anassessment of a product's excess return over a risk-free rate(the return of the 90-day Treasury Bill) in comparison with theproducts in its Morningstar category. In each Morningstarcategory, the top 10% of products earn a High MorningstarReturn (High), the next 22.5% Above Average (+Avg), the
middle 35% Average (Avg), the next 22.5% Below Average (-Avg), and the bottom 10% Low (Low). Morningstar Return ismeasured for up to three time periods (three, five, and 10 years).These separate measures are then weighted and averaged toproduce an overall measure for the product. Products with lessthan three years of performance history are not rated. Morningstar Risk evaluates a fund’s downside volatilityrelative to that of other products in its Morningstar Category. Itis an assessment of the variations in monthly returns, with anemphasis on downside variations, in comparison with theproducts in its Morningstar category. In each Morningstarcategory, the 10% of products with the lowest measured riskare described as Low Risk (Low), the next 22.5% BelowAverage (-Avg), the middle 35% Average (Avg), the next 22.5%Above Average (+Avg), and the top 10% High (High).Morningstar Risk is measured for up to three time periods(three, five, and 10 years). These separate measures are thenweighted and averaged to produce an overall measure for theproduct. Products with less than three years of performancehistory are not rated.
Morningstar Style Box™ The Morningstar Style Box reveals a fund’s investment strategyas of the date noted on this report. For equity funds the vertical axis shows the marketcapitalization of the long stocks owned and the horizontal axisshows investment style (value, blend, or growth). For fixed-income funds, the vertical axis shows the creditquality of the long bonds owned and the horizontal axis showsinterest rate sensitivity as measured by a bond’s effectiveduration (limited, moderate, or extensive). Credit Analysis Survey: For corporate and municipal bonds,Morningstar surveys credit rating information from fundcompanies on a periodic basis (e.g., quarterly). In compilingcredit rating information, Morningstar instructs fund companiesto only use ratings that have been assigned by a NationallyRecognized Statistical Rating Organization (NRSRO). If twoNRSROs have rated a security, fund companies are to reportthe lowest rating to Morningstar. If a rating is unavailable orunpublished, then the security or issuer is categorized as NotRated/Not Available. US Government Securities issued by theUS Treasury or US Government Agencies are included in theUS Government category. PLEASE NOTE: Morningstar, Inc. isnot itself an NRSRO nor does it issue a credit rating on the fund.An NRSRO rating on a fixed-income security can change fromtime-to-time.
Risk Measures R-squared reflects the percentage of a fund’s movements thatare explained by movements in its benchmark index, showingthe degree of correlation between the fund and thebenchmark. Beta is a measure of a fund’s sensitivity to market movements.
A portfolio with a beta greater than 1 is more volatile than themarket, and a portfolio with a beta less than 1 is less volatilethan the market. Alpha measures the difference between a fund’s actualreturns and its expected performance, given its level of risk (asmeasured by beta). Sharpe ratio uses standard deviation and excess return todetermine reward per unit of risk. Standard deviation is a statistical measure of the volatility ofthe fund’s returns.
Investment Risk Foreign Securities Funds/Emerging Market Funds: Risksinclude, but are not limited to, currency risk, political risk, and
risk associated with varying accounting standards. Investing inemerging markets may accentuate these risks. Sector Funds: The lack of industry diversification subjects theinvestor to increased industry-specific risks. Non-DiversifiedFunds: Funds that invest more of their assets in a single issuerinvolve additional risks, including share price fluctuations,because of the increased concentration of investments. Small-Cap Funds: Smaller companies typically have a higherrisk of failure, and are not as well established as larger blue-chip companies. Historically, smaller-company stocks haveexperienced a greater degree of market volatility than theoverall market average. Mid-Cap Funds: The securities of companies with marketcapitalizations below $10 billion may be more volatile and lessliquid than the securities of larger companies. Bond Funds: Bond investments are subject to interest raterisk so that when interest rates rise, the prices of bonds candecrease and the investor can lose principal value. Bondsinvesting in asset/mortgage-backed securities are subject toprepayment risk, where falling interest rates can cause securityprices and income to decline due to early prepayment ofprincipal, as well as extension risk, where rising interest ratescan cause securities prices to decline because expectedprepayments of principal do not occur. High-Yield Bond Funds: Funds that invest in lower-rated debtsecurities (commonly referred to as junk bonds) involveadditional risks because of the lower credit quality of thesecurities in the fund, including the possible higher level ofvolatility and increased risk of default. Commodity-Linked Derivative Funds: Funds that invest incommodity-linked derivative instruments may subject theportfolio to greater volatility than investments in traditionalsecurities, particularly if the investments invoke leverage. Value Funds: Stock selection is based upon the portfoliomanager's assessment of fundamentals of the companies thathe/she believes to be undervalued. This style of investing mayincrease the volatility of the portfolio and may not produce theintended results over short or long time periods. Larger, moreestablished companies may not be able to attain higher growthrates of smaller companies, especially during extended periodsof economic expansion. Asset Allocation Funds: These funds seek to accomplish dualgoals of income and capital appreciation by investing in a varietyof securities in different asset classes. Many of these portfoliosare structured as a "fund of funds" which is a portfolio thatspecializes in buying shares of other portfolios rather thanindividual securities. The "fund of funds" structure may havehigher costs than if you invested directly in the underlyingportfolios.
TIAA-CREF Individual & Institutional Services, LLC, memberFINRA, distributes securities products. Intelligent VariableAnnuity, contract form series TCL-VA2 is issued by TIAA-CREFLife Insurance Company, 730 Third Avenue, New York, NY10017.
440610
Disclosure
©2018 Morningstar, Inc., Morningstar Investment Profiles™ 312-696-6000. All rights reserved. The information contained herein: (1) is proprietary toMorningstar and/or its content providers; (2) may not be copied or distributed and (3) is not warranted to be accurate, complete or timely. Neither Morningstarnor its content providers are responsible for any damages or losses arising from any use of information. Past performance is no guarantee of futureperformance. Visit our investment website at www.morningstar.com.
ß®

Supplemental Information
Supplemental Information
4 Yr earnings growth %
A measure of the trailing annualized earnings-growth record of the stocks in the portfolio. Like Morningstar‘s Price/Earnings and Price/Book ratios, this number is weighted so that larger positions in the portfolio count proportionately more than lesser positions. Stocks with losses during the past four years and those that lack a four-year track record are excluded from this calculation. Morningstar Investment Profiles will not reflect a value if less than 25% of the portfolio’s holdings lack a four-year track record.
A
Alpha
See Modern Portfolio Theory Statistics
American Depository Receipts (ADRs)
ADRs are securities that represent shares in a foreign company. They are traded on major U.S. stock exchanges and over the counter.
Asset base
The amount of money that a fund has under management. Frequently called assets or net assets.
B
Benchmark
An index or other standard against which an investment’s performance is measured. A stock fund’s returns are often compared with those of the S&P 500 index.
Beta
See Modern Portfolio Theory Statistics.
Bull market
A period in which security prices in a given market are generally rising.
C
Capital appreciation
An increase in the share price of a security. This is one of the two primary sources of an investor’s total return. The other primary source is income.
Composition
A portfolio’s composition will tell you something about its risk level. Funds that hold a large percentage of assets in cash (perhaps 10% or more) usually carry less risk because not all of their holdings are exposed to the market. We use a pie chart to help you see how much of your investment consists of stocks, bonds, or cash. We also show how much of your investment is held in foreign stocks.
Concentrated portfolio
A portfolio that is limited to relatively few securities or industries although its manager can invest in a diversified universe.
Country weightings
The returns of international investments will be affected by the performance of the international markets in which they invest. Consequently, you will want to know which countries your investment is most exposed to. The Morningstar Investment Profile shows the percentage of assets invested in each of an international investment’s five largest country positions.
Credit analysis
Credit quality can influence the returns of portfolios that invest heavily in bonds. The Credit Analysis graph shows the percentage of fund assets that are invested in each of the major credit ratings, as determined by Standard & Poor’s or Moody’s. Lower-rated credits (also called junk or high-yield bonds) are more risky than higher-rated credits.
Currency risk
For a U.S.-based investor, the risk that the currency in which a foreign holding is denominated will depreciate relative to the U.S. dollar. In that case, an investor’s profits would suffer when the foreign security was sold and the proceeds from this sale were exchanged for U.S. dollars.
Current-coupon bond
A bond that is trading at its face value or par because it is paying a market-level rate of interest.
D
Debt
Another term for a bond or fixed-income security.
Derivative
A security that has been crafted from an existing asset or security. Derivatives’ value (and investors’ returns) derive from the value of the underlying asset or security. Examples of equity derivatives include futures contracts and options. CMOs and mortgage-backed securities are examples of fixed-income derivatives.
Glossary
83
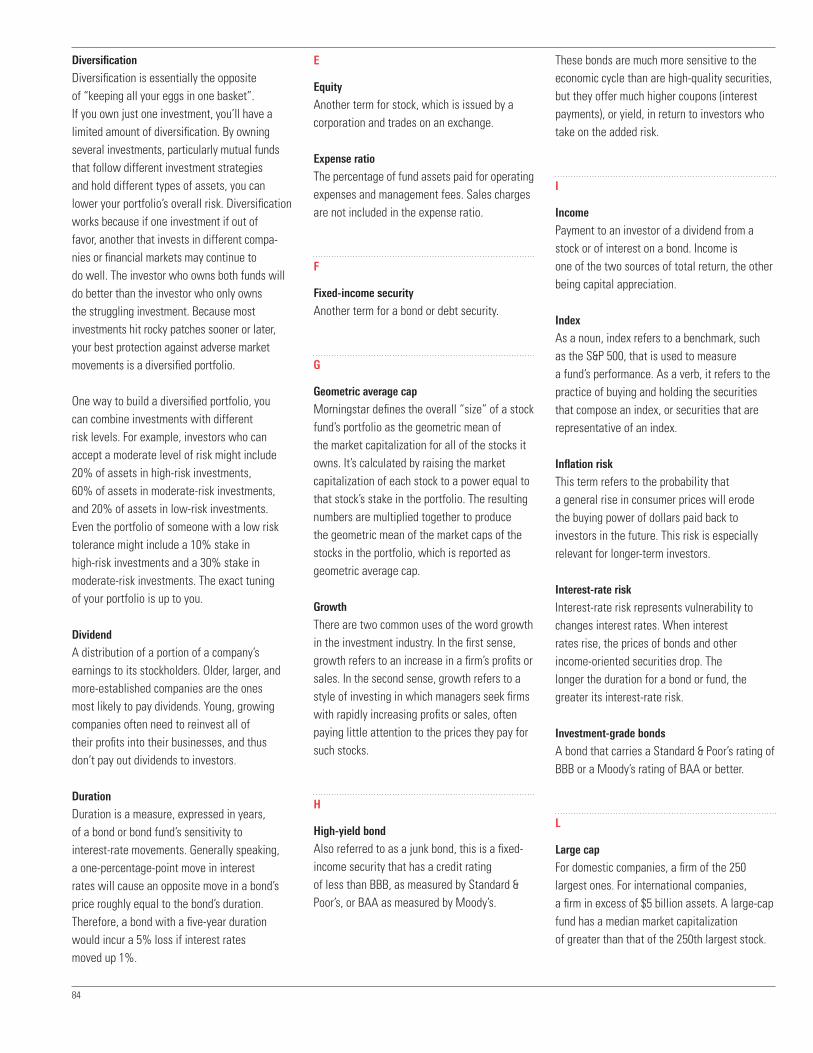
Diversification
Diversification is essentially the opposite of “keeping all your eggs in one basket”. If you own just one investment, you’ll have a limited amount of diversification. By owning several investments, particularly mutual funds that follow different investment strategies and hold different types of assets, you can lower your portfolio’s overall risk. Diversification works because if one investment if out of favor, another that invests in different compa-nies or financial markets may continue to do well. The investor who owns both funds will do better than the investor who only owns the struggling investment. Because most investments hit rocky patches sooner or later, your best protection against adverse market movements is a diversified portfolio.
One way to build a diversified portfolio, you can combine investments with different risk levels. For example, investors who can accept a moderate level of risk might include 20% of assets in high-risk investments, 60% of assets in moderate-risk investments, and 20% of assets in low-risk investments. Even the portfolio of someone with a low risk tolerance might include a 10% stake in high-risk investments and a 30% stake in moderate-risk investments. The exact tuning of your portfolio is up to you.
Dividend
A distribution of a portion of a company’s earnings to its stockholders. Older, larger, and more-established companies are the ones most likely to pay dividends. Young, growing companies often need to reinvest all of their profits into their businesses, and thus don’t pay out dividends to investors.
Duration
Duration is a measure, expressed in years, of a bond or bond fund’s sensitivity to interest-rate movements. Generally speaking, a one-percentage-point move in interest rates will cause an opposite move in a bond’s price roughly equal to the bond’s duration. Therefore, a bond with a five-year duration would incur a 5% loss if interest rates moved up 1%.
E
Equity
Another term for stock, which is issued by a corporation and trades on an exchange.
Expense ratio
The percentage of fund assets paid for operating expenses and management fees. Sales charges are not included in the expense ratio.
F
Fixed-income security
Another term for a bond or debt security.
G
Geometric average cap
Morningstar defines the overall “size” of a stock fund’s portfolio as the geometric mean of the market capitalization for all of the stocks it owns. It’s calculated by raising the market capitalization of each stock to a power equal to that stock’s stake in the portfolio. The resulting numbers are multiplied together to produce the geometric mean of the market caps of the stocks in the portfolio, which is reported as geometric average cap.
Growth
There are two common uses of the word growth in the investment industry. In the first sense, growth refers to an increase in a firm’s profits or sales. In the second sense, growth refers to a style of investing in which managers seek firms with rapidly increasing profits or sales, often paying little attention to the prices they pay for such stocks.
H
High-yield bond
Also referred to as a junk bond, this is a fixed- income security that has a credit rating of less than BBB, as measured by Standard & Poor’s, or BAA as measured by Moody’s.
These bonds are much more sensitive to the economic cycle than are high-quality securities, but they offer much higher coupons (interest payments), or yield, in return to investors who take on the added risk.
I
Income
Payment to an investor of a dividend from a stock or of interest on a bond. Income is one of the two sources of total return, the other being capital appreciation.
Index
As a noun, index refers to a benchmark, such as the S&P 500, that is used to measure a fund’s performance. As a verb, it refers to the practice of buying and holding the securities that compose an index, or securities that are representative of an index.
Inflation risk
This term refers to the probability that a general rise in consumer prices will erode the buying power of dollars paid back to investors in the future. This risk is especially relevant for longer-term investors.
Interest-rate risk
Interest-rate risk represents vulnerability to changes interest rates. When interest rates rise, the prices of bonds and other income-oriented securities drop. The longer the duration for a bond or fund, the greater its interest-rate risk.
Investment-grade bonds
A bond that carries a Standard & Poor’s rating of BBB or a Moody’s rating of BAA or better.
L
Large cap
For domestic companies, a firm of the 250 largest ones. For international companies, a firm in excess of $5 billion assets. A large-cap fund has a median market capitalization of greater than that of the 250th largest stock.
84
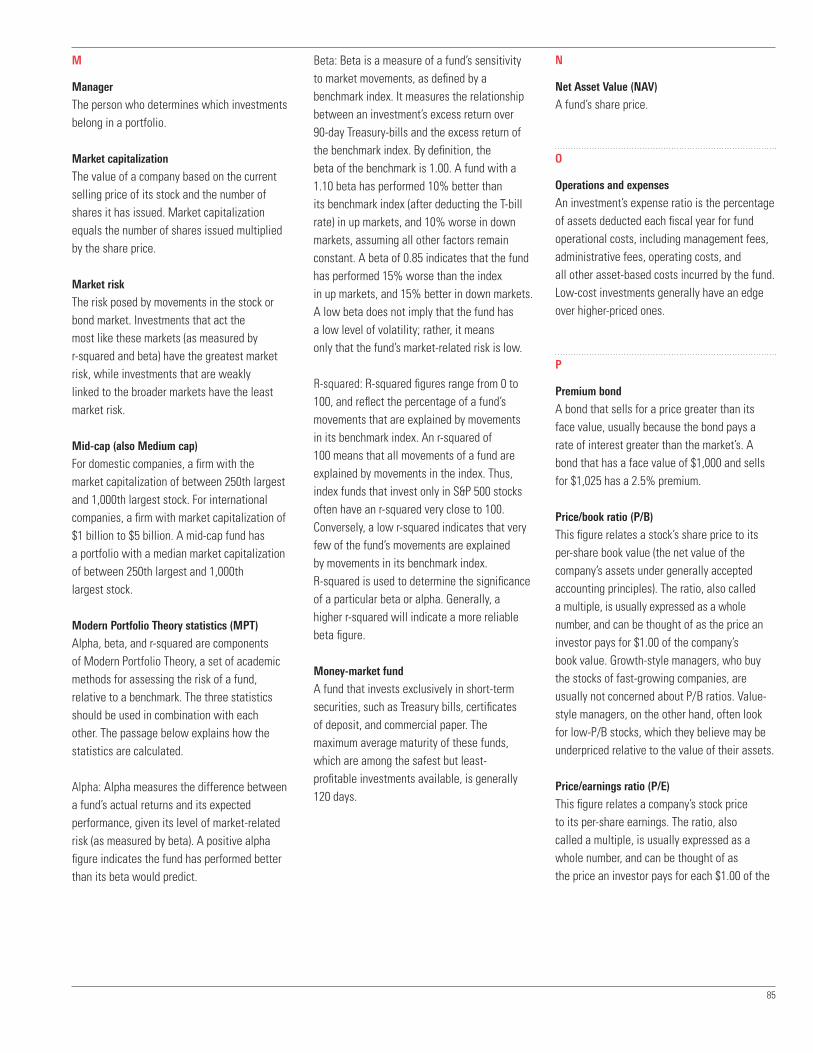
M
Manager
The person who determines which investments belong in a portfolio.
Market capitalization
The value of a company based on the current selling price of its stock and the number of shares it has issued. Market capitalization equals the number of shares issued multiplied by the share price.
Market risk
The risk posed by movements in the stock or bond market. Investments that act the most like these markets (as measured by r-squared and beta) have the greatest market risk, while investments that are weakly linked to the broader markets have the least market risk.
Mid-cap (also Medium cap)
For domestic companies, a firm with the market capitalization of between 250th largest and 1,000th largest stock. For international companies, a firm with market capitalization of $1 billion to $5 billion. A mid-cap fund has a portfolio with a median market capitalization of between 250th largest and 1,000th largest stock.
Modern Portfolio Theory statistics (MPT)
Alpha, beta, and r-squared are components of Modern Portfolio Theory, a set of academic methods for assessing the risk of a fund, relative to a benchmark. The three statistics should be used in combination with each other. The passage below explains how the statistics are calculated.
Alpha: Alpha measures the difference between a fund’s actual returns and its expected performance, given its level of market-related risk (as measured by beta). A positive alpha figure indicates the fund has performed better than its beta would predict.
Beta: Beta is a measure of a fund’s sensitivity to market movements, as defined by a benchmark index. It measures the relationship between an investment’s excess return over 90-day Treasury-bills and the excess return of the benchmark index. By definition, the beta of the benchmark is 1.00. A fund with a 1.10 beta has performed 10% better than its benchmark index (after deducting the T-bill rate) in up markets, and 10% worse in down markets, assuming all other factors remain constant. A beta of 0.85 indicates that the fund has performed 15% worse than the index in up markets, and 15% better in down markets. A low beta does not imply that the fund has a low level of volatility; rather, it means only that the fund’s market-related risk is low.
R-squared: R-squared figures range from 0 to 100, and reflect the percentage of a fund’s movements that are explained by movements in its benchmark index. An r-squared of 100 means that all movements of a fund are explained by movements in the index. Thus, index funds that invest only in S&P 500 stocks often have an r-squared very close to 100. Conversely, a low r-squared indicates that very few of the fund’s movements are explained by movements in its benchmark index. R-squared is used to determine the significance of a particular beta or alpha. Generally, a higher r-squared will indicate a more reliable beta figure.
Money-market fund
A fund that invests exclusively in short-term securities, such as Treasury bills, certificates of deposit, and commercial paper. The maximum average maturity of these funds, which are among the safest but least-profitable investments available, is generally 120 days.
N
Net Asset Value (NAV)
A fund’s share price.
O
Operations and expenses
An investment’s expense ratio is the percentage of assets deducted each fiscal year for fund operational costs, including management fees, administrative fees, operating costs, and all other asset-based costs incurred by the fund. Low-cost investments generally have an edge over higher-priced ones.
P
Premium bond
A bond that sells for a price greater than its face value, usually because the bond pays a rate of interest greater than the market’s. A bond that has a face value of $1,000 and sells for $1,025 has a 2.5% premium.
Price/book ratio (P/B)
This figure relates a stock’s share price to its per-share book value (the net value of the company’s assets under generally accepted accounting principles). The ratio, also called a multiple, is usually expressed as a whole number, and can be thought of as the price an investor pays for $1.00 of the company’s book value. Growth-style managers, who buy the stocks of fast-growing companies, are usually not concerned about P/B ratios. Value- style managers, on the other hand, often look for low-P/B stocks, which they believe may be underpriced relative to the value of their assets.
Price/earnings ratio (P/E)
This figure relates a company’s stock price to its per-share earnings. The ratio, also called a multiple, is usually expressed as a whole number, and can be thought of as the price an investor pays for each $1.00 of the
85
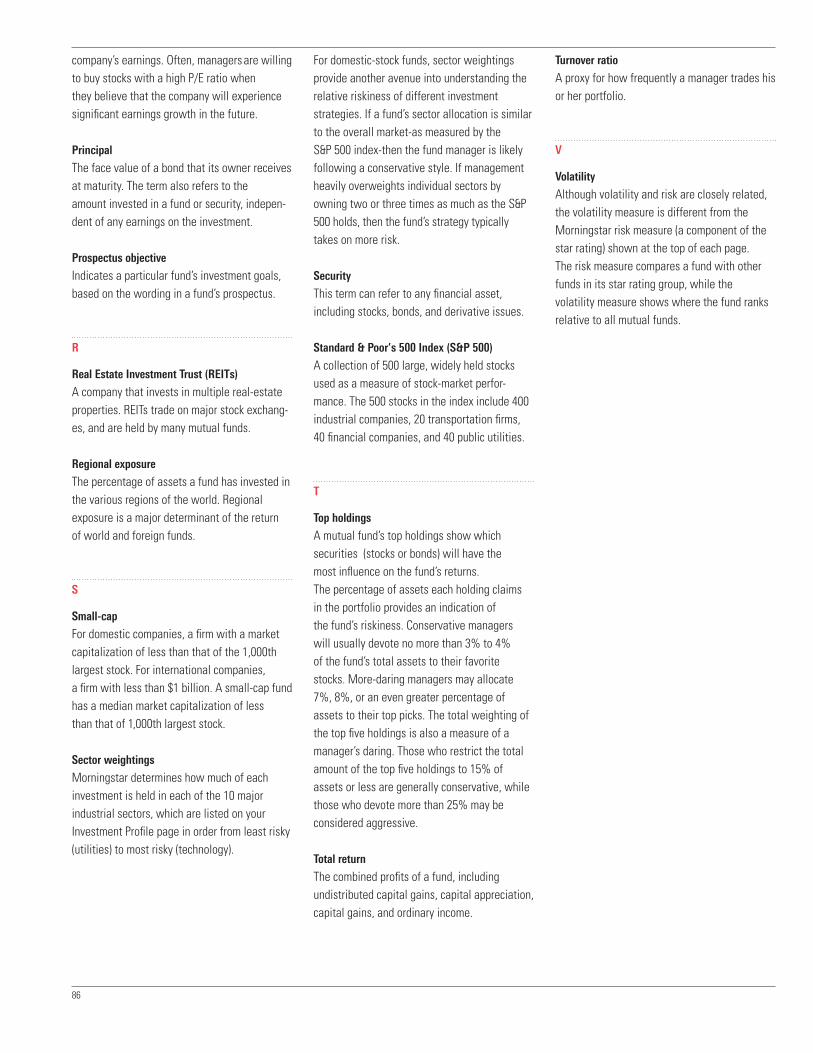
company’s earnings. Often, managers are willing to buy stocks with a high P/E ratio when they believe that the company will experience significant earnings growth in the future.
Principal
The face value of a bond that its owner receives at maturity. The term also refers to the amount invested in a fund or security, indepen-dent of any earnings on the investment.
Prospectus objective
Indicates a particular fund’s investment goals, based on the wording in a fund’s prospectus.
R
Real Estate Investment Trust (REITs)
A company that invests in multiple real-estate properties. REITs trade on major stock exchang-es, and are held by many mutual funds.
Regional exposure
The percentage of assets a fund has invested in the various regions of the world. Regional exposure is a major determinant of the return of world and foreign funds.
S
Small-cap
For domestic companies, a firm with a market capitalization of less than that of the 1,000th largest stock. For international companies, a firm with less than $1 billion. A small-cap fund has a median market capitalization of less than that of 1,000th largest stock.
Sector weightings
Morningstar determines how much of each investment is held in each of the 10 major industrial sectors, which are listed on your Investment Profile page in order from least risky (utilities) to most risky (technology).
For domestic-stock funds, sector weightings provide another avenue into understanding the relative riskiness of different investment strategies. If a fund’s sector allocation is similar to the overall market-as measured by the S&P 500 index-then the fund manager is likely following a conservative style. If management heavily overweights individual sectors by owning two or three times as much as the S&P 500 holds, then the fund’s strategy typically takes on more risk.
Security
This term can refer to any financial asset, including stocks, bonds, and derivative issues.
Standard & Poor’s 500 Index (S&P 500)
A collection of 500 large, widely held stocks used as a measure of stock-market perfor-mance. The 500 stocks in the index include 400 industrial companies, 20 transportation firms, 40 financial companies, and 40 public utilities.
T
Top holdings
A mutual fund’s top holdings show which securities (stocks or bonds) will have the most influence on the fund’s returns. The percentage of assets each holding claims in the portfolio provides an indication of the fund’s riskiness. Conservative managers will usually devote no more than 3% to 4% of the fund’s total assets to their favorite stocks. More-daring managers may allocate 7%, 8%, or an even greater percentage of assets to their top picks. The total weighting of the top five holdings is also a measure of a manager’s daring. Those who restrict the total amount of the top five holdings to 15% of assets or less are generally conservative, while those who devote more than 25% may be considered aggressive.
Total return
The combined profits of a fund, including undistributed capital gains, capital appreciation, capital gains, and ordinary income.
Turnover ratio
A proxy for how frequently a manager trades his or her portfolio.
V
Volatility
Although volatility and risk are closely related, the volatility measure is different from the Morningstar risk measure (a component of the star rating) shown at the top of each page. The risk measure compares a fund with other funds in its star rating group, while the volatility measure shows where the fund ranks relative to all mutual funds.
86
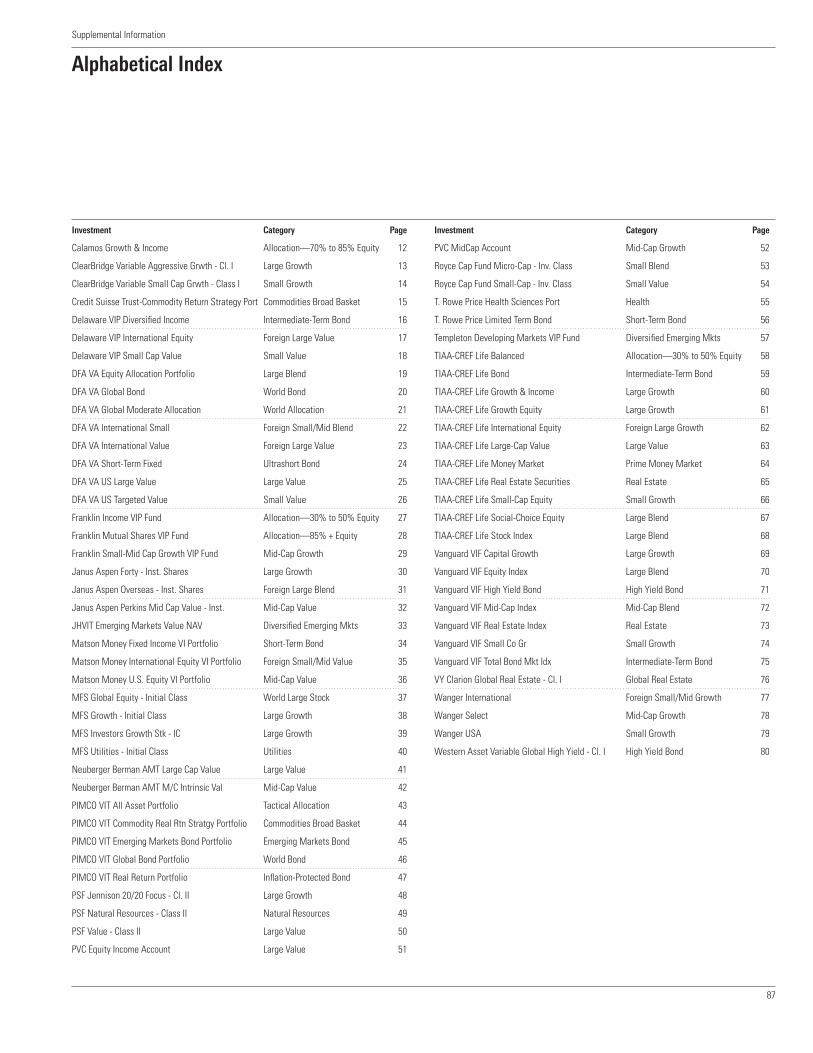
Supplemental Information
Alphabetical Index
Investment Category Page
Calamos Growth & Income Allocation—70% to 85% Equity 12
ClearBridge Variable Aggressive Grwth - Cl. I Large Growth 13
ClearBridge Variable Small Cap Grwth - Class I Small Growth 14
Credit Suisse Trust-Commodity Return Strategy Port Commodities Broad Basket 15
Delaware VIP Diversified Income Intermediate-Term Bond 16
Delaware VIP International Equity Foreign Large Value 17
Delaware VIP Small Cap Value Small Value 18
DFA VA Equity Allocation Portfolio Large Blend 19
DFA VA Global Bond World Bond 20
DFA VA Global Moderate Allocation World Allocation 21
DFA VA International Small Foreign Small/Mid Blend 22
DFA VA International Value Foreign Large Value 23
DFA VA Short-Term Fixed Ultrashort Bond 24
DFA VA US Large Value Large Value 25
DFA VA US Targeted Value Small Value 26
Franklin Income VIP Fund Allocation—30% to 50% Equity 27
Franklin Mutual Shares VIP Fund Allocation—85% + Equity 28
Franklin Small-Mid Cap Growth VIP Fund Mid-Cap Growth 29
Janus Aspen Forty - Inst. Shares Large Growth 30
Janus Aspen Overseas - Inst. Shares Foreign Large Blend 31
Janus Aspen Perkins Mid Cap Value - Inst. Mid-Cap Value 32
JHVIT Emerging Markets Value NAV Diversified Emerging Mkts 33
Matson Money Fixed Income VI Portfolio Short-Term Bond 34
Matson Money International Equity VI Portfolio Foreign Small/Mid Value 35
Matson Money U.S. Equity VI Portfolio Mid-Cap Value 36
MFS Global Equity - Initial Class World Large Stock 37
MFS Growth - Initial Class Large Growth 38
MFS Investors Growth Stk - IC Large Growth 39
MFS Utilities - Initial Class Utilities 40
Neuberger Berman AMT Large Cap Value Large Value 41
Neuberger Berman AMT M/C Intrinsic Val Mid-Cap Value 42
PIMCO VIT All Asset Portfolio Tactical Allocation 43
PIMCO VIT Commodity Real Rtn Stratgy Portfolio Commodities Broad Basket 44
PIMCO VIT Emerging Markets Bond Portfolio Emerging Markets Bond 45
PIMCO VIT Global Bond Portfolio World Bond 46
PIMCO VIT Real Return Portfolio Inflation-Protected Bond 47
PSF Jennison 20/20 Focus - Cl. II Large Growth 48
PSF Natural Resources - Class II Natural Resources 49
PSF Value - Class II Large Value 50
PVC Equity Income Account Large Value 51
Investment Category Page
PVC MidCap Account Mid-Cap Growth 52
Royce Cap Fund Micro-Cap - Inv. Class Small Blend 53
Royce Cap Fund Small-Cap - Inv. Class Small Value 54
T. Rowe Price Health Sciences Port Health 55
T. Rowe Price Limited Term Bond Short-Term Bond 56
Templeton Developing Markets VIP Fund Diversified Emerging Mkts 57
TIAA-CREF Life Balanced Allocation—30% to 50% Equity 58
TIAA-CREF Life Bond Intermediate-Term Bond 59
TIAA-CREF Life Growth & Income Large Growth 60
TIAA-CREF Life Growth Equity Large Growth 61
TIAA-CREF Life International Equity Foreign Large Growth 62
TIAA-CREF Life Large-Cap Value Large Value 63
TIAA-CREF Life Money Market Prime Money Market 64
TIAA-CREF Life Real Estate Securities Real Estate 65
TIAA-CREF Life Small-Cap Equity Small Growth 66
TIAA-CREF Life Social-Choice Equity Large Blend 67
TIAA-CREF Life Stock Index Large Blend 68
Vanguard VIF Capital Growth Large Growth 69
Vanguard VIF Equity Index Large Blend 70
Vanguard VIF High Yield Bond High Yield Bond 71
Vanguard VIF Mid-Cap Index Mid-Cap Blend 72
Vanguard VIF Real Estate Index Real Estate 73
Vanguard VIF Small Co Gr Small Growth 74
Vanguard VIF Total Bond Mkt Idx Intermediate-Term Bond 75
VY Clarion Global Real Estate - Cl. I Global Real Estate 76
Wanger International Foreign Small/Mid Growth 77
Wanger Select Mid-Cap Growth 78
Wanger USA Small Growth 79
Western Asset Variable Global High Yield - Cl. I High Yield Bond 80
87


A13828-IVA (06/18)526485141015899
Investment products, insurance and annuity products are not FDIC insured, are not bank guaranteed, are not deposits, are not insured by any federal government agency, are not a condition to any banking service or activity, and may lose value.TIAA-CREF Individual & Institutional Services, LLC, member FINRA, distributes securities products. Intelligent Variable Annuity, contract form series TCL-VA2 is issued by TIAA-CREF Life Insurance Company (TIAA Life), a wholly owned subsidiary of Teachers Insurance and Annuity Association (TIAA). Both TIAA and TIAA Life are headquartered at 730 Third Avenue, New York, NY 10017. Each of the foregoing is solely responsible for its own financial condition and contractual obligations. This product may not be available in all states. Please call us for details.
©2018 TIAA-CREF Life Insurance Company, 730 Third Avenue, New York, NY 10017
Data and Analyst Reports provided by Morningstar, Inc.
June 2018 | TIAA-CREF Life Insurance Company
Quarterly Investment Guidefor The Intelligent Variable Annuity®
This material must be preceded or accompanied by a current product and underlying fund prospectus. Additional copies of the prospectuses can be obtained by calling 877-694-0305 or by visiting TIAA.org/prospectuses.