june 2018 learning more, growing...
TRANSCRIPT

Supported by funding from the Australian Government (Department of Foreign Affairs and Trade, DFAT), under the Support for Enhanced Macroeconomic and Fiscal Policy Analysis (SEMEFPA) program.
Learning more, growing fasterJune 2018
Pub
lic D
iscl
osur
e A
utho
rized
Pub
lic D
iscl
osur
e A
utho
rized
Pub
lic D
iscl
osur
e A
utho
rized
Pub
lic D
iscl
osur
e A
utho
rized

INDONESIA ECONOMIC QUARTERLY Learning more, growing faster
June 2018

Preface
The Indonesia Economic Quarterly (IEQ) has two main aims. First, it reports on the key developments over the past three months in Indonesia’s economy, and places these in a longer-term and global context. Based on these developments and on policy changes over the period, the IEQ regularly updates the outlook for Indonesia’s economy and social welfare. Second, the IEQ provides a more in-depth examination of selected economic and policy issues, and an analysis of Indonesia’s medium-term development challenges. It is intended for a wide audience, including policy makers, business leaders, financial market participants, and the community of analysts and professionals engaged in Indonesia’s evolving economy. The IEQ is a product of the World Bank’s Jakarta office and receives editorial and strategic guidance from an editorial board chaired by Rodrigo A. Chaves, Country Director for Indonesia. The report is compiled by the Macroeconomics, Trade and Investment (MTI) Global Practice team, under the guidance of Ndiame Diop (Practice Manager), and Frederico Gil Sander (Lead Economist). Led by Derek H. C. Chen (Senior Economist and lead author), the core project team comprises Abigail, Arsianti, Yus Medina, Alief Aulia Rezza, Jaffar Al-Rikabi and Dhruv Sharma. Administrative support is provided by Sylvia Njotomihardjo. Dissemination is organized by Nugroho Sunjoyo, Jerry Kurniawan, and GB Surya Ningnagara under guidance of Lestari Boediono Qureshi. This edition of the IEQ also includes contributions from Dhruv Sharma (Part A.1 and A.5), Alief Aulia Rezza (Part A.2, A.3, and A.4), Jaffar Al-Rikabi and Yus Medina (Part A.6), Derek H.C. Chen (Part A.7), Dhruv Sharma, Frederico Gil Sander and Pui Shen Yoong (Box A.1), Javier Luque and Rythia Afkar with inputs from Noah Yarrow, Rosfita Roesli, Susiana Iskandar, Ratna Kesuma, Petra Wiyakti Bodrogini, Sheldon Shaeffer, Raja Bentaouet Kattan, Amer Hasan, Harry Patrinos, Camilla Holmemo and Frederico Gil Sander (Part B), and Abigail (Appendix). The report also benefited from discussions with, and in-depth comments from Ekaterina T. Vashakmadze (Senior Economist, DECPG, World Bank), Ha Nguyen (Economist, DECMG, World Bank), Andy D. Mason (Lead Economist, EAPCE, World Bank). This report is a product of the staff of the International Bank for Reconstruction and Development/the World Bank, supported by funding from the Australian Government under the Support for Enhanced Macroeconomic and Fiscal Policy Analysis (SEMEFPA) program. The findings, interpretations, and conclusions expressed in this report do not necessarily reflect the views of the Executive Directors of the World Bank or the governments they represent, or the Australian Government. The World Bank does not guarantee the accuracy of the data included in this work. The boundaries, colors, denominations, and other information shown on any map in this work do not imply any judgment on the part of the World Bank concerning the legal status of any territory or the endorsement or acceptance of such boundaries. The photographs are copyright of World Bank. All rights reserved. For more World Bank analysis of Indonesia’s economy: For information about the World Bank and its activities in Indonesia, please visit www.worldbank.org/id. To receive the IEQ and related publications by email, please email [email protected]. For questions and comments, please email [email protected].

Abbreviations
APBD Anggaran Pendapatan dan Belanja Daerah APBN Anggaran Pendapatan dan Belanja Negara BEC Basic Education Capacity Development BI Bank Indonesia BOP Balance of Payments BoP PAUD Bantuan Operasional PAUD BOS Bantuan Operasional Sekolah BOSDA Bantuan Operasional Sekolah Daerah BPS Badan Pusat Statistik CPO Crude Palm Oil DAK Dana Alokasi Khusus DAU Dana Alokasi Umum DAPODIK Data Pokok Pendidikan ECED Early Childhood Education and Development EMCI Emerging Market Currency Index GDP Gross domestic product GoI Government of Indonesia HLO Harmonized Learning Outcomes ILEG Indonesia Local Education Governance Index IMF International Monetary Fund INAP Indonesian National Assessment Program/AKSI INPRES Instruksi Presiden LNG Liquefied Natural Gas LPMP Lembaga Penjaminan Mutu Pendidikan MA Madrasah Aliyah or equivalent with the senior secondary level MELE Measuring Early Learning Environment MI Madrasah Ibtidaiyah or equivalent with the primary level MSSCD Minimum Service Standards Capacity Development MSS Minimum Service Standards MTS Madrasah Tsanawiyah or equivalent with the junior secondary level MenPAN Kementerian Pendayagunaan Aparatur Negara/Ministry of State Apparatus and Bureaucracy
Reform MOEC Ministry of Education and Culture MOF Ministry of Finance MOHA Ministry of Home Affairs MORA Ministry of Religious Affairs MORTHE Ministry of Research, Technology, and Higher Education MOV Ministry of Village, Underdeveloped Regions and Transmigration NPL Non-Performing Loans NTI Net Trade Index OECD Organisation for Economic Co-operation and Development OJK Otoritas Jasa Keuangan/Financial Services Authority OPEC Organization of the Petroleum Exporting Countries PAI Pembelajaran Agama Islam/Teaching Islamic Religion PAUD Pendidikan Anak Usia Dini PBI-JKN Penerima Bantuan Iuran-Jaminan Kesehatan Nasional PISA Programme for International Student Assessment PIP Program Indonesia Pintar PKB Pengembangan Keprofesian Berkelanjutan PKG Penilaian Kinerja Guru or teacher performance appraisal PKH Program Keluarga Harapan PKN Pendidikan Kewarganegaraan

PLPG Pendidikan dan Latihan Profesi Guru PNS Pegawai Negeri Sipil/Civil Servant PPG Pendidikan Profesi Guru PUSPENDIK Pusat Penilaian Pendidikan/Center for Educational Assessment qoq Quarter-on-quarter sa Seasonally adjusted SKK Satuan Kerja Khusus TAP Tax Amnesty Program TPG Teacher Professional Allowances TIMSS Trends in International Mathematics and Science Study ToT Terms-of-trade TPG Teacher Professional Allowances UKG Uji Kompetensi Guru or teacher competency exam UNESCO the United Nations Educational, Scientific and Cultural organization VAT Value Added Tax yoy Year-on-year

Table of Contents
PREFACE ....................................................................................................................... ............ I
ABBREVIATIONS ..................................................................................................................... II
TABLE OF CONTENTS ........................................................................................................... IV
EXECUTIVE SUMMARY ............................................................................................................ 1
A. ECONOMIC AND FISCAL UPDATE ..................................................................................... 3
1. Indonesian economic growth eased in Q1 2018 ............................................................................................................ 3 2. Commodity prices continued to strengthen in Q1 ....................................................................................................... 8 3. The current account deficit narrowed as higher import of capital goods was offset by narrower service trade
deficit .......................................................................................................................................................................... 10 4. Headline inflation continues to ease .......................................................................................................................... 13 5. Bond yields rose in the first 5 months of 2018 as the United States continued to normalize monetary policy ......... 14 6. Notable improvement in revenue collection and continued expenditure growth ..................................................... 17 7. Economic growth outlook and risks ........................................................................................................................... 20
B. DELIVERING QUALITY EDUCATION FOR INDONESIA: ............................................... 26
ADDRESSING CHALLENGES AFTER 15 YEARS OF EDUCATIONAL REFORMS ................ 26
1. Indonesia’s growth potential and quality of life is highly dependent on its human capital ...................................... 27 2. Over the past 15 years, the Indonesian education system has undergone a major transformation which yielded
mixed results .............................................................................................................................................................. 29 3. In order to fully benefit from investments in human capital, Indonesia needs both improved policies and
improved implementation ......................................................................................................................................... 35 a. Additional resources have not led to improvements in education quality ............................................................ 35 b. To improve education outcomes, the capacity of all actors must increase, as well as the coordination among
them ........................................................................................................................................................................ 37 c. Major challenges were registered in the management of teachers and in the implementation of the national
exam. ....................................................................................................................................................................... 42 4. Boosting Indonesia’s human capital ........................................................................................................................... 49
REFERENCES ......................................................................................................................... 55
APPENDIX: A SNAPSHOT OF INDONESIAN ECONOMIC INDICATORS ........................... 58

FIGURES
Figure A.1: Net exports were a drag on GDP growth in Q1 ............................................................................................. 3 Figure A.2: A jump in machinery and equipment and vehicle investment led to stronger fixed capital formation ...... 4 Figure A.3: High frequency indicators for private consumption point to a mixed picture ............................................ 4 Figure A.4: Social spending drove nominal government consumption .......................................................................... 4 Figure A.5: Retail sales growth has decoupled from real private consumption growth since 2015… ............................ 5 Figure A.6: …in part because consumption has shifted slightly from goods to services in recent years ....................... 5 Figure A.7: Consumption has been near its 10-year average… ....................................................................................... 6 Figure A.8: … and consistent with Indonesia’s current pace of GDP growth ................................................................ 6 Figure A.9: Among the key economic sectors, manufacturing remained the main contributor to growth in Q1 .......... 7 Figure A.10: Apart from the price of oil that continues its rally, prices for Indonesia’s other key commodities were
largely stable ................................................................................................................................................................. 8 Figure A.11: Prices for Indonesia’s key commodities at the end of April 2018 are generally higher than the World
Bank forecasts for 2018 ................................................................................................................................................. 9 Figure A.12: Exports volumes of Indonesia’s key commodities ...................................................................................... 9 Figure A.13: Exports growth slowed down due to a high base in Q1 2017 and lower oil and gas exports growth ........ 11 Figure A.14: Growth of imports remained strong, driven by strong imports of capital goods ...................................... 11 Figure A.15: On a seasonally adjusted qoq basis, growth of goods exports values strengthened in Q1 in line with
higher commodity prices ........................................................................................................................................... 12 Figure A.16: Foreign direct investment dipped lower in Q1 .......................................................................................... 12 Figure A.17: Headline inflation eased in Q1 ................................................................................................................... 13 Figure A.18: Financial market volatility spiked since February ..................................................................................... 14 Figure A.19: 10-year bond yields across the region ticked up amid increased financial market volatility ................... 14 Figure A.20: The Rupiah depreciated in Q1, but showing early signs of recovery in mid Q2 ...................................... 16 Figure A.21: While regional currencies have also been depreciating in real terms in 2018, only the Indian Rupee has
depreciated more than the Rupiah ............................................................................................................................ 16 Figure A.22: Monetary policy easing cycle remained on hold ....................................................................................... 16 Figure A.23: Banking sector remains healthy ................................................................................................................ 17 Figure A.24: Total revenues excluding revenues from TA grew at the fastest pace in ten years, driven by non-O&G
income tax and VAT .................................................................................................................................................. 18 Figure A.25: Social spending and fuel subsidies are main contributors of the higher spending growth ..................... 19 Figure A.26: No change in overall execution, but social and fuel subsidy disbursements are higher ......................... 19 Figure A.27: The net trade-weighted price index – historical and forecast until 2019 .................................................. 21 Figure A.28: The current account deficit is expected to widen in 2018 and 2019 as import-intensive investment
remains strong and terms-of-trade weaken ............................................................................................................... 22 Figure A.29: Upside pressures from food price volatility have eased due to successful harvest season ...................... 22 Figure A.30: The World Bank projects a fiscal deficit of 2.1 percent of GDP in 2018 ................................................... 23 Figure B.1: Indonesia’s improvement in school attainment has been impressive – doubling in the past 25 years ..... 27 Figure B.2: Quality of education has also improved despite a setback at the turn of the century ............................... 27 Figure B.3: Most Indonesians are functionally illiterate, in sharp contrast to Vietnam and OECD countries ........... 28 Figure B.4: Human capital reform and boosting education outcomes have the potential to increase long-term
economic growth ........................................................................................................................................................ 29 Figure B.5: School enrollment of 16–18-year-olds grew for all income levels, but faster growth was registered among
poorer Indonesians .................................................................................................................................................... 30 Figure B.6: Indonesia increased its PISA scores in a context of rapid growth in student enrollment between 2003
and 2015 ...................................................................................................................................................................... 33 Figure B.7: PISA math scores improved for all students between 2003 and 2015, but improvement for poorer
students has been smaller .......................................................................................................................................... 33 Figure B.8: According to school principals, schools in Indonesia lack many critical resources .................................. 34 Figure B.9: Resources for education have increased significantly since 2001 ............................................................... 35 Figure B.10: Distribution of education budget (2018) .................................................................................................... 35 Figure B.11: Indonesia is one of the countries with the lowest expenditures in education among PISA participants 36 Figure B.12: Smaller districts tend to have low capacity to manage the education system .......................................... 40 Figure B.13: Most districts do not fulfill all MSS, with larger gaps in facilities and infrastructure MSS at the school
level, signaling poor school conditions ..................................................................................................................... 40 Figure B.14: As new schools appear, the average school size in the district decreases ................................................ 41 Figure B.15: Most teachers have bachelor university degrees (S1) ................................................................................ 43 Figure B.16: Half of general education teachers are certified, and significant number of non-certified teachers are
also eligible for certification ...................................................................................................................................... 43 Figure B.17: Young teachers tend to be contract teachers, subject to non-standard contract procedures .................. 44

Figure B.18: Overall knowledge of teachers is low, but lower among contract teachers in public schools ................. 44 Figure B.19: Age structure of teachers ............................................................................................................................ 44 Figure B.20: Scores in the National Exam have decreased in recent years, as regulations changed and integrity was
promoted .................................................................................................................................................................... 48 Figure B.21: New integrity promoting mechanisms are affecting the scores of schools that previously had lower
levels of integrity ........................................................................................................................................................ 48
APPENDIX FIGURES
Appendix Figure 1: Real GDP growth ............................................................................................................................ 58 Appendix Figure 2: Contribution to GDP growth (production) .................................................................................... 58 Appendix Figure 3: Motorcycle and motor vehicle sales ............................................................................................... 58 Appendix Figure 4: Consumer indicators....................................................................................................................... 58 Appendix Figure 5: Industrial production indicators and manufacturing PMI ............................................................ 58 Appendix Figure 6: Balance of payments ....................................................................................................................... 58 Appendix Figure 7: Current account components ......................................................................................................... 59 Appendix Figure 8: Exports of goods ............................................................................................................................. 59 Appendix Figure 9: Imports of goods ............................................................................................................................. 59 Appendix Figure 10: Reserves and capital flows ............................................................................................................ 59 Appendix Figure 11: Inflation ......................................................................................................................................... 59 Appendix Figure 12: Monthly breakdown of CPI .......................................................................................................... 59 Appendix Figure 13: Inflation comparison across countries ......................................................................................... 60 Appendix Figure 14: Domestic and international rice prices ......................................................................................... 60 Appendix Figure 15: Poverty and unemployment rate ................................................................................................... 60 Appendix Figure 16: Regional equity indices ................................................................................................................. 60 Appendix Figure 17: Selected currencies against USD .................................................................................................. 60 Appendix Figure 18: 5-year local currency government bond yields ............................................................................. 60 Appendix Figure 19: Sovereign USD bond EMBIG spread ........................................................................................... 61 Appendix Figure 20: Commercial and rural credit and deposit growth ........................................................................ 61 Appendix Figure 21: Banking sector indicators ............................................................................................................. 61 Appendix Figure 22: Government debt .......................................................................................................................... 61 Appendix Figure 23: External debt ................................................................................................................................. 61
TABLES
Table A.1: Indonesia’s Balance of Payment (BOP) ....................................................................................................... 10 Table A.2: Key economic indicators ............................................................................................................................... 20 Table A.3: Indonesia’s key commodities’ annual weight in the commodity export basket ......................................... 21 Table A.4: The World Bank projects lower revenue and expenditure than in the 2018 Budget ................................... 25 Table B.1: The Constitutional Amendment established the right to education for all Indonesians ............................ 29 Table B.2: School characteristics by socioeconomic conditions ................................................................................... 34 Table B.3: Indonesia expenditure in education is below most countries in East Asia ................................................. 36 Table B.4: Estimated distribution of APBN by province size ....................................................................................... 38 Table B.5: Classes, teachers, and students – Primary education by school size ........................................................... 45 Table B.6: Summary of main actions introduced recently ............................................................................................. 50
APPENDIX TABLES
Appendix Table 1: Budget outcomes and projections ................................................................................................... 62 Appendix Table 2: Balance of payments ........................................................................................................................ 62 Appendix Table 3: Indonesia’s historical macroeconomic indicators at a glance ........................................................ 63 Appendix Table 4: Indonesia’s development indicators at a glance ............................................................................. 64
BOXES
Box A.1: Private consumption growth in Indonesia: a cause for concern? ..................................................................... 5 Box B.1: Alignment of Indonesia policy reform with international best practices ........................................................ 32 Box B.2: KIAT Guru: Improving Teacher Performance and Accountability through Citizen Engagement and
Performance-based Pay ............................................................................................................................................. 46 Box B.3: MORA Education and Challenges .................................................................................................................. 49
L e a r n i n g m o r e , g r o w i n g f a s t e r I n d o n e s i a E c o n o m i c Q u a r t e r l y
J u n e 2 0 1 8 T H E W O R L D B A N K | B A N K D U N I A
1
Executive Summary
The Indonesian economy continued to expand at a robust pace in the first quarter of 2018, lifted by strong investment. Real GDP growth came in at 5.1 percent in Q1 2018, slightly less than the 5.2 percent recorded in Q4 2017. Higher global commodity prices spurred stronger investment, especially in machine, equipment, and vehicles. As a result, gross capital fixed formation grew by 7.9 percent, the fastest pace in more than 5 years. Higher growth in machinery investment also led to a further pickup in imports, which grew more than twice the pace of exports, and acted as a drag on growth. Meanwhile, private consumption growth remained flat at 5.0 percent, despite early signs of recovering retail sales. Growth on the production side was broad-based, and gross value added at producer prices accelerated in the quarter.
The current account deficit narrowed in Q1, as the services trade deficit shrank sharply. The current account deficit narrowed to 2.1 percent of GDP in Q1, from 2.3 percent of GDP in Q4, partly on stronger foreign tourist arrivals. On a year-on-year basis, total imports grew nearly twice as fast as exports, as import-intensive investments surged and exports slowed.
Inflation eased in Q1 on base effects. Headline consumer price inflation slowed to an average of 3.3 percent yoy in Q1 2018, the lowest quarterly average since Q4 2016. Core inflation also fell from Q4’s average of 3.0 percent to 2.7 percent in Q1. Lower headline reading was largely due to smaller increases in housing, electricity, gas, and fuel prices, because of high base effects in Q1 2017 due to electricity tariff hikes. Food price inflation, however, has been rising.
Government spending rebounded, but mainly due to an increase in fuel subsidies and social aid spending. In the first 4 months of 2018, government revenues saw significant growth, reaching a 10-year high. Expenditures also surged due to higher fuel subsidies and social aid spending, while capital spending contracted.
Tighter global financial conditions and increased volatility contributed to capital outflows and a
1There are early signs indicating that the selloff of Indonesian assets has eased and investors are returning to take advantage of
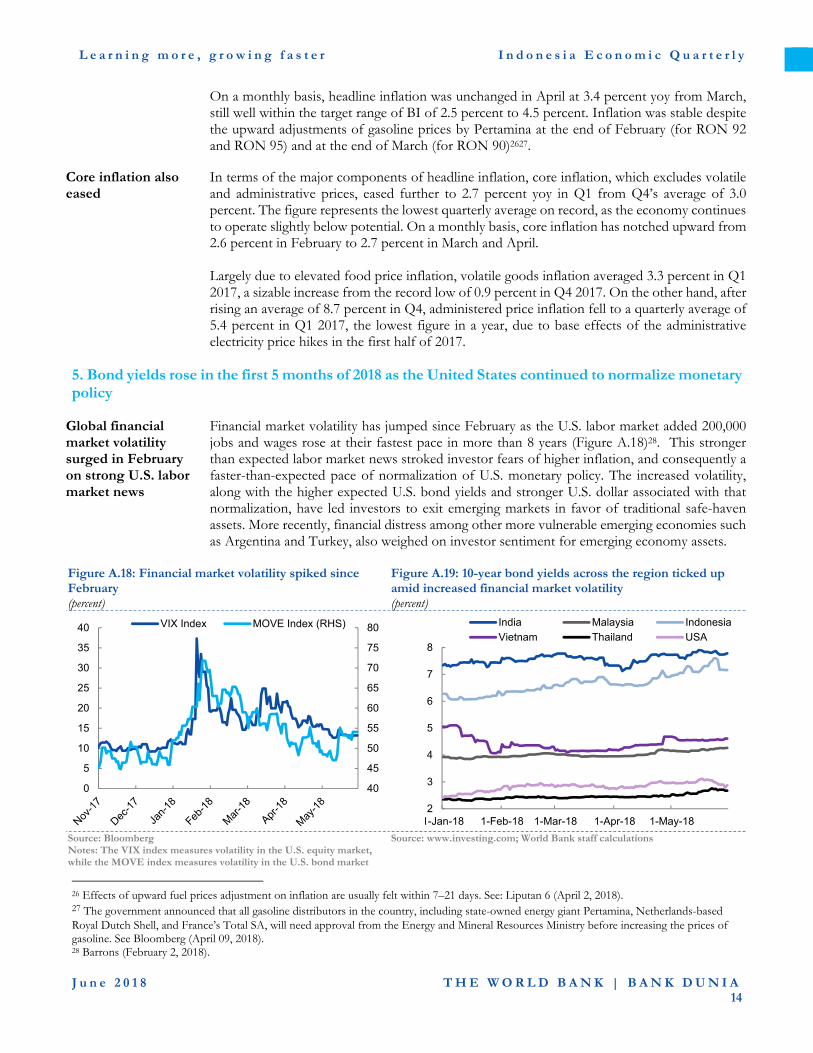
depreciating Rupiah. With the normalization of U.S. monetary policy projected to accelerate, global financial conditions have tightened faster than expected, resulting in bouts of volatility among emerging economies in recent months. U.S. policy tightening has led to substantial portfolio outflows, resulting in a balance of payments deficit of 1.5 percent of GDP in Q1, the first deficit in two years. Because of Indonesia’s relatively high exposure to foreign portfolio investors, who hold 40 percent of Indonesia’s domestic government debt, yields and the Rupiah were under pressure: Indonesian bond yields rose 21 basis points in Q1, while the Rupiah reached a 31-month low against the U.S. dollar. Expectations of a larger current account deficit linked to faster investment growth also pressured the currency1.
A sound macroeconomic policy framework provides buffers against rising global volatility. Monetary policy has been sound, keeping real interest rates in positive territory and anchoring inflation expectations. Most recently, despite stable inflation, Bank Indonesia (BI) raised interest rates twice, 25 bps each time, to signal its commitment to stability. Record-level reserves and bilateral swap agreements enable BI to provide support to the Rupiah, although the central bank has appropriately not targeted a specific level for the currency. In addition, the Rupiah remains 5.3 percent stronger than in January 2014 in real effective terms, following an extended spell of real appreciation post Taper Tantrum. Macroprudential measures, notably those related to hedging of foreign currency exposure by corporates, further contributes to resilience. Even though fiscal deficits have been well contained, a fiscal consolidation has been targeted for 2019, an election year, as a further sign of commitment to stability. Four credit ratings upgrades in the past twelve months corroborate the country’s improved economic environment, fiscal management, and overall credit worthiness.
The outlook continues to be largely positive, but risks are increasing. As global economic growth is projected to slow and trade flows moderate from recent highs2, Indonesia’s GDP growth is projected to reach
Indonesian assets at a discount. See Bloomberg (May 17, 2018) and Bloomberg (May 25, 2018). 2 World Bank (2018b).

L e a r n i n g m o r e , g r o w i n g f a s t e r I n d o n e s i a E c o n o m i c Q u a r t e r l y
J u n e 2 0 1 8 T H E W O R L D B A N K | B A N K D U N I A
2
5.2 percent in 2018 (Table 1). Private consumption is expected to pick up modestly, while investment growth is projected to remain robust, considering the continued strength of commodity prices. Given the import-intensive nature of investment, net exports will continue to weigh on economic growth, as exports growth slows in line with easing global trade. Risks to the outlook are tilted to the downside amid the continued tightened monetary conditions and bouts of financial volatility centered around more vulnerable emerging economies, such as Argentina and Turkey.
Table 1: Real GDP growth is expected to rise to 5.2 percent in 2018
2017 2018f
Real GDP (Annual percent change)
5.1 5.2
Consumer price index
(Annual percent change)
3.8 3.5
Current account balance
(Percent of GDP) -1.7 -2.0
Government budget balance
(Percent of GDP) -2.5 -2.1
Source: BI; Central Bureau of Statistics (BPS); Ministry of Finance; World Bank staff calculations Note: 2017 actual outcome; f stands for World Bank forecast
The current account deficit is expected to widen with stronger domestic demand, weaker terms-of-trade and slower global growth. In line with the projected moderation of commodity prices towards the second half of the year and continued strength in domestic demand, the current account deficit is expected to widen. Exports are forecast to ease further as global growth and trade are expected to slow. Headline inflation is expected to remain low this year and edge up in 2019 because of higher import costs associated with higher crude oil prices and a weaker currency. Government revenues are expected to increase gradually, as critical revenue enhancing reforms are implemented, boosting total collections and enlarging fiscal space for additional spending.
Downside risks to the outlook are substantial and mostly external, including continued volatility in the financial and capital markets, and slower global trade. While the continued normalization of U.S. monetary policy to date has been proceeding in a relatively orderly manner, there is still a significant risk of further volatility in global financial and capital markets. The rapid rise in U.S. yields has already sparked financial distress in Argentina and Turkey. Such continued volatility could cause financing costs to hike
even more sharply for emerging economies. At the same time, with trade protectionism on the rise, there is a real risk that the recent acceleration in global trade could stall, weighing on Indonesian exports and hence growth. Further escalation in protectionist measures and sentiment could lead to an even larger drag of the external sector onto Indonesia’s economic growth.
This edition includes a focus topic that discusses how 15 years of education reforms have helped to improve education outcomes and human capital in Indonesia, and what challenges remain.
The outcomes from 15 years of educational reform have been mixed, with a significant expansion in access, but a large deficit in quality. In 2002, Indonesia embarked on a series of policy reforms to strengthen access to and the quality of education, both key determinants of human capital development. After 15 years, however, the results of the reforms have been mixed. Enrolments have grown significantly, but student learning remains below the levels of other countries in the region. For example, 55 percent of 15-year olds are functionally illiterate, compared to less than 10 percent in Vietnam.
Education reform covered the right areas, but implementation challenges led to uneven results. Most elements of the reforms were aligned with international best practices and had strong potential to improve Indonesian education outcomes. Education reform included increasing financing for education, enhancing participation of local actors in sector governance, strengthening accountability, improving the quality of teachers, and ensuring students’ preparedness as they enter schooling. Significant implementation challenges prevented the policy reform from reaching its full potential.
While steps have been taken to address some of these challenges, further actions are urgently needed. In particular, measures need to be taken to stop growing inequality in student results, and to take advantage of the opportunity generated by the large number of teachers retiring in the next decade. Key recommendations include: defining and enforcing qualification criteria to be met by every teacher who enters the classroom, complementing the existing financing mechanisms for education with a targeted, performance-based transfer for lagging schools and districts, and launching a national education quality campaign to generate public awareness and pressure for effective action to improve student learning.

L e a r n i n g m o r e , g r o w i n g f a s t e r I n d o n e s i a E c o n o m i c Q u a r t e r l y
J u n e 2 0 1 8 T H E W O R L D B A N K | B A N K D U N I A
3
A. Economic and Fiscal Update
1. Indonesian economic growth eased in Q1 2018
Real GDP growth was 5.1 percent in Q1 2018, marginally lower than the 5.2 percent recorded in Q4
The Indonesian economy grew 5.1 percent year-on-year (yoy) in Q1 2018. This was a tick slower than the 5.2 percent in Q4 2017, and also below consensus forecasts of 5.2 percent. The marginal moderation in GDP growth was in part due to imports growing faster than exports, as well as easing government consumption growth (Figure A.1). Imports growth, more than doubled that of exports, partly reflected the acceleration in investment growth that was the most rapid since Q4 2012. Private consumption growth was stable, while government consumption growth moderated from its higher growth in Q4, which partly resulted from base effects. On the production side, the manufacturing sector contributed the most to growth (1.0 pp in Q1) as it did in Q4 2018. Construction and the transport and communication sectors, however, saw the fastest growth. Overall, the Q1 outcome was broadly consistent with the pattern seen in the previous quarter where strong investment is supporting overall output growth, but also leading to high imports growth, such that the external sector contributes negatively to growth.
Figure A.1: Net exports were a drag on GDP growth in Q1 (contributions to growth yoy, percentage points)
Source: BPS; World Bank staff calculations
-3
-2
-1
0
1
2
3
4
5
6
7
8
Mar-15 Dec-15 Sep-16 Jun-17 Mar-18
Change in inventoriesStat. discrepancy*Net exportsInvestmentGovernment consumptionPrivate consumptionGDP

L e a r n i n g m o r e , g r o w i n g f a s t e r I n d o n e s i a E c o n o m i c Q u a r t e r l y
J u n e 2 0 1 8 T H E W O R L D B A N K | B A N K D U N I A
4
Fixed investment growth accelerated again, further supporting GDP growth
Gross fixed capital formation once again was the economy’s bright spot, growing 7.9 percent yoy in Q1, up from 7.3 percent in Q4, partly due strong commodity prices and manufacturing activity (Figure A.2). Machine and equipment investment saw the fastest growth, rising from 22.3 percent in Q4 2017 to 23.7 percent, partly fueled by nominal capital goods imports growth that averaged 27 percent in Q1 2018. Investment in vehicles rebounded from a contraction in Q4 2017 to reach a 14.4 percent jump in Q1. While buildings and structures investment growth eased from 6.7 percent in Q4 2017 to 6.2 percent in Q1 2018, it remained the largest component of investment (75 percent).
Figure A.2: A jump in machinery and equipment and vehicle investment led to stronger fixed capital formation (contributions to growth yoy, percentage points)
Source: BPS; World Bank staff calculations
Figure A.3: High frequency indicators for private consumption point to a mixed picture (percent)
Figure A.4: Social spending drove nominal government consumption (percent)
Source: CEIC; World Bank staff calculations Source: CEIC; World Bank staff calculations
Private consumption growth was stable in Q1 at 5.0 percent
Private consumption growth remained at 5.0 percent, unchanged from Q4. Within aggregate private consumption, household consumption growth eased marginally to 4.9 percent from 5.0 in Q4 2017. The consumption by non-profit institutions surged 8.1 percent in Q1, but remains only a small proportion (just under 2 percent) of total private consumption. Within household consumption, consumption of food and beverages was once again the largest contributor to private consumption growth with 1.8 pp, but the hotel and restaurant sector grew the fastest at 5.6 percent. The trend of growth in consumption of services outpacing growth in consumption of goods continued in Q1, but the margin between the growth rates has narrowed to only 0.2 percentage points (compared to an average of 0.4 percentage points over the past 3 years). Over the past year, a disconnect between the higher frequency indicators that are typically referred to as a gauge for overall consumption and consumption in the national accounts has become apparent (Box A.1). This disconnect between higher frequency indicators of
80
90
100
110
120
130
-20
-10
0
10
20
30
Dec-16 Apr-17 Aug-17 Dec-17 Apr-18
Consumer Confidence Index
Retail Sales Index
Motorcycle Sales
Passenger Car Sales
-20
-10
0
10
20
30
40
Q12016 Q32016 Q12017 Q32017 Q12018
Personnel Material
Social Others
Total
-2
-1
0
1
2
3
4
5
6
7
8
Mar-15 Dec-15 Sep-16 Jun-17 Mar-18
Intellectual Property Cultivated Bio. Res. Other Equipments Vehicles Machine & Equipment Buildings & StructuresInvestment
L e a r n i n g m o r e , g r o w i n g f a s t e r I n d o n e s i a E c o n o m i c Q u a r t e r l y
J u n e 2 0 1 8 T H E W O R L D B A N K | B A N K D U N I A
5
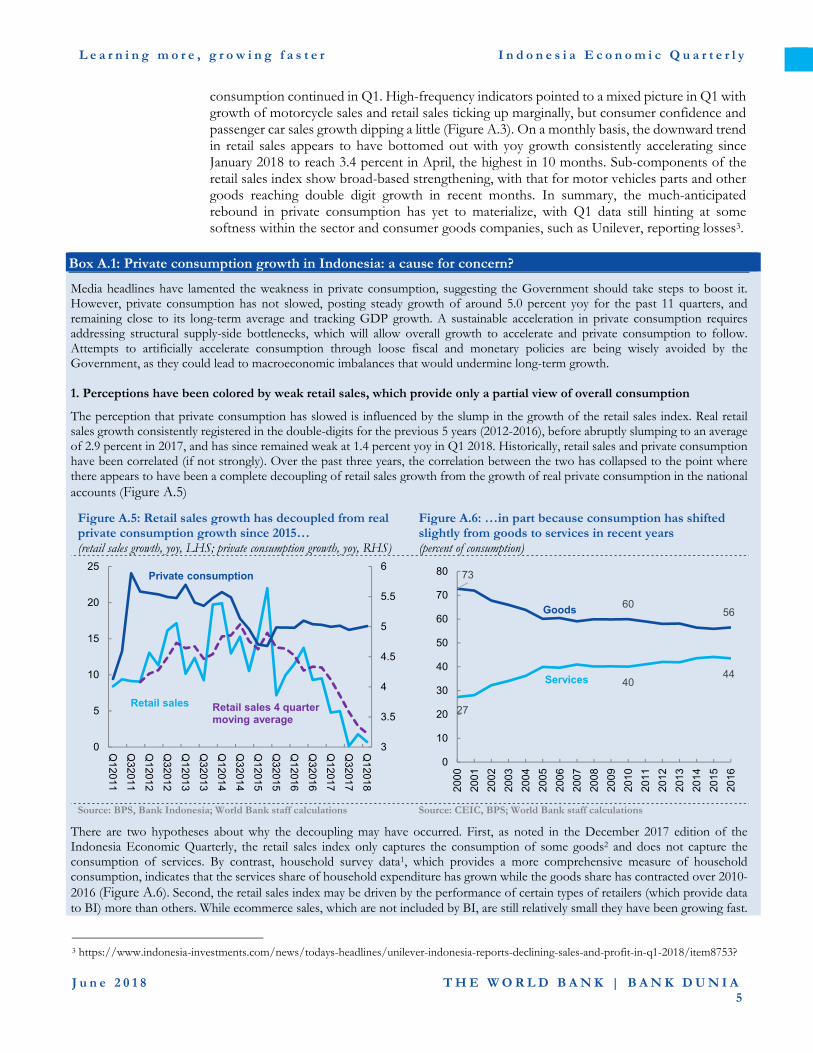
consumption continued in Q1. High-frequency indicators pointed to a mixed picture in Q1 with growth of motorcycle sales and retail sales ticking up marginally, but consumer confidence and passenger car sales growth dipping a little (Figure A.3). On a monthly basis, the downward trend in retail sales appears to have bottomed out with yoy growth consistently accelerating since January 2018 to reach 3.4 percent in April, the highest in 10 months. Sub-components of the retail sales index show broad-based strengthening, with that for motor vehicles parts and other goods reaching double digit growth in recent months. In summary, the much-anticipated rebound in private consumption has yet to materialize, with Q1 data still hinting at some softness within the sector and consumer goods companies, such as Unilever, reporting losses3.
Box A.1: Private consumption growth in Indonesia: a cause for concern?
Media headlines have lamented the weakness in private consumption, suggesting the Government should take steps to boost it. However, private consumption has not slowed, posting steady growth of around 5.0 percent yoy for the past 11 quarters, and remaining close to its long-term average and tracking GDP growth. A sustainable acceleration in private consumption requires addressing structural supply-side bottlenecks, which will allow overall growth to accelerate and private consumption to follow. Attempts to artificially accelerate consumption through loose fiscal and monetary policies are being wisely avoided by the Government, as they could lead to macroeconomic imbalances that would undermine long-term growth. 1. Perceptions have been colored by weak retail sales, which provide only a partial view of overall consumption
The perception that private consumption has slowed is influenced by the slump in the growth of the retail sales index. Real retail sales growth consistently registered in the double-digits for the previous 5 years (2012-2016), before abruptly slumping to an average of 2.9 percent in 2017, and has since remained weak at 1.4 percent yoy in Q1 2018. Historically, retail sales and private consumption have been correlated (if not strongly). Over the past three years, the correlation between the two has collapsed to the point where there appears to have been a complete decoupling of retail sales growth from the growth of real private consumption in the national accounts (Figure A.5)
Figure A.5: Retail sales growth has decoupled from real private consumption growth since 2015… (retail sales growth, yoy, LHS; private consumption growth, yoy, RHS)
Figure A.6: …in part because consumption has shifted slightly from goods to services in recent years (percent of consumption)
Source: BPS, Bank Indonesia; World Bank staff calculations Source: CEIC, BPS; World Bank staff calculations
There are two hypotheses about why the decoupling may have occurred. First, as noted in the December 2017 edition of the Indonesia Economic Quarterly, the retail sales index only captures the consumption of some goods2 and does not capture the consumption of services. By contrast, household survey data1, which provides a more comprehensive measure of household consumption, indicates that the services share of household expenditure has grown while the goods share has contracted over 2010-2016 (Figure A.6). Second, the retail sales index may be driven by the performance of certain types of retailers (which provide data to BI) more than others. While ecommerce sales, which are not included by BI, are still relatively small they have been growing fast.
3 https://www.indonesia-investments.com/news/todays-headlines/unilever-indonesia-reports-declining-sales-and-profit-in-q1-2018/item8753?
3
3.5
4
4.5
5
5.5
6
0
5
10
15
20
25
Q12011
Q32011
Q12012
Q32012
Q12013
Q32013
Q12014
Q32014
Q12015
Q32015
Q12016
Q32016
Q12017
Q32017
Q12018
Private consumption
Retail sales Retail sales 4 quarter moving average
73
6056
27
4044
0
10
20
30
40
50
60
70
80
200
0
200
1
200
2
200
3
200
4
200
5
200
6
200
7
200
8
200
9
201
0
201
1
201
2
201
3
201
4
201
5
201
6
Goods
Services

L e a r n i n g m o r e , g r o w i n g f a s t e r I n d o n e s i a E c o n o m i c Q u a r t e r l y
J u n e 2 0 1 8 T H E W O R L D B A N K | B A N K D U N I A
6
In addition, small and mid-size retailers, which anecdotal evidence suggests have been seeing stronger sales growth, may not be adequately reflected in BI’s sample.
Regardless of the reason for the decoupling, the retail sales index does not reflect a complete picture of real private consumption as measured by the national accounts, which is the broader measure of household welfare.
2. Private consumption growth has been steady at a level compatible with Indonesia’s potential GDP growth, in line with a consistent macroeconomic policy framework
Figure A.7 shows that real private consumption grew by 5.0 percent yoy in 2017, only slightly below its ten-year annual average growth of 5.1 percent and well above the average of the first commodity boom period of 4.1 percent. In part, this reflects the steady growth of the Indonesian economy, which has also hovered at 5.0 percent since 2014. Figure A.8 shows that the trend in private consumption growth has tracked that of potential output in recent years.
It is possible for consumption growth to accelerate through stimulative fiscal and monetary policies. A Vector-Auto Regression (VAR) analysis confirms that, on average3, lower interest rates, a stronger Rupiah, and lower inflation lead to higher consumption growth. However, fiscal and monetary stimulus may lead to macroeconomic imbalances as the economy needs to supply the goods and services demanded by consumers through imports (which leads wider current account deficits), or at a higher price given higher demand (which leads to higher inflation). In the not too distant past, Indonesia’s economic performance was characterized by imbalances (for example, persistently large current account deficits) and higher rates of inflation – along with slightly higher consumption growth. In contrast, recent years have been characterized by a sound macroeconomic environment4 which has been underpinned by effective economic management by both major arms of macroeconomic policy – monetary and fiscal policy. Bank Indonesia has astutely managed its main policy tool – the policy rate – such that, over the past two years, inflation has remained well contained within its target band, real interest rates have been consistently positive, and the Rupiah has been largely resilient in the face of major global economic developments. Consumption growth has therefore been close to the growth of the overall economy.
Figure A.7: Consumption has been near its 10-year average… (growth of real private consumption, yoy, percent)
Figure A.8: … and consistent with Indonesia’s current pace of GDP growth (yoy, percent)
Source: BPS, Bank Indonesia; World Bank staff calculations Source: BPS, World Bank staff calculations Note: Statistical techniques such as the HP filter are used to estimate potential growth rates
3. Policy implications: focus on structural bottlenecks to growth and consumption will follow
When the economy is operating close to potential and macroeconomic policies are consistent, it is not private consumption growth that drives GDP growth. Rather, GDP growth depends on human and physical capital accumulation and productivity growth. Given the large infrastructure, human capital and productivity gaps that only recently started to be addressed, Indonesia has been growing steadily and near its potential growth rate over the past few years, and a natural corollary of that has been that private consumption growth (the largest component of GDP) has followed the same trend. The current policy focus on maintaining macroeconomic stability through a consistent policy framework is therefore appropriate, and can in fact contribute to higher potential GDP growth by solidifying Indonesia’s reputation for sound macroeconomic management.
2017: 4.98
2001-2007 average:
4.05
2007-2017 average: 5.11
3.0
3.5
4.0
4.5
5.0
5.5
6.0
200
1
200
2
200
3
200
4
200
5
200
6
200
7
200
8
200
9
201
0
201
1
201
2
201
3
201
4
201
5
201
6
201
7
0
1
2
3
4
5
6
7
8
200
020
01
200
220
03
200
420
05
200
620
07
200
820
09
201
020
11
201
220
13
201
420
15
201
620
17
Real private consumption growth
GDP growth (HP-filtered)

L e a r n i n g m o r e , g r o w i n g f a s t e r I n d o n e s i a E c o n o m i c Q u a r t e r l y
J u n e 2 0 1 8 T H E W O R L D B A N K | B A N K D U N I A
7
For consumption growth to pick up sustainably from its current flat trajectory without creating policy-related imbalances will require supply-side reforms that will raise the potential economic growth rate. 1 From the National Social Economic Survey (SUSENAS). 2 Starting 2012, the Bank Indonesia retail sales survey encompasses: (i) spare parts and accessories, (ii) foods, beverages and tobacco, (iii) automotive fuels, (iv) equipment and communication in stores; (v) other household equipment; (vi) handicraft and recreation and (vii) other goods. 3 World Bank (forthcoming)
4 Cited by the three major credit rating agencies as the main reason for granting Indonesia rating upgrades over the past 12 months.
Growth of real government consumption slowed in Q1, partly due to high base effects in Q4
Real government consumption growth moderated to 2.7 percent yoy from 3.8 percent in Q4 2017. The slower growth was partly due to one-off higher growth in the previous quarter, resulting from base effects associated with public expenditure cuts in Q4 2016. In contrast, nominal government consumption rose 12.9 percent in Q1, compared to 8.8 percent in Q4 2017. This was the fourth consecutive quarterly increase and the fastest pace of nominal growth since Q2 2016 (Figure A.4). The increase was driven by surging nominal social spending as the government decided to roll out advance payments for its subsidized social insurance program (PBI), as well as to increase the coverage of the Family Hope program (PKH)4. This was the largest increase in nominal social spending since Q1 2014.
Net exports subtracted from growth in Q1
Amidst a pickup in the growth of global merchandise goods trade (in volume terms), to its fastest pace of growth since Q1 2011, net exports continued to be a drag on overall GDP growth in Indonesia as imports growth more than doubled that of exports in Q1. Imports growth accelerated to 12.7 percent in Q1, compared to 11.8 percent in Q4 2017, partly due to strong import-intensive investments. Meanwhile, exports growth eased to 6.2 percent in Q1 from 8.5 percent in Q4. The moderation in exports growth was mainly due to a contraction in oil and gas exports, only partially offset by a strengthening in services exports. The much stronger imports growth relative to exports growth is in line with global trends which saw robust imports growth, but easing exports growth.
On the production side, construction and transport and telecommunication sectors drove growth in Q1
In gross value-added terms, growth was 4.8 percent in Q1 compared to 5.0 percent in Q4 2017 (Figure A.9). While the manufacturing sector contributed the most (1.0 percentage point) to growth in Q1, the construction and the transport and communication sectors were the main growth drivers. Growth in these latter two sectors was 7.4 percent and 8.6 percent, respectively, while manufacturing expanded 4.5 percent. This is in line with the continued strength in machines and equipment, and vehicles investment. Meanwhile, agriculture sector growth reversed the downward trajectory seen throughout 2017 and accelerated to 3.2 percent in Q1. Mining and quarrying once again contributed the least to overall GDP growth (0.06 pp) in Q1, and growing just 0.7 percent. This outcome is a little puzzling as it contrasts to the trajectory of commodity prices. However, in
Figure A.9: Among the key economic sectors, manufacturing remained the main contributor to growth in Q1 (contributions to growth yoy, percentage points)
Source: CEIC; World Bank staff calculations
4 https://www.kemenkeu.go.id/media/9955/apbn-kita-edisi-mei-2018.pdf
-1
0
1
2
3
4
5
6
Mar-15 Mar-16 Mar-17 Mar-18
Tax-subsidy ServicesFinancial services Transport & commTrade, hotel & rest ConstructionElectricty, gas & water ManufacturingMining & quarrying AgricultureTotal GDP

L e a r n i n g m o r e , g r o w i n g f a s t e r I n d o n e s i a E c o n o m i c Q u a r t e r l y
J u n e 2 0 1 8 T H E W O R L D B A N K | B A N K D U N I A
8
nominal terms, the mining and quarrying category reversed the downward trend seen over the past 4 quarters. In Q1, it grew 5.0 percent compared to 2.9 percent in Q4 2017.
2. Commodity prices continued to strengthen in Q1
The price of Indonesia’s commodity basket improved in Q1
In line with the continued recovery in commodity prices that began two years ago, prices for most of Indonesia’s key export commodities continued to improve in Q1. Prices for coal, crude oil, liquefied natural gas (LNG), and base metals booked an average yoy growth of 2.4 percent in Q1 2018, higher than nearly 15.0 percent of average yoy growth seen in Q4 2017. In contrast, prices of both rubber and crude palm oil (CPO) eased further by 22.2 percent, continuing its downward trend seen in Q4 on the back of ample global supply. Coal prices rose an average 25.6 percent yoy in Q1, reaching a near six-year high, much stronger than the 5.9 percent increase seen in Q4 2017. The surge in prices was spurred by strong demand due to cold weather and production constraints in China, coupled with the scarce availability of its substitute5. Nevertheless, the decision of the Chinese government to cap coal import prices at around USD 118/mt in February6 will limit the upward trajectory of prices going forward. Similarly, on strong consumption and constrained supply7, oil prices reached a 3.5 year high in Q1, rising 22.0 percent in Q1 2018, continuing the 19.6 percent growth seen in Q4 2017. Base metals prices increased by 18.4 percent due to a further pickup in demand, partially reflecting hopes from buoyant electric vehicle demand and the risk of Russian sanctions. LNG prices also rose an average of 18.4 percent in Q1 2018, as a strong winter consumption depleted storage levels in all main regions.
Rubber prices, in contrast,
continued their downward trajectory, down 31.7 percent in Q1, following 15.6 percent decline in Q4 2017. The rubber market is still oversupplied because of last year’s large output8. A recovery in rubber prices may not be seen anytime soon as global exports are likely to increase with the recent expiration of the agreement by Thailand, Malaysia, and Indonesia to curb exports by 350,000 metric tons. The three countries account for about 70 percent of global production. Along with other edible oils, oversupply in Indonesia and Malaysia are still exerting downward pressure on CPO prices9.
Figure A.10: Apart from the price of oil that continues its rally, prices for Indonesia’s other key commodities were largely stable (index January 2016 = 100)
Source: World Bank Pink Sheet; CEIC; World Bank staff calculations Note: LNG stands for Liquefied Natural Gas and CPO stands for Crude Palm Oil
5 Weak hydro power availability and natural gas shortages further boosted coal consumption for heat and power generation 6 The price cap was intended to encourage domestic production and curtail coal imports. The average prices of coal during Q1 2018 was USD 102.4/mt 7Rising geopolitical tensions also threatened oil exports on several fronts. This includes the possible reinstatement of U.S. sanctions against Iran, military escalation in Syria, and tensions between Saudi Arabia and Iran. OPEC’s supply cuts have continued to be deeper than expected, as unplanned production losses in Venezuela have cut the country’s production by more than half a million barrels per day compared to last year. 8Global production reached 13.4 million metric ton (mmt) in 2017, upped 9 percent from 2016. On the other hand, consumption was at 13.1 mmt at the end of 2017, resulting in 0.3 mmt of oversupply. 9The production outlook for edible oils for the current season is promising despite some challenges in the form of La Nina (World Bank, 2018a)
60
100
140
180
220
260
Jan-
16
Mar
-16
May
-16
Jul-1
6
Sep
-16
Nov
-16
Jan-
17
Mar
-17
May
-17
Jul-1
7
Sep
-17
Nov
-17
Jan-
18
Mar
-18
Base metals
Coal
Crude oil
LNG
Rubber
Index
CPO

L e a r n i n g m o r e , g r o w i n g f a s t e r I n d o n e s i a E c o n o m i c Q u a r t e r l y
J u n e 2 0 1 8 T H E W O R L D B A N K | B A N K D U N I A
9
In April 2018, apart from rubber and palm oil that exhibited declining trends, prices for other commodities continued their rallies. Among the six commodities, the price of oil booked the highest growth, upped 31.9 percent (Figure A.10).
Figure A.11: Prices for Indonesia’s key commodities at the end of April 2018 are generally higher than the World Bank forecasts for 2018 (index 2015=100)
Figure A.12: Exports volumes of Indonesia’s key commodities (growth yoy, percent)
Source: World Bank (2018); World Bank staff calculations Note: f stands for forecast
Source: CEIC; World Bank; World Bank staff calculations Note: Data for export of palm oil and rubber aren’t available post 2017
Growth of export of commodities remained strong
In line with the continued recovery in global commodity prices, Indonesia’s exports of raw commodities, crude oil, coal, LNG and base metals remained strong in Q1, growing an average of 20.4 percent, up from 15.4 percent in Q4. This continued robust outturn is despite the high base seen in Q1 2017. All else being equal, it is expected for growth to be even stronger next quarter due to low base effects observed in Q2 2017 (Figure A.12).
The prices of Indonesia’s key commodities are forecast to decline in 2018
The prices of crude oil, LNG, and base metals are projected to rise in 2018 while the prices of coal, rubber, and palm oil are expected to ease (World Bank, 2018a). Oil prices are forecast to rise to an average of USD 65/bbl in 2018 from USD 53/bbl in 2017, on strong demand and continued restraint in OPEC and non-OPEC production, notwithstanding increases in U.S. shale oil production.10 Higher oil prices are expected to eventually feed into higher natural gas prices. Coal prices are expected to retreat to USD 85/mt in 2018 from USD 88/mt in 2017 following an advance of nearly 30 percent in 2017. Weaker coal prices are in line with expected slowing demand, especially in China, where an environmentally-friendly initiative is underway
10The longer-term outlook for oil prices depends heavily on the balance between rising U.S. oil production, and the persistence and depth of OPEC production cuts. At its June meeting, OPEC is scheduled to consider extending or amending output limits in conjunction with non-OPEC producers. An extension of the cuts has been called for by some members, and would further tighten oil markets. However, higher prices will benefit the U.S. shale industry and may result in faster output growth despite increasingly binding capacity constraints in the short term. The evolution of geopolitical tensions will also play an important role in determining oil prices. The renewal of sanctions on Iran could have an adverse impact—prior sanctions resulted in a reduction of around 1 million barrels per day of Iranian exports. An escalation of trade tensions could also hit oil demand, particularly for fuel oil.
0
40
80
120
160
200
Rubber BaseMetals
Coal Crude oil LNG Palm oil
2016 2017 2018(f) Q1-2018 Apr-18
-30
-10
10
30
50
70
Base Metals
Coal
Oil
Gas

L e a r n i n g m o r e , g r o w i n g f a s t e r I n d o n e s i a E c o n o m i c Q u a r t e r l y
J u n e 2 0 1 8 T H E W O R L D B A N K | B A N K D U N I A
10
to reduce coal consumption1112. Metals prices are projected to increase 9 percent in 201813 (Figure A.11).
3. The current account deficit narrowed as higher import of capital goods was offset by narrower service trade deficit
The current account deficit slightly narrowed in Q1
The current account deficit narrowed slightly to 2.1 percent of GDP in Q1 from 2.3 percent of GDP in Q4 2018, on the back of a narrower services trade deficit and income account deficit, which was only partially offset by a narrower goods trade surplus (Table A.1). In terms of total trade, imports expanded nearly twice as fast as exports. Total exports grew 10.2 percent yoy in Q1, slower than the 12.1 percent increase in Q4 2017, partly due to high base effect, as exports had grown 23.4 percent in Q1 2017. In contrast, growth of total imports strengthened to 19.5 percent Q1 from 18.9 percent in the previous quarter. On goods trade, while both imports and exports growth slowed in Q1, imports growth was much stronger than exports growth. In contrast, both service exports and imports jumped in Q1, the service exports growing 18.8 percent and service imports expanding by 18.3 percent. Higher service exports were in part due to the growing arrivals of foreign tourists, while growth in service imports were driven by a surge in transportation-related services. The improvement in the income account deficit was driven by higher remittances from overseas ahead of the fasting month and Lebaran festivities.
Table A.1: Indonesia’s Balance of Payment (BOP) (USD billion unless otherwise indicated)
Q1-2017 Q2-2017 Q3-2017 Q4-2017 Q1-2018 Overall Balance of Payments 4.5 0.7 5.4 1.0 (3.9) Nominal GDP 241.8 252.9 262.9 257.9 258.2 As percent of GDP 1.9 0.3 2.0 0.4 (1.5) Current Account (2.2) (4.7) (4.6) (6.0) (5.5) As percent of GDP (0.9) (1.9) (1.8) (2.3) (2.1)
Goods trade balance 5.6 4.8 5.3 3.1 2.4 Services trade balance (1.2) (2.2) (2.1) (2.3) (1.4) Income (6.6) (7.3) (7.8) (6.8) (6.5) Capital and Financial Accounts 6.9 5.5 10.2 6.8 1.9 As percent of GDP 2.9 2.2 3.9 2.7 0.7 Direct Investment 2.8 4.5 7.6 4.3 3.1 Portfolio Investment 6.5 8.1 4.0 2.0 (1.2) Other Investment (2.4) (7.1) (1.4) 0.7 (0.2)
Source: BI; World Bank staff calculations
11Coal consumption faces long-term structural declines in several consuming regions for both economic and policy reasons. In the United States, low-priced natural gas has reduced coal usage in power generation, and led to a reduction in investment in coal supply. China is investing in cleaner energy sources, reforming its electricity sector to reduce inefficient production, and reducing the energy intensity of its economy—all at the expense of coal. Several European countries plan to end coal consumption over the next decade, and India is seeking to reach peak coal consumption over the same period 12Further upside and downside risk are discussed in detail and can be found in the latest World Bank Commodity Market Outlook, available at http://www.worldbank.org/en/research/commodity-markets. Readers could also refer to the 2017 World Energy Outlook (IEA, 2017) for scenarios of energy demand and supply in the future. 13Upside risks to the price forecast include more robust global demand, as well as production shortages. Supply could be curtailed by slower ramp-up of new capacity, tighter environmental constraints, sanctions against commodity producers, rising costs, and policy action that limits output and exports, notably in China. Downside risks include slower growth in China, risks of higher-than expected production—including the restart of idled capacity—as well as easing production restriction policies in China, and an escalation of trade tensions.

L e a r n i n g m o r e , g r o w i n g f a s t e r I n d o n e s i a E c o n o m i c Q u a r t e r l y
J u n e 2 0 1 8 T H E W O R L D B A N K | B A N K D U N I A
11
The goods trade surplus narrowed in Q1
The goods trade balance narrowed to 0.9 percent of GDP in Q1 from 1.2 percent of GDP in Q4. Goods imports growth slowed slightly to 19.7 percent in Q1, from 20.8 percent in Q4 2017. Meanwhile, goods exports growth eased substantially to 8.9 percent in Q1 from 13.1 percent in Q4 2017. The moderation in the goods exports growth was partly due to a high base effect observed in Q1 2017, and the contraction of exports of key commodities such as oil and oil products14, palm oil, and processed rubber.
Figure A.13: Exports growth slowed down due to a high base in Q1 2017 and lower oil and gas exports growth (contributions yoy growth, percent)
Figure A.14: Growth of imports remained strong, driven by strong imports of capital goods (contributions yoy growth, percent)
Source: CEIC and BI; World Bank staff calculations Notes: The ‘other manufacturing’ category includes paper, paper materials, furniture, plastics, processed foods, chemicals, and ‘other’ goods
Source: CEIC and BI; World Bank staff calculations
The slowing of goods exports growth in Q1 was broad-based
Compared to Q4 2017, the yoy growth of goods exports in Q1 2018 slowed across almost all categories except for agricultural products, processed woods and metals, plastics, and some mining products. Exports of coal15, other manufacturing products (which include paper and paper products, and processed foods), textiles and motor vehicles, in particular, saw softer growth (Figure A.13). The contraction of palm oil and processed rubber exports contributed to the negative contribution of the processed commodities category. This nevertheless was expected, due to ample global supply and the ban by the European Union on Indonesia’s palm oil exports16. Contractions were also seen for oil and oil products exports. Notwithstanding the high base in Q1 2017, this is at odds with the significantly higher oil prices observed in the last several months and relatively strong oil lifting17. Despite gas exports growing stronger in Q1 compared to Q4, the oil, oil products, and gas exports category still grew the least since a year ago. Apart from exports destined for the China18, Japan19, Singapore20, and Thailand21, exports to the rest of the ten top destination countries recorded slower growth than in Q4 2017. China, Japan, Singapore, and Thailand, in addition to the United States, India, South Korea,
14 Oil products, which exclude crude oil, include products derived from the refinery process. 15 Shipment of coal is reportedly down significantly for India, Japan and South Korea. The three countries are responsible for nearly half of Indonesia coal export market. Some of the export, nevertheless, went to China. 16 See discussion in Section A.2 on commodities. 17 The special task force overseeing upstream oil and gas activities in Indonesia (SKK Migas) announced that the lifting oil and gas in Q1 has hit 94 percent of the target outlined in the state budget. Bank Indonesia (2018), on the other hand, explained that oil lifting figures have been disrupted by the adverse weather that disturbed oil transportation. 18 Driven mainly by exports of coal and precious metals. 19 Driven by exports of electrical equipment and raw copper. 20 The main driver is exports of chemical products and processed foods. 21 Exports of coal, vehicles parts, and processed (non-precious) metals drove the growth.
-15
-5
5
15
25
Mar-16 Mar-17 Mar-18
Other miningOthersOther manufacturingElectric, automotive & parts, computersTextile, clothing & footwearProcessed commoditiesCoalOil, oil products and gas -15
-5
5
15
25
Mar-16 Mar-17 Mar-18
FuelCapitalConsumer goods net of fuelsRaw materials net of fuelTotal Goods Imports
L e a r n i n g m o r e , g r o w i n g f a s t e r I n d o n e s i a E c o n o m i c Q u a r t e r l y
J u n e 2 0 1 8 T H E W O R L D B A N K | B A N K D U N I A
12
Netherlands, Philippines, and Malaysia accounted for nearly 70 percent of Indonesia’s exports in 2017, a tad more than their share in 2016.
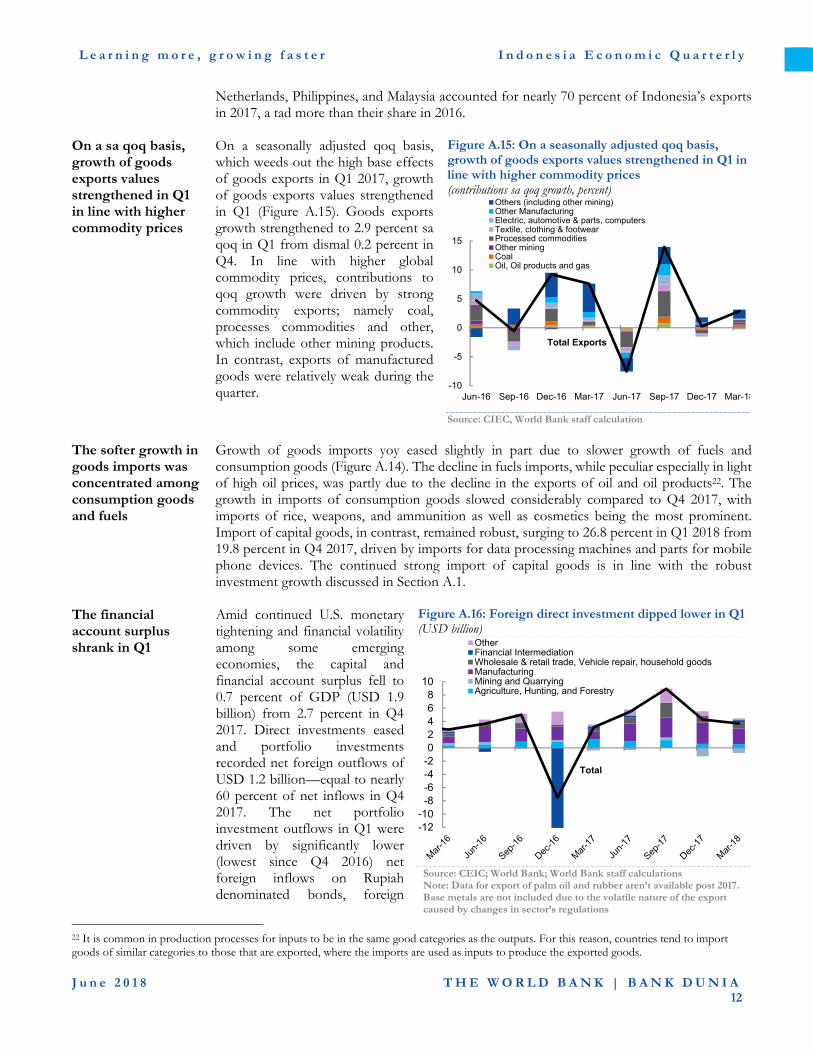
On a sa qoq basis, growth of goods exports values strengthened in Q1 in line with higher commodity prices
On a seasonally adjusted qoq basis, which weeds out the high base effects of goods exports in Q1 2017, growth of goods exports values strengthened in Q1 (Figure A.15). Goods exports growth strengthened to 2.9 percent sa qoq in Q1 from dismal 0.2 percent in Q4. In line with higher global commodity prices, contributions to qoq growth were driven by strong commodity exports; namely coal, processes commodities and other, which include other mining products. In contrast, exports of manufactured goods were relatively weak during the quarter.
Figure A.15: On a seasonally adjusted qoq basis, growth of goods exports values strengthened in Q1 in line with higher commodity prices (contributions sa qoq growth, percent)
Source: CIEC, World Bank staff calculation
The softer growth in goods imports was concentrated among consumption goods and fuels
Growth of goods imports yoy eased slightly in part due to slower growth of fuels and consumption goods (Figure A.14). The decline in fuels imports, while peculiar especially in light of high oil prices, was partly due to the decline in the exports of oil and oil products22. The growth in imports of consumption goods slowed considerably compared to Q4 2017, with imports of rice, weapons, and ammunition as well as cosmetics being the most prominent. Import of capital goods, in contrast, remained robust, surging to 26.8 percent in Q1 2018 from 19.8 percent in Q4 2017, driven by imports for data processing machines and parts for mobile phone devices. The continued strong import of capital goods is in line with the robust investment growth discussed in Section A.1.
The financial account surplus shrank in Q1
Amid continued U.S. monetary tightening and financial volatility among some emerging economies, the capital and financial account surplus fell to 0.7 percent of GDP (USD 1.9 billion) from 2.7 percent in Q4 2017. Direct investments eased and portfolio investments recorded net foreign outflows of USD 1.2 billion—equal to nearly 60 percent of net inflows in Q4 2017. The net portfolio investment outflows in Q1 were driven by significantly lower (lowest since Q4 2016) net foreign inflows on Rupiah denominated bonds, foreign
Figure A.16: Foreign direct investment dipped lower in Q1 (USD billion)
Source: CEIC; World Bank; World Bank staff calculations Note: Data for export of palm oil and rubber aren’t available post 2017. Base metals are not included due to the volatile nature of the export caused by changes in sector’s regulations
22 It is common in production processes for inputs to be in the same good categories as the outputs. For this reason, countries tend to import goods of similar categories to those that are exported, where the imports are used as inputs to produce the exported goods.
-10
-5
0
5
10
15
Jun-16 Sep-16 Dec-16 Mar-17 Jun-17 Sep-17 Dec-17 Mar-18
Others (including other mining)Other ManufacturingElectric, automotive & parts, computersTextile, clothing & footwearProcessed commoditiesOther miningCoalOil, Oil products and gas
Total Exports
-12-10-8-6-4-202468
10
OtherFinancial IntermediationWholesale & retail trade, Vehicle repair, household goodsManufacturingMining and QuarryingAgriculture, Hunting, and Forestry
Total

L e a r n i n g m o r e , g r o w i n g f a s t e r I n d o n e s i a E c o n o m i c Q u a r t e r l y
J u n e 2 0 1 8 T H E W O R L D B A N K | B A N K D U N I A
13
investors selling their ownership of Indonesian equities, and the continued purchase of overseas assets by Indonesian residents that has been building up since last year. Net foreign direct investment (FDI) was slightly lower than that recorded in Q4 2017. Manufacturing, wholesale and retail, agriculture, fisheries and forestry as well as the financial intermediation sectors were the main recipients of the direct investment in Q1 (Figure A.16). In terms of net capital flows, Q1 saw the smallest net inflows – USD 1.8 billion in at least the past 4 years. This was the second consecutive quarter where net inflows eased from the previous quarter and reflects investor sentiment as the U.S. Federal Reserve continues to normalize monetary policy.
As portfolio outflows dominated Q1, the BOP saw its first deficit since Q1 2016
With a slightly narrower current account deficit more than offset by a considerably smaller capital and financial account surplus, Indonesia’s balance of payments recorded a deficit 1.5 percent of GDP in Q1 2018, compared to a surplus of 0.4 percent of GDP in Q4 2017. This was the first BOP deficit after seven straight quarters of surpluses. International reserves fell to USD 126.0 billion at the end of Q1, lower than the reserves seen in Q3 and Q4 2017, but still near record levels, and has significantly enhanced BI’s ability to support the Rupiah should the need arises. The reserves are sufficient to finance government external debt repayments and imports for 7.7 months.
4. Headline inflation continues to ease
Inflationary pressures eased further in Q1 largely on the back of lower prices of housing and utilities
Headline inflation eased to an average of 3.3 percent yoy in Q1 2018, the lowest since Q4 2016, from an average of 3.5 percent in Q4 2017 (Figure A.17). The lower headline reading was largely due to considerably smaller increases in housing, electricity, gas, and fuel prices to 3.8 percent in Q1, from 5.2 percent in Q4, which was due to base effects, resulting from the electricity tariff hikes in H1 2017. Inflation for transportation, communication, and finance also eased significantly to 1.6 percent in Q1 from 4.5 percent in Q4 20172324. Further easing of headline inflation in Q1 was partially offset by higher rice prices, due to supply-related shortages25 and some consternation as to whether imported amounts would be sufficient and timely enough to prevent higher prices. Further upward pressure on food prices, nevertheless, have later eased due to the arrival of the imported rice and a harvest season that started in March and April.
Figure A.17: Headline inflation eased in Q1 (change yoy, percent)
Source: BPS; World Bank staff calculations Note: Food prices are a weighted average of the raw and processed food price components of CPI
23 Sustained higher oil prices will exert upward pressure overall headline inflation, although recent announcements by the government to keep fuel prices unchanged will partially mitigate such effects. 24 The lower inflation for transport and communication was partly due to base effects: higher administrative fees for registering vehicles levied since January 2017 resulted in higher transportation costs. There is no administrative price adjustment anticipated in 2018. 25 The harvest season came a month later than usual in Q1 due to pest and flood problems in some of the major rice-producing provinces.
-2
0
2
4
6
8
10
12 Headline FoodCore Administered prices
L e a r n i n g m o r e , g r o w i n g f a s t e r I n d o n e s i a E c o n o m i c Q u a r t e r l y
J u n e 2 0 1 8 T H E W O R L D B A N K | B A N K D U N I A
14
On a monthly basis, headline inflation was unchanged in April at 3.4 percent yoy from March, still well within the target range of BI of 2.5 percent to 4.5 percent. Inflation was stable despite the upward adjustments of gasoline prices by Pertamina at the end of February (for RON 92 and RON 95) and at the end of March (for RON 90)2627.
Core inflation also eased
In terms of the major components of headline inflation, core inflation, which excludes volatile and administrative prices, eased further to 2.7 percent yoy in Q1 from Q4’s average of 3.0 percent. The figure represents the lowest quarterly average on record, as the economy continues to operate slightly below potential. On a monthly basis, core inflation has notched upward from 2.6 percent in February to 2.7 percent in March and April. Largely due to elevated food price inflation, volatile goods inflation averaged 3.3 percent in Q1 2017, a sizable increase from the record low of 0.9 percent in Q4 2017. On the other hand, after rising an average of 8.7 percent in Q4, administered price inflation fell to a quarterly average of 5.4 percent in Q1 2017, the lowest figure in a year, due to base effects of the administrative electricity price hikes in the first half of 2017.
5. Bond yields rose in the first 5 months of 2018 as the United States continued to normalize monetary policy
Global financial market volatility surged in February on strong U.S. labor market news
Financial market volatility has jumped since February as the U.S. labor market added 200,000 jobs and wages rose at their fastest pace in more than 8 years (Figure A.18)28. This stronger than expected labor market news stroked investor fears of higher inflation, and consequently a faster-than-expected pace of normalization of U.S. monetary policy. The increased volatility, along with the higher expected U.S. bond yields and stronger U.S. dollar associated with that normalization, have led investors to exit emerging markets in favor of traditional safe-haven assets. More recently, financial distress among other more vulnerable emerging economies such as Argentina and Turkey, also weighed on investor sentiment for emerging economy assets.
Figure A.18: Financial market volatility spiked since February (percent)
Figure A.19: 10-year bond yields across the region ticked up amid increased financial market volatility (percent)
Source: Bloomberg Notes: The VIX index measures volatility in the U.S. equity market, while the MOVE index measures volatility in the U.S. bond market
Source: www.investing.com; World Bank staff calculations
26 Effects of upward fuel prices adjustment on inflation are usually felt within 7–21 days. See: Liputan 6 (April 2, 2018). 27 The government announced that all gasoline distributors in the country, including state-owned energy giant Pertamina, Netherlands-based Royal Dutch Shell, and France’s Total SA, will need approval from the Energy and Mineral Resources Ministry before increasing the prices of gasoline. See Bloomberg (April 09, 2018). 28 Barrons (February 2, 2018).
40
45
50
55
60
65
70
75
80
0
5
10
15
20
25
30
35
40 VIX Index MOVE Index (RHS)
2
3
4
5
6
7
8
1-Jan-18 1-Feb-18 1-Mar-18 1-Apr-18 1-May-18
India Malaysia Indonesia
Vietnam Thailand USA

L e a r n i n g m o r e , g r o w i n g f a s t e r I n d o n e s i a E c o n o m i c Q u a r t e r l y
J u n e 2 0 1 8 T H E W O R L D B A N K | B A N K D U N I A
15
In contrast to much of 2017, bond yields have thus far trended upwards in 2018
Indonesian bond yields, on average and across all tenors, rose 21 basis points in Q1, in contrast with the average decline of 16 basis points in Q4 2017 (Figure A.19). Yields on Indonesian 10-year bonds ended Q1 at 6.9 percent, only slightly higher than the 6.6 percent at the end of Q4 2017. The increase in yields was broadly in line with regional peers, and in part reflects the effects of more rapid-than-expected U.S. monetary policy normalization and the associated upward trend in U.S. 10-year yields. Indonesian bonds continue to offer attractive returns for investors compared to regional economies. Yields have thus far continued to rise in Q2, with 10-year yields reaching a peak of 7.6 percent on May 24, before easing significantly with the higher policy rate and other early signs indicating that investors are returning to take advantage of Indonesian assets at a discount29. As another testament to its improved credit worthiness, Indonesia’s sovereign debt saw yet another credit rating upgrade on April 12, 2018. Moody’s upgraded Indonesian debt to Baa2 with a stable outlook. This was Indonesia’s fourth rating upgrade by a major credit rating agency over the past 12 months30, and puts Indonesia in the same category as Fitch’s assessment and at the same level as regional competitors such as India and Philippines. The rating upgrade did not have a major impact with yields on 10-year bonds dipping a little (by 3 basis points) and the Rupiah appreciating 0.1 percent at the beginning of the next trading day31.
The Rupiah depreciated in Q1 in nominal and real terms, in line with other EM currencies
As the normalization of U.S. monetary policy is projected to accelerate, global financial conditions have tightened faster than expected, resulting in bouts of volatility among emerging economies in recent months, as investors sought safe-haven assets. In addition, Indonesia has a relatively high exposure to foreign investors with 40 percent of Indonesian domestic debt being held by foreigners32. The combination of the relatively high exposure to foreign investors and financial market volatility has led to portfolio investments outflows and a depreciating Rupiah. Expectations of a larger current deficit linked to faster investment growth also pressured the currency33. In Q1 using end-of-period values, the currency depreciated 1.4 percent against the greenback, significantly larger than the 0.4 percent depreciation in Q4 2017. Thus far in Q2, the Rupiah has depreciated 1.6 percent, bringing the year-to-date depreciation to around 3.1 percent. In mid-May, the Rupiah breached the 14,000 threshold for the first time since Q4 201534, but has since eased, in line with the two 25 bps policy rate hikes in May and early signs of returning of investor confidence.
Also associated with the increase in the U.S. Federal Funds policy rate, other emerging market
currencies have also been depreciating, some of them more rapidly than Indonesia’s. JP Morgan’s Emerging Market Currency Index (EMCI) gained 0.7 percent in Q1 but plunged 6.1 percent in Q2, resulting in a YTD depreciation of 5.4 percent. Because the EMCI has been depreciating more rapidly than the Rupiah, recent months have seen the recoupling of the Rupiah with other emerging market currencies (Figure A.20). The Rupiah has also been depreciating in real effective terms in 2018 (Figure A.21). In Q1, the currency depreciated 4.0 percent, but was still 5.2 percent higher than at the beginning of 2014,
29 Bloomberg (April 17, 2018) and Bloomberg (April 25, 2018). 30 The first upgrade was by S&P’s in May 2017 and the second was by Fitch’s in December 2017. Subsequently, the Japanese-based Rating and Investment Information, Inc. (R&I) upgraded Indonesia's sovereign credit rating in March 2018. 31 Bloomberg (April 13, 2018). 32 The Wall Street Journal (May 7, 2018). 33 In strong contrast to the Asian Financial Crisis of 1997-1998 when Indonesia had a fixed exchange rate, the Rupiah has been acting an automatic stabilizer, with changes in its value have a tendency to mitigate imbalances in the current account and balance of payments. 34 Reuters (May 8, 2018).
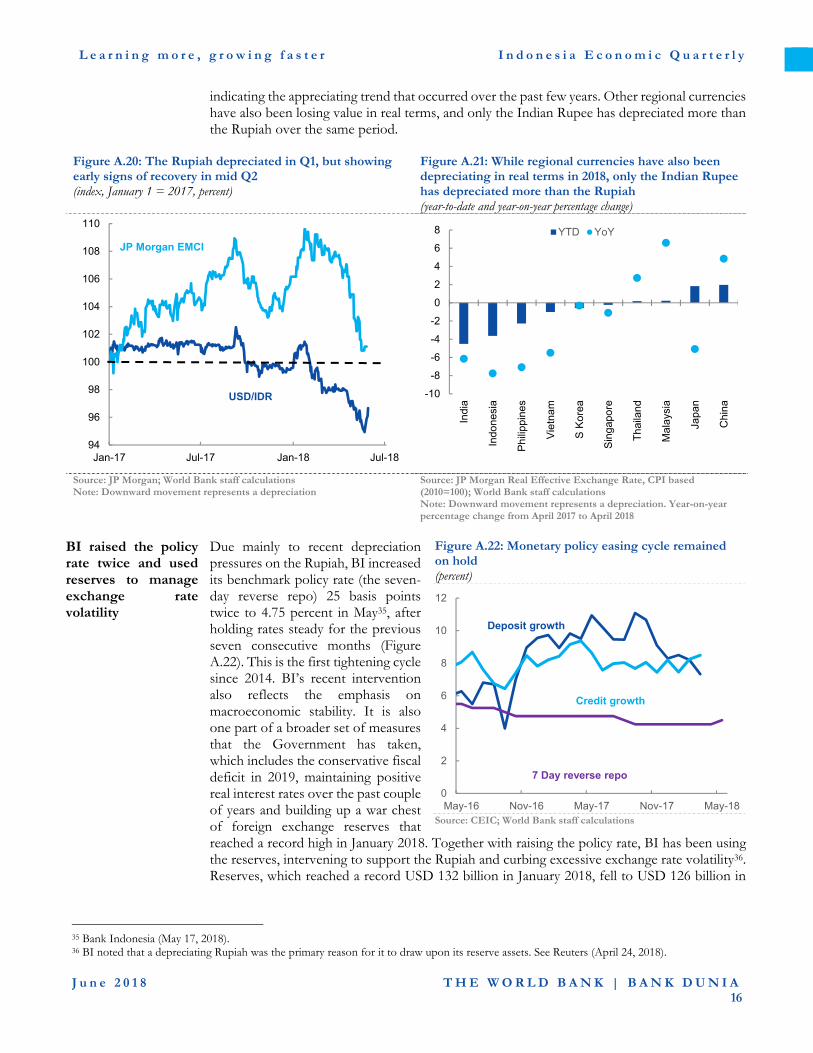
L e a r n i n g m o r e , g r o w i n g f a s t e r I n d o n e s i a E c o n o m i c Q u a r t e r l y
J u n e 2 0 1 8 T H E W O R L D B A N K | B A N K D U N I A
16
indicating the appreciating trend that occurred over the past few years. Other regional currencies have also been losing value in real terms, and only the Indian Rupee has depreciated more than the Rupiah over the same period.
Figure A.20: The Rupiah depreciated in Q1, but showing early signs of recovery in mid Q2 (index, January 1 = 2017, percent)
Figure A.21: While regional currencies have also been depreciating in real terms in 2018, only the Indian Rupee has depreciated more than the Rupiah (year-to-date and year-on-year percentage change)
Source: JP Morgan; World Bank staff calculations Note: Downward movement represents a depreciation
Source: JP Morgan Real Effective Exchange Rate, CPI based (2010=100); World Bank staff calculations Note: Downward movement represents a depreciation. Year-on-year percentage change from April 2017 to April 2018
BI raised the policy rate twice and used reserves to manage exchange rate volatility
Due mainly to recent depreciation pressures on the Rupiah, BI increased its benchmark policy rate (the seven-day reverse repo) 25 basis points twice to 4.75 percent in May35, after holding rates steady for the previous seven consecutive months (Figure A.22). This is the first tightening cycle since 2014. BI’s recent intervention also reflects the emphasis on macroeconomic stability. It is also one part of a broader set of measures that the Government has taken, which includes the conservative fiscal deficit in 2019, maintaining positive real interest rates over the past couple of years and building up a war chest of foreign exchange reserves that reached a record high in January 2018. Together with raising the policy rate, BI has been using the reserves, intervening to support the Rupiah and curbing excessive exchange rate volatility36. Reserves, which reached a record USD 132 billion in January 2018, fell to USD 126 billion in
Figure A.22: Monetary policy easing cycle remained on hold (percent)
Source: CEIC; World Bank staff calculations
35 Bank Indonesia (May 17, 2018). 36 BI noted that a depreciating Rupiah was the primary reason for it to draw upon its reserve assets. See Reuters (April 24, 2018).
94
96
98
100
102
104
106
108
110
Jan-17 Jul-17 Jan-18 Jul-18
USD/IDR
JP Morgan EMCI
-10
-8
-6
-4
-2
0
2
4
6
8
Indi
a
Indo
nesi
a
Phi
lippi
nes
Vie
tnam
S K
orea
Sin
gapo
re
Th
aila
nd
Ma
lays
ia
Japa
n
Chi
na
YTD YoY
0
2
4
6
8
10
12
May-16 Nov-16 May-17 Nov-17 May-18
Deposit growth
Credit growth
7 Day reverse repo

L e a r n i n g m o r e , g r o w i n g f a s t e r I n d o n e s i a E c o n o m i c Q u a r t e r l y
J u n e 2 0 1 8 T H E W O R L D B A N K | B A N K D U N I A
17
March, the largest decline since Q3 2015, and February saw the single largest monthly dip in reserves since mid-2016. Considering the continued U.S. monetary policy normalization, there would be increasingly less room for Indonesia to hold policy rates steady going forth, as the increasingly larger return differential would raise the tendency for more capital outflows and lead to further depreciation pressures on the Rupiah. While much of the focus of monetary policy appears to have been centered on stabilizing the Rupiah, some of other objectives remain unmet, with credit growth and deposit growth continuing to muddle along at a disappointingly flat trajectory. Credit growth has now been hovering between the 7.5 to 8.5 percent range since September 2017. In terms of quarterly averages, Q1 2018 saw an average yoy credit growth of 8.1 percent—the highest average quarterly growth since Q2 2017, but still significantly below BI’s target of 10 to 12 percent for 2018. Sluggish credit growth is a concern as it could indicate that firms are unable to obtain sufficient financing, which could stifle further growth in private investment. Meanwhile, deposit growth has made only marginal movements within the 8.0 and 8.5 percent range since the end of 2017.
The banking sector remains healthy, despite a small uptick in NPLs in January
After falling to a two-year low in Q4 2017, non-performing loans (NPLs) averaged around the 2.8 percent mark in Q1 (Figure A.23) due to an increase in NPLs in industrial processing, and wholesale and retail trade. Pointing to a well-capitalized banking system, the capital adequacy ratio remained around the 23 percent mark, as has been the case for the past few years. In another positive sign for the banking system, the Financial Services Authority (OJK) recently conducted a financial stress test and announced that the Indonesian financial system was well placed to withstand substantial pressure as measured by a depreciation of the Rupiah up to a level of 20,000, a worsening NPL ratio, and higher interest rates37.
Figure A.23: Banking sector remains healthy (percent)
Source: CEIC; World Bank staff calculations
6. Notable improvement in revenue collection and continued expenditure growth
Higher revenue and expenditure growth, and a lower deficit than last year
Indonesia’s revenues and expenditures recorded higher growth in the first four months of 2018. The high growth of total revenue was mainly driven by collections from non-oil and gas (O&G) income taxes and value-added-taxes (VAT). Meanwhile, total Government expenditure rebounded compared to the same period last year, mainly due to increases in social spending and fuel subsidies, though capital spending contracted. With more than half of the capital budget procured but not yet spent on infrastructure projects, the fall in capital spending is expected to
37 Reuters (April 30, 2018).
2.0
2.5
3.0
3.5
4.0
19
20
21
22
23
24
Mar-16 Sep-16 Mar-17 Sep-17 Mar-18
Capital adequacy ratio
Non-performing loans(RHS)

L e a r n i n g m o r e , g r o w i n g f a s t e r I n d o n e s i a E c o n o m i c Q u a r t e r l y
J u n e 2 0 1 8 T H E W O R L D B A N K | B A N K D U N I A
18
be temporary38. Overall, a fiscal deficit of 2.1 percent of GDP is projected for 2018, 0.4 percentage point lower than the realized 2017 deficit of 2.5 percent of GDP.39
Total revenues grew at the fastest pace in the last ten years
Total revenues40 grew strongly by 22.4 percent from January–April 2018, compared to the same period in 2017, excluding revenues from the Tax Amnesty Program (TA)41. The 2018 revenue growth rate was double that of 201742 (Figure A.24). Total taxes grew by 22.3 percent yoy and contributed 17.6 percentage points to total revenue growth. Strong performance of tax collections was driven mainly by non-O&G income tax revenue43 and VAT44. In addition, collections from excises over January through April 2018 rebounded after falling over the same period in each of the last three years. This follows the increase of the tobacco excise tariff by 10.0 percent yoy on average45 starting in January 2018.
Figure A.24: Total revenues excluding revenues from TA grew at the fastest pace in ten years, driven by non-O&G income tax and VAT (contribution to growth, January–April yoy, percentage point)
Source: Ministry of Finance; World Bank staff calculations Note: O&G stands for oil and gas, N-O&G stands for non-oil and gas; LGST stands for luxury goods sales tax; “Other” includes: property taxes, other tax revenues; non-oil and gas non-tax revenues; other non-tax revenues (profits of public enterprises, revenues from Public Service Agency [BLU], and other non-tax revenues [PNBP]). 2017-TA means that total revenues exclude redemption fees collected under TAP. 2018* is a yoy comparison against 2017-TA
Total Government spending rebounded, led by increases in fuel and gas subsidies, and social spending
In nominal terms, total Government spending grew at 8.3 percent yoy from January–April 2018, much higher than the contraction of 1.2 percent seen in the same period last year (Figure A.25). Expenditure growth mainly came from the increase of social aid spending and of fuel and gas subsidies, excluding arrears payments, which rose by more than double and by more than three times, respectively. The high growth of social aid spending reflects continued efforts to expand the number of beneficiaries of the Family Hope Program (PKH) from 6 to 10 million and advance payments of the subsidized health premium (PBI-JKN). The high growth of fuel and gas subsidies is partly due to the current policy of maintaining the subsidized oil price. This policy is also driving the sharp growth of the ‘others’ category of spending, where payment of
38 According to the Ministry of Finance, as of April 2018, line ministries have procured approximately IDR 116.8 trillion, equivalent to 57 percent of Government’s capital budget for 2018. Only part of this has been disbursed to-date. (APBN Kita, May Edition). 39 The 2017 figures in this report refer to preliminary realization figures from the Ministry of Finance, received February 9, 2018, unless otherwise stated. 40 The Government has collected IDR 528 trillion, which has been the highest nominal level for the last two years (even after including revenue from TA). 41 The TA ran for 9 months, beginning with Q3 2016 and ending in Q1 2017. Thus, part of 2017 revenues came from redemption fees under the TA, which are excluded from analysis of quarterly trends because TA is treated as a one-off event. 42 While total revenue growth in 2017 was partly due to low base effect in 2016, the same cannot be said for growth in 2018. 43 Non-O&G income tax revenue increased largely due to higher corporate taxes, which in turn rose partly due to higher commodity prices. Corporate income taxes (from income tax articles 25/29) grew by 24 percent compared to 2017 (APBN Kita, May 2018). 44 In particular, higher import VAT, which is positively correlated with higher oil prices. See Box 2, World Bank (2017). 45 Indonesia’s tobacco excise is multi-tiered; the weighted average rate increase is provided by the Ministry of Finance, see CNN (October 27, 2017). Taxes on cigarettes dominated the growth of excise revenue due to the increase of tariff and production as reported in APBN Kita May 2018.
5.2
14.8
3.8
-9.8
11.6
22.4
-15
-5
5
15
25
2013 2014 2015 2016 2017-TA 2018*
Other International trade taxes
Excises VAT/LGST
Income taxes N-O&G O&G related revenues
Total revenues
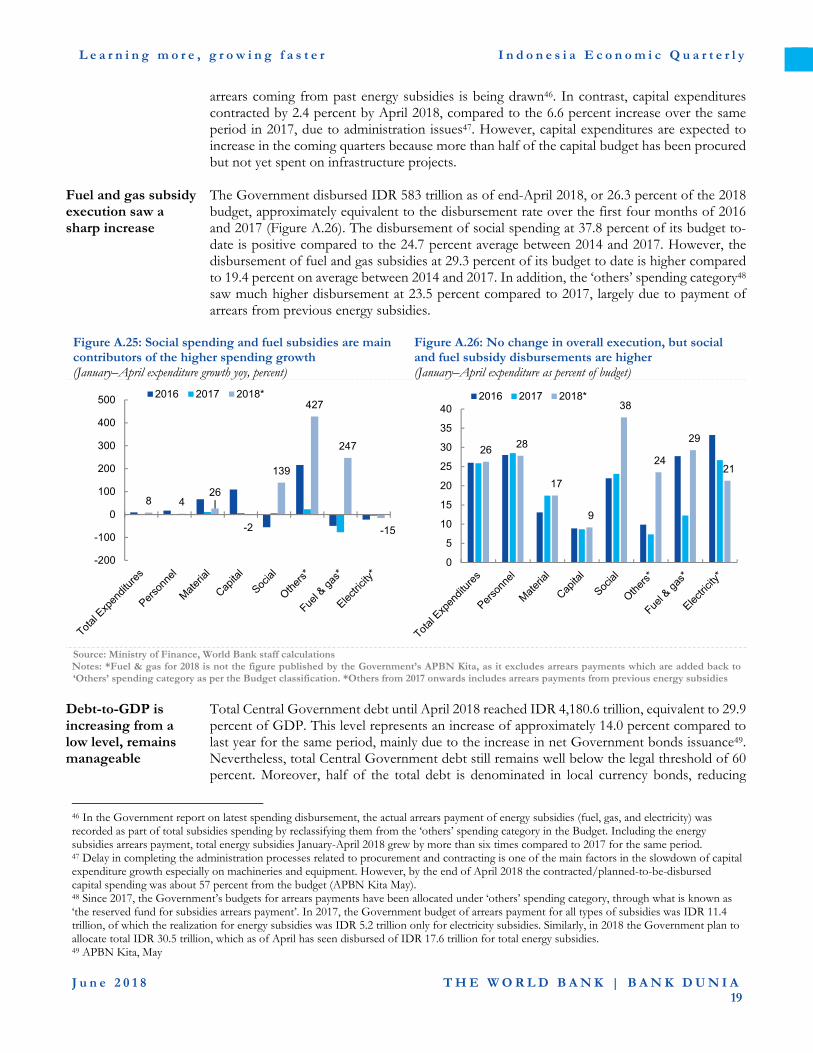
L e a r n i n g m o r e , g r o w i n g f a s t e r I n d o n e s i a E c o n o m i c Q u a r t e r l y
J u n e 2 0 1 8 T H E W O R L D B A N K | B A N K D U N I A
19
arrears coming from past energy subsidies is being drawn46. In contrast, capital expenditures contracted by 2.4 percent by April 2018, compared to the 6.6 percent increase over the same period in 2017, due to administration issues47. However, capital expenditures are expected to increase in the coming quarters because more than half of the capital budget has been procured but not yet spent on infrastructure projects.
Fuel and gas subsidy execution saw a sharp increase
The Government disbursed IDR 583 trillion as of end-April 2018, or 26.3 percent of the 2018 budget, approximately equivalent to the disbursement rate over the first four months of 2016 and 2017 (Figure A.26). The disbursement of social spending at 37.8 percent of its budget to-date is positive compared to the 24.7 percent average between 2014 and 2017. However, the disbursement of fuel and gas subsidies at 29.3 percent of its budget to date is higher compared to 19.4 percent on average between 2014 and 2017. In addition, the ‘others’ spending category48 saw much higher disbursement at 23.5 percent compared to 2017, largely due to payment of arrears from previous energy subsidies.
Figure A.25: Social spending and fuel subsidies are main contributors of the higher spending growth (January–April expenditure growth yoy, percent)
Figure A.26: No change in overall execution, but social and fuel subsidy disbursements are higher (January–April expenditure as percent of budget)
Source: Ministry of Finance, World Bank staff calculations Notes: *Fuel & gas for 2018 is not the figure published by the Government’s APBN Kita, as it excludes arrears payments which are added back to ‘Others’ spending category as per the Budget classification. *Others from 2017 onwards includes arrears payments from previous energy subsidies
Debt-to-GDP is increasing from a low level, remains manageable
Total Central Government debt until April 2018 reached IDR 4,180.6 trillion, equivalent to 29.9 percent of GDP. This level represents an increase of approximately 14.0 percent compared to last year for the same period, mainly due to the increase in net Government bonds issuance49. Nevertheless, total Central Government debt still remains well below the legal threshold of 60 percent. Moreover, half of the total debt is denominated in local currency bonds, reducing
46 In the Government report on latest spending disbursement, the actual arrears payment of energy subsidies (fuel, gas, and electricity) was recorded as part of total subsidies spending by reclassifying them from the ‘others’ spending category in the Budget. Including the energy subsidies arrears payment, total energy subsidies January-April 2018 grew by more than six times compared to 2017 for the same period. 47 Delay in completing the administration processes related to procurement and contracting is one of the main factors in the slowdown of capital expenditure growth especially on machineries and equipment. However, by the end of April 2018 the contracted/planned-to-be-disbursed capital spending was about 57 percent from the budget (APBN Kita May). 48 Since 2017, the Government’s budgets for arrears payments have been allocated under ‘others’ spending category, through what is known as ‘the reserved fund for subsidies arrears payment’. In 2017, the Government budget of arrears payment for all types of subsidies was IDR 11.4 trillion, of which the realization for energy subsidies was IDR 5.2 trillion only for electricity subsidies. Similarly, in 2018 the Government plan to allocate total IDR 30.5 trillion, which as of April has seen disbursed of IDR 17.6 trillion for total energy subsidies. 49 APBN Kita, May
8 426
-2
139
427
247
-15
-200
-100
0
100
200
300
400
500 2016 2017 2018*
26 28
17
9
38
24
29
21
0
5
10
15
20
25
30
35
402016 2017 2018*
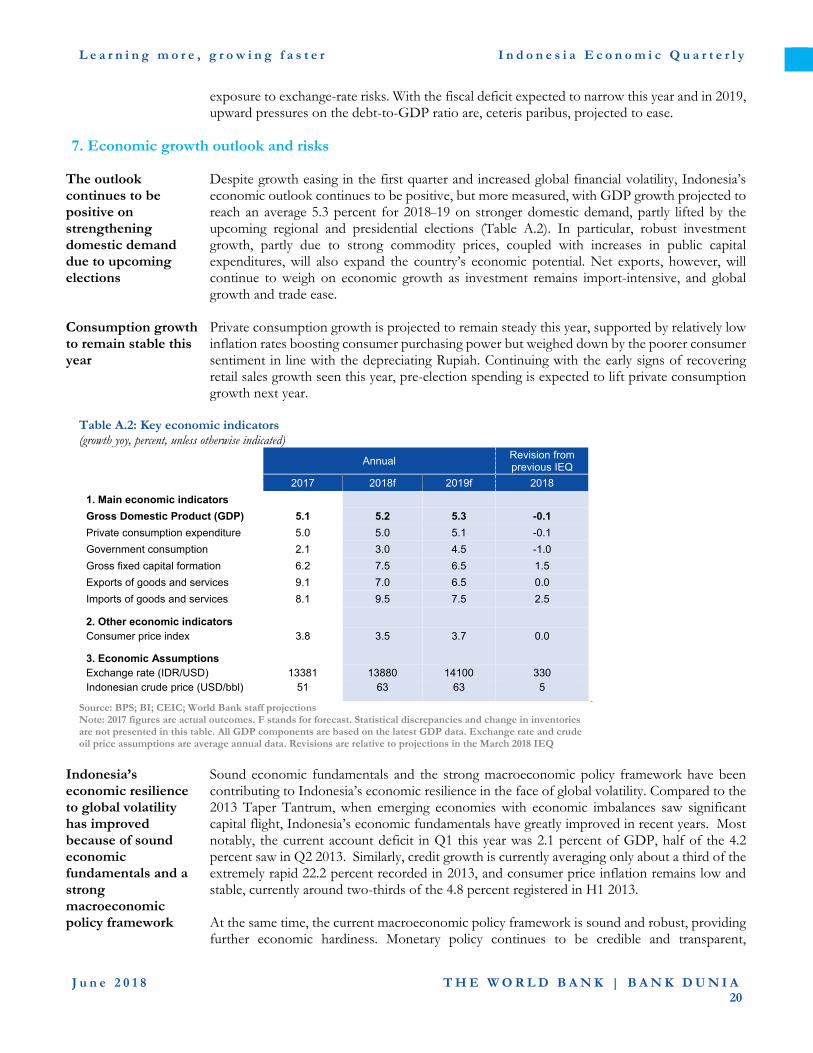
L e a r n i n g m o r e , g r o w i n g f a s t e r I n d o n e s i a E c o n o m i c Q u a r t e r l y
J u n e 2 0 1 8 T H E W O R L D B A N K | B A N K D U N I A
20
exposure to exchange-rate risks. With the fiscal deficit expected to narrow this year and in 2019, upward pressures on the debt-to-GDP ratio are, ceteris paribus, projected to ease.
7. Economic growth outlook and risks
The outlook continues to be positive on strengthening domestic demand due to upcoming elections
Despite growth easing in the first quarter and increased global financial volatility, Indonesia’s economic outlook continues to be positive, but more measured, with GDP growth projected to reach an average 5.3 percent for 2018–19 on stronger domestic demand, partly lifted by the upcoming regional and presidential elections (Table A.2). In particular, robust investment growth, partly due to strong commodity prices, coupled with increases in public capital expenditures, will also expand the country’s economic potential. Net exports, however, will continue to weigh on economic growth as investment remains import-intensive, and global growth and trade ease.
Consumption growth to remain stable this year
Private consumption growth is projected to remain steady this year, supported by relatively low inflation rates boosting consumer purchasing power but weighed down by the poorer consumer sentiment in line with the depreciating Rupiah. Continuing with the early signs of recovering retail sales growth seen this year, pre-election spending is expected to lift private consumption growth next year.
Table A.2: Key economic indicators (growth yoy, percent, unless otherwise indicated)
Annual Revision from previous IEQ
2017 2018f 2019f 2018
1. Main economic indicators
Gross Domestic Product (GDP) 5.1 5.2 5.3 -0.1
Private consumption expenditure 5.0 5.0 5.1 -0.1
Government consumption 2.1 3.0 4.5 -1.0
Gross fixed capital formation 6.2 7.5 6.5 1.5
Exports of goods and services 9.1 7.0 6.5 0.0
Imports of goods and services 8.1 9.5 7.5 2.5
2. Other economic indicators
Consumer price index 3.8 3.5 3.7 0.0
3. Economic Assumptions
Exchange rate (IDR/USD) 13381 13880 14100 330 Indonesian crude price (USD/bbl) 51 63 63 5
Source: BPS; BI; CEIC; World Bank staff projections Note: 2017 figures are actual outcomes. F stands for forecast. Statistical discrepancies and change in inventories are not presented in this table. All GDP components are based on the latest GDP data. Exchange rate and crude oil price assumptions are average annual data. Revisions are relative to projections in the March 2018 IEQ
Indonesia’s economic resilience to global volatility has improved because of sound economic fundamentals and a strong macroeconomic policy framework
Sound economic fundamentals and the strong macroeconomic policy framework have been contributing to Indonesia’s economic resilience in the face of global volatility. Compared to the 2013 Taper Tantrum, when emerging economies with economic imbalances saw significant capital flight, Indonesia’s economic fundamentals have greatly improved in recent years. Most notably, the current account deficit in Q1 this year was 2.1 percent of GDP, half of the 4.2 percent saw in Q2 2013. Similarly, credit growth is currently averaging only about a third of the extremely rapid 22.2 percent recorded in 2013, and consumer price inflation remains low and stable, currently around two-thirds of the 4.8 percent registered in H1 2013. At the same time, the current macroeconomic policy framework is sound and robust, providing further economic hardiness. Monetary policy continues to be credible and transparent,
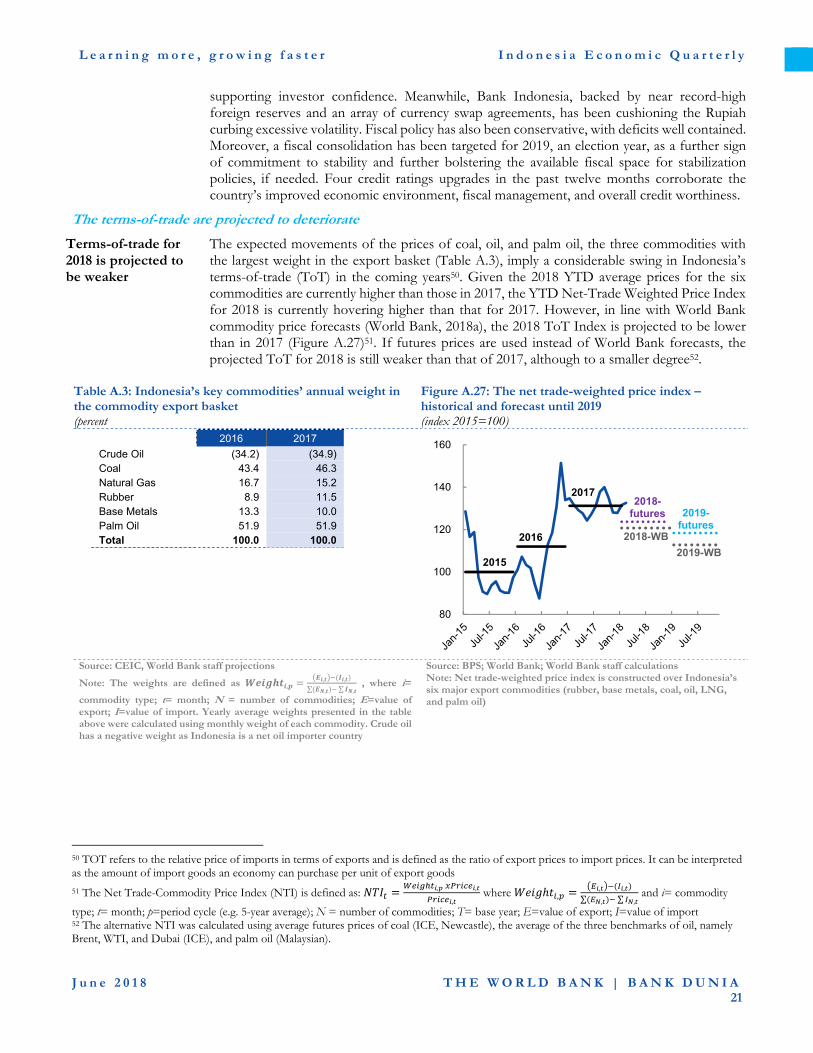
L e a r n i n g m o r e , g r o w i n g f a s t e r I n d o n e s i a E c o n o m i c Q u a r t e r l y
J u n e 2 0 1 8 T H E W O R L D B A N K | B A N K D U N I A
21
supporting investor confidence. Meanwhile, Bank Indonesia, backed by near record-high foreign reserves and an array of currency swap agreements, has been cushioning the Rupiah curbing excessive volatility. Fiscal policy has also been conservative, with deficits well contained. Moreover, a fiscal consolidation has been targeted for 2019, an election year, as a further sign of commitment to stability and further bolstering the available fiscal space for stabilization policies, if needed. Four credit ratings upgrades in the past twelve months corroborate the country’s improved economic environment, fiscal management, and overall credit worthiness.
The terms-of-trade are projected to deteriorate
Terms-of-trade for 2018 is projected to be weaker
The expected movements of the prices of coal, oil, and palm oil, the three commodities with the largest weight in the export basket (Table A.3), imply a considerable swing in Indonesia’s terms-of-trade (ToT) in the coming years50. Given the 2018 YTD average prices for the six commodities are currently higher than those in 2017, the YTD Net-Trade Weighted Price Index for 2018 is currently hovering higher than that for 2017. However, in line with World Bank commodity price forecasts (World Bank, 2018a), the 2018 ToT Index is projected to be lower than in 2017 (Figure A.27)51. If futures prices are used instead of World Bank forecasts, the projected ToT for 2018 is still weaker than that of 2017, although to a smaller degree52.
Table A.3: Indonesia’s key commodities’ annual weight in the commodity export basket (percent
Figure A.27: The net trade-weighted price index – historical and forecast until 2019 (index 2015=100)
2016 2017
Crude Oil (34.2) (34.9) Coal 43.4 46.3 Natural Gas 16.7 15.2 Rubber 8.9 11.5 Base Metals 13.3 10.0 Palm Oil 51.9 51.9 Total 100.0 100.0
Source: CEIC, World Bank staff projections
Note: The weights are defined as ,, ,
∑ , ∑ , , where i=
commodity type; t= month; N = number of commodities; E=value of export; I=value of import. Yearly average weights presented in the table above were calculated using monthly weight of each commodity. Crude oil has a negative weight as Indonesia is a net oil importer country
Source: BPS; World Bank; World Bank staff calculations Note: Net trade-weighted price index is constructed over Indonesia’s six major export commodities (rubber, base metals, coal, oil, LNG, and palm oil)
50 TOT refers to the relative price of imports in terms of exports and is defined as the ratio of export prices to import prices. It can be interpreted as the amount of import goods an economy can purchase per unit of export goods
51 The Net Trade-Commodity Price Index (NTI) is defined as: , ,
, where ,
, ,
∑ , ∑ , and i= commodity
type; t= month; p=period cycle (e.g. 5-year average); N = number of commodities; T= base year; E=value of export; I=value of import 52 The alternative NTI was calculated using average futures prices of coal (ICE, Newcastle), the average of the three benchmarks of oil, namely Brent, WTI, and Dubai (ICE), and palm oil (Malaysian).
80
100
120
140
160
2015
2016
2017
2018-WB
2019-WB
2018-futures 2019-
futures
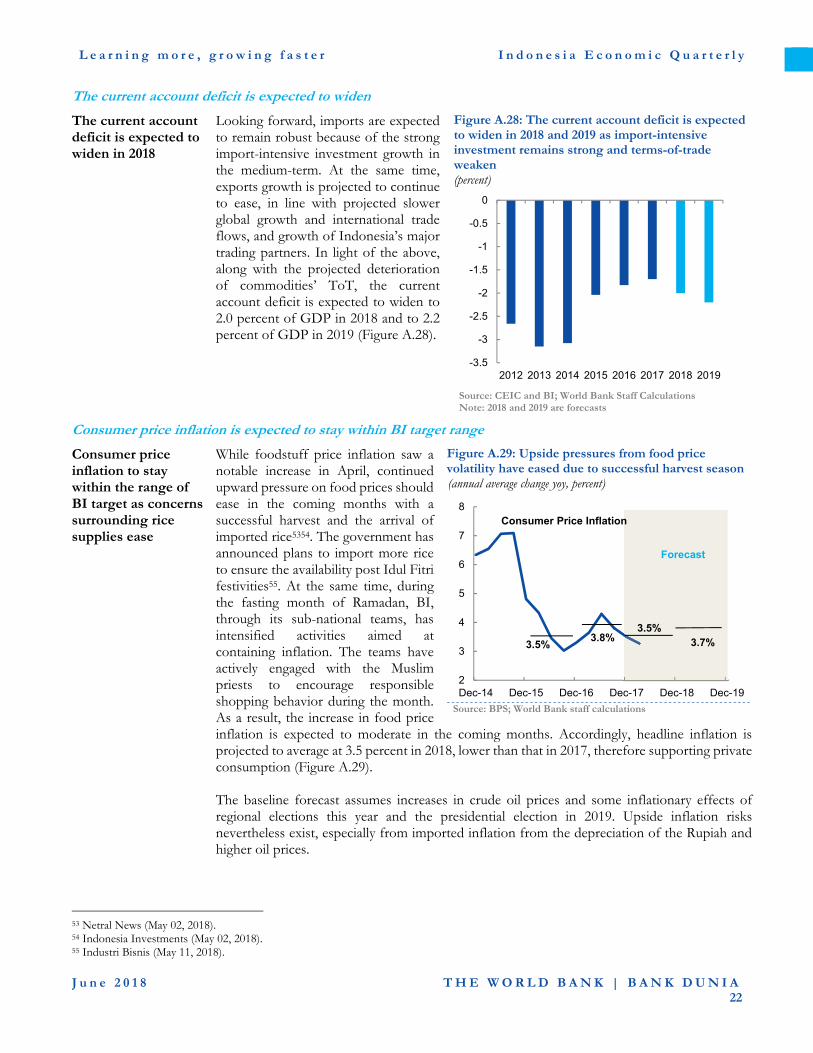
L e a r n i n g m o r e , g r o w i n g f a s t e r I n d o n e s i a E c o n o m i c Q u a r t e r l y
J u n e 2 0 1 8 T H E W O R L D B A N K | B A N K D U N I A
22
The current account deficit is expected to widen
The current account deficit is expected to widen in 2018
Looking forward, imports are expected to remain robust because of the strong import-intensive investment growth in the medium-term. At the same time, exports growth is projected to continue to ease, in line with projected slower global growth and international trade flows, and growth of Indonesia’s major trading partners. In light of the above, along with the projected deterioration of commodities’ ToT, the current account deficit is expected to widen to 2.0 percent of GDP in 2018 and to 2.2 percent of GDP in 2019 (Figure A.28).
Figure A.28: The current account deficit is expected to widen in 2018 and 2019 as import-intensive investment remains strong and terms-of-trade weaken (percent)
Source: CEIC and BI; World Bank Staff Calculations Note: 2018 and 2019 are forecasts
Consumer price inflation is expected to stay within BI target range
Consumer price inflation to stay within the range of BI target as concerns surrounding rice supplies ease
While foodstuff price inflation saw a notable increase in April, continued upward pressure on food prices should ease in the coming months with a successful harvest and the arrival of imported rice5354. The government has announced plans to import more rice to ensure the availability post Idul Fitri festivities55. At the same time, during the fasting month of Ramadan, BI, through its sub-national teams, has intensified activities aimed at containing inflation. The teams have actively engaged with the Muslim priests to encourage responsible shopping behavior during the month. As a result, the increase in food price inflation is expected to moderate in the coming months. Accordingly, headline inflation is projected to average at 3.5 percent in 2018, lower than that in 2017, therefore supporting private consumption (Figure A.29). The baseline forecast assumes increases in crude oil prices and some inflationary effects of regional elections this year and the presidential election in 2019. Upside inflation risks nevertheless exist, especially from imported inflation from the depreciation of the Rupiah and higher oil prices.
Figure A.29: Upside pressures from food price volatility have eased due to successful harvest season (annual average change yoy, percent)
Source: BPS; World Bank staff calculations
53 Netral News (May 02, 2018). 54 Indonesia Investments (May 02, 2018). 55 Industri Bisnis (May 11, 2018).
-3.5
-3
-2.5
-2
-1.5
-1
-0.5
0
2012 2013 2014 2015 2016 2017 2018 2019
2
3
4
5
6
7
8
Dec-14 Dec-15 Dec-16 Dec-17 Dec-18 Dec-19
Forecast
3.8%3.5%
Consumer Price Inflation
3.5% 3.7%
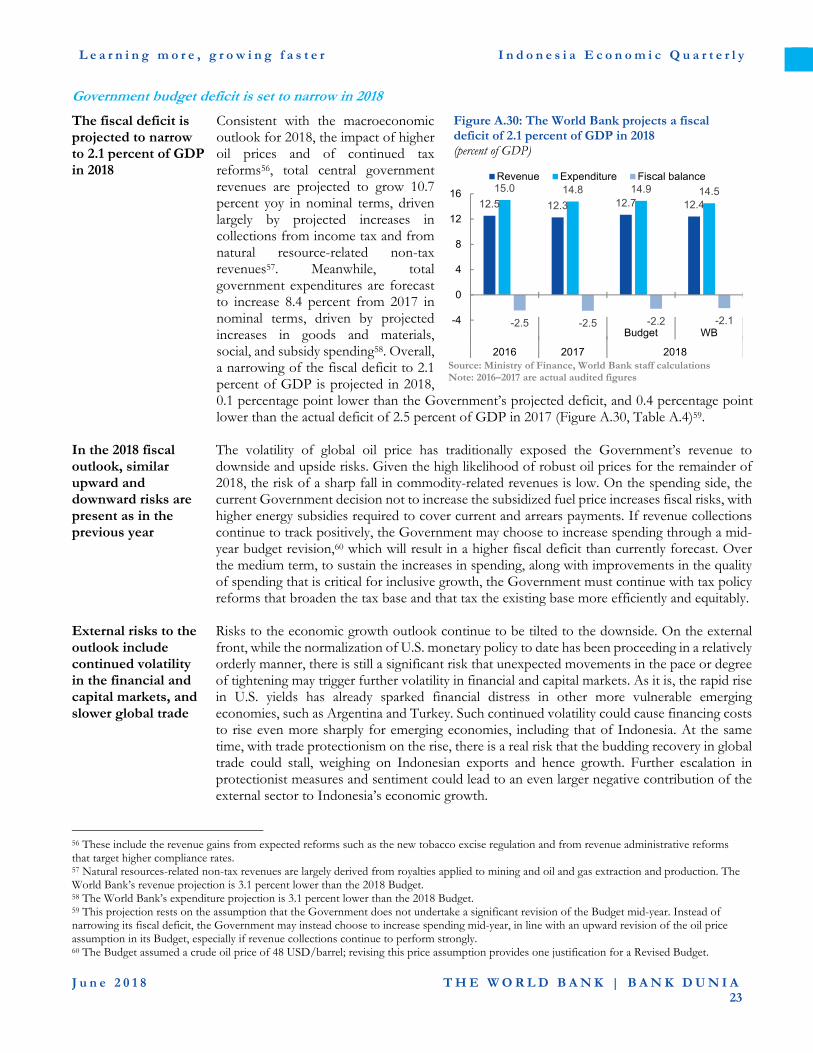
L e a r n i n g m o r e , g r o w i n g f a s t e r I n d o n e s i a E c o n o m i c Q u a r t e r l y
J u n e 2 0 1 8 T H E W O R L D B A N K | B A N K D U N I A
23
Government budget deficit is set to narrow in 2018
The fiscal deficit is projected to narrow to 2.1 percent of GDP in 2018
Consistent with the macroeconomic outlook for 2018, the impact of higher oil prices and of continued tax reforms56, total central government revenues are projected to grow 10.7 percent yoy in nominal terms, driven largely by projected increases in collections from income tax and from natural resource-related non-tax revenues57. Meanwhile, total government expenditures are forecast to increase 8.4 percent from 2017 in nominal terms, driven by projected increases in goods and materials, social, and subsidy spending58. Overall, a narrowing of the fiscal deficit to 2.1 percent of GDP is projected in 2018, 0.1 percentage point lower than the Government’s projected deficit, and 0.4 percentage point lower than the actual deficit of 2.5 percent of GDP in 2017 (Figure A.30, Table A.4)59.
Figure A.30: The World Bank projects a fiscal deficit of 2.1 percent of GDP in 2018 (percent of GDP)
Source: Ministry of Finance, World Bank staff calculations Note: 2016–2017 are actual audited figures
In the 2018 fiscal outlook, similar upward and downward risks are present as in the previous year
The volatility of global oil price has traditionally exposed the Government’s revenue to downside and upside risks. Given the high likelihood of robust oil prices for the remainder of 2018, the risk of a sharp fall in commodity-related revenues is low. On the spending side, the current Government decision not to increase the subsidized fuel price increases fiscal risks, with higher energy subsidies required to cover current and arrears payments. If revenue collections continue to track positively, the Government may choose to increase spending through a mid-year budget revision,60 which will result in a higher fiscal deficit than currently forecast. Over the medium term, to sustain the increases in spending, along with improvements in the quality of spending that is critical for inclusive growth, the Government must continue with tax policy reforms that broaden the tax base and that tax the existing base more efficiently and equitably.
External risks to the outlook include continued volatility in the financial and capital markets, and slower global trade
Risks to the economic growth outlook continue to be tilted to the downside. On the external front, while the normalization of U.S. monetary policy to date has been proceeding in a relatively orderly manner, there is still a significant risk that unexpected movements in the pace or degree of tightening may trigger further volatility in financial and capital markets. As it is, the rapid rise in U.S. yields has already sparked financial distress in other more vulnerable emerging economies, such as Argentina and Turkey. Such continued volatility could cause financing costs to rise even more sharply for emerging economies, including that of Indonesia. At the same time, with trade protectionism on the rise, there is a real risk that the budding recovery in global trade could stall, weighing on Indonesian exports and hence growth. Further escalation in protectionist measures and sentiment could lead to an even larger negative contribution of the external sector to Indonesia’s economic growth.
56 These include the revenue gains from expected reforms such as the new tobacco excise regulation and from revenue administrative reforms that target higher compliance rates. 57 Natural resources-related non-tax revenues are largely derived from royalties applied to mining and oil and gas extraction and production. The World Bank’s revenue projection is 3.1 percent lower than the 2018 Budget. 58 The World Bank’s expenditure projection is 3.1 percent lower than the 2018 Budget. 59 This projection rests on the assumption that the Government does not undertake a significant revision of the Budget mid-year. Instead of narrowing its fiscal deficit, the Government may instead choose to increase spending mid-year, in line with an upward revision of the oil price assumption in its Budget, especially if revenue collections continue to perform strongly. 60 The Budget assumed a crude oil price of 48 USD/barrel; revising this price assumption provides one justification for a Revised Budget.
12.5 12.3 12.7 12.4
15.0 14.8 14.9 14.5
-2.5 -2.5 -2.2 -2.1-4
0
4
8
12
16
Budget WB
2016 2017 2018
Revenue Expenditure Fiscal balance

L e a r n i n g m o r e , g r o w i n g f a s t e r I n d o n e s i a E c o n o m i c Q u a r t e r l y
J u n e 2 0 1 8 T H E W O R L D B A N K | B A N K D U N I A
24
Domestic risks include heightened consumer price inflation
Amid renewed geopolitical tensions involving Iran, and the deteriorating capacity of Venezuela to produce oil, crude oil prices are poised to increase further in the short-term. At the same time, with the Rupiah depreciating in both nominal and real terms, the risk associated with higher imported inflation is also higher. Meanwhile, food-price inflation has surged in recent months. If headline inflation increases significantly higher than expected, consumer purchasing power could be eroded, weighing on private consumption. Given that private consumption constitutes around 60 percent of the economy, slower private consumption growth could be a significant drag on overall GDP growth.
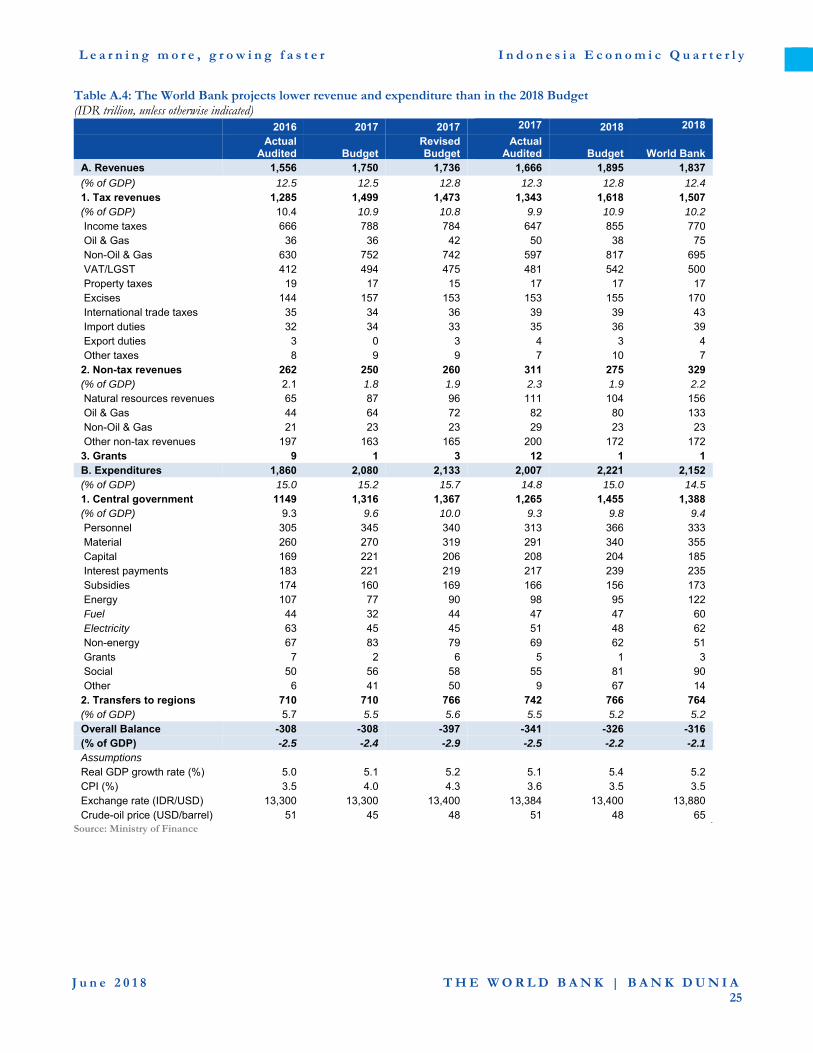
L e a r n i n g m o r e , g r o w i n g f a s t e r I n d o n e s i a E c o n o m i c Q u a r t e r l y
J u n e 2 0 1 8 T H E W O R L D B A N K | B A N K D U N I A
25
Table A.4: The World Bank projects lower revenue and expenditure than in the 2018 Budget (IDR trillion, unless otherwise indicated)
2016 2017 2017 2017 2018 2018
Actual
Audited Budget Revised Budget
Actual Audited Budget World Bank
A. Revenues 1,556 1,750 1,736 1,666 1,895 1,837
(% of GDP) 12.5 12.5 12.8 12.3 12.8 12.4 1. Tax revenues 1,285 1,499 1,473 1,343 1,618 1,507 (% of GDP) 10.4 10.9 10.8 9.9 10.9 10.2 Income taxes 666 788 784 647 855 770 Oil & Gas 36 36 42 50 38 75 Non-Oil & Gas 630 752 742 597 817 695 VAT/LGST 412 494 475 481 542 500 Property taxes 19 17 15 17 17 17 Excises 144 157 153 153 155 170 International trade taxes 35 34 36 39 39 43 Import duties 32 34 33 35 36 39 Export duties 3 0 3 4 3 4 Other taxes 8 9 9 7 10 7 2. Non-tax revenues 262 250 260 311 275 329 (% of GDP) 2.1 1.8 1.9 2.3 1.9 2.2 Natural resources revenues 65 87 96 111 104 156 Oil & Gas 44 64 72 82 80 133 Non-Oil & Gas 21 23 23 29 23 23 Other non-tax revenues 197 163 165 200 172 172 3. Grants 9 1 3 12 1 1 B. Expenditures 1,860 2,080 2,133 2,007 2,221 2,152 (% of GDP) 15.0 15.2 15.7 14.8 15.0 14.5 1. Central government 1149 1,316 1,367 1,265 1,455 1,388 (% of GDP) 9.3 9.6 10.0 9.3 9.8 9.4 Personnel 305 345 340 313 366 333 Material 260 270 319 291 340 355 Capital 169 221 206 208 204 185 Interest payments 183 221 219 217 239 235 Subsidies 174 160 169 166 156 173 Energy 107 77 90 98 95 122 Fuel 44 32 44 47 47 60 Electricity 63 45 45 51 48 62 Non-energy 67 83 79 69 62 51 Grants 7 2 6 5 1 3 Social 50 56 58 55 81 90 Other 6 41 50 9 67 14 2. Transfers to regions 710 710 766 742 766 764 (% of GDP) 5.7 5.5 5.6 5.5 5.2 5.2 Overall Balance -308 -308 -397 -341 -326 -316 (% of GDP) -2.5 -2.4 -2.9 -2.5 -2.2 -2.1 Assumptions Real GDP growth rate (%) 5.0 5.1 5.2 5.1 5.4 5.2 CPI (%) 3.5 4.0 4.3 3.6 3.5 3.5 Exchange rate (IDR/USD) 13,300 13,300 13,400 13,384 13,400 13,880 Crude-oil price (USD/barrel) 51 45 48 51 48 65
Source: Ministry of Finance

L e a r n i n g m o r e , g r o w i n g f a s t e r I n d o n e s i a E c o n o m i c Q u a r t e r l y
J u n e 2 0 1 8 T H E W O R L D B A N K | B A N K D U N I A
26
B. Delivering quality education for Indonesia: Addressing challenges after 15 years of educational reforms61
Indonesia’s long-term growth potential and quality of life is highly dependent on the quality of its human capital62. Challenges in human capital development to date have led to low levels of labor productivity, limited contribution of education to economic growth, and lower overall competitiveness. Indonesia’s labor productivity is one fourth of that registered by Malaysia, and the estimated contribution of education to long-term economic growth is 1.8 percentage points per year lower than in Vietnam. The Global Competitiveness Index ranked Indonesia overall 36th of 137 participating countries, while primary education and health are ranked 94th and higher education and training are at the 64th position. Low human capital also affects the quality of life, since educated and healthy people are likely to live longer and are better able to provide for themselves and their families. In 2002, Indonesia embarked on a series of policy reforms to strengthen access to and the quality of education, both key determinants of human capital development. The elements of the reforms were comprehensive and aligned with international best practices. After fifteen years, however, the results have been mixed. Schooling attainment has grown significantly, but student learning remains below the levels of other countries in the region, compromising the country’s competitiveness in the global economy. Indonesia must now revisit the reforms with an eye to improving education quality, in order to adequately develop human capital and meet its inclusive growth and poverty reduction objectives. Despite the comprehensive elements, significant implementation challenges have prevented the policy reforms from reaching their full potential. Several actions have been taken to address some of these challenges, but further actions are urgently needed, in particular to halt a growing inequality in student results and take advantage of the opportunity generated by the large number of teachers retiring in the next decade. Key recommendations include: defining and enforcing the mandatory qualification criteria for every teacher who enters the classroom, complementing the existing financing mechanisms for education with a targeted, performance-based transfer for lagging schools and districts, and launching a national education quality campaign to generate public awareness and pressure for effective actions to improve student learning.
61 This report focuses on basic and secondary education. 62 Human capital includes skills, knowledge and health characteristics that increase productive capacity and earning potential. The World Bank is developing a measure of the human capital that combines health and education indicators, such as the under-5 survival rate, quality adjusted years of schooling, adult survival rate and stunting for children under 5.

L e a r n i n g m o r e , g r o w i n g f a s t e r I n d o n e s i a E c o n o m i c Q u a r t e r l y
J u n e 2 0 1 8 T H E W O R L D B A N K | B A N K D U N I A
27
1. Indonesia’s growth potential and quality of life is highly dependent on its human capital
Human capital is a fundamental driver of economic growth
Education systems build cognitive skills, equipping workers with knowledge that makes them more productive and allows innovations to emerge. From basic literacy to advanced engineering, the knowledge transmitted in schools is critical for a society’s economic and social progress. Non-cognitive skills, such as teamwork, leadership, and communication, are also critical for individual success in labor markets and overall productivity growth. Although non-cognitive skills cannot always be taught, they are often greatly influenced by formal schooling.
Both the quantity and quality of education matter for accumulating human capital
Access to schooling is a necessary, but not sufficient, condition for building human capital. In addition to ensuring that the education system has the broadest possible coverage (quantity), it is perhaps even more crucial to ensure the quality of education. Hanushek and Woessmann (2011) estimate that an increase of 50 points in the Programme for International Student Assessment (PISA) tests translates to an increase in the long-term economic growth rate of 0.93 percentage points annually. Given the difference in PISA scores of more than 100 points between Indonesia and high-performing PISA countries such as Vietnam or Singapore, the contribution of human capital to long-term economic growth rates in Indonesia is approximately 2 percentage points less than it would be if Indonesia had levels of human capital similar to those countries.
Indonesia has made great progress in closing ‘quantity’ gaps in education…
In 1950, Indonesians 25 years and older had, on average, less than 2 years of schooling. As a result of aggressive policies to enhance educational attainment, years of school increased to 4 by 1990, and doubled to 8 by 2015 (Figure B.1). Despite this, Indonesia still has fewer years of schooling than other countries in the region like Singapore, Malaysia, and Thailand.
Figure B.1: Indonesia’s improvement in school attainment has been impressive – doubling in the past 25 years (average years of schooling working age population)
Figure B.2: Quality of education has also improved despite a setback at the turn of the century (harmonized learning outcome index)
Source: Barro and Lee (2013), SUSENAS Source: Altinok et al. (2018)
Note: The HLO is constructed for 163 countries, it has a mean of 500 and a standard deviation of 30.
…as well as making modest improvements in quality
Indonesia has been one of the most regular participants in international tests to measure student learning over the past 25 years. For most of that period, student learning, as measured by Harmonized Learning Outcomes63 (HLO), showed improvements before losing some ground at the turn of the century. Learning outcomes improved between 1990 and 2000, and then worsened till 2010. Since 2010, student learning has returned to an upward trajectory. (Figure B.2)
63 This index combines all available measures of student learning. See Altinok, Angrist and Patrinos (2018).
0
1
2
3
4
5
6
7
8
9
1990 1995 2000 2005 2010 2015
365
370
375
380
385
390
395
400
405
410
1990 1995 2000 2005 2010 2015
Indonesia
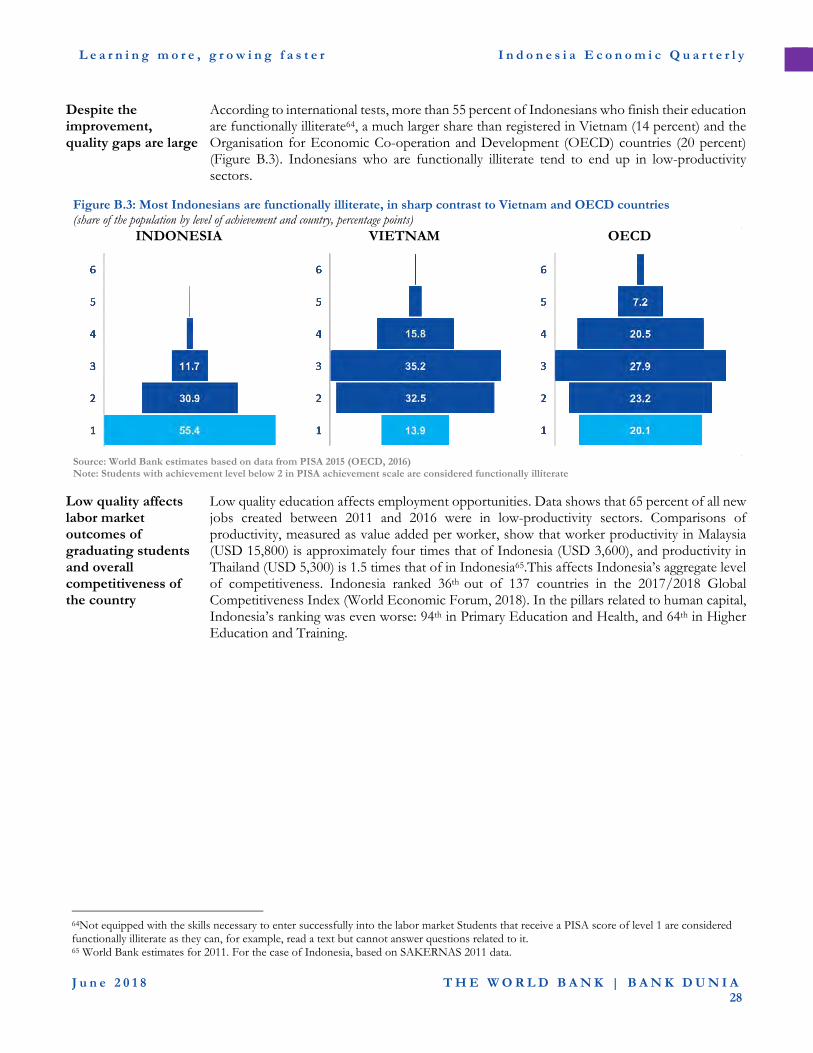
L e a r n i n g m o r e , g r o w i n g f a s t e r I n d o n e s i a E c o n o m i c Q u a r t e r l y
J u n e 2 0 1 8 T H E W O R L D B A N K | B A N K D U N I A
28
Despite the improvement, quality gaps are large
According to international tests, more than 55 percent of Indonesians who finish their education are functionally illiterate64, a much larger share than registered in Vietnam (14 percent) and the Organisation for Economic Co-operation and Development (OECD) countries (20 percent) (Figure B.3). Indonesians who are functionally illiterate tend to end up in low-productivity sectors.
Figure B.3: Most Indonesians are functionally illiterate, in sharp contrast to Vietnam and OECD countries (share of the population by level of achievement and country, percentage points)
INDONESIA VIETNAM OECD
Source: World Bank estimates based on data from PISA 2015 (OECD, 2016) Note: Students with achievement level below 2 in PISA achievement scale are considered functionally illiterate
Low quality affects labor market outcomes of graduating students and overall competitiveness of the country
Low quality education affects employment opportunities. Data shows that 65 percent of all new jobs created between 2011 and 2016 were in low-productivity sectors. Comparisons of productivity, measured as value added per worker, show that worker productivity in Malaysia (USD 15,800) is approximately four times that of Indonesia (USD 3,600), and productivity in Thailand (USD 5,300) is 1.5 times that of in Indonesia65.This affects Indonesia’s aggregate level of competitiveness. Indonesia ranked 36th out of 137 countries in the 2017/2018 Global Competitiveness Index (World Economic Forum, 2018). In the pillars related to human capital, Indonesia’s ranking was even worse: 94th in Primary Education and Health, and 64th in Higher Education and Training.
64Not equipped with the skills necessary to enter successfully into the labor market Students that receive a PISA score of level 1 are considered functionally illiterate as they can, for example, read a text but cannot answer questions related to it. 65 World Bank estimates for 2011. For the case of Indonesia, based on SAKERNAS 2011 data.
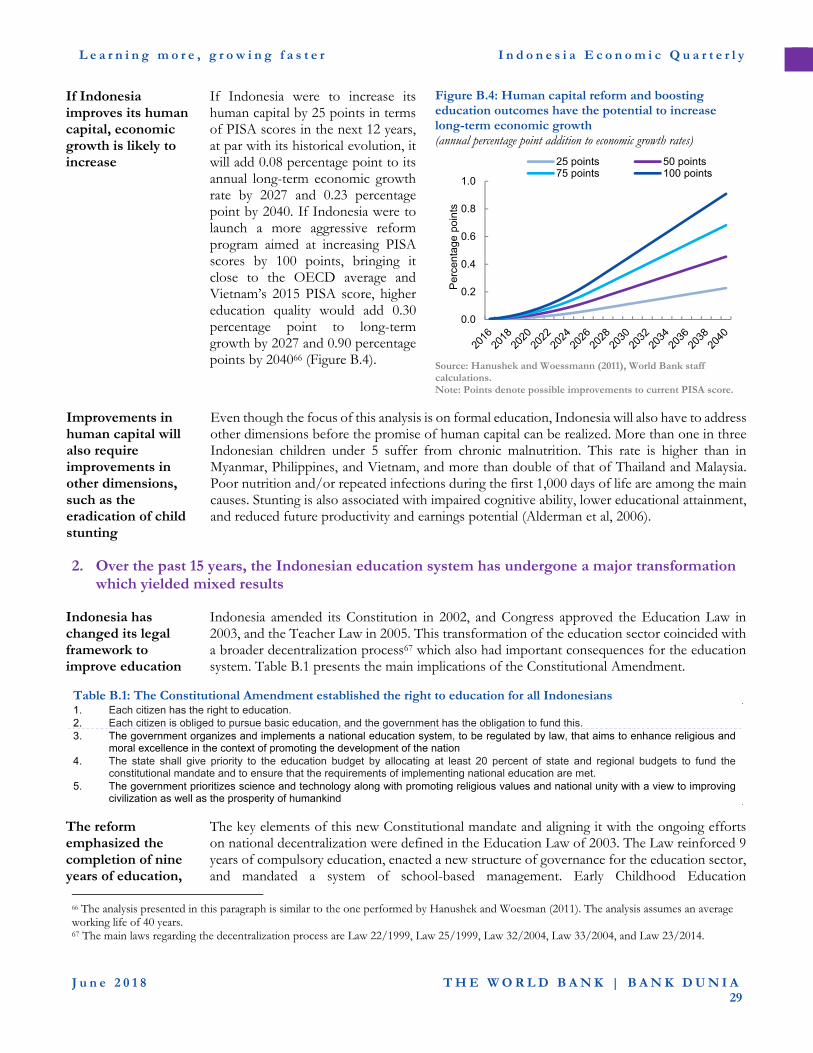
L e a r n i n g m o r e , g r o w i n g f a s t e r I n d o n e s i a E c o n o m i c Q u a r t e r l y
J u n e 2 0 1 8 T H E W O R L D B A N K | B A N K D U N I A
29
If Indonesia improves its human capital, economic growth is likely to increase
If Indonesia were to increase its human capital by 25 points in terms of PISA scores in the next 12 years, at par with its historical evolution, it will add 0.08 percentage point to its annual long-term economic growth rate by 2027 and 0.23 percentage point by 2040. If Indonesia were to launch a more aggressive reform program aimed at increasing PISA scores by 100 points, bringing it close to the OECD average and Vietnam’s 2015 PISA score, higher education quality would add 0.30 percentage point to long-term growth by 2027 and 0.90 percentage points by 204066 (Figure B.4).
Figure B.4: Human capital reform and boosting education outcomes have the potential to increase long-term economic growth (annual percentage point addition to economic growth rates)
Source: Hanushek and Woessmann (2011), World Bank staff calculations. Note: Points denote possible improvements to current PISA score.
Improvements in human capital will also require improvements in other dimensions, such as the eradication of child stunting
Even though the focus of this analysis is on formal education, Indonesia will also have to address other dimensions before the promise of human capital can be realized. More than one in three Indonesian children under 5 suffer from chronic malnutrition. This rate is higher than in Myanmar, Philippines, and Vietnam, and more than double of that of Thailand and Malaysia. Poor nutrition and/or repeated infections during the first 1,000 days of life are among the main causes. Stunting is also associated with impaired cognitive ability, lower educational attainment, and reduced future productivity and earnings potential (Alderman et al, 2006).
2. Over the past 15 years, the Indonesian education system has undergone a major transformation which yielded mixed results
Indonesia has changed its legal framework to improve education
Indonesia amended its Constitution in 2002, and Congress approved the Education Law in 2003, and the Teacher Law in 2005. This transformation of the education sector coincided with a broader decentralization process67 which also had important consequences for the education system. Table B.1 presents the main implications of the Constitutional Amendment.
Table B.1: The Constitutional Amendment established the right to education for all Indonesians 1. Each citizen has the right to education. 2. Each citizen is obliged to pursue basic education, and the government has the obligation to fund this. 3. The government organizes and implements a national education system, to be regulated by law, that aims to enhance religious and
moral excellence in the context of promoting the development of the nation 4. The state shall give priority to the education budget by allocating at least 20 percent of state and regional budgets to fund the
constitutional mandate and to ensure that the requirements of implementing national education are met. 5. The government prioritizes science and technology along with promoting religious values and national unity with a view to improving
civilization as well as the prosperity of humankind
The reform emphasized the completion of nine years of education,
The key elements of this new Constitutional mandate and aligning it with the ongoing efforts on national decentralization were defined in the Education Law of 2003. The Law reinforced 9 years of compulsory education, enacted a new structure of governance for the education sector, and mandated a system of school-based management. Early Childhood Education
66 The analysis presented in this paragraph is similar to the one performed by Hanushek and Woesman (2011). The analysis assumes an average working life of 40 years. 67 The main laws regarding the decentralization process are Law 22/1999, Law 25/1999, Law 32/2004, Law 33/2004, and Law 23/2014.
0.0
0.2
0.4
0.6
0.8
1.0
25 points 50 points75 points 100 points
Per
cent
age
poin
ts

L e a r n i n g m o r e , g r o w i n g f a s t e r I n d o n e s i a E c o n o m i c Q u a r t e r l y
J u n e 2 0 1 8 T H E W O R L D B A N K | B A N K D U N I A
30
and formally introduced ECED
Development (ECED) was included as part of the National Education System for the first time under the Education Law68. These measures were followed by the issuance of the National ECED Standard in 2009 (revised in 2014) and the ECED Curriculum (2014)69.
The reform was successful in expanding access to education, particularly among poorer Indonesians
The additional financial resources for the sector mandated by the Constitution financed the expansion of education services and the number of teachers required for the new schools and classrooms. The additional resources allocated to schools to support school-based management reduced the financial burden on families, promoting enrollment, particularly from poorer segments of the population. These resources were complemented with direct transfers to students through the Program Indonesia Pintar Program (PIP). By 2015, school attainment had increased to 8 years of education, from 4 years in 1990 and 2 years in 1950. The average rate of expansion between 2000 and 2015 was 0.26 years of education per chronological year – more than doubling the rate registered in the 50 years prior7071. In terms of total enrollment, the number of students increased by more than 10 million (25 percent), and was mostly in secondary education. Between 2002 and 2017, school enrollment among youth between the ages of 16 to 18 increased from 50 percent to 71 percent. The increase in enrollment was larger among students in the lowest income quintile, for whom participation rates almost doubled from 32 percent to 57 percent. As a result, the gap in school enrollment in the 16–18 age group between the poorest and richest quintiles decreased from 37 to 25 percentage points (Figure B.5).
Figure B.5: School enrollment of 16–18-year-olds grew for all income levels, but faster growth was registered among poorer Indonesians (shared enrolled, percent)
Source: SUSENAS, various years
Significant improvements in ECED have also been observed since 2005
Following a national effort to establish at least one ECED facility in every village in the country, enrollment of children aged 3–6 years in registered ECED services increased from 20 percent in 2005 to 72 percent in 201672. However, according to the National Socio-economic Household Survey (SUSENAS)73 2017, only 34 percent of children aged 3–6 years were attending an ECED center. Parental awareness, the long distance to facilities, the low quality of services, and
68 This followed up a key reform to formalize the provision of ECED by establishing a new directorate dedicated to early childhood at the Ministry of Education and Culture in 2001. 69 To ensure that child development is addressed in a holistic manner, a Presidential Declaration for Holistic and Integrated ECD was issued in 2013 to establish improved cross-sectoral coordination and cooperation and partnership among relevant institutions (including health, nutrition, parenting, and protection). PAUD (Pendidikan Anak Usia Dini/early childhood education development) is a program under the MOEC, while PAUD Holistic Integrated is a concept that requires multiple ministries to coordinate their program targeting children aged 0–6 years. 70 Three main periods can be identified in the race to increase school enrollment: (i) Achieving universal primary education. Between 1973 and 1979, Indonesia doubled the number of entrants into primary school, through the massive so-called INPRES program for school construction and teacher recruitment. In addition, with the introduction of the National Compulsory Education Program (1984), the government required all children to complete primary school. (ii) Achieving universal basic education. In 1994, the government introduced nine years of compulsory schooling, raising the minimum requirements from basic education to universal basic education. The Education Law reinforced the requirement of compulsory attendance at basic education and ordered the government to finance it. (iii) Achieving universal upper-secondary education. In the late 2000s and early 2010s, the Government defined a new goal: achieving 12 years of universal education, as established in the National Medium-Term Development Plan, 2015–2019. 71 Between 1950 and 2000, school attainment increased from 1.5 years of education to 5 years of education, or 0.1 year of education per chronological year. 72 MOEC does not collect data on ECED enrollment among children younger than age 3. 73 Nationally representative household survey conducted by BPS (Central Bureau Statistics).

L e a r n i n g m o r e , g r o w i n g f a s t e r I n d o n e s i a E c o n o m i c Q u a r t e r l y
J u n e 2 0 1 8 T H E W O R L D B A N K | B A N K D U N I A
31
insufficient infrastructure and supporting learning tools may have affected family decisions to actively participate in ECED programs. The access gap also remains across socio-economic quintiles. About 44 percent of children from the top socio-economic quintile participate in ECED, compared to only 29 percent of children in the lowest quintile.
To improve quality, the reform created a mechanism for the professionalization of the teacher labor force
At the onset of the reform, most teachers in Indonesia did not have the basic competencies for successful teaching in classrooms. The Teacher Law defines the competencies required for teachers, the process by which teachers must abide to meet national teaching standards, the role of various ministry units and agencies in supporting teachers to reach those competencies, as well as a teacher certification process and the conditions under which teachers could receive special and professional allowances. Among other major changes, the Teacher Law established that teaching is a profession that requires a four-year degree, and a merit-based appointment of principals and supervisors. (Chang, et al., 2014).
The reform also aimed to increase collaboration between schools and communities, with the latter becoming important actors for improving education outcomes
The Education Law promotes school-based management by transferring managerial authority and operational autonomy to schools and communities. The central government retained the authority to: (i) hire and fire civil servant teachers, (ii) establish the national curriculum and competency standards, and (iii) administer learning assessments. To strengthen school-based management, the government launched the Bantuan Operasional Sekolah (BOS) program. BOS provides monetary grants to all schools in Indonesia, on a per-student basis. The grants were expected to raise education outcomes by directly supporting school operating costs, providing financial assistance to schools for retaining students in need74, and strengthening school-based management and school autonomy. All students at the same education level are entitled to the same BOS amount, even though there are differences in BOS funding amounts between basic and upper secondary education. (Al-Samarrai, et al., 2014).
The role of local governments in education has changed as they became managers of the education sector in their localities
Under the decentralization reform, district governments were assigned new responsibilities in the areas of health, education, public works, the environment, communication, transport, agriculture, manufacturing industry and trade, capital investment, land, cooperatives, the labor force, and infrastructure services, which had previously been the responsibility of the central government. In the education sector, responsibilities were assigned as follows: education management and education licensing are the responsibility of the districts and curriculum, accreditation, and teaching and non-teaching staff are the responsibility of the central government. The responsibility to manage upper-secondary schools was later moved from the districts to the provinces.
The reform also created mechanisms to measure education quality and promote accountability
The reform took advantage of Indonesia’s long tradition of national testing and sought to strengthen the role of tests to improve accountability. According to the Education Law, learning should be evaluated and the results used for purposes of accountability of education providers. The Education Law established that student evaluations should be conducted by independent agencies on a regular basis. A new national examination system was launched following the Education Law, which included evaluations at the end of primary, junior secondary, and senior secondary school. Under the preceding system, final results were partly determined by school grades and partly by national exam results. However, under the new system, students’ final results, including their promotion to the next grade, were entirely dependent on their national examination scores. As will be discussed later, this high-stakes system generated negative incentives for some stakeholders, which led to a reduced role of national exams after 2015.
The reform was comprehensive but faced
The different elements of the reform described above can be grouped into five categories: (i) new governance structure for better service delivery, (ii) additional resources for education and a mechanism to reach all schools ensuring adequate resources, (iii) strengthening of ECED, (iv)
74 As identified by the school committee.

L e a r n i n g m o r e , g r o w i n g f a s t e r I n d o n e s i a E c o n o m i c Q u a r t e r l y
J u n e 2 0 1 8 T H E W O R L D B A N K | B A N K D U N I A
32
implementation challenges
improvement of teachers, and (v) improvements in the assessment system. These five categories are aligned with international best practices (Box B.1). Nonetheless, in the case of Indonesia there have been several implementation challenges that have limited the impact of the reform. Section B.3 presents the main implementation challenges.
Box B.1: Alignment of Indonesia policy reform with international best practices
Evidence from successful education systems suggests that focusing on a combination of five policy domains has helped countries to achieve success. The recent report, “Growing Smarter: Learning and Equitable Development in East Asia Pacific” (World Bank, 2018), finds that there is no single formula for education system success, but that high-performing systems consistently take action in five policy domains: (i) Aligning institutions to guarantee the basic conditions for learning, (ii) Implementing effective public spending focused on equity in basic education, (iii) Making sure children are ready to learn at school, (iv) Selecting and supporting teachers throughout their careers so they can focus on the classroom, and (v) Assessing students to diagnose problems and inform stakeholders. In Indonesia, education reform incorporated elements from these five policy domains:
First, a decentralized approach was chosen. The education sector in high-performing countries in East Asia, like Japan, South Korea, and Vietnam are mostly centralized, but some functions have recently been decentralized: curriculum and teachers tend to remain under the central authority, while local governments support the management of schools. Indonesia’s decentralized system has a similar structure where curriculum and teacher issues remained under the control of the central government, while management of schools was transferred to schools, districts, and provinces. Besides the introduction of these new actors, the institutional design of the reform was complemented by a series of regulations issued to facilitate the engagement.
Second, the resources going into education were increased significantly, guaranteeing a minimum level of resources for all schools. International evidence shows that resources relate to education outcomes, but, more importantly, that high-performing systems have mechanisms to distribute them efficiently to promote student learning. For example, Chile distributes resources on a per-student basis and, at the same time, has a mechanism to provide additional resources to schools and districts with higher percentages of disadvantaged students. This mechanism is contingent on improvement plans, and schools and districts are evaluated on the success of those plans (Murnane, et al., 2017). In Indonesia, the mandate to spend 20 percent of the national budget on education significantly increased the total resources invested in the sector; and through BOS, the reform guaranteed that all schools receive a minimum amount of resources that would allow them to operate and achieve better student learning. Additionally, the new institutional and financial environment created the mechanisms and resources for districts to support schools financially.
Third, several policy actions have been taken to promote student readiness. Top performers like Japan, South Korea, and Singapore had their policies for ECED established well before the 21st century, and more importantly, they continue to improve them in curricula and standards for service delivery. In Indonesia, there is a rising awareness on the importance of ECED interventions, which was supported with several regulations. As a result, enrollment is growing from a low base, particularly among the poor, increasing student readiness for first grade, and a curriculum has been developed, though important quality challenges remain.
Fourth, the reform focuses on upskilling the teaching labor force and its continuous improvement. Evidence from high-performing systems shows that successful teacher policies include: (i) high levels of selectivity in the process of appointing teachers, (ii) support for new teachers by observing classroom practices and providing feedback, (iii) support to teachers’ work with clear learning objectives and appropriate textbooks, (iv) keeping experienced teachers in the classroom and utilizing them as technical leaders for peers and researchers, and (v) a strong focus for teacher training on classroom practices and the ability to teach the curriculum. For example, in Japan, only 14 percent of those that apply into teaching are accepted, and of those, only 30–40 percent will find jobs in public schools. Furthermore, those that get teaching jobs are subject to evaluations of practical experiences, of professional development, and a probation period as they apply for tenure. Some of these elements were incorporated in Indonesia, as the reform introduced teacher certification in an attempt to ensure minimum levels of teacher quality, and required teachers to have bachelor’s degrees.
Fifth, the education reform reinforced the role of student testing to generate valuable information that could be used for system improvement. High-performing countries in East Asia have a tradition of assessing students, participating in international tests, and using the results of the assessments to improve student learning. For example, Japan uses national assessments and PISA results to constantly monitor education reform. Indonesia also had a long tradition of testing that was reinforced by the reform.
The results in quality have been limited, as Indonesia’s PISA
Indonesia has participated in all main international tests implemented since 1990, including Trends in International Mathematics and Science Study (TIMSS) and PISA. This allows for cross-country and across-time comparisons in learning outcomes. Among the different

L e a r n i n g m o r e , g r o w i n g f a s t e r I n d o n e s i a E c o n o m i c Q u a r t e r l y
J u n e 2 0 1 8 T H E W O R L D B A N K | B A N K D U N I A
33
scores improved while its TIMSS scores worsened
countries that participated in different PISA years, Indonesia recorded the highest gain in mathematics between 2003 and 201575, a positive outcome that coincided with the rapid expansion of enrollment in Indonesia with the incorporation of students from low socio-economic conditions into the education system (Figure B.6). However, the overall PISA score is lower than that predicted by Indonesia’s income levels76. With a GDP per capita of USD 3,336 in 2015, Indonesia’s PISA score in science was 0.6 schooling year below its predicted level77. While in TIMSS, the average math scores of Indonesian 8th graders decreased by 17 points from 1999 to 201178. The integrated measure presented by the HLO (Figure B.2) incorporates the PISA and TIMSS scores. As mentioned before, it shows a declining trend at the beginning of the century, but an improving trend after 2010. This may reflect the initial challenges for the system to accommodate the additional students, challenges that may have been overcome after 2010.
Figure B.6: Indonesia increased its PISA scores in a context of rapid growth in student enrollment between 2003 and 2015 (percentage change in enrollment, y axis; change in PISA score, x axis)
Figure B.7: PISA math scores improved for all students between 2003 and 2015, but improvement for poorer students has been smaller (PISA math score, y axis; index of socioeconomic conditions, x axis)
Source: World Bank estimates based on PISA scores in 2003 and 2015 (OECD, 2004; OECD, 2016)
Source: World Bank estimates based on data from PISA 2003 and 2015 (OECD, 2004; OECD, 2016) Note: Index of socioeconomic conditions measure family economic background including family assets, education levels, among others
Evolution in PISA results by socioeconomic status has been heterogeneous
Between 2003 and 2015, PISA scores of students from households in the bottom 50 percent of the income distribution remained relatively stable, while student scores in the top 50 percent of income recorded a significant increase. The growing difference can be expressed in terms of school years; the gap was equivalent to one school year in 2003, which widened to two school years in 2015 (Figure B.7).
Closing the learning gap with OECD countries will take much longer for poor students
If Indonesia maintains the growth rate in PISA scores registered between 2003 and 2015, it will take about 50 years to reach the OECD average in mathematics, 69 for reading, and 134 years for science. For students from the richest income quartile, it will take 20 years, 33 years, and 62 years to reach the OECD average in mathematics, reading, and science, respectively. For
75 Similarly, Indonesia registered test score improvements between 2009 and 2015 and 2012 and 2015. 76 International evidence shows that there is a positive correlation between PISA scores and GDP per capita. According to this relationship, Indonesia’s score was 403, 19 points below the predicted level (World Bank, 2018). 77 In science, the decrease was 29 points for the same year. For 4th grader students, Indonesia took the TIMSS test for the first time in 2015 and achieved 397 for both math and science. This score is still far lower than the mean of the overall sample, which was 500. 78 Among the participants in PISA 2003 and 2015, Indonesia recorded the second largest increase in enrollment, and Indonesia was the only country that registered an increase in enrollment among the poorest segment of its population.
LVARUS
SVKPOL
CZE TUN MACHUNHKG
DEUAUTSWEGBR GRCJPN
CHEFIN
PRTTHAFRAISL CAN
BELITA
NLD IRLKOR
NORAUS USANZL
URYDNK
ESP BRAMEX
LUX
IDN
TUR
-70
-40
-10
20
50
80
110
-40 -20 0 20 40
Cha
nge
in E
nrol
lmen
t-in
per
cent
age
Change in Math Test points
325
350
375
400
425
450
-4 -3 -2 -1 0
PIS
A M
ath
scor
e
Index socio economic conditions
2015
2003
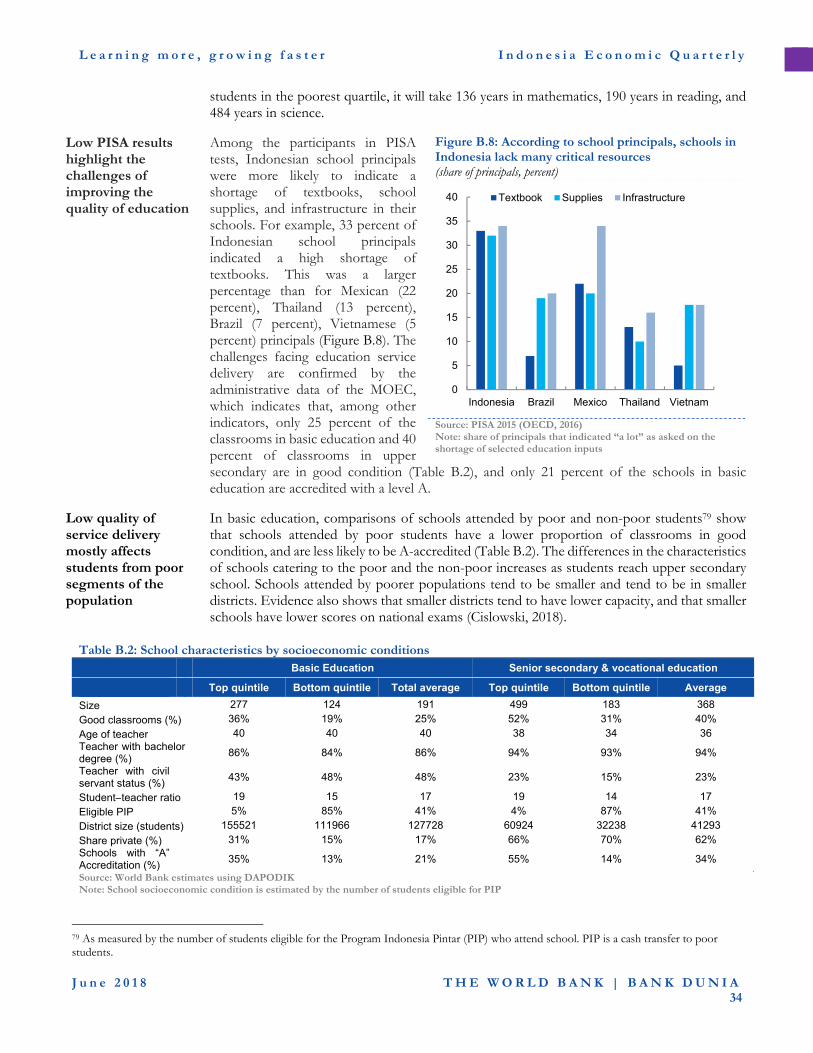
L e a r n i n g m o r e , g r o w i n g f a s t e r I n d o n e s i a E c o n o m i c Q u a r t e r l y
J u n e 2 0 1 8 T H E W O R L D B A N K | B A N K D U N I A
34
students in the poorest quartile, it will take 136 years in mathematics, 190 years in reading, and 484 years in science.
Low PISA results highlight the challenges of improving the quality of education
Among the participants in PISA tests, Indonesian school principals were more likely to indicate a shortage of textbooks, school supplies, and infrastructure in their schools. For example, 33 percent of Indonesian school principals indicated a high shortage of textbooks. This was a larger percentage than for Mexican (22 percent), Thailand (13 percent), Brazil (7 percent), Vietnamese (5 percent) principals (Figure B.8). The challenges facing education service delivery are confirmed by the administrative data of the MOEC, which indicates that, among other indicators, only 25 percent of the classrooms in basic education and 40 percent of classrooms in upper secondary are in good condition (Table B.2), and only 21 percent of the schools in basic education are accredited with a level A.
Figure B.8: According to school principals, schools in Indonesia lack many critical resources (share of principals, percent)
Source: PISA 2015 (OECD, 2016) Note: share of principals that indicated “a lot” as asked on the shortage of selected education inputs
Low quality of service delivery mostly affects students from poor segments of the population
In basic education, comparisons of schools attended by poor and non-poor students79 show that schools attended by poor students have a lower proportion of classrooms in good condition, and are less likely to be A-accredited (Table B.2). The differences in the characteristics of schools catering to the poor and the non-poor increases as students reach upper secondary school. Schools attended by poorer populations tend to be smaller and tend to be in smaller districts. Evidence also shows that smaller districts tend to have lower capacity, and that smaller schools have lower scores on national exams (Cislowski, 2018).
Table B.2: School characteristics by socioeconomic conditions
Basic Education Senior secondary & vocational education
Top quintile Bottom quintile Total average Top quintile Bottom quintile Average
Size 277 124 191 499 183 368
Good classrooms (%) 36% 19% 25% 52% 31% 40%
Age of teacher 40 40 40 38 34 36 Teacher with bachelor degree (%)
86% 84% 86% 94% 93% 94%
Teacher with civil servant status (%)
43% 48% 48% 23% 15% 23%
Student–teacher ratio 19 15 17 19 14 17
Eligible PIP 5% 85% 41% 4% 87% 41%
District size (students) 155521 111966 127728 60924 32238 41293
Share private (%) 31% 15% 17% 66% 70% 62% Schools with “A” Accreditation (%)
35% 13% 21% 55% 14% 34%
Source: World Bank estimates using DAPODIK Note: School socioeconomic condition is estimated by the number of students eligible for PIP
79 As measured by the number of students eligible for the Program Indonesia Pintar (PIP) who attend school. PIP is a cash transfer to poor students.
0
5
10
15
20
25
30
35
40
Indonesia Brazil Mexico Thailand Vietnam
Textbook Supplies Infrastructure

L e a r n i n g m o r e , g r o w i n g f a s t e r I n d o n e s i a E c o n o m i c Q u a r t e r l y
J u n e 2 0 1 8 T H E W O R L D B A N K | B A N K D U N I A
35
3. To fully benefit from investments in human capital, Indonesia needs both improved policies and improved implementation
What has limited the education reform from reaching its potential?
Although the main elements of the reform remain in place, several of its ingredients have not been fully implemented. Below, we present main implementation challenges of the policies described in Section B.2.
a. Additional resources have not led to improvements in education quality
Financial resources into the education sector have increased threefold in real terms over the last 15 years
In 2009, funding for education reached 20 percent of the national budget.80 Because of economic growth since 2009, the aggregate amount allocated for education in the national budget also increased (Figure B.9), and as the national budget is expected to expand (IMF, 2018), the education budget will similarly increase.
Figure B.9: Resources for education have increased significantly since 2001 (IDR Trillion, LHS; percent of GDP and spending, RHS)
Source: World Bank COFIS database using MOF data and Presidential Regulation on budget details of respective years Notes: Realized spending data is available until 2014. 2016 and 2017 are revised budget data, 2018 is budget data. Realized spending data might not capture some SNG (Sub-National Government) education spending if coded under the General Administration function
Local governments receive most of the education budget, whilst MOEC only manages 9 percent of it
General basic and secondary education is a joint responsibility of the MOEC and local governments. Of the IDR 319 trillion allocated for general education, MOEC received IDR 40 trillion, while the remaining IDR 279 trillion was received by local governments. Of the remaining budget, MORA (Ministry of Religious Affairs) was allocated IDR 52 trillion, MORTHE (Ministry of Research, Technology, and Higher Education) received IDR 40 trillion for tertiary education, and IDR 13
Figure B.10: Distribution of education budget (2018) (share of total)
Source: Presidential Regulation No. 107/2017 on the education budget details for 2018
80 Achievement of this mandate was not immediate as it was necessary to identify the expenditure categories related to education and align the entire national budget.
2.24 2.36 2.77 2.52 2.51 2.72 2.95 2.73 3.19 3.14 3.31 3.30 3.34 3.30 3.48 3.36 3.14 3.00
11.26
14.24 15.1013.7313.95 14.32 15.59
13.64
18.86 19.38 18.87 17.88 17.3017.40
19.30 20.00 20.00 20.00
0
5
10
15
20
0
100
200
300
400
500
2001 2002 2003 2004 2005 2006 2007 2008 2009 2010 2011 2012 2013 2014 2015 2016 2017 2018
Total education spending (national), LHS Total education spending (2010=100), LHSTotal education spending as % GDP, RHS Total education spending as % national spending, RHS
OTHER MINISTRIES, 3%
MORTHE, 9%
MORA, 12%
Other education funds, 3%
MOEC, 9%
DISTRICTS AND
PROVINCES, 63%
72%
MOEC System
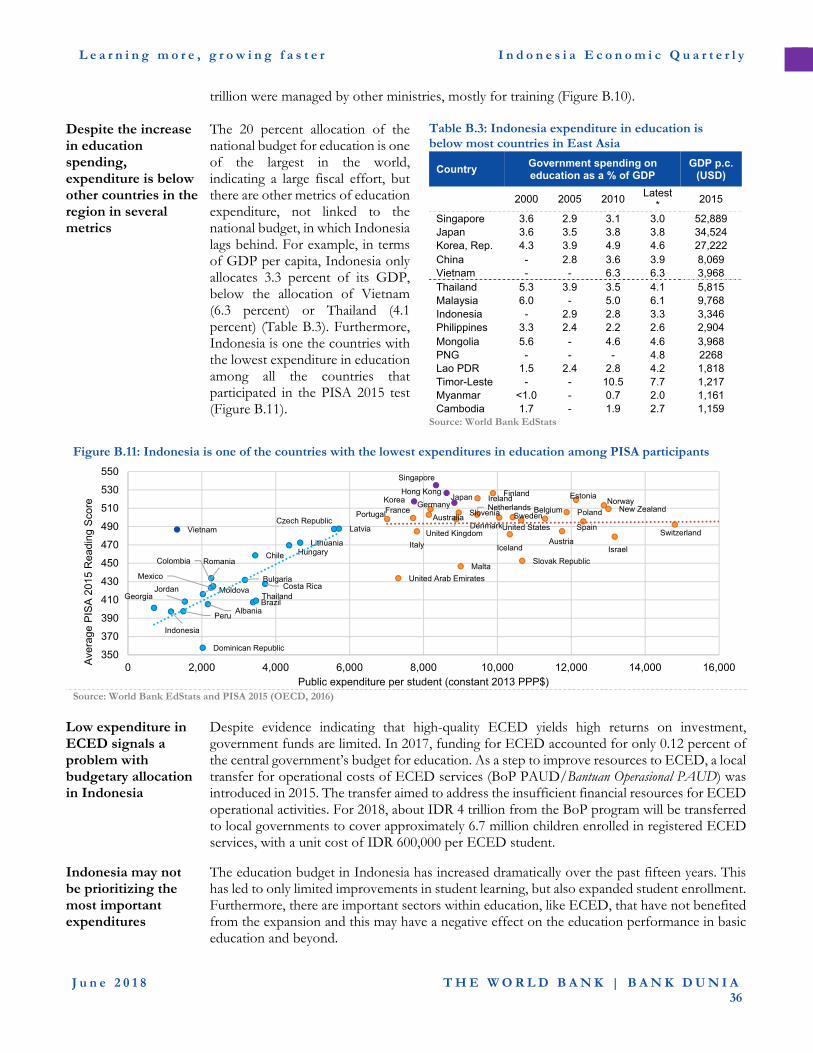
L e a r n i n g m o r e , g r o w i n g f a s t e r I n d o n e s i a E c o n o m i c Q u a r t e r l y
J u n e 2 0 1 8 T H E W O R L D B A N K | B A N K D U N I A
36
trillion were managed by other ministries, mostly for training (Figure B.10).
Despite the increase in education spending, expenditure is below other countries in the region in several metrics
The 20 percent allocation of the national budget for education is one of the largest in the world, indicating a large fiscal effort, but there are other metrics of education expenditure, not linked to the national budget, in which Indonesia lags behind. For example, in terms of GDP per capita, Indonesia only allocates 3.3 percent of its GDP, below the allocation of Vietnam (6.3 percent) or Thailand (4.1 percent) (Table B.3). Furthermore, Indonesia is one the countries with the lowest expenditure in education among all the countries that participated in the PISA 2015 test (Figure B.11).
Table B.3: Indonesia expenditure in education is below most countries in East Asia
Country Government spending on education as a % of GDP
GDP p.c. (USD)
2000 2005 2010 Latest
* 2015
Singapore 3.6 2.9 3.1 3.0 52,889 Japan 3.6 3.5 3.8 3.8 34,524 Korea, Rep. 4.3 3.9 4.9 4.6 27,222 China - 2.8 3.6 3.9 8,069 Vietnam - - 6.3 6.3 3,968 Thailand 5.3 3.9 3.5 4.1 5,815 Malaysia 6.0 - 5.0 6.1 9,768 Indonesia - 2.9 2.8 3.3 3,346 Philippines 3.3 2.4 2.2 2.6 2,904 Mongolia 5.6 - 4.6 4.6 3,968 PNG - - - 4.8 2268 Lao PDR 1.5 2.4 2.8 4.2 1,818 Timor-Leste - - 10.5 7.7 1,217 Myanmar <1.0 - 0.7 2.0 1,161 Cambodia 1.7 - 1.9 2.7 1,159
Source: World Bank EdStats
Figure B.11: Indonesia is one of the countries with the lowest expenditures in education among PISA participants
Source: World Bank EdStats and PISA 2015 (OECD, 2016)
Low expenditure in ECED signals a problem with budgetary allocation in Indonesia
Despite evidence indicating that high-quality ECED yields high returns on investment, government funds are limited. In 2017, funding for ECED accounted for only 0.12 percent of the central government’s budget for education. As a step to improve resources to ECED, a local transfer for operational costs of ECED services (BoP PAUD/Bantuan Operasional PAUD) was introduced in 2015. The transfer aimed to address the insufficient financial resources for ECED operational activities. For 2018, about IDR 4 trillion from the BoP program will be transferred to local governments to cover approximately 6.7 million children enrolled in registered ECED services, with a unit cost of IDR 600,000 per ECED student.
Indonesia may not be prioritizing the most important expenditures
The education budget in Indonesia has increased dramatically over the past fifteen years. This has led to only limited improvements in student learning, but also expanded student enrollment. Furthermore, there are important sectors within education, like ECED, that have not benefited from the expansion and this may have a negative effect on the education performance in basic education and beyond.
Portugal
United Arab Emirates
France
Italy
Australia
Germany
United Kingdom
Slovenia
Malta
NetherlandsIreland
Finland
Denmark
Iceland
Sweden
United States
Slovak Republic
Belgium
Austria
Poland
Estonia
Spain
NorwayNew Zealand
Israel
Switzerland
Georgia
Indonesia
Peru
Jordan
Dominican Republic
Moldova
Albania
Mexico
RomaniaColombia
Bulgaria
Brazil
Chile
ThailandCosta Rica
HungaryLithuania
Czech RepublicLatvia
Korea
Singapore
Hong KongJapan
Vietnam
350
370
390
410
430
450
470
490
510
530
550
0 2,000 4,000 6,000 8,000 10,000 12,000 14,000 16,000Ave
rage
PIS
A 2
015
Rea
ding
Sco
re
Public expenditure per student (constant 2013 PPP$)
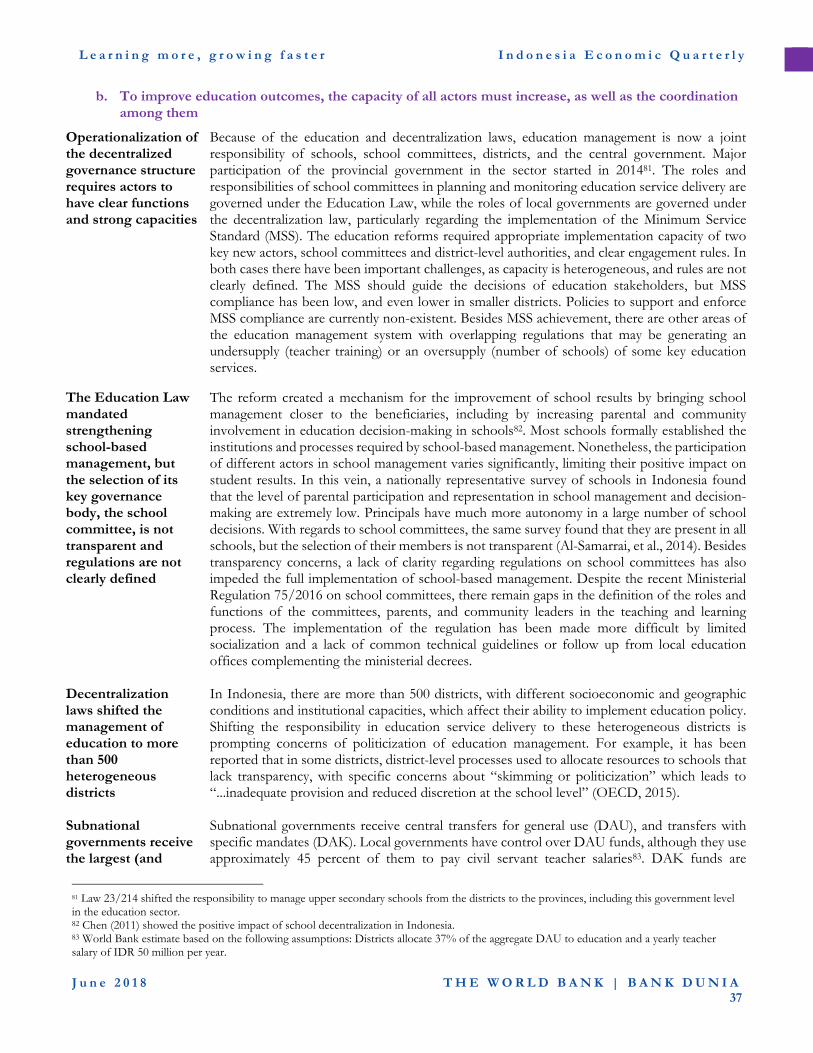
L e a r n i n g m o r e , g r o w i n g f a s t e r I n d o n e s i a E c o n o m i c Q u a r t e r l y
J u n e 2 0 1 8 T H E W O R L D B A N K | B A N K D U N I A
37
b. To improve education outcomes, the capacity of all actors must increase, as well as the coordination among them
Operationalization of the decentralized governance structure requires actors to have clear functions and strong capacities
Because of the education and decentralization laws, education management is now a joint responsibility of schools, school committees, districts, and the central government. Major participation of the provincial government in the sector started in 201481. The roles and responsibilities of school committees in planning and monitoring education service delivery are governed under the Education Law, while the roles of local governments are governed under the decentralization law, particularly regarding the implementation of the Minimum Service Standard (MSS). The education reforms required appropriate implementation capacity of two key new actors, school committees and district-level authorities, and clear engagement rules. In both cases there have been important challenges, as capacity is heterogeneous, and rules are not clearly defined. The MSS should guide the decisions of education stakeholders, but MSS compliance has been low, and even lower in smaller districts. Policies to support and enforce MSS compliance are currently non-existent. Besides MSS achievement, there are other areas of the education management system with overlapping regulations that may be generating an undersupply (teacher training) or an oversupply (number of schools) of some key education services.
The Education Law mandated strengthening school-based management, but the selection of its key governance body, the school committee, is not transparent and regulations are not clearly defined
The reform created a mechanism for the improvement of school results by bringing school management closer to the beneficiaries, including by increasing parental and community involvement in education decision-making in schools82. Most schools formally established the institutions and processes required by school-based management. Nonetheless, the participation of different actors in school management varies significantly, limiting their positive impact on student results. In this vein, a nationally representative survey of schools in Indonesia found that the level of parental participation and representation in school management and decision-making are extremely low. Principals have much more autonomy in a large number of school decisions. With regards to school committees, the same survey found that they are present in all schools, but the selection of their members is not transparent (Al-Samarrai, et al., 2014). Besides transparency concerns, a lack of clarity regarding regulations on school committees has also impeded the full implementation of school-based management. Despite the recent Ministerial Regulation 75/2016 on school committees, there remain gaps in the definition of the roles and functions of the committees, parents, and community leaders in the teaching and learning process. The implementation of the regulation has been made more difficult by limited socialization and a lack of common technical guidelines or follow up from local education offices complementing the ministerial decrees.
Decentralization laws shifted the management of education to more than 500 heterogeneous districts
In Indonesia, there are more than 500 districts, with different socioeconomic and geographic conditions and institutional capacities, which affect their ability to implement education policy. Shifting the responsibility in education service delivery to these heterogeneous districts is prompting concerns of politicization of education management. For example, it has been reported that in some districts, district-level processes used to allocate resources to schools that lack transparency, with specific concerns about “skimming or politicization” which leads to “...inadequate provision and reduced discretion at the school level” (OECD, 2015).
Subnational governments receive the largest (and
Subnational governments receive central transfers for general use (DAU), and transfers with specific mandates (DAK). Local governments have control over DAU funds, although they use approximately 45 percent of them to pay civil servant teacher salaries83. DAK funds are
81 Law 23/214 shifted the responsibility to manage upper secondary schools from the districts to the provinces, including this government level in the education sector. 82 Chen (2011) showed the positive impact of school decentralization in Indonesia. 83 World Bank estimate based on the following assumptions: Districts allocate 37% of the aggregate DAU to education and a yearly teacher salary of IDR 50 million per year.

L e a r n i n g m o r e , g r o w i n g f a s t e r I n d o n e s i a E c o n o m i c Q u a r t e r l y
J u n e 2 0 1 8 T H E W O R L D B A N K | B A N K D U N I A
38
growing) share of the education budget
earmarked for funding the BOS, teacher professional allowances (TPG), and some school infrastructure. Total transfers to local government increased by 25 percent in real terms between 2011 and 2017, while the National Education Budget increased only by 16 percent during that time. The largest increase in funding was observed in the DAK (84 percent) while the DAU increased 11 percent.
Subnational governments make their own budgets with available funds, deciding on how much to allocate to education based on their priorities
DAU, DAK and other transfers are complemented by the subnational governments’ own revenues. DAU and local resources are used to pay civil servant teacher salaries84, and other local education expenses (including contract teachers). In 2017, DAU and DAK transfers from the national budget to local governments were IDR 253 trillion, of which 42 percent represented DAK earmarked transfers, and 58 percent represented DAU funds85. Of the DAU resources, an estimated 45 percent was used to pay civil servant teacher salaries, and the remaining 55 percent was used for other local education expenses (Table B.4). There is incomplete information on the amount of resources allocated by local governments to education from their own revenues.
Table B.4: Estimated distribution of APBN by province size (total in trillion IDR)
DAU DAK TOTAL
Payment PNS
salaries Other local education
expenses
Large (5 provinces) 29.6 23.5 53.8 106.9 Medium (8 provinces) 19.7 16.3 25.7 58.7 Small (21 provinces) 19.8 41.3 26.6 87.7 Total 65.9 81.1 106.2 253.3 Per student (million IDR)
DAU DAK TOTAL
Payment PNS
salaries Other local education
expenses
Large (5 provinces) 1.2 1.0 2.3 4.5 Medium (8 provinces) 1.5 1.5 2.3 5.3 Small (21 provinces) 1.9 3.9 2.5 8.4 Average 1.5 1.8 2.3 5.6
Source APBD. Student estimates from SUSENAS Notes: DAU are central transfers for general use; DAK are transfers with specific mandates. Large provinces have more than 2 million students. Medium provinces have between 1 and 2 million students. Small provinces have fewer than 1 million students. For estimation, it is assumed that 37 percent of the aggregate DAU resources at the provincial level are allocated to education. Provincial information includes aggregated information from district level data.
DAU formula favors smaller provinces, resulting in significant differences in per-student resources
About 23 percent of students in basic education live in districts in small provinces, which receive, including provincial and district budget allocations, about 41 percent of the total national resources allocated to the subnational level. In 2017, the average per-student budgeted resources in small provinces was IDR 8.4 million, while per-student budgeted resources in large provinces was IDR 4.5 million. Larger differences are on other local education expenses; small provinces budgeted IDR 3.9 million per student, while large provinces budgeted IDR 1.0 million, almost a 4-to-1 ratio.
There is not enough information in the use of resources controlled by districts
Despite recent improvements in data collection from local governments by the Ministry of Finance, there remains significant information gaps on the use of resources by local governments. There is some information indicating that local governments implement, among the other local education expenses, local BOS type programs, called BOSDA, and programs to improve teacher quality, but there is no evidence of their efficiency. Better monitoring systems should be developed and implemented to assess the use of resources on these other local education expenses. The design of those mechanisms should consider the low capacity of many
84 The pay scale is set by civil service rules. 85 According to MOF, 37 percent of the DAU is allocated to education.

L e a r n i n g m o r e , g r o w i n g f a s t e r I n d o n e s i a E c o n o m i c Q u a r t e r l y
J u n e 2 0 1 8 T H E W O R L D B A N K | B A N K D U N I A
39
districts across Indonesia, and in particular the lower capacity of the smaller districts. In comparison to the DAU, there is more information on the use of DAK funds. The main DAK transfers, BOS and TPG, have been subject to significant research in the past, and the result of that research, to be presented below, shows that their objectives have only been partially met.
BOS has helped in the expansion of basic education, but several factors have limited its impact on education quality
For example, a ten-year evaluation of the BOS program by Al-Samarrai, et al. (2014) found that although the introduction of the BOS program led to an initial reduction in private spending in education, especially among poorer students, and contributed to the increase in junior secondary enrolment amongst poor households, the use of BOS was not strongly linked to education outcomes, as many schools use BOS funds to hire contract teachers86. School committees had little influence on the use of BOS and therefore little impact on education quality. Districts also received little support in the implementation of the BOS program. These factors have impeded the BOS program in reaching its objectives.
Although TPG funds linked to teacher certification increased teacher welfare, rigorous evaluations concluded that these funds had no impact on student achievement
According to the mandate of the Teacher and Lecturer Law, certified teachers who fulfill minimum teacher requirements are entitled to an allowance (TPG) e. Currently, the government pays teacher professional allowances to 1.6 million teachers, and the total projected funding for the TPG amounts to IDR 58.5 trillion for 2018 or about 13 percent of the total education budget. Currently, there are 0.8 million teachers eligible for certification, and, if they were to be certified, this will require an increase in TPG expenditures of 50 percent. Teacher certification was intended to improve teacher qualifications, with the parallel objective of improving teacher salaries. However, the incentives implicit in these two objectives were misaligned, leading to political and economic interference that has delayed the reform process and, particularly in the first few years, to a lowering of certification requirements (Chang, et al, 2014). An evaluation of the certification program in 2012 (de Ree et al., 2017) found that student scores had not increased, but teacher welfare had, as shown, for example, by teachers quitting their second jobs. In 2012 and in 2018, the certification procedure changed (discussed below), and the impact of this new mechanism on student learning has not been assessed.
Further collaboration between school and districts is needed to maximize the impact of resources in education
Several districts are implementing their own locally-initiated education programs, but it is necessary to create synergies between those programs and the programs financed by the DAKs to maximize results. Existing data show that schools in districts with larger amounts of resources, allocate less BOS funds to pay contract teachers, indicating possible support by the districts to those schools that favor using BOS funds to pay for activities directly linked to learning. Additionally, there is a growing number of districts launching their own BOS-type programs, or BOSDA, and districts are sometimes instructing their schools to implement joint planning of BOS and BOSDA resources in an effort to maximize their impact. In some cases, like Surabaya and DKI Jakarta, districts support joint planning, providing schools with planning tools, such as the e-RKAS (Rencana Kerja dan Anggaran Sekolah berbasis Elektronik/Electronic-based School Planning and Budgeting).
MSS have been established to guide the provision of education services;
The Decentralization Law establishes that the management of basic education is a responsibility of districts, under the guidance of the MSS established by the central government87. There are 44 MSSs, and the relationship with student learning of some indicators is yet to be tested. The mechanisms to monitor MSS compliance are weak, with many relying on self-reporting. The
86 Evidence shows that contract teachers have less content mastery than civil servant teachers (Figure B.19) 87 MSS were established first by Government Regulation No. 65/2005. In the education sector, they were updated by Permendikbud 23/2013. Currently, there are 44 MSS in the education sector, of which 4 MSS are district-level indicators and 40 are school-level indicators. Some MSSs are linked to school-level decisions to use resources, such as decisions about the use of BOS (for example, MSS on the availability of textbooks and other education material in the school), or district-level decisions about the district budget (for example, MSS on the availability of classes for each student group within the school). Other MSS are linked to processes at the school level (for example, MSS on teachers submitting reports to the principal on student results each semester), or at the district level (for example, MSS on visits of school supervisors to school).

L e a r n i n g m o r e , g r o w i n g f a s t e r I n d o n e s i a E c o n o m i c Q u a r t e r l y
J u n e 2 0 1 8 T H E W O R L D B A N K | B A N K D U N I A
40
however, in many cases, they are not met
overall compliance of MSS is therefore low. The law does not establish sanctions for failure to achieve the MSS, and does not generate strong incentives among service providers to prioritize its achievement.
Smaller districts tend to have low capacity for education governance
In 2009 and 2012, the World Bank surveyed 50 districts across Indonesia to investigate differences in their capacity to manage the education system. The study constructed an Indonesian Local Education Governance Index (ILEG), which included several important areas of education governance88 (Al-Samarrai, et al., 2013), and showed important differences in the ILEG across participating districts, with some districts achieving very low scores in all the dimensions of the ILEG (Figure B.12). Determinants of low ILEG, among others, are socioeconomic conditions, and, in general, population seizes of school-aged children. Districts with a smaller school-age population tend to have lower ILEG. Efforts to increase local government capacity should focus especially on these smaller districts, particularly given that smaller districts receive larger resources per capita, and per student (discussed above).
Despite having larger resources, smaller districts face more challenges to fulfill the MSS
At the district-level, the MSS defines facilities and infrastructure (for primary and junior secondary level), education personnel, and curriculum. With regards to facilities, all districts in Indonesia fulfill the MSS that mandates the existence of a school in all geographical areas. However, only 70 percent of districts fulfill the MSS on education personnel. With regards to the MSS related to curriculum implementation, 67 percent of districts fulfill it (Figure B.13). For the MSS on education personnel and curriculum, districts located in smaller provinces have lower levels of MSS compliance than districts located in larger provinces, signaling the greater challenges faced by smaller districts. At the school level, there are 40 MSS89. As in the case of district level MSS, larger implementation challenges of school-level MSS are found in smaller districts.
Figure B.12: Smaller districts tend to have low capacity to manage the education system (local education governance index; school population)
Figure B.13: Most districts do not fulfill all MSS, with larger gaps in facilities and infrastructure MSS at the school level, signaling poor school conditions (percent)
Source: Al-Samarrai, et al (2013) and DAPODIK Note: Possible scores for the ILEG index range from 0 to 100. No schools received scores higher than 75. Scores below 45 are classified as low performance, 45–60 as average performance, and above 60 percent as high performance
Source: MSS monitoring system
88 The areas analyzed were: transparency and accountability, education service provision standards, management of control systems, management of information systems, and efficient use of resources. 89 On school-level MSS, the largest challenges on achievement related to facilities and infrastructure, educator and education personnel, and quality assurance. On average, districts in larger provinces have a higher rate of achievement of school-level MSS.
30
40
50
60
70
0 50,000 100,000 150,000 200,000 250,000 0 20 40 60 80 100
School management
Education assessment
Quality of education…
Curriculum
Educator and education…
Facilities and infrastructure
Curriculum
Educator and education…
Facilities and infrastructure
Sch
ool
Dis
tric
t

L e a r n i n g m o r e , g r o w i n g f a s t e r I n d o n e s i a E c o n o m i c Q u a r t e r l y
J u n e 2 0 1 8 T H E W O R L D B A N K | B A N K D U N I A
41
ECED and upper secondary have operated without MSS
The MSS for ECED and senior secondary were established only recently90. Despite this improvement, the MSS indicators for ECED and upper secondary are not yet detailed enough to guide an effective provision of education services at those levels, and campaigns to raise awareness on the new MSS at the district and provinces have not been launched.
Along with MSS implementation challenges, the current institutional framework has also generated coordination gaps among actors in education governance
Coordination failures are affecting key processes in the education sector, such as teacher training and quality controls mechanisms in schools. First, effective teacher training, one of the crucial factors for improving teacher quality, has not been clearly mandated as a responsibility of central or local governments. Despite the mixed results of the impact of teacher training on teacher quality and student learning, research shows that teacher training, if implemented effectively, can significantly contribute to improved student outcomes (Popova, et al., 2016). Unfortunately, in Indonesia, teacher training has not been precisely defined as a responsibility of either central or local governments. Without a clear mandate, district-level financing of teacher training is heterogeneous and dependent on local governments’ priorities. Second, different actors intervene in the quality control mechanism in schools, with regulations that are not aligned. To start operating formally, and to be eligible for government funds, schools need to be licensed by the district. Once licensed, schools receive BOS transfers per student, with a minimum transfer equivalent to the enrollment of 60 students, even if the actual student population is lower. Then, schools have to go through the accredited process. However, school accreditation standards and the MSS are misaligned, as the share of schools that achieve accreditation is larger than the schools that achieve the minimum standards (OECD, 2015).
Minimum BOS allocation based on school size may be generating perverse incentives
For school administrators, it is relatively easy to open and license new schools, and they become automatically eligible to receive BOS resources. According to DAPODIK (Data Pokok Pendidikan/MOEC’s Education Database), more than 1,200 schools were created in Indonesia between 2016 and 2017. Most of these are small schools located in rural areas. New schools can have an important role in increasing school enrollment, but can also reduce existing school sizes to non-optimal levels (Figure B.14). In recent years, there has been a reduction in school sizes as new schools appear. As Indonesia moves forward, licensing mechanisms should be improved, to guarantee that schools are opened where needed and satisfy minimum standards.
Figure B.14: As new schools appear, the average school size in the district decreases (change in average number of students; new schools as a percentage of total)
Source World Bank estimates based on DAPODIK.
Some promising interventions are improving local capacity…
Besides the new regulation on MSS, several initiatives have been implemented to improve education sector management at the local level. To improve school-level management, several districts are implementing a web-based platform to improve the use of BOS resources, and some initiatives have been launched to increase capacity at the local level, including the Basic Education Capacity Development (BEC) Project, the Minimum Service Standards Capacity Development (MSSCD) Program, Prioritizing Reform, Innovation, and Opportunities for
90 Government Regulation 2/2018, which will be effectively implemented in January 2019.
-40
-20
020
40C
HA
NG
E IN
AV
ER
AG
E N
UM
BE
R S
TU
DE
NT
S
0 .05 .1 .15 .2NEW SCHOOLS AS PERCENTAGE OF TOTAL

L e a r n i n g m o r e , g r o w i n g f a s t e r I n d o n e s i a E c o n o m i c Q u a r t e r l y
J u n e 2 0 1 8 T H E W O R L D B A N K | B A N K D U N I A
42
Reaching Indonesia’s Teachers, Administration, and Students (PRIORITAS), and Innovation for Indonesia’s School Children (INOVASI)91.
…but adequate monitoring is needed to guarantee good results
In 2014, MOEC launched DAPODIK, a web-based platform that collects information on teachers, students and school characteristics, allowing for direct monitoring of the achievement of some MSS. DAPODIK is accessible to schools, districts, provinces, and the central government. MOEC is evaluating adding variables to this information system and designing strategies to improve its accuracy to support the management of the sector. The potential of DAPODIK to support improvements in education sector management is enormous, as evidenced when the platform enabled MOEC to identify smaller schools that should be merged with larger ones to improve efficiency.
Special attention should be allocated to the smallest districts, as in aggregate they manage most of the education resources
Improvements by the central government on efficiently using BOS and TPG funds should be matched with complementary actions by districts, particularly in districts with the largest amount of resources for education. The effectiveness and efficiency of districts’ education spending should be monitored, especially in smaller districts, where managerial capacity tends to be lower, to ensure that the largest share of the education budget is used more efficiently. This will require hiring of qualified, motivated staff in district education, along with investments in capacity building and in information sharing with districts that have achieved higher levels of learning with similar students.
c. Major challenges were registered in the management of teachers and in the implementation of the national exam.
Enrollment growth was accompanied by an increase in the number of teachers but had limited impact on student learning
Currently, Indonesia has 2.7 million teachers in general education and another 0.7 million in the religious education system92. Between 2003 and 2015, the number of teachers grew 30 percent, while the number of students increased by 25 percent, leading to decreases in student–teacher ratios. Due to the surge in the number of teachers, along with significant increases in expenditures in teacher allowances, the teacher wage bill grew significantly during the period. Currently, overall teacher compensation93 represents over 50 percent of the general education budget. However, the increase in the number of teachers and their compensation were not accompanied by a significant increase in student learning outcomes. The Teacher Law was an attempt to improve student learning outcomes by focusing on teacher quality. The Law, aimed at improving teacher qualifications, mandated a university degree and teacher certification to upskill teacher competencies, before they were eligible for TPG. As a result, the share of teachers with the minimum bachelor’s degree increased from 37 percent in 2003 to 90 percent in 2016 (Figure B.15). With regards to teacher certification, in 2018, approximately 50 percent of the teachers in Indonesia are certified, 17 percent are eligible for certification, and 30 percent are not eligible for certification94 (Figure B.16).
91 Basic Education Capacity Development Project was implemented by MOEC with the support of the WB, between 2009 and 2012; and the Minimum Service Standards Capacity Development Program was implemented by the MOEC with the support of the ADB, between 2013 and 2017. In both cases, districts received block grants to improve their capacity. PRIORITAS program had the support of USAID, and INNOVASI has the support of the Department of Foreign Affairs and Trade from the Australian Government. 92 http://jendela.data.kemdikbud.go.id/jendela/ & Statistics of Islamic Education 2015/2016 93 Including base salary and allowances. 94 Teachers may not be eligible due to incomplete academic qualifications

L e a r n i n g m o r e , g r o w i n g f a s t e r I n d o n e s i a E c o n o m i c Q u a r t e r l y
J u n e 2 0 1 8 T H E W O R L D B A N K | B A N K D U N I A
43
Figure B.15: Most teachers have bachelor university degrees (S1) (percent)
Figure B.16: Half of general education teachers are certified, and significant number of non-certified teachers are also eligible for certification (share of MOEC teachers, percent)
Source: Teacher census (2006) and DAPODIK (2016) Note: S1 denotes bachelor degree. PNS and non PNS refer to civil servant and non-civil servant status of teachers.
Source: DAPODIK (2017) and Iskandar (forthcoming)
Despite the professionalization efforts, evidence shows that teacher mastery of competencies remains low
Multiple studies show that Indonesian teachers need to improve content mastery and pedagogical practice. In 2015, MOEC tested all school teachers, and their results show that on a 100-point scale, the average score was 53. Test results varied little, regardless of the certification status of teachers. With regards to teacher practices in the classroom, a video study found that teachers in Indonesia lack basic pedagogical competencies: Indonesian teachers rarely pose strategic and open-ended questions that require complex and specific student responses that would demonstrate student understanding. The video study showed that close to 90 percent of the students observed responded to teacher questions using only a single word – a consequence of teachers having weak pedagogical practices (Ragatz, et al., 2015).
The intended impact of the Teacher Law was limited by many factors including, politics…
Political factors interfered with the definition of teacher competency. From the onset of the Law, there were important differences between the policy intent of MOEC, and the objectives of teachers’ unions on how to measure teacher competency for certification. The majority of Parliament agreed that competency was to be measured through the submission of a teacher’s portfolio95 (documents of teacher’s work achievement and experience). Those teachers whose portfolios were not approved had to take a 90-hour training program and then pass a test, which most teachers passed. As a result, “the process of certifying teachers was not strongly linked to demonstrated competencies in either subject content or pedagogical skill” (Chang, et al., 2014). An evaluation of the initial teacher certification mechanism showed no impact of teacher certification on student learning (de Ree et al., 2017).
95 A teacher portfolio is a set of documents/evidences describing a teacher’s work achievement and experience. For example: teacher’s graduate diploma(s), performance evaluation from supervisors, scientific journal submission, etc.
0
10
20
30
40
50
60
70
80
90
100
PNS Non PNS PNS Non PNS
2006 2016
Below S1 S1 and above
Certified53%
Eligible17%
Not eligible
30%
Not certified
47%
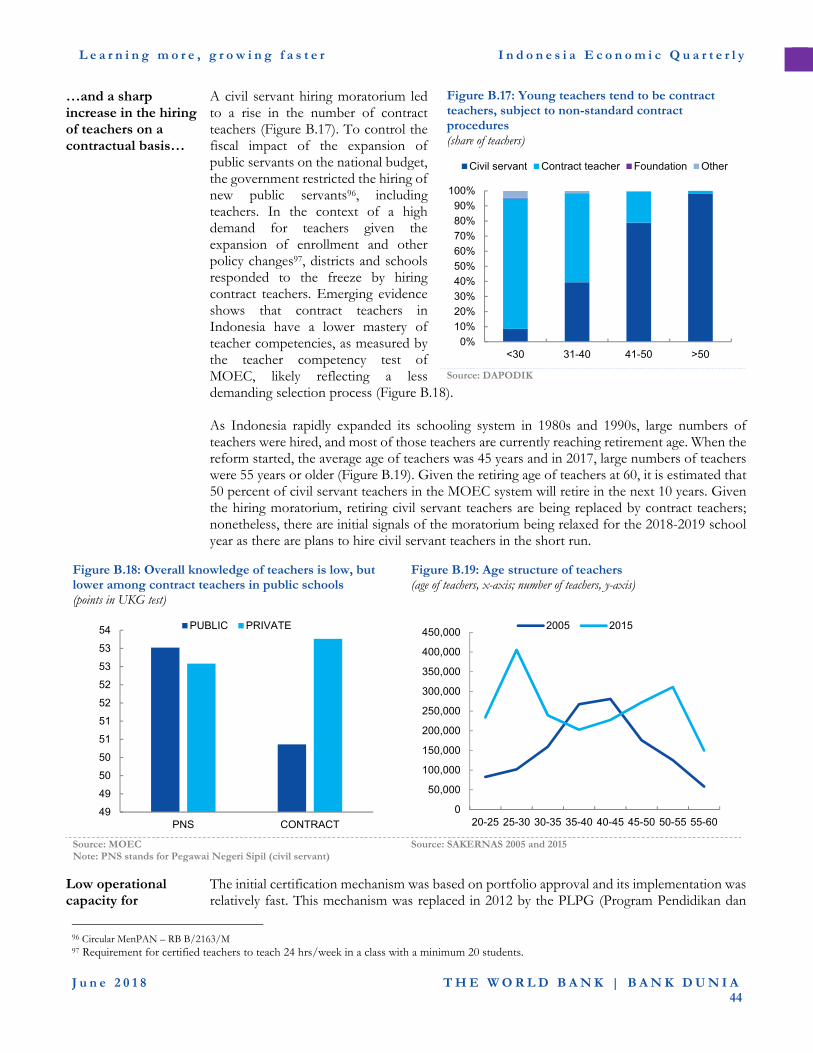
L e a r n i n g m o r e , g r o w i n g f a s t e r I n d o n e s i a E c o n o m i c Q u a r t e r l y
J u n e 2 0 1 8 T H E W O R L D B A N K | B A N K D U N I A
44
…and a sharp increase in the hiring of teachers on a contractual basis…
A civil servant hiring moratorium led to a rise in the number of contract teachers (Figure B.17). To control the fiscal impact of the expansion of public servants on the national budget, the government restricted the hiring of new public servants96, including teachers. In the context of a high demand for teachers given the expansion of enrollment and other policy changes97, districts and schools responded to the freeze by hiring contract teachers. Emerging evidence shows that contract teachers in Indonesia have a lower mastery of teacher competencies, as measured by the teacher competency test of MOEC, likely reflecting a less demanding selection process (Figure B.18). As Indonesia rapidly expanded its schooling system in 1980s and 1990s, large numbers of teachers were hired, and most of those teachers are currently reaching retirement age. When the reform started, the average age of teachers was 45 years and in 2017, large numbers of teachers were 55 years or older (Figure B.19). Given the retiring age of teachers at 60, it is estimated that 50 percent of civil servant teachers in the MOEC system will retire in the next 10 years. Given the hiring moratorium, retiring civil servant teachers are being replaced by contract teachers; nonetheless, there are initial signals of the moratorium being relaxed for the 2018-2019 school year as there are plans to hire civil servant teachers in the short run.
Figure B.17: Young teachers tend to be contract teachers, subject to non-standard contract procedures (share of teachers)
Source: DAPODIK
Figure B.18: Overall knowledge of teachers is low, but lower among contract teachers in public schools (points in UKG test)
Figure B.19: Age structure of teachers (age of teachers, x-axis; number of teachers, y-axis)
Source: MOEC Note: PNS stands for Pegawai Negeri Sipil (civil servant)
Source: SAKERNAS 2005 and 2015
Low operational capacity for
The initial certification mechanism was based on portfolio approval and its implementation was relatively fast. This mechanism was replaced in 2012 by the PLPG (Program Pendidikan dan
96 Circular MenPAN – RB B/2163/M 97 Requirement for certified teachers to teach 24 hrs/week in a class with a minimum 20 students.
49
49
50
50
51
51
52
52
53
53
54
PNS CONTRACT
PUBLIC PRIVATE
0
50,000
100,000
150,000
200,000
250,000
300,000
350,000
400,000
450,000
20-25 25-30 30-35 35-40 40-45 45-50 50-55 55-60
2005 2015
0%
10%
20%
30%
40%
50%
60%
70%
80%
90%
100%
<30 31-40 41-50 >50
Civil servant Contract teacher Foundation Other

L e a r n i n g m o r e , g r o w i n g f a s t e r I n d o n e s i a E c o n o m i c Q u a r t e r l y
J u n e 2 0 1 8 T H E W O R L D B A N K | B A N K D U N I A
45
certification also limited the efficacy of the Teacher Law…
Pelatihan Guru/certification training) model, which required a 90-hour teacher training course. In 2018, the PLPG model was replaced by the PPG (Pendidikan Profesi Guru/new certification training) model, which requires one year of training for new teachers, and 6 months of training for existing teachers. The more demanding procedure was not met with adequate capacity by the institutions to provide certification, resulting in a small number of newly certified teachers, particularly in specific subjects such as physical education. As Indonesia moves forward, and, in line with international evidence, Indonesia should introduce agile mechanisms to re-certify teachers.
…along with an excessive number of teachers which created a challenge in implementing quality improvement measures
Indonesia has a student–teacher ratio of 1 teacher to 17 students. This is lower than most countries with similar socioeconomic conditions, and the ratio has been declining since 2005. As teachers’ salaries are the main education expenditure, low student–teacher ratios significantly reduce the amount of resources available for other quality improving factors. Low student–teacher ratios in Indonesia are partially explained by the large number of small schools, and by inadequate policies on teacher deployment by certain schools and districts, and the proliferation of contract teachers, sometimes hired because of personal relationships rather than merit or need.
Impact of small schools on student-teacher ratios
The smaller schools in Indonesia have a student-teacher ratio of 10 to 1, while the larger schools have a student–teacher ratio of 27 to 1. The smaller schools have on average 11 students per class versus 34 students per class in larger schools, while the number of teachers per class is similar, 1.3 in both cases (Table B.5). The large number of teachers are taking resources from other avenues to improve student learning. Policies to improve student teacher ratios will need to limit the number of schools with small classes, and introduce innovative mechanisms to maximize the use of the existing teaching force such as using the same teachers for multiple grades or multiple subjects98.
Table B.5: Classes, teachers, and students – Primary education by school size
DECILE STUDENTS CLASSES TEACHERS STUDENTS PER
TEACHER STUDENTS PER
CLASS TEACHERS PER
CLASS
1 63.2 5.9 7.4 9.7 10.8 1.3 2 108.5 6 8.3 14.3 18.1 1.4 3 136.6 6.1 8.6 17.2 22.6 1.4 4 163.8 6.3 9 19.7 26.2 1.4 5 193.7 6.9 9.7 21.7 28.6 1.4 6 229 8.2 10.9 23 29 1.3 7 278.4 10.2 13.1 23.5 28.4 1.3 8 350.2 12.1 15.6 24.5 29.6 1.3 9 462.7 14.9 19.5 25.9 31.8 1.3 10 738.1 22.4 29.5 27 33.5 1.3
Source: World Bank estimates based on DAPODIK
Besides small schools, student–teacher ratios are affected by weak application of overall guidelines to
MOEC governs the minimum number of teachers required by schools for each subject99. Although this regulation has been implemented since 2013, in practice many districts are still struggling to fulfill the requirements. Some districts are undersupplied or oversupplied in specific subjects, which results in too many or too few teachers in a given school. A recent study on Effective Teacher Deployment (Kesuma, et al., forthcoming) in 13 districts, found that only 3 districts have managed teacher shortfalls by hiring temporary teachers based on local government regulations to ensure that they recruit qualified and competent teachers. The
98 Multi-grade and multi-subject are alternative mechanism to provide education services. Multi-grade refers to schools in which in one classroom has different grades under a single teacher. Multi-subject refers to a single teacher delivering different subjects, usually in secondary education. 99 Regulation Permendikbud 23/2013 states that states that each primary school must have one classroom teacher per learning group, one physical education teacher, and one religion teacher. Also, each junior secondary school must have a certified teacher for Mathematics, Science, Bahasa, English, and PKN.
L e a r n i n g m o r e , g r o w i n g f a s t e r I n d o n e s i a E c o n o m i c Q u a r t e r l y
J u n e 2 0 1 8 T H E W O R L D B A N K | B A N K D U N I A
46
manage the number of teachers
remaining 10 districts allow local schools to manage the situation themselves. Schools in the 10 sampled districts have responded in a variety of ways, including hiring non-civil service teachers using a diverse range of selection processes and criteria, paying such teachers using national BOS and school committee funds, exchanging teachers with other schools, as needed, assigning retired teachers for little or no payment, and even temporarily hiring parents to teach subjects such as religious studies. These practices are likely to affect the quality of student learning.
MOEC has launched several initiatives to improve teacher quality
Besides the new procedures for certification, MOEC has launched several other initiatives aimed at improving teacher quality. To monitor teacher quality and design interventions, MOEC started implementing the UKG (Uji Kompetensi Guru), or teacher competency exam, in 2012. MOEC is also implementing the PKG (Penilaian Kinerja Guru) or teacher performance appraisal, as well as the PKB (Pengembangan Keprofesian Berkelanjutan) or continuous professional development program. MOEC has also improved competency standards in line with a teacher’s career status (novice, junior, senior, and master teacher). Additionally, MOEC with the support of the World Bank has launched Kiat Guru, a pilot program that links teacher pay with teacher performance. The results of the Kiat Guru rural pilot will be available in mid-2018 (Box B.2).
Including initiatives to increase ECED teacher competencies
ECED teachers also face challenges in accessing programs that would enhance their teaching competency, especially those in ECED services different from kindergarten. To address the problem, MOEC has launched the “Diklat Berjenjang”100 program that provides training for ECED teachers, notably those in the poorest and most remote areas. The World Bank ECED Frontline Pilot in 2016 and 2017 facilitated this program by supporting a district-based and community-focused training system to improve access for ECED teachers to a quality training and professional development program. During the pilot in 25 districts, the program trained 15,000 community teachers from 2,500 villages. Preliminary findings of the evaluation of the first year of the program indicated that teachers who participated in the basic training program showed modest improvement in their teaching practices across 20 items as measured using the Measuring Early Learning Environment (MELE). MELE covers various domains, such as: teacher–child interactions, inclusive environment, curriculum and program, language and literacy, numeracy/mathematics, art activities and group games, as well as free choice indoor play.
Box B.2: KIAT Guru: Improving Teacher Performance and Accountability through Citizen Engagement and Performance-based Pay101
KIAT Guru, which stands for Teacher Performance and Accountability, is a pilot program that aims to improve teacher presence, service performance, and student learning outcomes in remote areas of Indonesia. In such areas, teachers are absent from school 19 percent of the time compared to 9 percent nationally, and students continue to lag in international test rankings. A key feature of KIAT Guru is that it empowers communities, including parents, to hold teachers accountable and ties the payment of the Remote Area Allowance (double the base salary) to teacher service performance. It does so by having community members verify (i) teacher presence using an Android-based application, and (ii) service delivery performance through community-led, scorecard-based evaluations. Since the pilot was launched in 2016, monitoring results indicate that teacher absenteeism from classrooms has fallen from 25 percent to 13 percent and community satisfaction of teacher service delivery performance, as measured by scorecards, improved from 56 percent to 93 percent. The World Bank will conduct a rigorous impact evaluation in mid-2018 to compare the results against a control group. MOEC has requested a new KIAT Guru urban pilot to identify mechanisms for payment of the TPG linked to teacher performance, on which the GoI spends around USD 6 billion annually.
100 Diklat Berjenjang has been named as a winner of the 2017–2018 UNESCO-Hamdan bin Rashid Al-Maktoum Prize, together with 2 other programs (Chile and UK) designed to empower teachers. https://en.unesco.org/teachers/hamdan-prize/2018 101 More information on KIAT GURU: http://projects.worldbank.org/P159191/?lang=en&tab=map

L e a r n i n g m o r e , g r o w i n g f a s t e r I n d o n e s i a E c o n o m i c Q u a r t e r l y
J u n e 2 0 1 8 T H E W O R L D B A N K | B A N K D U N I A
47
Further actions to improve teacher quality require active local government participation
On average, local governments invest little of their resources on teacher-related policies. But evidence shows that that some local governments use their resources to finance scholarships for teachers, to help them get a university degree (Iskandar, forthcoming). Other districts, sometimes working through school clusters (gugus), provide in-service resources to improve content knowledge and practice.
The reform also raised the importance for monitoring student performance
Indonesia has a long history of student assessment through national tests. The Education Law and related regulations102 added several new functions to the national exam103, including the mapping of learning achievements, serving as one of graduation criteria, and selecting students for competitive admission into the next level of education. The results of the national test are also provided to schools with the aim to support improvement in teaching and learning (Cislowski, 2010). Several of these new functions increase the consequences of the high stakes of the assessments.
The use of the national exam to monitor student performance has generated pressures to perform well at the end of the school year
Using students’ test-survey data in 240 primary schools in 20 districts, Afkar, et al. (forthcoming) found there was a notable catching-up effect towards 6th grade in primary schools when schools, teachers, and students were preparing for the national exams. While about 50 percent of the 4th graders could not arrange four-digit numbers from big to small, 60 percent of the 6th graders could calculate the volume of a rectangular cuboid. This finding suggests that about 20 percent of the 50 percent of students who could not arrange numbers at the end of 4th grade had caught up substantially in just 2 years’ time. This significant catching-up effect in learning in 6th grade may suggest that increased pressures on schools, teachers, and students to perform well on the high-stakes national exams might help to produce learning.
However, the pressure has also contributed to more malpractice and cheating
According to the OECD (2015), there have been problems in the administration of the National Examination, including inadequate security controls in the development, printing, and distribution of exam papers, the leaking of examination forms; and cheating by students during the exam, including student cheating with the aid of teachers and test supervisors. PUSPENDIK (Pusat Penilaian Pendidikan/Center for Educational Assessment), the testing agency of MOEC, has quantified, through statistical techniques, the extent of the cheating practices across schools, identifying many schools with low rankings in an Integrity Index104.
School examinations have now replaced the role of the national test to become a graduation criterion
In a recent MOEC regulation105, students can graduate if they have completed the curriculum, earned a qualification of “good” in attitude, and passed the school examination. The national exam is no longer one of the graduation criteria. The minimum score required to pass the school examination is defined by the school. This heterogenous criterion applied by schools could allow low-performing students to graduate and continue to the next level without mastering the required skills and competency.
Recent evolution of the National Exam shows a decreasing trend in test scores, but a rising level of integrity
National Exam results have registered a declining trend since 2015 (Figure B.20). This declining trend is likely due to, in part, a reduced interest from students, as the test now has a diminished role in grade promotion, and in part due to measures implemented by PUSPENDIK to increase the integrity of the examination, via initiatives such as the introduction of Computer-Based Testing. Initial results of computer-based testing in 2017 showed a significant decline in test scores in schools that had low levels of integrity in 2016, while test scores in schools with high levels of integrity remained relatively unchanged, signaling that in previous years, low integrity was creating distortions in the National Exam results (Figure B.21).
102 Permendikbud Regulation 19/2005 103 Student assessment tests in Indonesia started in the 1950s, with the “Ujian Penghabisan” (end of education examination), replaced by the “Ujian Negara” (country examination), and later by the “Evaluasi Belajar Tahap Tahap akhir” (evaluation of last stage) or EBTANAS, and by the “Ujian Akhir National” (National Final Exam). 104 The integrity index is developed using a cheating detection method that has been widely used (Hanson, et al., 1987). 105 Minister of Education and Culture Regulation no 4/2018

L e a r n i n g m o r e , g r o w i n g f a s t e r I n d o n e s i a E c o n o m i c Q u a r t e r l y
J u n e 2 0 1 8 T H E W O R L D B A N K | B A N K D U N I A
48
Figure B.20: Scores in the National Exam have decreased in recent years, as regulations changed and integrity was promoted (scores in national test by school type)
Figure B.21: New integrity promoting mechanisms are affecting the scores of schools that previously had lower levels of integrity (score in National Exam by integrity index in 2016)
Source: PUSPENDIK Source: Rahmawati, 2018
PUSPENDIK is expanding its assessment instruments to assess the evolution of education quality in Indonesia
In 2013, PUSPENDIK launched the Indonesian National Assessment Program or INAP. INAP is a mapping program that describes students’ skills and academic achievements, implemented through a nationally representative survey. INAP aims to monitor quality of education through 3 basic competencies in mathematics, science, and reading. INAP serves as a diagnostic tool to identify types of competencies that need improvement and factors influencing student learning. The INAP test is sample-based and is taken by students in the 4th, 8th, and 11th grades. PUSPENDIK can monitor INAP implementation more closely as the number of students and schools participating in the INAP is only a fraction of the total.
Summing up, the implementation of teacher reforms has had a large effect on the budget with
very small, if any, effect on improving human capital. Teachers are improving their credentials on paper and their wage package, but the impact on learning has been limited. Many new teachers have been joined the system due to increased enrollment, and more recently, due to a wave of retirement. Due to hiring restrictions, new teachers are often contract teachers, hiring under less rigorous quality assurance systems. The entrance of new teachers brings an opportunity for improving teacher quality, but that would require appropriate controls that are not yet in place. With regards to assessments, the reform raised their importance in managing the education system but negative practices appeared, affecting their reliability and limiting their use, leaving schools with little elements to assess students’ readiness to graduate. However, Indonesia is taking important corrective measures to improve student assessment and its uses and implementing complementary assessment systems. These actions, if implemented correctly, have strong potential to help the Indonesian education system achieve better learning outcomes.
0
10
20
30
40
50
60
70
Juniorsecondary
Seniorsecondary -
science
Seniorsecondary -
social
Vocationalschool
2015 2016 2017
0
10
20
30
40
50
60
70
Less than50
Between50 and 60
Between60 and 70
Between70 and 80
Higher than80
National Exam 2016
National Exam 2017

L e a r n i n g m o r e , g r o w i n g f a s t e r I n d o n e s i a E c o n o m i c Q u a r t e r l y
J u n e 2 0 1 8 T H E W O R L D B A N K | B A N K D U N I A
49
Box B.3: MORA Education and Challenges
MORA manages both formal and non-formal education for students of six different religions (Islam, Christianity, Catholicism, Konghucu, Hinduism, and Buddhism). There are more than 300,000 Islamic Education institutions under MORA, while the total number of education institutions for Christianity, Catholicism, Konghucu, Hinduism, and Buddhism are less than 1,000. Formal basic education using the national curriculum plus additional Islamic education is largely provided by madrasahs, while non-formal Islamic education is provided predominantly by esantren and iniyah with their own curriculum with a focus on religious learning. Education Law no 20/2003 established madrasahs as an integral part of the National Education System. From the mandated 20 percent rule, MORA received an allocation of IDR 52 trillion or 12 percent of the national education budget in 2018. This amount is intended to cover all madrasah and other religious education expenses, including operational and personnel costs. Similar to the general education system, there are three levels of madrasah education: MI (Madrasah Ibtidaiyah or equivalent with the primary level), MTS (Madrasah Tsanawiyah or equivalent with the junior secondary level), and MA (Madrasah Aliyah or equivalent with the senior secondary level). Madrasahs use the national curriculum with supplemental religious curricula. Unlike MOEC where schools are directly managed by local governments, the MORA system is centralized with education providers, such as madrasahs coming under direct supervision of MORA. Madrasah students account for 15 percent of the total enrolment, with a large proportion studying in private madrasahs. Of the 53 million students registered in the formal education system, 8 million are enrolled in madrasahs. Of the 49,000 madrasahs, 92 percent are private. Private madrasahs are usually run by foundations linked to mass Islamic organizations. Although managed and funded by foundations, private madrasahs are eligible to receive financial support from both central and local governments, for example through BOS, TPG, or financial support for infrastructure. The proportion of government funding for private madrasah is between 40 and 75 percent. The total amount of public financing is dependent on district or provincial government priorities and local understanding of regulations (ACDP, 2013). MORA has limited authority over private education institutions. Enforcement of government regulations is challenging in a context where private madrasahs are legally autonomous. For example, although the BOS program aims to cover the operational costs of madrasah to achieve MSS/NES and eventually to improve education quality, in practice, very little is known about how private madrasahs utilize the BOS funds. Gaps in infrastructure, management, and education personnel, especially in private madrasahs, limit the potential of the religious education system. Private madrasahs have a much higher percentage of damaged classrooms (39 percent) than public madrasahs (12 percent), and only 14 percent of private madrasahs are accredited ‘A,’ while more than half of public madrasahs have an ‘A’ accreditation. Furthermore, the number of teachers who do not have a bachelor’s degree is also much higher in private primary madrasahs than in public primary madrasahs (24 percent compared to 12 percent). Given the large proportion of private madrasahs, addressing these challenges has the potential to improve the overall education system. Imbalanced teacher distribution and shortages of Islamic education teachers are among MORA’s main education challenges. In addition to 700,000 madrasah teachers, MORA also oversees about 180,000 PAI (Pembelajaran Agama Islam/Teaching Islamic Religion) teachers who teach Islamic education in general schools. The moratorium of civil servant teacher recruitment and a change from 2 to 4 hours of religious instruction per week under the Curriculum 2013 have created large shortages of PAI teachers. Many institutions have proactively responded by recruiting new PAI teachers without clarity in teacher hiring standards and procedures. This may have serious implications on the quality of teachers being hired and eventually teaching quality.
4. Boosting Indonesia’s human capital
Indonesia has achieved high levels of enrollment, but modest levels of quality improvements despite large
Key changes are required for policies and implementation strategies. These key changes should take advantage of ongoing actions and new opportunities, such as the replacement of the large number of teachers expected to retire over the next few years. The decentralization reform made districts responsible for service delivery, including financial monitoring, quality assurance, and support to lagging schools. Some districts have played this role relatively well, and have high levels of student learning, while others are still trying hard. Some other districts appear to have accepted an inferior equilibrium of high levels of inputs and low levels of student learning. As
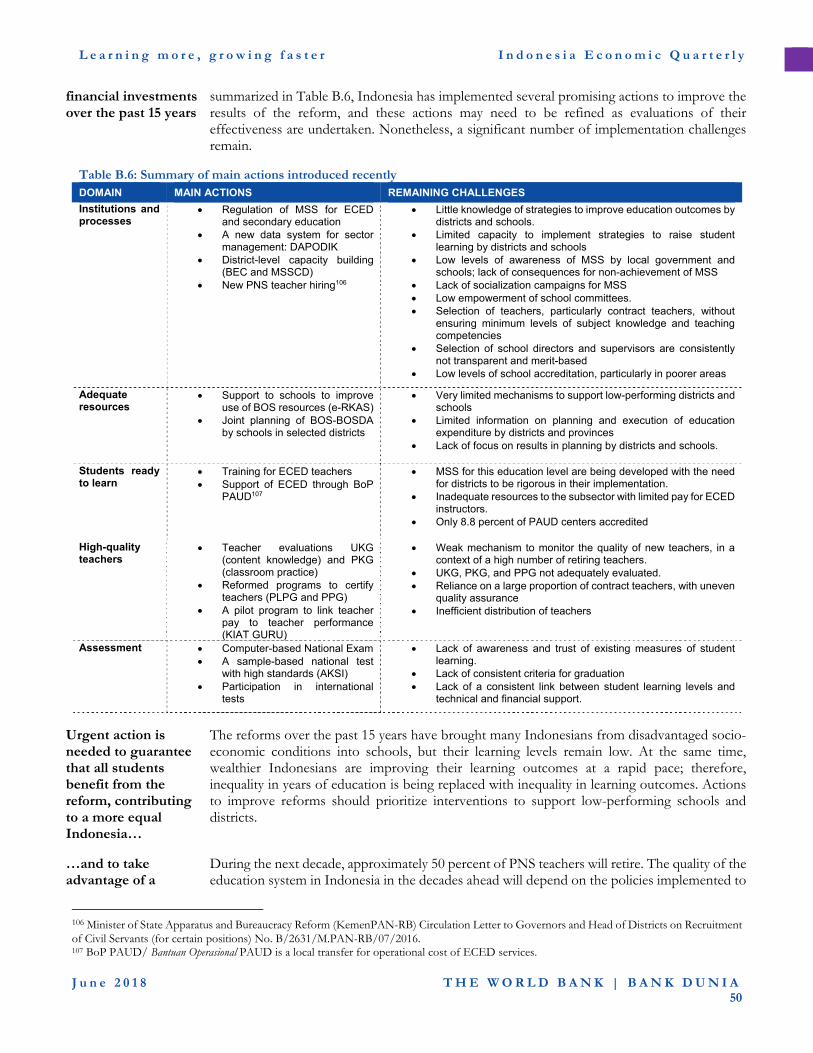
L e a r n i n g m o r e , g r o w i n g f a s t e r I n d o n e s i a E c o n o m i c Q u a r t e r l y
J u n e 2 0 1 8 T H E W O R L D B A N K | B A N K D U N I A
50
financial investments over the past 15 years
summarized in Table B.6, Indonesia has implemented several promising actions to improve the results of the reform, and these actions may need to be refined as evaluations of their effectiveness are undertaken. Nonetheless, a significant number of implementation challenges remain.
Table B.6: Summary of main actions introduced recently DOMAIN MAIN ACTIONS REMAINING CHALLENGES
Institutions and processes
Regulation of MSS for ECED and secondary education
A new data system for sector management: DAPODIK
District-level capacity building (BEC and MSSCD)
New PNS teacher hiring106
Little knowledge of strategies to improve education outcomes by districts and schools.
Limited capacity to implement strategies to raise student learning by districts and schools
Low levels of awareness of MSS by local government and schools; lack of consequences for non-achievement of MSS
Lack of socialization campaigns for MSS Low empowerment of school committees. Selection of teachers, particularly contract teachers, without
ensuring minimum levels of subject knowledge and teaching competencies
Selection of school directors and supervisors are consistently not transparent and merit-based
Low levels of school accreditation, particularly in poorer areas
Adequate resources
Support to schools to improve use of BOS resources (e-RKAS)
Joint planning of BOS-BOSDA by schools in selected districts
Very limited mechanisms to support low-performing districts and schools
Limited information on planning and execution of education expenditure by districts and provinces
Lack of focus on results in planning by districts and schools.
Students ready to learn
Training for ECED teachers Support of ECED through BoP
PAUD107
MSS for this education level are being developed with the need for districts to be rigorous in their implementation.
Inadequate resources to the subsector with limited pay for ECED instructors.
Only 8.8 percent of PAUD centers accredited
High-quality teachers
Teacher evaluations UKG (content knowledge) and PKG (classroom practice)
Reformed programs to certify teachers (PLPG and PPG)
A pilot program to link teacher pay to teacher performance (KIAT GURU)
Weak mechanism to monitor the quality of new teachers, in a context of a high number of retiring teachers.
UKG, PKG, and PPG not adequately evaluated. Reliance on a large proportion of contract teachers, with uneven
quality assurance Inefficient distribution of teachers
Assessment Computer-based National Exam A sample-based national test
with high standards (AKSI) Participation in international
tests
Lack of awareness and trust of existing measures of student learning.
Lack of consistent criteria for graduation Lack of a consistent link between student learning levels and
technical and financial support.
Urgent action is needed to guarantee that all students benefit from the reform, contributing to a more equal Indonesia…
The reforms over the past 15 years have brought many Indonesians from disadvantaged socio-economic conditions into schools, but their learning levels remain low. At the same time, wealthier Indonesians are improving their learning outcomes at a rapid pace; therefore, inequality in years of education is being replaced with inequality in learning outcomes. Actions to improve reforms should prioritize interventions to support low-performing schools and districts.
…and to take advantage of a
During the next decade, approximately 50 percent of PNS teachers will retire. The quality of the education system in Indonesia in the decades ahead will depend on the policies implemented to
106 Minister of State Apparatus and Bureaucracy Reform (KemenPAN-RB) Circulation Letter to Governors and Head of Districts on Recruitment of Civil Servants (for certain positions) No. B/2631/M.PAN-RB/07/2016. 107 BoP PAUD/ Bantuan Operasional PAUD is a local transfer for operational cost of ECED services.

L e a r n i n g m o r e , g r o w i n g f a s t e r I n d o n e s i a E c o n o m i c Q u a r t e r l y
J u n e 2 0 1 8 T H E W O R L D B A N K | B A N K D U N I A
51
unique opportunity to improve teachers
replace them. Action is needed ensure the best possible replacements are employed, regardless of the mechanism under which they are hired.
Improvements along the five key policy domains described above are critical to raise quality and to enable education investments to contribute more effectively to Indonesia’s human capital development priorities. Key policy recommendations include:
i) Institutional alignment: capacity and responsibility must be aligned for service delivery in a decentralized context, which is currently not the case in Indonesia. Districts and schools need to spend existing resources more effectively in order to strengthen their capacity and recruit motivated and qualified staff based on demonstrated need. This will ensure higher levels of learning and human capital. To break the inferior equilibria of weak service delivery, lower-performing districts need to recruit qualified human resources, and hire technical support to enable them to identify and support struggling schools. This technical support can be used to design plans to better spend DAU and to develop tools to help schools improve student learning among other essential activities. In addition, based on the experience with BEC and MSSCD, districts and provinces should be trained on strategies to achieve MSS indicators, including ECED and secondary education, and on how to incorporate them in their annual education plans. MOEC should strengthen its support to local education DINAS through their local offices for quality assurance108, MOHA should issue and enforce regulations encouraging districts to spend local resources for their own capacity building in education and on MSS achievement. Districts that continue to fail to achieve the MSS should receive technical support as well as financial sanctions, if performance does not improve.
At the school level, school committees require improved capacity to support school-based management. Schools nominally have school committees that can play an important role in school management, but many of them lack the authority, capacity, and resources to make much of a difference. School committee capacity must be improved to include results-based budgeting, operational planning, and accountability. This requires greater awareness of the roles of the school committee. The school principals need to ensure that school committees meet and are involved in school decision making. MOEC and districts education offices should launch a communication campaign directed at both directors, teachers and communities on the importance of school committees and how they should contribute to school management.
Conflicting regulations and gaps should be identified and eliminated. These include:
a. the lack of clarity about responsibility for in-service teacher training. If districts are the responsible entity, then who should be providing the training and who is responsible for evaluating the training and ensuring highest quality? The Presidential Office could establish a time-bound multisector commission with presence of MOEC, MOHA, MOF and MenPAN, and local governments to identify gaps regarding teacher training and to propose the required modifications on existing regulations within a three-month timeframe. The recommendations from the commission should then be implemented immediately.
108 Lembaga Penjaminan Mutu Pendidikan (LPMP)

L e a r n i n g m o r e , g r o w i n g f a s t e r I n d o n e s i a E c o n o m i c Q u a r t e r l y
J u n e 2 0 1 8 T H E W O R L D B A N K | B A N K D U N I A
52
b. schools and madrasahs are currently opened based on permission from local authorities, but resources, especially BOS, are then paid from central resources. More control needs to be exerted to limit the opening of new schools and madrasahs to those that are needed due to demand and have institutional capacity to deliver high-quality services. Districts, under the guidance of MOHA, MOEC and MORA, should enforce the criteria to license schools.
c. MOEC should revise the BOS minimum payment, particularly in the case of new small schools in areas with adequate existing supply of schools. The new regulations should require that minimum payment allocations to new schools are contingent on these schools meeting specific unmet demands in an underserved area, and cannot be located close to an existing school.
ii) Public spending: In addition to the essential improvements in districts’ capacity to monitor and support schools using the existing DAU and other resources, lagging schools and districts may need additional resources allocated on a performance basis criterion to close existing achievement gaps. Existing transfer mechanisms should be modified to ensure that additional resources are transferred using performance-based criteria. MOEC and MOF should adjust regulations for additional BOS transfers to be performance-based. Participating schools would receive both their current BOS, and the performance-based BOS only if they meet specific targets linked to the achievement of MSS and NES. MOHA should issue a regulation instructing local governments to support schools in the implementation of performance-based budgeting and planning linked to MSS and NES. To achieve higher levels of efficiency in spending in the sector, it is essential to ensure availability of information on budget expenditures for districts and provinces. Despite their aggregate importance, there is little readily available and understandable information on how districts deploy their education resources. This is especially the case for the IDR 81 trillion that are fully under their control. Better collection and analysis of district level information is essential to assess the efficiency in their use of education resources. MOF should complete its ongoing efforts to collect data on education planning and execution by districts and provinces. In this effort, smaller districts should be prioritized, as they receive larger amounts of resources per student and these larger resources are not closing the achievement gaps.
Synergies across different management levels should be fostered to make better use of financial and institutional resources.
On the institutional side, districts could support the achievement of MSS by schools, not only through funding, but also by raising awareness about MSS and the need for compliance. Districts should monitor schools and student learning more closely, to include MSS achievement in their monitoring, and support schools facing challenges in achieving the MSS. A few districts are already doing this well and can act as role models. MOHA should enforce the existing regulation that mandates local governments to achieve MSS within a specific time-period, and provide technical support to those districts that have persistently low-levels of achievement or require districts to spend their own resources to procure this technical support.
On the financial side, several districts are implementing local BOS-type programs and linking them to the national BOS program to maximize synergies among the different sources of funding and to accelerate
L e a r n i n g m o r e , g r o w i n g f a s t e r I n d o n e s i a E c o n o m i c Q u a r t e r l y
J u n e 2 0 1 8 T H E W O R L D B A N K | B A N K D U N I A
53
achievement of the MSS. If the national and local governments coordinate, the efficiency of the BOS program can be improved through joint planning of local and national BOS programs. As noted above, planning should be based on achieving MSS and NES. There should also be a mechanism to monitor and support schools that do not show this progress. MOEC and MOHA should issue regulations requiring the joint planning of all school resources.
Ongoing efforts to improve the use of BOS resources should be evaluated and expanded if results are promising. DKI Jakarta and some other local governments are piloting e-RKAS, a web-based platform that helps schools in their planning decisions of BOS and other school resources by linking expenditures with performance. This pilot intervention is being monitored and evaluated for improvement. Emerging lessons from this effort should be incorporated into BOS regulations by MOEC in the near future, and electronic performance-based budgeting should be implemented across Indonesia for both schools and madrasahs.
iii) Readiness to learn: Expand efforts on early childhood education by guaranteeing that all children have access to high-quality early childhood education. The government should strengthen the coverage of high-quality ECED by giving early childhood education sufficient funding within the current 20 percent envelope and improving the governance framework. The recent mandating of MSS for preprimary education is an important step forward in this direction, but, if the MSS are not enforced to ensure minimum levels of quality, children will learn less than they should and human capital will not reach its potential. MOEC and MOHA should train local government on MSS for ECED, and MOHA should require local governments to fulfill the MSS on ECED. MOEC and MOF should increase the amount of BOP PAUD in line with the new MSS regulations. Additionally, given that recent inclusion of ECED as a basic service on the priority list for use of the Village Fund, the Ministry of Village, Underdeveloped Regions and Transmigration should oversee that new ECED centers are opened by villages according to MOEC standards.
iv) Teachers: The retirement pattern over the next few years can lead to a once-in-history improvement in teacher quality with:
The right qualifications. In Indonesia, teacher qualifications are taken into consideration when teachers apply to a teaching job and when they participate in the certification program. The entry requirements for all teachers should be increased, and a minimum requirement for teachers should be established and enforced. For PNS teachers, the MOEC subject specific test (‘SKB’) should be used to remove low-performing candidates from the pool of eligible teachers. MOHA (non-PNS) and MenPAN (PNS) should enforce the existing bachelor’s degree requirement along with minimum levels of subject-matter knowledge for teachers in all regions to help children escape low-level knowledge traps.
The initial implementation of the new mechanism for teacher certification (PPG) should be evaluated and acted upon by MOEC so that increasing resources used to pay for teacher certification lead to higher levels of student learning.
The right incentives: Teachers need to be motivated to perform. There are ongoing efforts to link teacher pay to teacher evaluation, such as the one promoted by the KIAT GURU pilot. These should be evaluated and expanded if evaluation

L e a r n i n g m o r e , g r o w i n g f a s t e r I n d o n e s i a E c o n o m i c Q u a r t e r l y
J u n e 2 0 1 8 T H E W O R L D B A N K | B A N K D U N I A
54
results are satisfactory. MOEC and MOF should include positive lessons from this pilot into the payment of the TPG for all teachers nation-wide.
v) Assessment: PUSPENDIK should continue with their successful efforts to improve the integrity of the National Exam, especially using computer-based testing, and to expand the scope of the national diagnostic test (INAP also called AKSI). The results of the national diagnostic test should be made public, shared with districts and schools, and benchmarked to international exams.
To enhance the impact of assessment on learning, schools and local governments should also be helped to better interpret and act upon the results of a strengthened national assessment system. Given the low capacity of many districts and schools across Indonesia, PUSPENDIK must improve its mechanisms to share assessment results. The reports should be easily understood by all actors in the education system, and present strategies for improvement that are easy to comprehend and implement.
A National Education Quality Initiative should be launched
A National Education Quality Initiative should be launched. Based on ongoing efforts, a National Education Quality Initiative should strengthen the assessment system and improve its credibility. This initiative should also include financial data and the use of education resources at all levels to promote effectiveness and efficiency in the sector. The National Education Quality Initiative should be support by high-level political leaders, to maximize the impact.
Finally, to ensure that human capital improves for everyone, addressing critical
challenges of MORA’s education system should also be viewed as one of the main priorities in the education sector. Improving MORA’s capacity to effectively manage its large number of education institutions across the country is an essential step in ensuring these institutions deliver quality education. This includes providing technical assistance to madrasahs to achieve the MSS and eventually NES, as well as support to improve teacher skills and qualifications. The quality monitoring system should be strengthened to improve the accountability and effectiveness of government funds, especially those which are channeled to private providers (yayasans). As a first step, as the scope of the INAP-AKSI is expanded, this test should include madrasah representation.
L e a r n i n g m o r e , g r o w i n g f a s t e r I n d o n e s i a E c o n o m i c Q u a r t e r l y
J u n e 2 0 1 8 T H E W O R L D B A N K | B A N K D U N I A
55
References
PART A
Bank Indonesia. May 17, 2018. Siaran Pers. https://www.bi.go.id/en/ruang-media/siaran-pers/Pages/sp_204418.aspx
Barrons. February 2, 2018. https://www.barrons.com/articles/dow-tumbles-400-points-as-fear-drives-vix-higher-1517597151
Bloomberg. April 09, 2018. https://www.bloomberg.com/news/articles/2018-04-09/indonesia-seeks-to-regulate-more-fuel-prices-as-elections-loom
Bloomberg. April 13, 2018. https://www.bloomberg.com/news/articles/2018-04-13/moody-s-upgrades-indonesia-to-baa2-on-positive-economic-outlook
Bloomberg. May 17, 2018. https://www.bloomberg.com/news/articles/2018-05-17/jpmorgan-asset-sees-indonesia-india-bouncing-back-after-selloff and
Bloomberg. May 25, 2018. https://www.bloomberg.com/news/articles/2018-05-25/a-top-performing-fund-suddenly-gets-positive-on-indonesia-stocks
CNN Indonesia. October 27, 2017. https://www.cnnindonesia.com/ekonomi/20171027122305-78-251549/sri-mulyani-ketok-palu-naikkan-cukai-rokok-2018
IEA. 2017. The 2017 World Energy Outlook.
Indonesia Investments. April 24, 2018. https://www.indonesia-investments.com/news/todays-headlines/unilever-indonesia-reports-declining-sales-and-profit-in-q1-2018/item8753?
Indonesia Investments. May 02, 2018. https://www.indonesia-investments.com/news/todays-headlines/consumer-price-index-indonesia-inflation-at-0.10-in-april-2018/item8773?
Industri Bisnis. May 11, 2018. http://industri.bisnis.com/read/20180511/12/794017/sinyal-impor-beras-tambahan-makin-kuat
Indonesia Ministry of Finance. 2018. APBN Kita: Kinerja dan Fakta. https://www.kemenkeu.go.id/apbnkita. Published May, 2018
Liputan 6. April 2, 2018. https://www.liputan6.com/bisnis/read/3421449/efek-harga-pertalite-naik-masih-berlanjut-ke-inflasi-april
Netral News. May 02, 2018. http://www.en.netralnews.com/news/business/read/20766/harvest.season..inflation.in.april.2018.down.to.01.percent
Reuters. April 24, 2018. https://www.reuters.com/article/us-indonesia-rupiah-intervention/indonesia-central-bank-intervenes-with-sizeable-amount-to-defend-rupiah-idUSKBN1HV1AM
Reuters. May 8, 2018. https://uk.reuters.com/article/indonesia-markets/update-1-indonesian-market-sell-off-deepens-rupiah-at-lowest-since-dec-2015-idUKL3N1SF3F6
Reuters. April 30, 2018. https://www.reuters.com/article/indonesia-rupiah/update-1-indonesia-financial-industry-able-to-withstand-much-weaker-rupiah-regulators-idUSL3N1S74DU
The Wall Street Journal. May 7, 2018. https://www.wsj.com/articles/indonesia-market-selloff-shows-perils-of-relying-on-foreign-funding-1525686062
World Bank. 2017. Indonesia Economic Quarterly: Decentralization that Delivers. December. Jakarta: World Bank.

L e a r n i n g m o r e , g r o w i n g f a s t e r I n d o n e s i a E c o n o m i c Q u a r t e r l y
J u n e 2 0 1 8 T H E W O R L D B A N K | B A N K D U N I A
56
_________. 2018a. Commodity Markets Outlook: Oil Exporters: Policies and Challenges. April. Washington, DC: World Bank. http://www.worldbank.org/en/research/commodity-markets.
_________. 2018b. Global Economic Prospects: The Turning of the Tide? June. Washington, DC: World Bank.
PART B
Afkar, R., J. de Ree, and N. Khairina. Forthcoming. “Who Learns What in Basic Education? Evidence from Indonesia”. Working Paper. World Bank.
Al-Samarrai, S., T. Fasih, A. Hasan, and D. Syukriyah. 2014. Assessing the role of the school operational grant program (BOS) in improving education outcomes in Indonesia (English). Jakarta: World Bank Group.
Al-Samarrai, S. 2013. "Local Governance and Education Performance: A Survey of the Quality of Local Education Governance in 50 Indonesian Districts". World Bank Other Operational Studies, 16765. World Bank.
Alderman, H. and J. Hoddinott and B. H. Kinsey. 2006. “Long Term Consequences of Early Childhood Malnutrition.” Oxford Economic Papers. Vol. 58, Issue 3, pp. 450-474, 2006. Available at SSRN: https://ssrn.com/abstract=916871 or http://dx.doi.org/10.1093/oep/gpl008
Altinok, N., N. Angrist and H. Patrinos. 2018. “Global Data Set on Education Quality”. Policy Research Working Paper 8314. World Bank.
Barro, R. and J-W Lee. 2013. "A New Data Set of Educational Attainment in the World, 1950-2010." Journal of Development Economics. Vol 104, pp.184-198.
Chang, M., S. Shaeffer, S. Al-Samarrai, A. Ragatz, J. de Ree and R. Stevenson. 2014. Teacher Reform in Indonesia: The Role of Politics and Evidence in Policy Making. Directions in Development, No. 16355. Washington, DC: World Bank.
Chen, D. 2011. “School-Based Management, School Decision-Making and Education Outcomes in Indonesian Primary Schools”. Policy Research Working Paper, No. WPS 5809.
Cislowski, H. 2010. “What’s to be Done About the National Exam?” Paper for ESWG Meeting 1 June 2010 on the National Exams, cited in ACDP (2013).
Cislowski, H. 2018. “Review of the System for Assessment Student Learning”. mimeo.
DAPODIK, several years
de Ree, J., K. Muralidharan, M. Pradhan and H. Rogers. 2017. “Double for Nothing? Experimental Evidence on Unconditional Teacher Salary Increase in Indonesia”. The Quarterly Journal of Economics, Volume 133, Issue 2, May, Pages 993–1039.
Hanson, B. A., D. J. Harris, and R. L. Brennan. 1987. “A Comparison of Several Statistical Methods for Examining Allegations of Copying”. Research Rep. Series No. 87-15. Iowa City: American College Testing Program
Hanushek, E. and L. Woessmann. 2011. "How Much Do Educational Outcomes Matter in OECD countries?" Economic Policy. Vol. 26, No. 67, pp. 427-491.
International Monetary Fund, 2018. "Indonesia; 2017 Article IV Consultation-Press Release; Staff Report; and Statement by the Executive Director for Indonesia". IMF Staff Country Reports 18/32, International Monetary Fund.
Iskandar, S. Forthcoming. A Rapid Assessment of Teacher-related Policies in Indonesia. Mimeo. World Bank
Kesuma, R., A. Utz, P. Bodrogini, R. Purwana. Forthcoming. Efficient Deployment of Teachers. Policy Note. World Bank.

L e a r n i n g m o r e , g r o w i n g f a s t e r I n d o n e s i a E c o n o m i c Q u a r t e r l y
J u n e 2 0 1 8 T H E W O R L D B A N K | B A N K D U N I A
57
Murnane, R., M. R. Waldman, J. B. Willett, M. S. Bos and E. Vegas. 2017. “The Consequences of Educational Voucher Reform in Chile”. NBER Working Paper No. 23550. June.
OECD. 2004. PISA 2003 Results. Paris: OECD.
______. 2015. Education in Indonesia: Rising to the Challenge. OECD Publishing. Paris.
______. 2016. PISA 2015 Results: Excellence and Equity in Education. Vol 1. Paris: OECD.
Popova, A., D. Evans, V. Arancibia. 2016. “Training Teachers on the Job: What Works and How to Measure it.” Policy Research Working Paper No. 7834; WDR 2018 background paper. World Bank Group.
PUSPENDIK. several years. Results of National Exam.
Ragatz, A., S. Iskandar, R. Kesuma, S. Sugiarti and A. B. Ragatz. 2015. Indonesia - A video study of teaching practices in TIMSS eighth grade mathematics classrooms: understanding what teaching practices are used, why they are used and how they relate to student learning (English). Washington, DC: World Bank Group.
Rahmawati and Asriyanti. 2016. “Integrity Index of National Exam: an Effort to Gain Precise Information on Achievement of Curriculum Standards”. Paper presented at IAEA (International Association for Educational Assessment).
Rahmawati. 2018. Giving feedback to classrooms: Challenges on how to make a good assessment and how to make use of its results. Powerpoint presented at South Asia Regional Conference on Using Large Scale Assessments to Improve Teaching and Learning, India, April 2018.
SUSENAS, several years.
World Economic Forum. 2018. “Global Competitiveness Report 2017-2018”. Available at http://www3.weforum.org/docs/GCR2017-2018/05FullReport/TheGlobalCompetitivenessReport2017%E2%80%932018.pdf
World Bank. 2018. Growing Smarter: Learning and Equitable Development in East Asia and Pacific. World Bank East Asia and Pacific Regional Report. Washington, DC: World Bank.
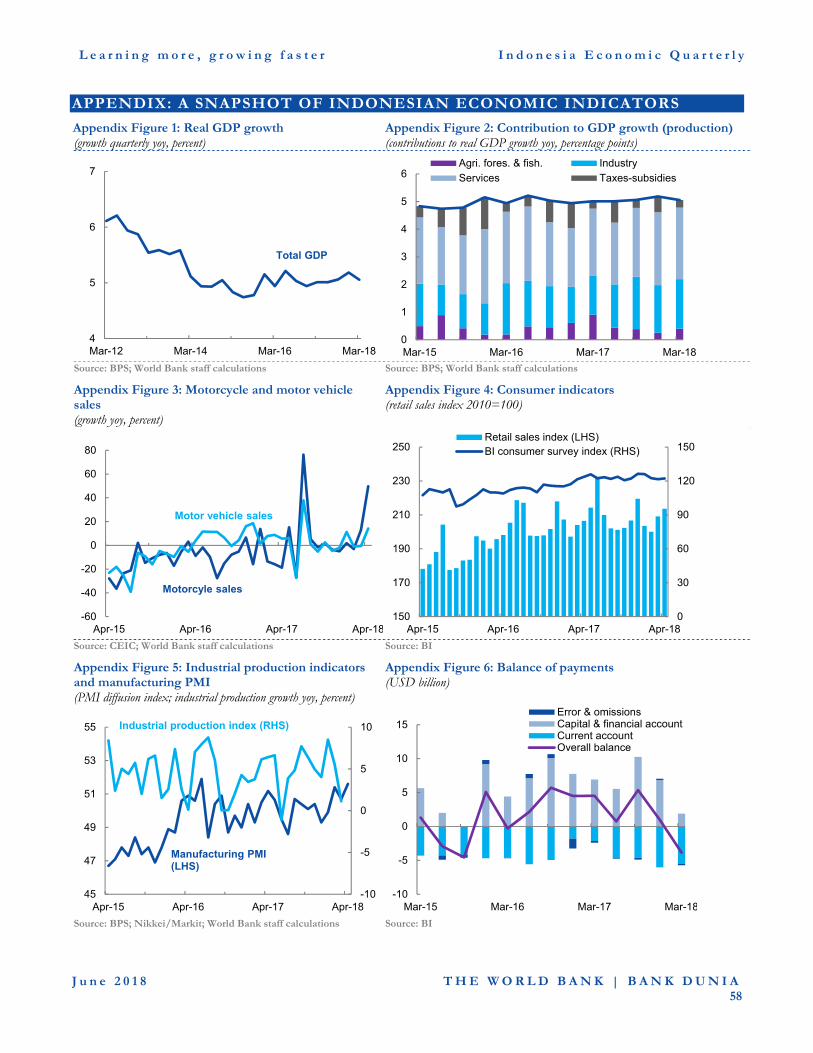
L e a r n i n g m o r e , g r o w i n g f a s t e r I n d o n e s i a E c o n o m i c Q u a r t e r l y
J u n e 2 0 1 8 T H E W O R L D B A N K | B A N K D U N I A
58
APPENDIX: A SNAPSHOT OF INDONESIAN ECONOMIC INDICATORS
Appendix Figure 1: Real GDP growth (growth quarterly yoy, percent)
Appendix Figure 2: Contribution to GDP growth (production) (contributions to real GDP growth yoy, percentage points)
Source: BPS; World Bank staff calculations Source: BPS; World Bank staff calculations
Appendix Figure 3: Motorcycle and motor vehicle sales (growth yoy, percent)
Appendix Figure 4: Consumer indicators (retail sales index 2010=100)
Source: CEIC; World Bank staff calculations Source: BI
Appendix Figure 5: Industrial production indicators and manufacturing PMI (PMI diffusion index; industrial production growth yoy, percent)
Appendix Figure 6: Balance of payments (USD billion)
Source: BPS; Nikkei/Markit; World Bank staff calculations Source: BI
4
5
6
7
Mar-12 Mar-14 Mar-16 Mar-18
Total GDP
0
1
2
3
4
5
6
Mar-15 Mar-16 Mar-17 Mar-18
Agri. fores. & fish. Industry
Services Taxes-subsidies
-60
-40
-20
0
20
40
60
80
Apr-15 Apr-16 Apr-17 Apr-18
Motor vehicle sales
Motorcyle sales
0
30
60
90
120
150
150
170
190
210
230
250
Apr-15 Apr-16 Apr-17 Apr-18
Retail sales index (LHS)BI consumer survey index (RHS)
-10
-5
0
5
10
45
47
49
51
53
55
Apr-15 Apr-16 Apr-17 Apr-18
Manufacturing PMI (LHS)
Industrial production index (RHS)
-10
-5
0
5
10
15
Mar-15 Mar-16 Mar-17 Mar-18
Error & omissionsCapital & financial accountCurrent accountOverall balance

L e a r n i n g m o r e , g r o w i n g f a s t e r I n d o n e s i a E c o n o m i c Q u a r t e r l y
J u n e 2 0 1 8 T H E W O R L D B A N K | B A N K D U N I A
59
Appendix Figure 7: Current account components (USD billion)
Appendix Figure 8: Exports of goods (USD billion)
Source: BI Source: BPS
Appendix Figure 9: Imports of goods (USD billion)
Appendix Figure 10: Reserves and capital flows (USD billion)
Source: BPS Source: BI; Ministry of Finance (MoF)
Note: SUN is government securities, SBI is BI certificates
Appendix Figure 11: Inflation (growth yoy, percent)
Appendix Figure 12: Monthly breakdown of CPI (contribution to growth yoy, percentage points)
Source: BPS; BI; World Bank staff calculations Source: BPS; World Bank staff calculations
-12
-8
-4
0
4
8
12
Mar-15 Mar-16 Mar-17 Mar-18
Goods trade Services tradePrimary income Secondary incomeCurrent account
0
2
4
6
8
10
12
14
16
Apr-15 Apr-16 Apr-17 Apr-18
Total exports (fob) AgricultureManufacturing MiningOil and gas
0
2
4
6
8
10
12
14
16
Apr-15 Apr-16 Apr-17 Apr-18
Total imports (cif) Oil and gasConsumer goods Raw materialsCapital goods
30
80
130
-9
-6
-3
0
3
6
9
Apr-15 Apr-16 Apr-17 Apr-18
Global bonds (LHS)SBI (LHS)SUN (LHS)Equities (LHS)International reserves (RHS)
0
1
2
3
4
5
6
7
8
Apr-16 Oct-16 Apr-17 Oct-17 Apr-18
Food
Non-food
Headline
Core
-1
0
1
2
3
4
5
Apr-16 Oct-16 Apr-17 Oct-17 Apr-18
Processed food Raw FoodClothing TransportHealth EducationHousing Headline
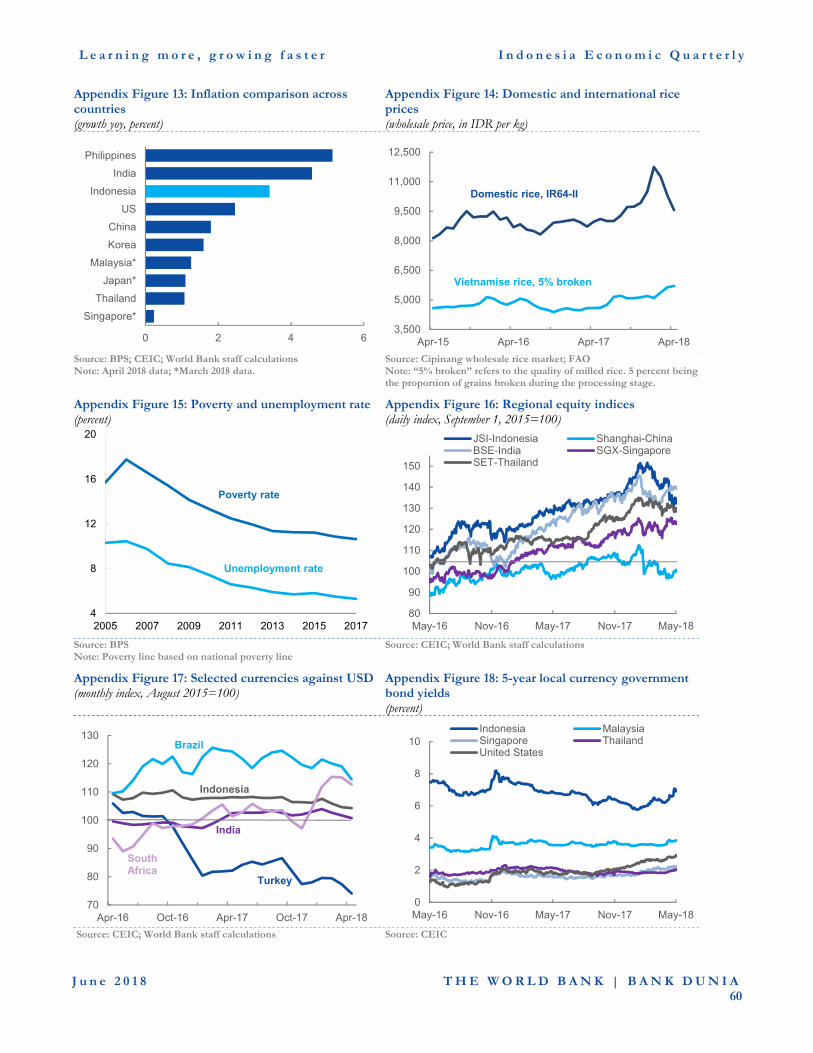
L e a r n i n g m o r e , g r o w i n g f a s t e r I n d o n e s i a E c o n o m i c Q u a r t e r l y
J u n e 2 0 1 8 T H E W O R L D B A N K | B A N K D U N I A
60
Appendix Figure 13: Inflation comparison across countries (growth yoy, percent)
Appendix Figure 14: Domestic and international rice prices (wholesale price, in IDR per kg)
Source: BPS; CEIC; World Bank staff calculations Note: April 2018 data; *March 2018 data.
Source: Cipinang wholesale rice market; FAO Note: “5% broken” refers to the quality of milled rice. 5 percent being the proportion of grains broken during the processing stage.
Appendix Figure 15: Poverty and unemployment rate (percent)
Appendix Figure 16: Regional equity indices (daily index, September 1, 2015=100)
Source: BPS Note: Poverty line based on national poverty line
Source: CEIC; World Bank staff calculations
Appendix Figure 17: Selected currencies against USD (monthly index, August 2015=100)
Appendix Figure 18: 5-year local currency government bond yields (percent)
Source: CEIC; World Bank staff calculations Source: CEIC
0 2 4 6
Singapore*
Thailand
Japan*
Malaysia*
Korea
China
US
Indonesia
India
Philippines
3,500
5,000
6,500
8,000
9,500
11,000
12,500
Apr-15 Apr-16 Apr-17 Apr-18
Vietnamise rice, 5% broken
Domestic rice, IR64-II
4
8
12
16
20
2005 2007 2009 2011 2013 2015 2017
Poverty rate
Unemployment rate
80
90
100
110
120
130
140
150
May-16 Nov-16 May-17 Nov-17 May-18
JSI-Indonesia Shanghai-ChinaBSE-India SGX-SingaporeSET-Thailand
70
80
90
100
110
120
130
Apr-16 Oct-16 Apr-17 Oct-17 Apr-18
Brazil
Indonesia
India
South Africa
Turkey
0
2
4
6
8
10
May-16 Nov-16 May-17 Nov-17 May-18
Indonesia MalaysiaSingapore ThailandUnited States

L e a r n i n g m o r e , g r o w i n g f a s t e r I n d o n e s i a E c o n o m i c Q u a r t e r l y
J u n e 2 0 1 8 T H E W O R L D B A N K | B A N K D U N I A
61
Appendix Figure 19: Sovereign USD bond EMBIG spread (basis points)
Appendix Figure 20: Commercial and rural credit and deposit growth (growth yoy, percent)
Source: JP Morgan Source: BI; World Bank staff calculations
Appendix Figure 21: Banking sector indicators (monthly, percent)
Appendix Figure 22: Government debt (percent of GDP, LHS; USD billion, RHS)
Source: BI; World Bank staff calculations Source: BI; MoF; World Bank staff calculations
Appendix Figure 23: External debt (percent of GDP, LHS; USD billion, RHS)
Source: BI; World Bank staff calculations
-200
-150
-100
-50
0
50
150
170
190
210
230
250
270
290
310
330
May-16 Nov-16 May-17 Nov-17 May-18
Indonesia spread - overall EMBIG spread(RHS)Indonesia EMBIG bond spread
3
6
9
12
15
Mar-16 Sep-16 Mar-17 Sep-17 Mar-18
Private deposits
Loans
-1
1
3
5
0
50
100
Mar-16 Sep-16 Mar-17 Sep-17 Mar-18
Loans to deposit ratio (LHS)Liquidity to assets ratio (LHS)Capital adequacy ratio (LHS)Non-performing loans ratio (RHS)Return on asset (RHS)
0
10
20
30
40
0
75
150
225
300
External
Domestic
Total ext. debt to GDP %
0
10
20
30
40
0
100
200
300
400
Private Public Total ext. debt to GDP %
Total ext. debt to GDP %

L e a r n i n g m o r e , g r o w i n g f a s t e r I n d o n e s i a E c o n o m i c Q u a r t e r l y
J u n e 2 0 1 8 T H E W O R L D B A N K | B A N K D U N I A
62
Appendix Table 1: Budget outcomes and projections (IDR trillion)
2011 2012 2013 2014 2015 2016 2017
Actual Actual Actual Actual Actual Actual Actual
A. State revenue and grants 1,211 1,338 1,439 1,550 1,508 1,556 1,666 1. Tax revenue 874 981 1,077 1,147 1,240 1,285 1,344 2. Non-tax revenue 331 352 355 399 256 262 311
B. Expenditure 1,295 1,491 1,651 1,777 1,807 1,864 2,007 1. Central government 884 1,011 1,137 1,204 1,183 1,154 1,265 2. Transfers to the regions 411 481 513 574 623 710 742
C. Primary balance 9 -53 -99 -93 -142 -126 -124 D. SURPLUS / DEFICIT -84 -153 -212 -227 -298 -308 -341 (percent of GDP) -1.1 -1.9 -2.3 -2.2 -2.6 -2.5 -2.5
Source: MoF; World Bank staff calculations Note: Budget balance as percentage of GDP uses the revised and rebased GDP
Appendix Table 2: Balance of payments (USD billion)
2014 2015 2016
2016 2017 2018
Q3 Q4 Q1 Q2 Q3 Q4 Q1
Balance of payments 1,211 1,338 1,439 1,550 1,508 1,556 1,660 1,211 1,338 1,439
Percent of GDP 874 981 1,077 1,147 1,240 1,285 1,343 874 981 1,077
Current account 331 352 355 399 256 262 310 331 352 355
Percent of GDP 1,295 1,491 1,651 1,777 1,807 1,864 1,986 1,295 1,491 1,651
Trade balance 884 1,011 1,137 1,204 1,183 1,154 1,244 884 1,011 1,137
Net income & current transfers 411 481 513 574 623 710 742 411 481 513
Capital & Financial Account 9 -53 -99 -93 -142 -126 -110 9 -53 -99
Percent of GDP -84 -153 -212 -227 -298 -308 -326 -84 -153 -212 Direct investment -1.1 -1.9 -2.3 -2.2 -2.6 -2.5 -2.4 -1.1 -1.9 -2.3 Portfolio investment 1,211 1,338 1,439 1,550 1,508 1,556 1,660 1,211 1,338 1,439
Other investment 874 981 1,077 1,147 1,240 1,285 1,343 874 981 1,077
Errors & omissions 331 352 355 399 256 262 310 331 352 355
Foreign reserves* 1,295 1,491 1,651 1,777 1,807 1,864 1,986 1,295 1,491 1,651
Source: BI; BPS; World Bank staff calculations Note: * Reserves at end-period

L e a r n i n g m o r e , g r o w i n g f a s t e r I n d o n e s i a E c o n o m i c Q u a r t e r l y
J u n e 2 0 1 8 T H E W O R L D B A N K | B A N K D U N I A
63
Appendix Table 3: Indonesia’s historical macroeconomic indicators at a glance 2000 2010 2011 2012 2013 2014 2015 2016 2017
National Accounts (% change)1
Real GDP 4.9 6.2 6.2 6.0 5.6 5.0 4.9 5.0 5.1
Real investment 11.4 8.5 8.9 9.1 5.0 4.4 5.0 4.5 6.2
Real consumption 4.6 4.1 5.1 5.4 5.7 4.7 4.9 4.3 4.6
Private 3.7 4.8 5.1 5.5 5.5 5.3 4.8 5.0 5.0
Government 14.2 0.3 5.5 4.5 6.7 1.2 5.3 -0.1 2.1
Real exports, GNFS 30.6 15.3 14.8 1.6 4.2 1.1 -2.1 -1.6 9.1
Real imports, GNFS 26.6 17.3 15.0 8.0 1.9 2.1 -6.2 -2.4 8.1
Investment (% GDP) 20 31 32 33 32.5 32.4 32.4 32.2 32.6
Nominal GDP (USD billion) 165 755 893 918 915 891 861 933
1,015
GDP per capita (USD) 857 3,167 3,688 3,741 3,668 3,532 3,370 3,603 3,878
Central Government Budget (% GDP)2
Revenue and grants 20.8 14.5 15.5 15.5 15.1 14.7 13.1 12.5 12.3
Non-tax revenue 9.0 3.9 4.2 4.1 3.7 3.8 2.2 2.1 2.3
Tax revenue 11.7 10.5 11.2 11.4 11.3 10.9 10.8 10.4 9.9
Expenditure 22.4 15.2 16.5 17.3 17.3 16.8 15.7 15.0 14.8
Consumption 4.0 3.6 3.8 3.9 4.1 4.0 4.5 4.6 4.4
Capital 2.6 1.2 1.5 1.7 1.9 1.4 1.9 1.4 1.5
Interest 5.1 1.3 1.2 1.2 1.2 1.3 1.4 1.5 1.6
Subsidies 6.3 2.8 3.8 4.0 3.7 3.7 1.6 1.4 1.2
Budget balance -1.6 -0.7 -1.1 -1.8 -2.2 -2.1 -2.6 -2.5 -2.5
Government debt 97.9 24.5 23.1 23.0 24.9 24.7 27.4 28.3 29.0
o/w external government debt 51.4 11.1 10.2 9.9 11.2 10.2 11.9 11.3 ..
Total external debt (including private sector)
87.1 26.8 25.2 27.5 29.1 32.9 36.1 34.3 ..
Balance of Payments (% GDP)3
Overall balance of payments .. 4.0 1.3 0.0 -0.8 1.7 -0.1 1.3 1.1
Current account balance 4.8 0.7 0.2 -2.7 -3.2 -3.1 -2.0 -1.8 -1.7
Exports GNFS 42.8 22.0 23.9 23.0 22.4 22.3 19.9 18.0 19.1
Imports GNFS 33.9 19.2 21.2 23.2 23.1 22.7 19.3 17.1 18.0
Trade balance 8.9 2.8 2.7 -0.2 -0.7 -0.3 0.6 0.9 1.1
Financial account balance .. 3.5 1.5 2.7 2.4 5.0 2.0 3.1 2.9
Direct investment -2.8 1.5 1.3 1.5 1.3 1.7 1.2 1.7 2.0
Gross official reserves (USD billion) 29.4 96 110 113 99 112 106 116 130
Monetary (% change)3
GDP deflator1 20.4 8.3 7.5 3.8 5.0 5.4 4.0 2.5 4.3
Bank Indonesia interest key rate (%) .. .. .. .. .. .. 6.3 4.8 4.3
Domestic credit (eop) .. 23.3 24.7 23.1 21.4 11.6 10.1 7.8 8.2
Nominal exchange rate (average, IDR/USD)
8,392 9,087 8,776 9,384 10,460 11,879 13,392 13,307 13,384
Prices (% change)1
Consumer price Index (eop) 9.4 7.0 3.8 3.7 8.1 8.4 3.4 3.0 3.6
Consumer price Index (average) 3.7 5.1 5.3 4.0 6.4 6.4 6.4 3.5 3.8
Indonesia crude oil price (USD per barrel, eop)4
28 79 112 113 107 60 36 51 61
Source: 1 BPS and World Bank staff calculations, using revised and 2010 rebased figures. 2 MoF and World Bank staff calculations, 3 BI, 4 CEIC

L e a r n i n g m o r e , g r o w i n g f a s t e r I n d o n e s i a E c o n o m i c Q u a r t e r l y
J u n e 2 0 1 8 T H E W O R L D B A N K | B A N K D U N I A
64
Appendix Table 4: Indonesia’s development indicators at a glance
2000 201
0 201
1 201
2 201
3 201
4 201
5 201
6 201
7 Demographics1
Population (million) 213 243 246 249 252 255 258 261 ..
Population growth rate (%) 1.3 1.3 1.3 1.3 1.3 1.2 1.2 1.1 ..
Urban population (% of total) 42 50 51 51 52 53 53.7 54 ..
Dependency ratio (% of working-age population) 55 51 51 50 50 50 49.2 49 .. Labor Force2
Labor force, total (million) 98 117 117 120 120 122 122 125 128
Male 60 72 73 75 75 76 77 77 79
Female 38 45 44 46 45 46 46 48 49
Agriculture share of employment (%) 45 38 36 35 35 34 33 32 30
Industry share of employment (%) 17 19 21 22 20 21 22 21 22
Services share of employment (%) 37 42 43 43 45 45 45 47 48
Unemployment, total (% of labor force) 8.1 7.1 7.4 6.1 6.2 5.9 6.2 5.6 5.5 Poverty and Income Distribution3
Median household consumption (IDR 000 per month) 104 374 421 446 487 548 623 697 765
National poverty line (IDR 000 per month) 73 212 234 249 272 303 331 354 375
Population below national poverty line (million) 38 31 30 29 28 28 29 28 28
Poverty (% of population below national poverty line) 19.1 13.3 12.5 12.0 11.4 11.3 11.2 10.9 10.6
Urban (% of population below urban poverty line) 14.6 9.9 9.2 8.8 8.4 8.3 8.3 7.8 7.7
Rural (% of population below rural poverty line) 22.4 16.6 15.7 15.1 14.3 14.2 14.2 14.1 13.9
Male-headed households 15.5 11.0 10.2 9.5 9.2 9.0 9.3 9.0 8.7
Female-headed households 12.6 9.5 9.7 8.8 8.6 8.6 11.1 9.8 9.3
Gini index 0.30 0.38 0.41 0.41 0.41 0.41 0.41 0.40 ..
Percentage share of consumption: lowest 20% 9.6 7.9 7.4 7.5 7.4 7.5 7.2 7.1 7.0
Percentage share of consumption: highest 20% 38.6 40.6 46.5 46.7 47.3 46.8 47.3 46.2 45.7
Public expenditure on social security & welfare (% of GDP)4 .. 0.4 0.4 0.4 0.6 0.5 0.6 0.6 .. Health and Nutrition1
Physicians (per 1,000 people) 0.16 0.14 .. 0.20 .. .. .. .. .. Under five mortality rate (per 1000 children under 5 years) 52 33 32 31 29 28 27 26 .. Neonatal mortality rate (per 1000 live births) 22 16 16 15 15 15 14 14 ..
Infant mortality (per 1000 live births) 41 28 27 26 25 24 23 22 ..
Maternal mortality ratio (modeled est., per 100,000 live births)
265 165 156 148 140 133 126 .. ..
Measles vaccination (% of children under 2 years) 76 78 80 82 81 75 75 76 ..
Total health expenditure (% of GDP) 2.0 2.7 2.7 2.9 2.9 2.8 .. .. ..
Public health expenditure (% of GDP) 0.7 1.0 1.0 1.1 1.2 1.1 .. .. .. Education3
Primary net enrollment rate (%) .. 92 92 93 92 93 97 97 97
Female (% of total net enrollment) .. 48 49 49 50 48 49 49 49
Secondary net enrollment rate (%) .. 61 60 60 61 65 66 66 79
Female (% of total net enrollment) .. 50 50 49 50 50 51 51 49
Tertiary net enrollment rate (%) .. 16 14 15 16 18 20 21 19
Female (% of total net enrollment) .. 53 50 54 54 55 56 55 53
Adult literacy rate (%) .. 91 91 92 93 93 95 95 96
Public spending on education (% of GDP)5 .. 3.5 3.6 3.8 3.8 3.6 3.5 3.3 2.98
Public spending on education (% of spending)5 .. 20.0 20.2 20.1 20.0 19.9 20.6 20.0 20.0 Water and Sanitation1
Access to an improved water source (% of population) 78 85 85 86 86 87 87 .. ..
Urban (% of urban population) 91 93 93 94 94 94 94 .. ..
Rural (% of rural population) 68 76 77 77 78 79 80 .. ..
Access to improved sanitation facilities (% of population) 44 57 58 59 60 61 61 .. ..
Urban (% of urban population) 64 70 71 71 72 72 72 .. ..
Rural (% of rural population) 30 44 45 46 47 48 48 .. .. Others1
Disaster risk reduction progress score (1-5 scale; 5=best) .. .. 3.3 .. .. .. .. .. ..
Proportion of seats held by women in national parliament (%)6
8 18 18 19 19 17 17 17 20
Source: 1 World Development Indicators; 2 BPS (Sakernas); 3 BPS (Susenas) and World Bank; 4 MoF, Bappenas, and World Bank staff calculations, only includes spending on rice distribution for the poor (Raskin), health insurance for the poor, scholarships for the poor, and Family Hope Program (PKH) and actuals; 5 MoF; 6 Inter-Parliamentary Union

Resilience through reformsJune 2016
Supported by funding from the Australian Government (Department of Foreign Affairs and Trade, DFAT), under the Support for Enhanced Macroeconomic and Fiscal Policy Analysis (SEMEFPA) program.