june 2015 brazil macro the adjustment exposed dalton gardimam chief economist...
TRANSCRIPT

June 2015
BRAZIL MACRO
The Adjustment Exposed
BRAZIL MACRO
The Adjustment Exposed
Dalton GardimamChief Economist
[email protected]+55-11-2178-4275

| 2 |
Two key assumptions on the global economy and the BRL
USA: It is all about the Fed China: Stimuli?
400
600
800
1,000
1,200
1,400
1,600
1,800 China - Total Social Financing(12 month MA)
In spite of monetary stimuli, credit moderation persists, and so does disinflation (or deflation?).
Weaker commodity prices
Recovery in credit markets combined with excessive risk taking supports our forecast for the first hike in the federal funds rate in Dec. 2015. Or later.
Potential change in “market benevolence”?
2010 2011 2012 2013 2014 20151.0
1.5
2.0
2.5
3.0
3.5
1.0
1.5
2.0
2.5
3.0
3.5
4.0
4.5
5.0Long-term Inflation Expectations and Interest Rates (%)
5Y-5Y Forward Inflation 10Y Treasury Yield (RHS)

| 3 |
FX and global prices
Falling prices. Terms of trade are still high from a historical point of view.
R$3.25/US$1 for YE15
R$3.40+/US$1 for YE16
Little improvement. Even with strong assumptions regarding a decline in imports, lower commodity prices prevent a major rebound in trade.
1899
1906
1912
1919
1925
1932
1938
1945
1951
1958
1964
1971
1977
1984
1990
1997
2003
2010
0.5
0.6
0.7
0.8
0.9
1
1.1
1.2
1.3
1.4
Terms of Trade
Soybean Iron Ore Fuels Others Total-40,000,000,000
-30,000,000,000
-20,000,000,000
-10,000,000,000
0
10,000,000,000
20,000,000,000
30,000,000,000
40,000,000,000
22,812,299,141
32,491,530,731
-22,957,080,643
-29,789,004,861
2,557,744,368
23,277,378,05425,819,090,176
-19,204,788,608
-33,850,852,935
-3,959,173,313
19,020,526,573
14,509,569,018
-9,584,714,939
-16,387,519,988
7,557,860,664
Trade Balance (US$ Bn)
2013 2014 2015

| 4 |
Brazil: One wrong diagnosis leads to another
Microeconomic intervention
Stimulus to demand
-The global Keynesian response to the crisis was also applied in Brazil
-Tax cuts for consumption
-Use of public-sector banks in the use of “creative accounting”
-Global liquidity and leniency towards inappropriate economic policies
-“Full employment” and pre-crisis levels of production returned as early as 2010
-Continuation of stimulatory policies that resulted in wage inflation
-Micro-intervention that targeted full employment
-A general loss of productivity, profits and growth
MACROeconomic Imbalances
MICROeconomic Imbalances
-Current account deficit
-Inflation
-Deterioration in the public accounts
-A massive decline in the already low level of domestic savings
-A lack of growth

| 5 |
The dual imbalance and the “dual deleveraging” issue
“Intentional” Deleveraging(or public-sector deleveraging)
“Unintentional” Deleveraging(or private-sector deleveraging)
Households have reduced the demand for credit
Removal of distortions in the economy
Monetary adjustment
Fiscal adjustment
Public banks’ adjustments
Higher delinquency rates
Further slowdown in credit growth
This is where we are
A decline in final demand
A decline in investment
Next 4 – 6 quarters?
More business failures
A higher unemployment rate
How many “rounds” are enough? The recovery (Austrian BCT)
Lower tax collections
Disappointing fiscal results
Lower inflation - Lower CA deficit

| 6 |
The One and the only one true adjustment: 1999
19
98
19
99
20
00
20
01
20
02
20
03
20
04
20
05
20
06
20
07
20
08
20
09
20
10
20
11
20
12
20
13
20
14
20
15
-2.5
-2.0
-1.5
-1.0
-0.5
0.0
0.5
1.0
1.5
2.0
2.5
3.0
CHANGE in primary surplus from one to year to another % of GDP
State-owned companies

| 7 |
Expansionary fiscal adjustment? Unlikely
Jan-
98
Jun-
98
Nov-9
8
Apr-9
9
Sep-9
9
Feb-0
0
Jul-0
0
Dec-0
0
May
-01
Oct-0
1
Mar
-02
Aug-0
2
Jan-
03
Jun-
03
Nov-0
3
Apr-0
4
Sep-0
4
Feb-0
5
Jul-0
5
Dec-0
5
May
-06
Oct-0
60
500
1000
1500
2000
2500Bond Spreads (Brazil country risk - Embi+) bps
-700bps in 12 months
-1824bps in 15 months
• Brazil 5-year CDS at 230bps
• Could this fall to 100-150bps?
• -150bps? After two years of the adjustment?
• Fiscal adjustment in a different historical context.
GDP growth estimated at -2% in 2015
+0.3% in 2016

| 8 |
Public finance in 2016: Feel the vibe…
Estimated GDP primary surplus of 1.1% in 2016?
Fiscal adjustment in 2015 based on “easy measures” : investment cuts, election-related spending, tax hikes without approval by Congress
2008 2010 2012 2014 2016 201845%
50%
55%
60%
65%
70%
75%
-1.0%
0.0%
1.0%
2.0%
3.0%
4.0%
5.0%Fiscal Indicators (% of GDP)
Gross Public Debt
Primary Surplus
Non-convergence. A primary surplus of 2% of GDP in 2017 and 2018 does not clearly lead to stabilization in the indebtedness level.
0.5% primary surplus in 2015: 1.1% fiscal shift.
2% of GDP target in 2016: 1.5% fiscal shift.
“Easy measures” won´t be available in 2016, so dependence on Congress will be higher.
Potential adjustments in 2016’s fiscal policy:
-Higher PIS/Cofins for banks’ financial revenues (no Congress - R$15bn/year)
-Higher taxes on “single-employee” companies (Congress)
-End of tax exemptions on LCI/LCA credit instruments (Congress)
-IoC reduction (Congress)
-CPMF revival (Congress to approve Constitutional amendment – may reach 0.8% of GDP)
-Concessions? Without BNDES?

| 9 |
Supply constraints or borrowing constraints?
Disposable income. Households are still committing a LARGER part of their incomes to debt payments
Indebtedness. Deleveraging has not yet begun.
2005 2006 2007 2008 2009 2010 2011 2012 2013 2014 201515
16
17
18
19
20
21
22
23
24 Household Debt Service Ratio (% s.a.)
2005 2006 2007 2008 2009 2010 2011 2012 2013 2014 201515
20
25
30
35
40
45
50 Household Debt to Income Ratio (% s.a.)
Lack of final demand for credit… (1/2)

| 10 |
Mortgage growth is in check given financial stress among households and the higher Selic rate.
Lower savings deposits. In 2015, Brazilian households have begun reducing savings deposits for the first time in many years.
Locus of resiliency. The lack of funding has not yet affected mortgage expansion. Construction was responsible for the better than expected 1Q15 GDP.
2010 2011 2012 2013 2014 2015300,000,000
350,000,000
400,000,000
450,000,000
500,000,000
550,000,000
600,000,000
650,000,000
700,000,000
Savings Deposits(R$bn)
Lack of final demand for credit… (2/2)
Mar-11 Sep-11 Mar-12 Sep-12 Mar-13 Sep-13 Mar-14 Sep-14 Mar-150
100
200
300
400
500
600
700
800
-10%
0%
10%
20%
30%
40%
50%
60%
70%
80%New Loans - Individuals - MortgagesAverage per Working Day
YoY%
BRLbn

| 11 |
… this explains the lack of demand for investment credit
Credit growth among public-sector banks may reach single digits in 2015.
BNDES will decrease anyway. Without an improvement in profits (less final demand and higher costs), companies have stopped investing.
It is not only supply. In spite of subsidized interest rates and a mandate to lend more, credit has slowed down among public-sector banks as well since 2013.
2007 2008 2009 2010 2011 2012 2013 2014 2015 100000.000
150000.000
200000.000
250000.000
300000.000
350000.000 Applications for BNDES Loans(R$bn, TTM)
-34%
0%
5%
10%
15%
20%
25%
30%
35%
40% Credit Growth (%YoY)
Public Sector Banks
Private Sector Banks

| 12 |
A stable delinquency rate doesn´t mean stable credit quality.
Deterioration. NPLs are gradually increasing in the system.
Differentiation. NPLs related to public-sector banks have risen 29% YoY, which compares to their 15% YoY credit growth.
Will there be a further slowdown ahead?
Mar-12 Sep-12 Mar-13 Sep-13 Mar-14 Sep-14 Mar-1550,000
55,000
60,000
65,000
70,000
75,000
80,000
85,000
90,000
95,000
-10%
0%
10%
20%
30%
40%
50%NPLs
% YoY R$bn
Jan-11 Jul-11 Jan-12 Jul-12 Jan-13 Jul-13 Jan-14 Jul-14 Jan-15-20%
-10%
0%
10%
20%
30%
40%
50%
60% NPLs (%YoY)
Private Sector Banks
Public Sector Banks

| 13 |
Credit supply expansion faces constraints as well.
NPLs are rising faster than credit related to BNDES loans…
…and mortgages.
The consequences of credit misallocation
Mar-12 Sep-12 Mar-13 Sep-13 Mar-14 Sep-14 Mar-15-100%
-50%
0%
50%
100%
150%
BNDES for Companies – Volumes & NPLs(% YoY)
NPLs
Outstanding Balances
4 410%
15%
20%
25%
30%
35%
40%
45%
50% Mortgages - Volumes and NPLs(% YoY)
NPLs
Outstanding Balances

| 14 |
Delinquency should gradually rise in 2015.
Optimism? In early 2014, the consensus was that Brazil’s GDP would grow by 2.5% in 2015.
Credit: Another way of looking at delinquency rates
-6
-4
-2
0
2
4
6
4
5
6
7Actual GDP Growth (-) Expected 1 Year Before
Average Delinquency Rate in Non-Earmarked Modalities

| 15 |
Deleveraging allows room to reshuffle economic resources towards a more efficient allocation (perhaps two years from now?).
Efficiency in capital allocation ahead. In the past three years, ¾+ of credit growth came with arbitrary interest rates.
Private-sector deleveraging: Is the glass half empty or half full?
2005 2006 2007 2008 2009 2010 2011 2012 2013 2014 20150%
10%
20%
30%
40%
50%
60%
70%
80%
90% Contribution for YoY Credit Growth
Public Sector Banks
Earmarked Credit
2011 2012 2013 2014 201518%
20%
22%
24%
26%
28%
30%
32% Credit/GDP
Public Sector Banks
Private Sector Banks
A smoother process? Among private-sector banks, deleveraging began two years ago, without any solvency concerns.

| 16 |
The public-sector deleveraging: the main components…20
00
2001
2002
2003
2004
2005
2006
2007
2008
2009
2010
2011
2012
2013
12%
13%
14%
15%
16%
17%
18%
19%
20% Gross Domestic Savings (% of GDP)
Tax cuts for consumption
IPI for vehicles, white line goods
Public-sector banks for consumption
Lower interest rates in public banks even in non-subsidized modalities
BNDES Loans
The selection of “winners” and “losers”
Management of administered prices
Distortions to avoid demand controls
Incentives to hoard labor
Payroll tax cuts in selected sectorsThe current adjustment will have been successful if it manages to drive the savings rate back to the upper-teen level…
Reversed!
Reversing
Reversing
Reversed!
To be reversed?

| 17 |
… and what it is not.20
00
2001
2002
2003
2004
2005
2006
2007
2008
2009
2010
2011
2012
2013
-5%
0%
5%
10%
15%
20%
25%
30%
35% Gross Domestic Savings (% of GDP)
A smaller/more efficient state
Thus far, the fiscal adjustment has been based on tax hikes and investment cuts.
…but it is not taking the savings rate to a whole new level, compatible with stronger, sustainable growth
Reforms for long-term solvency
Structural expenditure cuts depend on reforms yet to be seen.

| 18 |
Inflation: It is not all about “administered prices”
IPCA Estimate 2015: 8.3%
IPCA Estimate 2016: 5.4%
2009 2010 2011 2012 2013 2014 2015 20160
1
2
3
4
5
6
7
8
9
10
11
12
13
14 13.4
5.0
6.7
5.6
IPCA (% YoY)
Administered prices
Market prices
IPCA
Above the target. Both administered and market inflation should remain at above 4.5% in 2016.
Strong assumptions. Our IPCA forecast of 5.4% for 2016 assumes strong service disinflation (real wages falling by 4% in 2015 and -3% in 2016.
2008 2009 2010 2011 2012 2013 2014 2015 20163.5
4.5
5.5
6.5
7.5
8.5
9.5
10.5IPCA (%YoY)
Serviços
IPCA

| 19 |
Deleveraging x adjustment: Higher or lower interest rates?
Credit: although moderation will happen, credit in public banks is still growing more than two times nominal GDP.
Fiscal: efforts so far will have at stopped most deterioration. The nominal deficit continues to be the highest on record.
Inertia: What is globally known as “price rigidity” in Brazil becomes “inflation rigidity”: a minimum wage rule and wage readjustments in general.
Selic rate unlikely to be cut before 2Q16
Global Liquidity: A potential hike in US rates could reduce investors’ leniency.
Price shocks: If the rains normalize, we may see a meaningful reduction in electricity prices in 2017. But, remaining comfortable when inflation is at close to 6%, means no room for shocks.
Political cycle: Cutting interest rates before inflation is in a comfortable terrain increases the chances of a Selic hike in 2018, when a recovery may be coming.
1999 2001 2003 2005 2007 2009 2011 20130%
1%
2%
3%
4%
5%
6%
7%
8%
9% Public Sector Nominal Deficit(% GDP)
The worst fiscal result on record, combined with potential changes in global liquidity, are the main challenges for the BCB to start cutting rates.
| 20 |
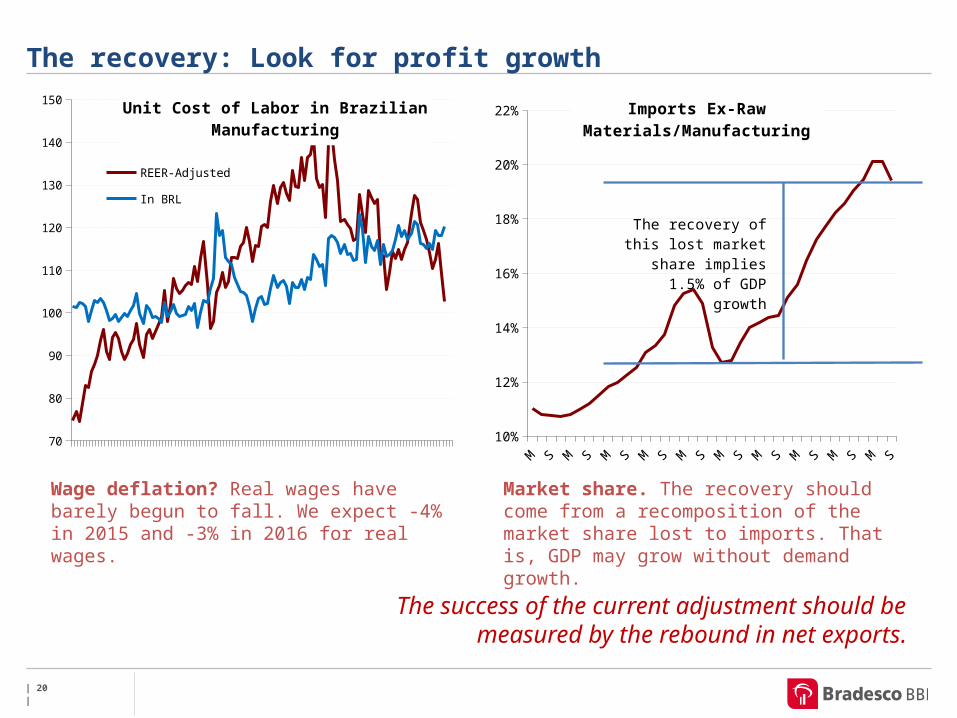
The success of the current adjustment should be measured by the rebound in net exports.
Wage deflation? Real wages have barely begun to fall. We expect -4% in 2015 and -3% in 2016 for real wages.
Market share. The recovery should come from a recomposition of the market share lost to imports. That is, GDP may grow without demand growth.
The recovery: Look for profit growth
2005 2006 2007 2008 2009 2010 2011 2012 2013 2014 201570
80
90
100
110
120
130
140
150 Unit Cost of Labor in Brazilian Manufactur-ing
REER-Adjusted
In BRL
2005 2006 2007 2008 2009 2010 2011 2012 2013 201410%
12%
14%
16%
18%
20%
22% Imports Ex-Raw Materials/Manufacturing
The recovery of this lost market share implies 1.5% of GDP growth

| 21 |
Being longer-term positive? Why not…
No housing bubble/no broken banking system: If anything, this a very strong feature, since it will allow Brazil to re-leverage again (credit cycle). With decent fiscal and inflation indicators, the surprise can be only seen on the upside once this happens.
Unconventional monetary policy: Although Brazil is QE-like in its BNDES balance sheet expansion, this is more a fiscal problem than a major distorting monetary policy process. And it has totaled around 9% of GDP.
Misallocation of capital/malinvestments: This process is probably proportional to the level of investment. Brazil never invested more than 19% of GDP. Somewhat well-behaved even in good times.
Not as “debt-infested”: According to McKinsey (MGI report, Feb. 2015), Brazil ranked 34th among 47 countries that leveraged more their economies between 2007 and 2014.

| 22 |
Main macroeconomic forecasts
Main Economic Indicators2011 2012 2013 2014e 2015e 2016e 2017-21e
Real GDP growth (%, IBGE) 3.9 1.8 2.7 0.1 -2.0 0.3 3.0IPCA (inflation target, IBGE, %YoY) 6.5 5.8 5.9 6.4 8.3 5.4 4.4SELIC (target, year end, %) 11.00 7.25 10.00 11.75 13.75 12.00 8.85R$/US$ (year end) 1.88 2.04 2.34 2.66 3.25 3.40 3.83Primary balance (% of GDP) -3.1 -2.4 -1.9 0.6 -0.5 -1.1 -1.9Net public debt (% of GDP, Dec) 34.5 35.3 33.6 36.8 37.6 39.5 40.6Bank credit (% growth, Dec) 18.8 16.4 14.7 11.3 5.5 7.0 7.7Current account (% of GDP) -2.0 -2.2 -3.4 -4.4 -4.3 -3.8 -2.5

| 23 |
Appendix

| 24 |
Public finances in 2016: A summary • Feb/2015 – Head of Lower house election
• PT’s candidate Arlindo Chinaglia lost to Eduardo Cunha (PMDB)
• Feb/2015 – “Mandatory Budget”
• Approval of a constitutional amendment that forces the payment of congressional amendments to the budget, up to 1.2% of net revenues (previous amendments were targets for budget cuts)
• Feb/2015 – Ministerial Audiences
• 39 ministers need to go on a regular basis to Congress to explain how their ministries are performing
• Mar/2015 – Merging political parties
• The project stipulates that a new party can merge with an existing one only after 5 years
• Apr/2015 – Outsourcing• The lower house approved a bill that will allow the outsourcing of a company’s core business
• May/2015 – Retirement age for judges
• The constitutional amendment increases the retirement age from 70 to 75 years old for judges at the Supreme Court
• Mar/2015 – Payroll tax cuts
• Senate rejected a provisional measure to roll back payroll tax cuts. The PM had to be resent as a bill, with a lengthier approval process
• May/2015 –Fiscal Adjustment
• The lower house approved a diluted versions of MP 664 and 665. Fator previdenciário is revoked (pension’s actuarial rule).
û
ü
û
û
û
û
û
û

| 25 |
Adjustments: three building blocks, constraints and phases
Macroeconomic Adjustment
Microeconomic Adjustment
Capital Allocation Governance
Realigning demand and supply growth
“Normalization” of administered prices
Removal of tax distortions
Definition of government’s and market’s stakes in the process of allocating capital in the economy
Fiscal Limits Popular Support Global Liquidity
Phase 1: Announcement
Phase 2: ImpactsPhase 3: Recovery
1 quarter
More to come
2 - 4 quarters
Higher unemployment Lower tax collections Lower fiscal results
More measures?
> 4 quarters
Lower labor cost + new credit cycle investment-led recovery
+ Currency depreciation export led recovery
Bu
ild
ing
Blo
cks
Co
nst
rain
tsP
has
es
Budget rigidity
Economy’s capacity to absorb more taxes
Reaction to higher taxes when unemployment rates are rising
Market’s tolerance towards fiscal results

| 26 |
Disclaimer
This material has been prepared by Bradesco Corretora and is being provided to you for your information only. No
portion of this document may be copied. photocopied or duplicated in any form. or by any means. or redistributed
without prior consent from Bradesco Corretora. The information. opinions. estimates and projections represent the
current date and are subject to modifications without prior notice. due to market conditions.
Bradesco S/A CTVMTel: +55 11 2178-5757Avenida Paulista, 1.450 – 7º andar - 01310-917São Paulo - SP - Brasil