june 2011 utah water supply report
TRANSCRIPT

8/6/2019 June 2011 Utah Water Supply Report
http://slidepdf.com/reader/full/june-2011-utah-water-supply-report 1/45
June, 2011
Flooded farmland near Marysvale on the Sevier River, May 28, 2011. Photo by Randy
Julander
Utah Water Supply
Outlook Report

8/6/2019 June 2011 Utah Water Supply Report
http://slidepdf.com/reader/full/june-2011-utah-water-supply-report 2/45
For more water supply and resource management information, contact:
Snow Survey Staff, 245 N Jimmy Doolittle Rd, SLC Utah, 84041 - Phone: (801)524-5213Travis Thomasen, Area Conservationist, 340 N. 600 E., Richfield, UT 84701 - Phone: (435) 896-6441Kerry Goodrich, Area Conservationist, 2871 S Commerce Way, Ogden UT 84401 (801)629-0580 x15 Barry Hamilton, Area Conservationist, 540 W, Price River Dr. Price, UT 84501-2813 - Phone: (435) 637-0041Internet Address: http://www.ut.nrcs.usda.gov/snow/
Water Supply Outlook Reportsand
Water Supply Outlook Reportsand Federal - State - Private Cooperative Snow Surveys
How forecasts are made
Most of the annual streamflow in the western United States originates as snowfall that has accumulated in the mountains
during the winter and early spring. As the snowpack accumulates, hydrologists estimate the runoff that will occur when itmelts. Measurements of snow water equivalent at selected manual snowcourses and automated SNOTEL sites, along with
precipitation, antecedent streamflow, and indices of the El Niño / Southern Oscillation are used in computerized statistical
and simulation models to prepare runoff forecasts. These forecasts are coordinated between hydrologists in the Natural
Resources Conservation Service and the National Weather Service. Unless otherwise specified, all forecasts are for flowsthat would occur naturally without any upstream influences.
Forecasts of any kind, of course, are not perfect. Streamflow forecast uncertainty arises from three primary sources: (1)
uncertain knowledge of future weather conditions, (2) uncertainty in the forecasting procedure, and (3) errors in the data.
The forecast, therefore, must be interpreted not as a single value but rather as a range of values with specific probabilities
of occurrence. The middle of the range is expressed by the 50% exceedance probability forecast, for which there is a 50%
chance that the actual flow will be above, and a 50% chance that the actual flow will be below, this value. To describe the
expected range around this 50% value, four other forecasts are provided, two smaller values (90% and 70% exceedanceprobability) and two larger values (30%, and 10% exceedance probability). For example, there is a 90% chance that the
actual flow will be more than the 90% exceedance probability forecast. The others can be interpreted similarly.
The wider the spread among these values, the more uncertain the forecast. As the season progresses, forecasts become
more accurate, primarily because a greater portion of the future weather conditions become known; this is reflected by a
narrowing of the range around the 50% exceedance probability forecast. Users should take this uncertainty into
consideration when making operational decisions by selecting forecasts corresponding to the level of risk they are willing
to assume about the amount of water to be expected. If users anticipate receiving a lesser supply of water, or if they wish
to increase their chances of having an adequate supply of water for their operations, they may want to base their decisions
on the 90% or 70% exceedance probability forecasts, or something in between. On the other hand, if users are concerned
about receiving too much water (for example, threat of flooding), they may want to base their decisions on the 30% or
10% exceedance probability forecasts, or something in between. Regardless of the forecast value users choose for
operations, they should be prepared to deal with either more or less water. (Users should remember that even if the 90%
exceedance probability forecast is used, there is still a 10% chance of receiving less than this amount.) By using the
exceedance probability information, users can easily determine the chances of receiving more or less water.
The U.S. Department of Agriculture (USDA) prohibits discrimination in all its programs and activities on the basis of race, color, national origin, age,
disability, sex, marital status, familial status, parental status, religion, sexual orientation, genetic information, political beliefs, reprisal, or because all or a part
of an individual's income is derived from any public assistance program. (Not all prohibited bases apply to all programs.) Persons with disabilities who require
alternative means for communication of program information (Braille, large print, audiotape, etc.) should contact USDA's TARGET Center at (202) 720-2600
(voice and TDD). To file a complaint of discrimination write to USDA, Director, Office of Civil Rights, 1400 Independence Avenue, S.W., Washington, D.C.
20250-9410 or call (800) 795-3272 (voice) or (202) 720-6382 (TDD). USDA is an equal opportunity provider and employer.

8/6/2019 June 2011 Utah Water Supply Report
http://slidepdf.com/reader/full/june-2011-utah-water-supply-report 3/45
STATE OF UTAH GENERAL OUTLOOKJune 1, 2011
SUMMARY
Snowpacks are much above average over most of Utah with the exception of southeast Utah and the Escalantebasins which have melted out. May continued the cool wet pattern started in March. Southern Utah has melted
about 50% of the total snowpack across those watersheds whereas in a normal year, snowpacks would be 80%
to 85% melted. In contrast to the relatively better behaved snowpacks of southern Utah where a more sequentialsnowmelt is in process, the Bear River in northern Utah has melted a paltry 12% of its total snowpack leaving
nearly 90% to melt in the next few weeks. Normally 70% to 75% of the Bear River watersheds snowpack would
be melted by June 1. The numbers are staggering – 5 times the average amount of snow remains to melt on theBear River and the snowmelt season has been effectively shortened by as much as 8 weeks. The numbers are
similar on the Weber and Provo watersheds and on the Uintah Basin – only 3.8 times the average amount of
snow to melt makes it look tame in comparison. The probability of getting at least some very warm
temperatures and high energy input to snowpacks over the next 4 weeks is very high and should these occur,streamflows will respond very quickly. We are very near the time when even average temperatures will cause
rapid snowmelt. Last month’s Bear Lake inflow was a record high and the inflow for May at 179.9 KAF is in 4 th
place out of nearly 100 years of record – with nearly 90% of its snowpack yet to melt! Many agricultural areas
are feeling the impacts of too much water with inundation common as well as the inability to access and workthe farmlands for plowing and planting. Weather conditions of this spring will have many adverse impacts on
agricultural production.
SNOWPACK
June first snowpacks as measured by the NRCS SNOTEL system are as follows: Bear - 507% (record high),Weber - 500%(record high), Provo - 563%(record high), Uintahs - 377%(near record high), southeast Utah -
459%, Sevier - 327%, southwest Utah - 402% and the statewide figure is 476% of average(record high).
PRECIPITATION
Mountain precipitation as measured by the NRCS SNOTEL system during April was: Bear – 155%, Weber –166%, Provo – 185%, Uintahs – 186%, SE Utah – 170%, Sevier – 194%, SW Utah – 177% and the statewide
figure is 177% of average. This brings the seasonal accumulation (Oct-May) to 150% of average statewide.
RESERVOIRS
Storage in 41 of Utah’s key irrigation reservoirs is at 85% of capacity, 10% more than last year. Reservoir
storage by Basin: Bear – 61%, Weber – 82%, Provo – 101%, Uintah Basin – 88%, SE Utah – 68%, Sevier –90%, SW Utah – 89% of capacity.
STREAMFLOW
Snowmelt streamflows are expected to be above to much above average across the state this year. Most flowsare forecast to be in the 160% to 250% range. Streamflows are responding quickly to snowmelt and saturated
soils with many sites running in the upper 10% of recorded flows. There is a huge snowpack yet to melt in
northern Utah and streamflows will high in volume and long in duration.

8/6/2019 June 2011 Utah Water Supply Report
http://slidepdf.com/reader/full/june-2011-utah-water-supply-report 4/45
0
5
10
15
20
25
30
35
40
1‐Jan 1‐Feb 1‐Mar 1‐Apr 1‐May 1‐Jun
S n o w W a t e r E q u i v a l e n t ( i n )
Statewide
Mountain Snowpack
Current Average
Max imum Mi ni mu m
6/1/2011
0
20
40
60
80
100
120
140
160
180
200
220
240
260
280
300
Oc t N ov D ec J an F eb Mar Ap r M ay J un
P e r c e n t o f A v e r a g e
Statewide
Precipitation
Monthly Year‐to‐date
6/1/2011
Bear ‐ Basin
Weber ‐ Basin
Provo ‐ Basin
Duchesne‐Basin
SEUtah
Sevier ‐ Basin
SWUtah
State
June Statewide Reservoir StoragePrevious Yr % Capacity Basin % Capacity

8/6/2019 June 2011 Utah Water Supply Report
http://slidepdf.com/reader/full/june-2011-utah-water-supply-report 5/45
!!
!!
!!
!!
!!
!!
!_̂(
Moab
Provo
Ogden
Logan
Roosevelt
Salt Lake City
Sevier River
Southeastern Utah
Virgin River
Dirty Devil
Bear River
Price - San Rafael
Duchesne River
Escalante River
Beaver River
Green River
Provo-Utah-
Jordan
Tooele-
Vernon
Bear River
0
0
383
420
444
517
489
388
568
513
214
304
544
489
§̈¦70
Utah
SNOTEL Current Snow Water Equivalent (SWE)
% of Normal
0 20 40 60 80 10010
Miles
§̈¦15
§̈¦80
Provisional DataSubject to Revision
G r e a t S a l t L a k e
Snow Water Equivalent (SWE)Basin-widePercent of 1971-2000Normal
unavailable *
<50%
50 - 69%
70 - 89%
90 - 109%
110 - 129%
130 - 149%
>=150%
un 01, 2011
St. George
* Data unavailable at timeof posting or measurement is not representative at thistime of year
Weber Ogden
Prepared by the USDA/NRCS National Water and Climate CentPortland, Oregon http://www.wcc.nrcs.usda.gov/gis/Based on data from http://www.wcc.nrcs.usda.gov/reports/Science contact: [email protected] 503 414 3047
The snow water equivalent percent of normal represents the currentsnow water equivalent found at selected SNOTEL sites in or near the basincompared to the average value for those sites on this day. Data based onthe first reading of the day (typically 00:00).

8/6/2019 June 2011 Utah Water Supply Report
http://slidepdf.com/reader/full/june-2011-utah-water-supply-report 6/45
!!
!!
!!
!!
!!
!!
!_̂(
Moab
Provo
Ogden
Logan
Roosevelt
Salt Lake City
Sevier River
Southeastern Utah
Virgin River
Dirty Devil
Bear River
Price - San Rafael
Duchesne River
Escalante River
Beaver River
Green River
Provo-Utah-
Jordan
Tooele-Vernon
Bear River
114
156
177
153
156
153
152
156
153
149
165
140
149
153
§̈¦70
Utah
SNOTEL Water Year (Oct 1) to Date Precipitation
% of Normal
0 20 40 60 80 10010
Miles
§̈¦15
§̈¦80
Provisional DataSubject to Revision
G r e a t S a l t L a k eWater Year
(Oct 1) to DatePrecipitationBasin-widePercent of 1971-2000
Normalunavailable *
<50%
50 - 69%
70 - 89%
90 - 109%
110 - 129%
130 - 149%
>=150%
Jun 01, 2011
St. George
* Data unavailable at timeof posting or measurement is not representative at thistime of year
Weber Ogden
Prepared by the USDA/NRCS National Water and Climate CentPortland, Oregon http://www.wcc.nrcs.usda.gov/gis/Based on data from http://www.wcc.nrcs.usda.gov/reports/Science contact: [email protected] 503 414 3047
The water year to date precipitation percent of normal represents theaccumulated precipitation found at selected SNOTEL sites in or near the basincompared to the average value for those sites on this day. Data based onthe first reading of the day (typically 00:00).

8/6/2019 June 2011 Utah Water Supply Report
http://slidepdf.com/reader/full/june-2011-utah-water-supply-report 7/45
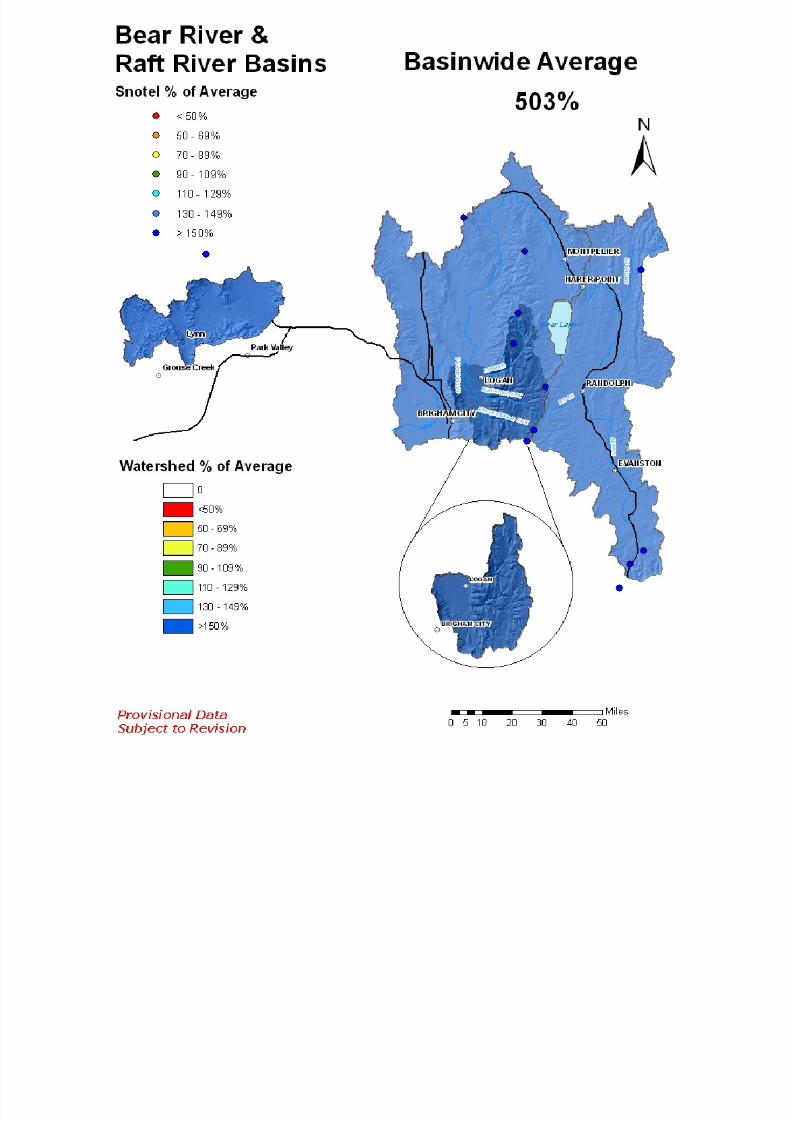
Bear River BasinJune 1, 2011
Snowpacks on the Bear River Basin are much above average at 610% of normal, and 491% of last year. May
precipitation was much above average at 158%, which brings the seasonal accumulation (Oct-May) to 145% of average
Soil moisture levels in runoff producing areas are at 83% of saturation in the upper 2 feet of soil compared to 78% lastyear. Forecast streamflows (June-July) are much above average (205%-375%) volumes for this spring and summer
Reservoir storage is at 61% of capacity, which is 19% higher than this time last year. The Surface Water Supply Index is
at 64% for the Bear River, in other words, 36% of years have had more total water available. Overall water supplyconditions are above average.
0%
20%
40%
60%
80%
100%
O ct Nov De c Jan Fe b M ar A pr May Jun Jul A ug Se p
S a t u r a t i o
n , v o l u m e %
Bear River Soil MoistureWY 2011 mean
Percent saturation is calculated using the weighted average of volumetric soil
moisture content at 2, 8, and 20‐inch depths. Saturation is estimated as 40%
volumetric water content. The gray area represents the range in saturation
values since 2005.
0
5
10
15
20
25
30
35
40
1‐Jan 1‐Feb 1‐Mar 1‐Apr 1‐May 1
S n o w W a t e r E q u i v a l e n t
( i n )
Bear River Snowpack
Current Average
Maximum Minimum
6/1/201
0
20
40
60
80
100
120
140
160
180
200
220
240
260
280
300
O ct N ov Dec Jan F eb Mar A pr May Jun
P e r c e n t o f A
v e r a g e
Bear River Precipitation
Monthly Yea r‐to‐date
6/1/2011
Bear Lake
Woodruff Narrows
Woodruff Creek
Hyrum
Porcupine
Bear ‐ Basin
June Bear River Reservoir Storage
Previous Yr % Capac ity Curre nt % Capacit
8/6/2019 June 2011 Utah Water Supply Report
http://slidepdf.com/reader/full/june-2011-utah-water-supply-report 8/45
8/6/2019 June 2011 Utah Water Supply Report
http://slidepdf.com/reader/full/june-2011-utah-water-supply-report 9/45
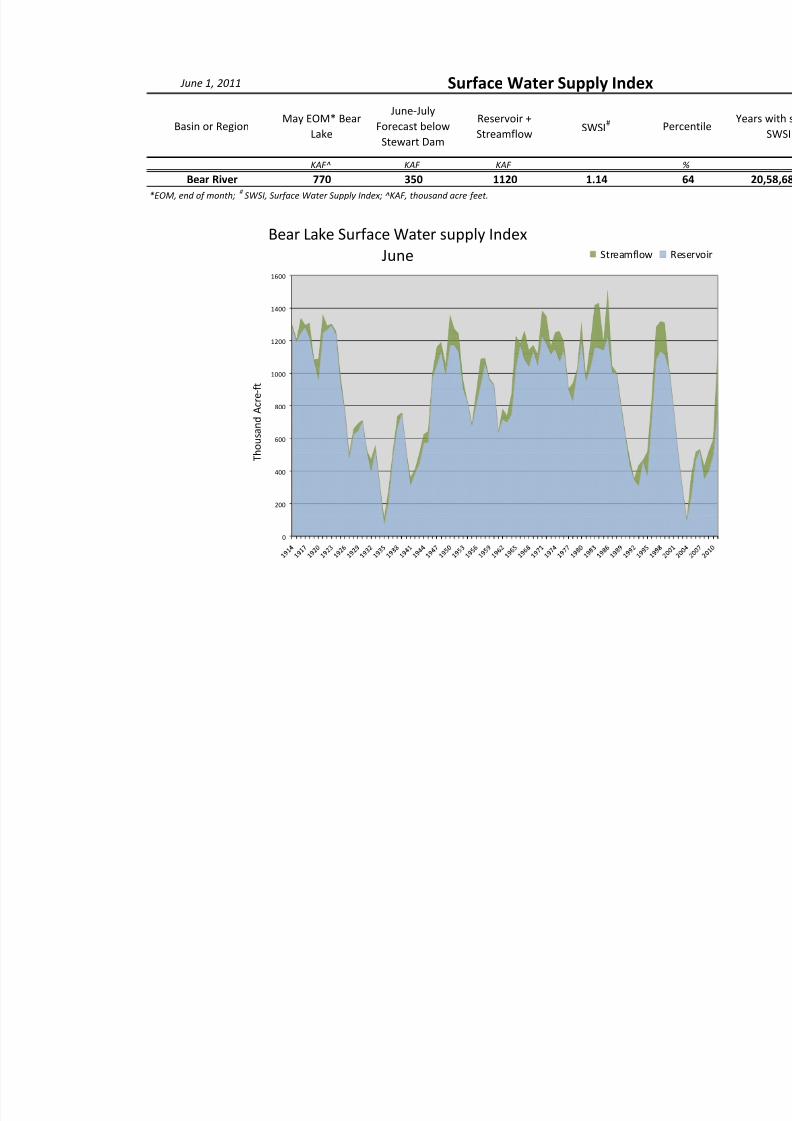
June 1, 2011
Basin or RegionMay EOM* Bear
Lake
June‐July
Forecast below
Stewart Dam
Reservoir +
StreamflowSWSI
#
KAF^ KAF KAF
Bear River 770 350 1120 1.14
Surface Water Supply Index
*EOM, end of month; #
SWSI, Surface Water Supply Index; ^KAF, thousand acre‐ feet.
0
200
400
600
800
1000
1200
1400
1600
T h
o u s a n d
A c r e
‐ f t
Bear Lake Surface Water supply Index
June Streamflow

8/6/2019 June 2011 Utah Water Supply Report
http://slidepdf.com/reader/full/june-2011-utah-water-supply-report 10/45
BEAR RIVER BASIN as of June 1, 2011
==================================================================================================================================
BEAR RIVER BASIN
Streamflow Forecasts - June 1, 2011
==================================================================================================================================
| <<====== Drier ====== Future Conditions ======= Wetter =====>> |
| |
Forecast Point Forecast | ==================== Chance Of Exceeding * ====================== |
Period | 90% 70% | 50% | 30% 10% | 30-Yr Avg.
| (1000AF) (1000AF) | (1000AF) (% AVG.) | (1000AF) (1000AF) | (1000AF)
====================================================================|=======================|=====================================
Bear R nr UT-WY State Line APR-JUL 205 215 | 225 199 | 235 245 113
JUN-JUL 174 183 | 190 271 | 197 205 70
| |
Bear R ab Res nr Woodruff APR-JUL 330 345 | 360 265 | 375 390 136
JUN-JUL 220 230 | 240 375 | 250 260 64
| |
Big Ck nr Randolph APR-JUL 15.30 15.70 | 16.00 327 | 16.30 16.70 4.90
JUN-JUL 6.70 7.10 | 7.40 322 | 7.70 8.10 2.30
| |
Smiths Fk nr Border APR-JUL 153 161 | 167 162 | 173 181 103
JUN-JUL 111 119 | 125 205 | 131 139 61
| |
Bear R bl Stewart Dam APR-JUL 510 560 | 595 254 | 630 680 234
JUN-JUL 295 325 | 350 318 | 375 405 110
| |
Little Bear R at Paradise APR-JUL 88 96 | 102 222 | 108 116 46
JUN-JUL 35 38 | 40 336 | 42 45 11.9
| |
Logan R nr Logan APR-JUL 205 225 | 235 187 | 245 265 126
JUN-JUL 157 165 | 170 243 | 175 183 70
| |
Blacksmith Fork nr Hyrum APR-JUL 100 112 | 120 250 | 128 140 48
JUN-JUL 45 50 | 53 265 | 56 61 20
| |
Dunn Ck nr Park Valley APR-JUL 3.20 4.30 | 5.00 161 | 5.70 6.80 3.10
JUN-JUL 0.10 1.99 | 3.60 217 | 5.00 7.10 1.66| |
==================================================================================================================================
BEAR RIVER BASIN | BEAR RIVER BASIN
Reservoir Storage (1000 AF) - End of May | Watershed Snowpack Analysis - June 1, 2011
==================================================================================================================================
Usable | *** Usable Storage *** | Number This Year as % of
Reservoir Capacity| This Last | Watershed of =================
| Year Year Avg | Data Sites Last Yr Average
========================================================================|=========================================================
BEAR LAKE 1302.0 769.6 498.8 --- | BEAR RIVER, UPPER 8 432 449
|
HYRUM 15.3 11.4 15.7 14.4 | BEAR RIVER, LOWER 9 519 569
|
PORCUPINE 11.3 11.3 11.3 10.5 | LOGAN RIVER 4 409 514
|
WOODRUFF NARROWS 57.3 47.0 57.3 40.3 | RAFT RIVER 1 178 716
|
WOODRUFF CREEK 4.0 4.1 4.0 --- | BEAR RIVER BASIN 17 557 503
|
==================================================================================================================================
* 90%, 70%, 50%, 30%, and 10% chances of exceeding are the probabilities that the actual volume will exceed the volumes in the table.
The average is computed for the 1971-2000 base period.
(1) - The values listed under the 10% and 90% Chance of Exceeding are actually 5% and 95% exceedance levels.
(2) - The value is natural volume - actual volume may be affected by upstream water management.
(3) - Median value used in place of average.

8/6/2019 June 2011 Utah Water Supply Report
http://slidepdf.com/reader/full/june-2011-utah-water-supply-report 11/45
Weber and Ogden River BasinsJune 1, 2011
Snowpacks on the Weber and Ogden Watersheds are much above average at 542%, and 564% of last year. May
precipitation was much above average at 159% bringing the seasonal accumulation (Oct-May) to 149% of average. Soi
moisture levels in runoff producing areas are at 79% of saturation in the upper 2 feet of soil compared to 73% last year.Streamflow forecasts (June-July) range from 249% to 364% of average. Reservoir storage is at 82% of capacity, 15%
lower than last year. The Surface Water Supply Index is at 98% for the Weber River and 97% for the Ogden River
indicating that overall water supply conditions are much above average.
0%
20%
40%
60%
80%
100%
Oc t Nov De c Jan Fe b M ar Apr May Jun Jul Aug Se p
S a t u r a
t i o n ,
v o l u m e %
Weber River Soil MoistureWY 2011 mean
Percent saturation is calculated using the weighted average of volumetric soil
moisture content at 2, 8, and 20‐inch depths. Saturation is estimated as 40%
volumetric water content. The gray area represents the range in saturation
values since 2005.
0
5
10
15
20
25
30
35
40
1‐Jan 1‐Feb 1‐Mar 1‐Apr 1‐May 1
S n o w W a t e r E q u i v a l e
n t ( i n )
Weber RiverSnowpack
Current Average
Max imum Min imum
6/1/2011
0
20
40
60
80
100
120
140
160
180
200
220
240
260
280
300
Oct Nov Dec Jan Feb Mar Apr May Jun
P e r c e n t o f
A v e r a g e
Weber RiverPrecipitation
Monthly Year‐to‐date
6/1/2011
Causey
Pineview
Smith&Morehouse
Rockport
Echo
Lost Creek
East Canyon
Willard Bay
Weber ‐ Basin
June Weber Basin Reservoir Storage
Previous Yr % Capacity Current % Capacity

8/6/2019 June 2011 Utah Water Supply Report
http://slidepdf.com/reader/full/june-2011-utah-water-supply-report 12/45

8/6/2019 June 2011 Utah Water Supply Report
http://slidepdf.com/reader/full/june-2011-utah-water-supply-report 13/45
June 1, 2011
Basin or RegionMay EOM*
Reservoirs
June‐July
Forecast Weber
River at Gateway
Reservoirs +
StreamflowSWSI
# Perc
KAF^ KAF KAF
Weber River 346 400 746 3.97
Surface Water Supply Index
*EOM, end of month; #
SWSI, Surface Water Supply Index; ^KAF, thousand acre‐ feet.
0
100
200
300
400
500
600
700
800
T h
o u s a n d
A c r e
‐ f t
Weber River Surface Water Supply Index
June Streamflow

8/6/2019 June 2011 Utah Water Supply Report
http://slidepdf.com/reader/full/june-2011-utah-water-supply-report 14/45
June 1, 2011
Basin or RegionMay EOM* Pine
View & Causey
June‐July
Forecast Pineview
Reservoir Inflow
Reservoir +
StreamflowSWSI
# Perc
KAF^ KAF KAF
Ogden River 104 100 204 3.93
Surface Water Supply Index
*EOM, end of month; #
SWSI, Surface Water Supply Index; ^KAF, thousand acre‐ feet.
0
50
100
150
200
250
T h
o u s a n d
A c r e
‐ f t
Ogden Surface Water Supply Index
June Streamflow

8/6/2019 June 2011 Utah Water Supply Report
http://slidepdf.com/reader/full/june-2011-utah-water-supply-report 15/45
WEBER & OGDEN WATERSHEDS in Utah as of June 1, 2011
==================================================================================================================================
WEBER & OGDEN WATERSHEDS in Utah
Streamflow Forecasts - June 1, 2011
==================================================================================================================================
| <<====== Drier ====== Future Conditions ======= Wetter =====>> |
| |
Forecast Point Forecast | ==================== Chance Of Exceeding * ====================== |
Period | 90% 70% | 50% | 30% 10% | 30-Yr Avg.
| (1000AF) (1000AF) | (1000AF) (% AVG.) | (1000AF) (1000AF) | (1000AF)
====================================================================|=======================|=====================================
Smith & Morehouse Res Inflow APR-JUL 56 58 | 59 174 | 60 62 34
JUN-JUL 45 47 | 48 251 | 49 51 19.1
| |
Weber R nr Oakley APR-JUL 205 220 | 230 187 | 240 255 123
JUN-JUL 156 169 | 177 249 | 185 198 71
| |
Rockport Res APR-JUL 235 255 | 270 202 | 285 305 134
JUN-JUL 163 176 | 185 257 | 194 205 72
| |
Weber R nr Coalville APR-JUL 250 265 | 280 204 | 295 310 137
JUN-JUL 161 175 | 184 271 | 193 205 68
| |
Chalk Ck at Coalville APR-JUL 100 109 | 116 258 | 123 132 45
JUN-JUL 46 55 | 60 349 | 65 74 17.2
| |
Echo Res Inflow APR-JUL 320 355 | 380 212 | 405 440 179
JUN-JUL 174 200 | 220 265 | 240 265 83
| |
Lost Ck Resv Inflow APR-JUL 35 40 | 43 244 | 46 51 17.6
JUN-JUL 11.80 13.70 | 15.00 326 | 16.30 18.20 4.60
| |
East Canyon Ck nr Jeremy Ranch APR-JUL 40 42 | 44 310 | 46 48 14.2
JUN-JUL 12.80 14.70 | 16.00 364 | 17.30 19.20 4.40
| |
East Canyon Ck nr Morgan APR-JUL 65 70 | 74 239 | 78 83 31
JUN-JUL 25.00 28.00 | 30.00 319 | 32.00 35.00 9.40| |
Weber R at Gateway APR-JUL 660 745 | 800 225 | 855 940 355
JUN-JUL 335 375 | 400 318 | 425 465 126
| |
SF Ogden R nr Huntsville APR-JUL 95 116 | 131 205 | 146 167 64
JUN-JUL 42 46 | 48 296 | 50 54 16.2
| |
Pineview Res Inflow APR-JUL 200 250 | 285 214 | 320 370 133
JUN-JUL 76 90 | 100 333 | 110 124 30
| |
Wheeler Ck nr Huntsville APR-JUL 6.70 8.10 | 9.00 143 | 9.90 11.30 6.30
JUN-JUL 6.10 6.90 | 7.40 352 | 7.90 8.70 2.10
| |
Centerville Ck APR-JUL 3.10 3.40 | 3.60 281 | 3.80 4.10 1.28
JUN-JUL 0.53 1.24 | 1.74 311 | 2.30 2.90 0.56
APR-JUL 3.10 3.40 | 3.60 281 | 3.80 4.10 1.28
JUN-JUL 0.53 1.24 | 1.74 311 | 2.30 2.90 0.56
| |
==================================================================================================================================
WEBER & OGDEN WATERSHEDS in Utah | WEBER & OGDEN WATERSHEDS in Utah
Reservoir Storage (1000 AF) - End of May | Watershed Snowpack Analysis - June 1, 2011
==================================================================================================================================
Usable | *** Usable Storage *** | Number This Year as % of
Reservoir Capacity| This Last | Watershed of =================
| Year Year Avg | Data Sites Last Yr Average
========================================================================|=========================================================
CAUSEY 7.1 7.3 7.1 6.7 | OGDEN RIVER 4 659 438
|
EAST CANYON 49.5 46.0 49.5 46.8 | WEBER RIVER 9 497 546
|
ECHO 73.9 52.9 73.3 66.7 | WEBER & OGDEN WATERSHEDS 13 541 505
|
LOST CREEK 22.5 22.0 20.7 20.3 |
|
PINEVIEW 110.1 96.9 110.1 97.7 |
|
ROCKPORT 60.9 32.2 60.6 49.1 |
|
WILLARD BAY 215.0 189.6 188.4 174.3 |
|
==================================================================================================================================
* 90%, 70%, 50%, 30%, and 10% chances of exceeding are the probabilities that the actual volume will exceed the volumes in the table.
The average is computed for the 1971-2000 base period.
(1) - The values listed under the 10% and 90% Chance of Exceeding are actually 5% and 95% exceedance levels.
(2) - The value is natural volume - actual volume may be affected by upstream water management.
(3) - Median value used in place of average.
8/6/2019 June 2011 Utah Water Supply Report
http://slidepdf.com/reader/full/june-2011-utah-water-supply-report 16/45
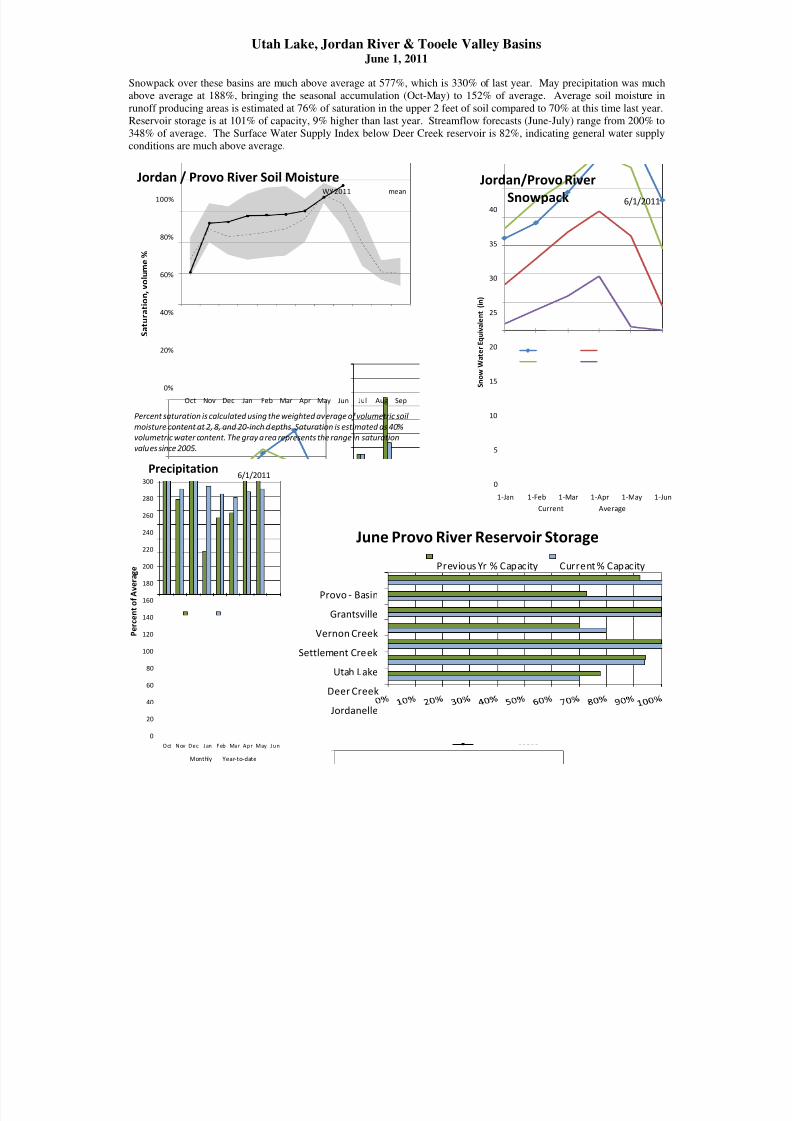
Utah Lake, Jordan River & Tooele Valley BasinsJune 1, 2011
Snowpack over these basins are much above average at 577%, which is 330% of last year. May precipitation was much
above average at 188%, bringing the seasonal accumulation (Oct-May) to 152% of average. Average soil moisture in
runoff producing areas is estimated at 76% of saturation in the upper 2 feet of soil compared to 70% at this time last year.
Reservoir storage is at 101% of capacity, 9% higher than last year. Streamflow forecasts (June-July) range from 200% to
348% of average. The Surface Water Supply Index below Deer Creek reservoir is 82%, indicating general water supply
conditions are much above average.
0
20
40
60
80
100
120
140
160
180
200
220
240
260
280
300
O ct N ov Dec Jan F eb Mar A pr May Jun
P e r c e n t o f A v e r a g e
Jordan/Provo RiverPrecipitation
Monthly Year-to-date
6/1/2011
0%
20%
40%
60%
80%
100%
Oct Nov Dec Jan Feb Mar Apr May Jun Jul Aug Sep
S a t u r a t i o
n , v o l u m e %
Jordan / Provo River Soil MoistureWY 2011 mean
Percent saturation is calculated using the weighted average of volumetric soil
moisture content at 2, 8, and 20-inch depths. Saturation is estimated as 40%
volumetric water content. The gray area represents the range in saturation
values since 2005.
0
5
10
15
20
25
30
35
40
1-Jan 1-Feb 1-Mar 1-Apr 1-May 1-J
S n o w W a t e r E q u i v a l e n t ( i n
)
Jordan/Provo River
Snowpack
Current Average
Maximum Minimum
6/1/2011
Jordanelle
Deer Creek
Utah Lake
Settlement Creek
Vernon Creek
Grantsville
Provo - Basin
June Provo River Reservoir Storage
Previous Yr % Capacity Current % Capacity

8/6/2019 June 2011 Utah Water Supply Report
http://slidepdf.com/reader/full/june-2011-utah-water-supply-report 17/45

8/6/2019 June 2011 Utah Water Supply Report
http://slidepdf.com/reader/full/june-2011-utah-water-supply-report 18/45
June 1, 2011
Basin or RegionMay EOM* Deer
Creek, Jordanelle
June - July
Forecast Provo
River below Deer
Creek
Reservoir +
StreamflowSWSI
# PercentileYears with
similar SWSI
KAF^ KAF KAF %
Provo River 365 160 525 2.65 82 86,98,84,93
Surface Water Supply Index
*EOM, end of month; # SWSI, Surface Water Supply Index; ^KAF, thousand acre-feet.
0
100
200
300
400
500
600
700
T h o u s a n d
A c r e - f t
Provo River SWSI @ Deer Creek InflowStreamflow Reservoir

8/6/2019 June 2011 Utah Water Supply Report
http://slidepdf.com/reader/full/june-2011-utah-water-supply-report 19/45
UTAH LAKE, JORDAN RIVER & TOOELE VALLEY as of June 1, 2011
==================================================================================================================================
UTAH LAKE, JORDAN RIVER & TOOELE VALLEY
Streamflow Forecasts - June 1, 2011
==================================================================================================================================
| <<====== Drier ====== Future Conditions ======= Wetter =====>> |
| |
Forecast Point Forecast | ==================== Chance Of Exceeding * ====================== |
Period | 90% 70% | 50% | 30% 10% | 30-Yr Avg.
| (1000AF) (1000AF) | (1000AF) (% AVG.) | (1000AF) (1000AF) | (1000AF)
====================================================================|=======================|=====================================
Salt Ck at Nephi APR-JUL 7.50 16.10 | 22.00 234 | 28.00 37.00 9.40
JUN-JUL 8.80 10.20 | 11.20 246 | 12.20 13.60 4.56
| |
Spanish Fk at Castilla APR-JUL 97 138 | 166 216 | 194 235 77
JUN-JUL 30 57 | 75 289 | 93 120 26
| |
Provo R nr Woodland APR-JUL 122 152 | 174 169 | 198 235 103
JUN-JUL 107 121 | 130 250 | 139 153 52
| |
Provo R nr Hailstone APR-JUL 128 168 | 198 182 | 230 285 109
JUN-JUL 104 125 | 140 264 | 156 182 53
| |
Provo R bl Deer Ck Dam APR-JUL 210 230 | 245 194 | 260 280 126
JUN-JUL 139 152 | 160 242 | 168 181 66
| |
American Fk ab Upper Powerplant APR-JUL 53 59 | 62 194 | 65 71 32
JUN-JUL 42 47 | 50 250 | 53 58 20
| |
Utah Lake Inflow APR-JUL 525 725 | 865 266 | 1000 1210 325
JUN-JUL 121 300 | 425 348 | 550 730 122
| |
W Canyon Ck nr Cedar Fort APR-JUL 5.00 5.50 | 5.90 246 | 6.30 6.80 2.40
JUN-JUL 2.70 3.00 | 3.20 276 | 3.40 3.70 1.16
| |
L Cottonwood Ck nr SLC APR-JUL 47 54 | 60 150 | 66 75 40
JUN-JUL 40 47 | 52 200 | 57 65 26
| |Big Cottonwood Ck nr SLC APR-JUL 51 57 | 62 163 | 67 73 38
JUN-JUL 39 43 | 46 219 | 49 53 21
| |
Mill Ck nr SLC APR-JUL 9.50 11.50 | 12.90 184 | 14.30 16.30 7.00
JUN-JUL 7.00 8.00 | 8.70 242 | 9.40 10.40 3.60
| |
Parley's Ck nr SLC APR-JUL 29 33 | 35 210 | 37 41 16.7
JUN-JUL 13.40 14.90 | 16.00 276 | 17.10 18.60 5.80
| |
Dell Fk nr SLC APR-JUL 11.00 13.20 | 14.70 216 | 16.20 18.40 6.80
JUN-JUL 4.10 5.00 | 5.70 339 | 6.40 7.30 1.68
| |
Emigration Ck nr SLC APR-JUL 7.40 8.90 | 9.90 220 | 10.90 12.40 4.50
JUN-JUL 3.30 3.70 | 4.00 323 | 4.30 4.70 1.24
| |
City Ck nr SLC APR-JUL 14.80 16.80 | 18.10 208 | 19.40 21.00 8.70
JUN-JUL 11.30 12.30 | 13.00 310 | 13.70 14.70 4.20
| |
Vernon Ck nr Vernon APR-JUL 1.59 2.10 | 2.50 169 | 2.90 3.40 1.48
JUN-JUL 0.99 1.19 | 1.32 232 | 1.45 1.65 0.57
| |
Settlement Ck nr Tooele APR-JUL 2.20 3.10 | 3.70 176 | 4.30 5.20 2.10
JUN-JUL 1.95 2.30 | 2.60 248 | 2.90 3.20 1.05
| |
S Willow Ck nr Grantsville APR-JUL 7.00 7.70 | 8.20 254 | 8.70 9.40 3.23
JUN-JUL 5.40 5.80 | 6.00 332 | 6.20 6.60 1.81
| |
==================================================================================================================================
UTAH LAKE, JORDAN RIVER & TOOELE VALLEY | UTAH LAKE, JORDAN RIVER & TOOELE VALLEY
Reservoir Storage (1000 AF) - End of May | Watershed Snowpack Analysis - June 1, 2011
==================================================================================================================================
Usable | *** Usable Storage *** | Number This Year as % of
Reservoir Capacity| This Last | Watershed of =================
| Year Year Avg | Data Sites Last Yr Average
========================================================================|=========================================================
DEER CREEK 149.7 140.4 140.8 140.2 | PROVO RIVER & UTAH LAKE 7 805 485
|
GRANTSVILLE 3.3 3.3 2.4 2.8 | PROVO RIVER 4 670 474
|
SETTLEMENT CREEK 1.0 0.8 0.7 0.9 | JORDAN RIVER & GSL 6 320 619
|
STRAWBERRY-ENLARGED 1105.9 1045.5 997.0 702.5 | TOOELE & RUSH VALLEY WATE 3 457 544
|
UTAH LAKE 870.9 1064.8 870.9 905.1 | UTAH LAKE/JORDAN R./TOOEL 16 409 563
|VERNON CREEK 0.6 0.6 0.6 --- |
|
==================================================================================================================================
* 90%, 70%, 50%, 30%, and 10% chances of exceeding are the probabilities that the actual volume will exceed the volumes in the table.
The average is computed for the 1971-2000 base period.
(1) - The values listed under the 10% and 90% Chance of Exceeding are actually 5% and 95% exceedance levels.
(2) - The value is natural volume - actual volume may be affected by upstream water management.
(3) - Median value used in place of average.

8/6/2019 June 2011 Utah Water Supply Report
http://slidepdf.com/reader/full/june-2011-utah-water-supply-report 20/45
Uintah Basin and Dagget SCDs June 1, 2011
Snowpack across the Uintas is much above average at 354% which is 322% of last year. Precipitation during May was
much above average at 187% bringing the seasonal accumulation (Oct-May) to 148%. Soil moisture values in runof
producing area are at 79% of saturation in the upper 2 feet of soil compared to 64% last year. Reservoir storage is at 88%
of capacity, same as this time last year. Streamflow forecasts (May-July) range from 119% to 355% of average. The
Surface Water Supply Index for the western area is 98% and for the eastern area it is 91% indicating much above normal
conditions on the west side and above average on the eastern side. General water supply conditions are much aboveaverage.
0
5
10
15
20
25
30
35
40
1‐Jan 1‐Feb 1‐Mar 1‐Apr 1‐May 1‐Jun
S n o w W a t e r E q u i v a l e n t ( i n )
Uinta Snowpack
Current Average
Max imu m Min imu m
6/1/2011
0%
20%
40%
60%
80%
100%
Oc t Nov Dec Jan Feb Mar Apr May Jun Jul Aug Sep
S a t u r a t i o n ,
v o l u m e %
Uintah Basin Soil MoistureWY 2011 mean
Percent saturation is calculated using the weighted average of volumetric soil
moisture content at 2, 8, and 20‐inch depths. Saturation is estimated as 40%
volumetric water content. The gray area represents the range in saturation
values
since
2005.
0
20
40
60
80
100
120
140
160
180
200
220
240
260
280
300
Oct Nov Dec Jan Feb Mar Apr May Jun Jul Aug Sep
P e r c e n t o f A
v e r a g e
Uintah Precipitation
Monthly Year‐to‐date
6/1/2011
Strawberry
Currant creek
Upper Stillwater
Starvation
Moon Lake
Big Sand Wash
Red Fleet
Steinaker
Duchesne‐Basin
June Uintah Basin Reservoir Storage
Previous Yr % Capacity Current % Capacity

8/6/2019 June 2011 Utah Water Supply Report
http://slidepdf.com/reader/full/june-2011-utah-water-supply-report 21/45

8/6/2019 June 2011 Utah Water Supply Report
http://slidepdf.com/reader/full/june-2011-utah-water-supply-report 22/45
June 1, 2011
Basin or RegionMay EOM* Red
Fleet & Steinaker
June‐July
Forecast Big
Brush & Ashley
Creek
Reservoir +
StreamflowSWSI
#
KAF^ KAF KAF
Eastern Uintah 51.5 73.0 125 3.41
Surface Water Supply Index
*EOM, end of month; #
SWSI, Surface Water Supply Index; ^KAF, thousand acre‐ feet.
0
20
40
60
80
100
120
140
160
180
T h o u s a n d A c r e
‐ f t
Eastern Uintah Basin ‐ Surface Water Supply Index
June Streamflow R

8/6/2019 June 2011 Utah Water Supply Report
http://slidepdf.com/reader/full/june-2011-utah-water-supply-report 23/45
June 1, 2011
Basin or Region
May EOM*
Starvation &
Upper Stillwater
June‐July
Forecast Rock
Creek &
Duchesne River
Reservoir +
StreamflowSWSI
#
KAF^ KAF KAF
Western Uintah 132 300 432 3.97
Surface Water Supply Index
*EOM, end of month; #
SWSI, Surface Water Supply Index; ^KAF, thousand acre‐ feet.
0
50
100
150
200
250
300
350
400
450
500
T h o u s a n d A c r e
‐ f t
Western Uintah Basin Surface Water Supply Index
June Streamflow R

8/6/2019 June 2011 Utah Water Supply Report
http://slidepdf.com/reader/full/june-2011-utah-water-supply-report 24/45
UINTAH BASIN & DAGGET SCD'S as of June 1, 2011
==================================================================================================================================
UINTAH BASIN & DAGGET SCD'S
Streamflow Forecasts - June 1, 2011
==================================================================================================================================
| <<====== Drier ====== Future Conditions ======= Wetter =====>> |
| |
Forecast Point Forecast | ==================== Chance Of Exceeding * ====================== |
Period | 90% 70% | 50% | 30% 10% | 30-Yr Avg.
| (1000AF) (1000AF) | (1000AF) (% AVG.) | (1000AF) (1000AF) | (1000AF)
====================================================================|=======================|=====================================
Blacks Fk nr Robertson APR-JUL 131 144 | 153 161 | 163 177 95
JUN-JUL 108 121 | 130 194 | 140 154 67
| |
EF of Smiths Fork nr Robertson (2) APR-JUL 40 46 | 50 172 | 54 61 29
JUN-JUL 35 41 | 45 214 | 49 56 21
| |
Flaming Gorge Reservoir Inflow (2) APR-JUL 1620 1780 | 1890 159 | 2010 2180 1190
JUN-JUL 1130 1290 | 1400 192 | 1520 1690 730
| |
Big Brush Ck ab Red Fleet Reservoir APR-JUL 18.6 21 | 22 105 | 24 27 21
JUN-JUL 8.2 10.4 | 12.0 119 | 13.7 16.5 10.1
| |
Ashley Ck nr Vernal APR-JUL 44 52 | 58 112 | 64 75 52
JUN-JUL 37 45 | 51 184 | 57 68 28
| |
WF Duchesne R at VAT Diversion APR-JUL 34 38 | 42 225 | 46 50 18.7
JUN-JUL 26.00 31.00 | 34.00 343 | 37.99 42.99 9.90
| |
Duchesne R nr Tabiona (2) APR-JUL 168 191 | 205 195 | 225 235 105
JUN-JUL 121 144 | 160 267 | 177 190 60
| |
Upper Stillwater Reservoir Inflow (2 APR-JUL 119 132 | 142 173 | 152 167 82
JUN-JUL 107 120 | 130 232 | 140 155 56
| |
Rock Ck nr Mountain Home (2) APR-JUL 132 147 | 157 176 | 168 185 89
JUN-JUL 115 130 | 140 226 | 151 168 62| |
Duchesne R ab Knight Diversion (2) APR-JUL 310 335 | 360 192 | 390 430 188
JUN-JUL 250 275 | 300 256 | 330 370 117
| |
Strawberry R nr Soldier Springs (2) APR-JUL 122 132 | 139 236 | 147 159 59
JUN-JUL 32 42 | 49 306 | 57 69 16.0
| |
Currant Ck Reservoir Inflow (2) APR-JUL 47 52 | 56 224 | 60 66 25
JUN-JUL 21 26 | 30 254 | 34 40 11.8
| |
Strawberry R nr Duchesne (2) APR-JUL 255 275 | 295 244 | 310 335 121
JUN-JUL 83 104 | 120 293 | 137 163 41
| |
Lake Fork R ab Moon Lake Reservoir APR-JUL 106 118 | 126 185 | 135 148 68
JUN-JUL 90 102 | 110 234 | 119 132 47
| |
Yellowstone R nr Altonah APR-JUL 97 107 | 115 186 | 123 135 62
JUN-JUL 82 92 | 100 222 | 108 120 45
| |
Duchesne R at Myton (2) APR-JUL 580 630 | 690 265 | 755 835 260
JUN-JUL 365 415 | 475 335 | 540 620 142
| |
Uinta R bl Powerplant Diversion nr N APR-JUL 123 135 | 143 181 | 151 163 79
JUN-JUL 110 122 | 130 228 | 138 150 57
| |
Whiterocks R nr Whiterocks APR-JUL 66 76 | 83 148 | 90 102 56
JUN-JUL 53 63 | 70 184 | 77 89 38
| |
Duchesne R nr Randlett (2) APR-JUL 705 810 | 890 275 | 975 1110 324
JUN-JUL 475 580 | 660 355 | 745 880 186
| |
==================================================================================================================================
UINTAH BASIN & DAGGET SCD'S | UINTAH BASIN & DAGGET SCD'S
Reservoir Storage (1000 AF) - End of May | Watershed Snowpack Analysis - June 1, 2011
==================================================================================================================================
Usable | *** Usable Storage *** | Number This Year as % of
Reservoir Capacity| This Last | Watershed of =================
| Year Year Avg | Data Sites Last Yr Average
========================================================================|=========================================================
FLAMING GORGE 3749.0 3130.0 3191.0 3040.0 | UPPER GREEN RIVER in UTAH 6 298 304
|
MOON LAKE 49.5 4.7 6.8 29.9 | ASHLEY CREEK 2 0 62
|
RED FLEET 25.7 21.5 25.1 22.4 | BLACK'S FORK RIVER 2 221 324
|STEINAKER 33.4 30.0 31.2 27.6 | SHEEP CREEK 1 925 0
|
STARVATION 165.3 128.9 157.1 147.6 | DUCHESNE RIVER 11 437 399
|
STRAWBERRY-ENLARGED 1105.9 1045.5 997.0 702.5 | LAKE FORK-YELLOWSTONE CRE 4 382 376
|
| STRAWBERRY RIVER 4 0 843
|
| UINTAH-WHITEROCKS RIVERS 2 803 482
|
| UINTAH BASIN & DAGGET SCD 17 391 376
|
==================================================================================================================================
* 90%, 70%, 50%, 30%, and 10% chances of exceeding are the probabilities that the actual volume will exceed the volumes in the table.
The average is computed for the 1971-2000 base period.
(1) - The values listed under the 10% and 90% Chance of Exceeding are actually 5% and 95% exceedance levels.
(2) - The value is natural volume - actual volume may be affected by upstream water management.
(3) - Median value used in place of average.

8/6/2019 June 2011 Utah Water Supply Report
http://slidepdf.com/reader/full/june-2011-utah-water-supply-report 25/45
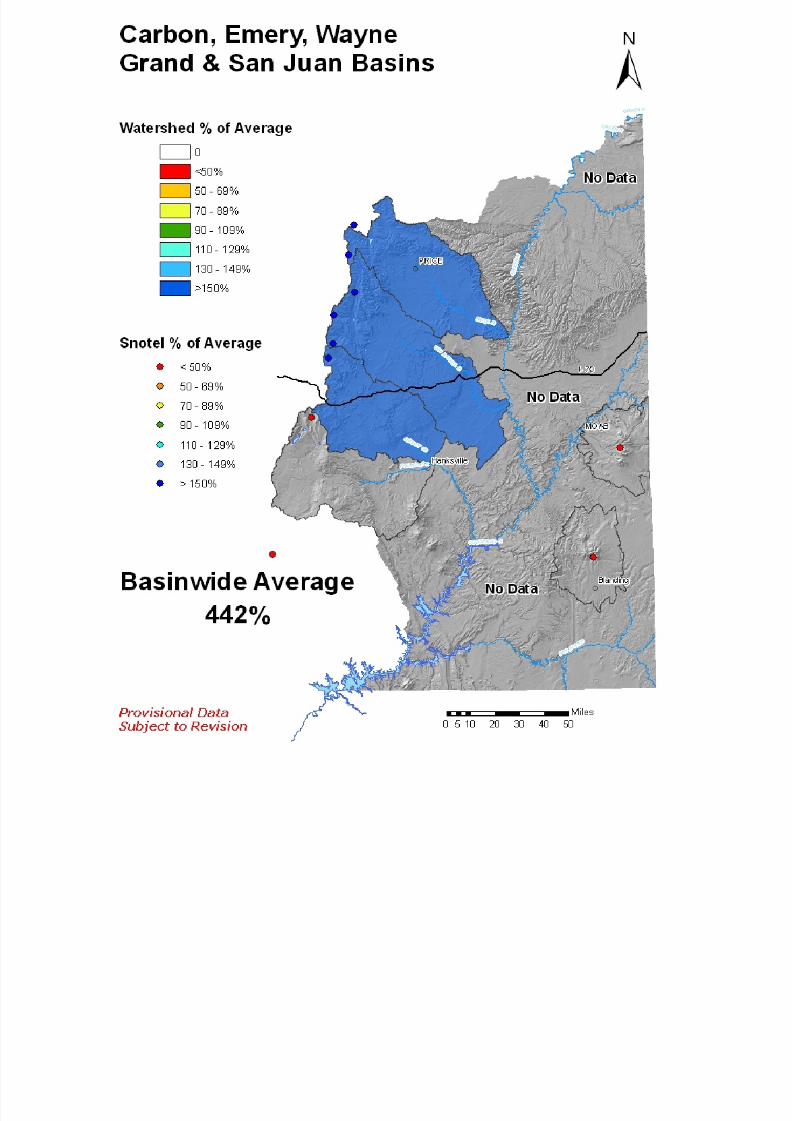
Southeast ‐ Carbon, Emery, Wayne, Grand and San Juan Counties
June 1, 2011
Snowpacks in this region are much above normal at 362% of average, about 677% of last year. Precipitation during Maywas much above average at 170%, bringing the seasonal accumulation (Oct-May) to 145% of normal. Soil moisture
estimates in runoff producing areas are at 79% of saturation in the upper 2 feet of soil, compared to 72% last year at this
time. Forecast streamflows (May-July) range from 33% to 348% of average. Reservoir storage is at 68% of capacity, 2%
higher than last year at this time. Surface Water Supply Indices for the area are: Price 58%, Joe’s Valley 92%, Ferron
Creek 70%, and Moab 72%. General runoff and water supply conditions are much above average in Joe’s Valley andMoab areas, above average in Ferron Creek, and average in the Price area.
0%
20%
40%
60%
80%
100%
Oc t Nov Dec Jan Feb Mar A pr May Jun Jul Aug Sep
S a t u r a t i o n
, v o l u m e %
Southeast Soil Moisture WY 2011 mean
Percent saturation is calculated using the weighted average of volumetric soil
moisture content at 2, 8, and 20‐inch depths. Saturation is estimated as 40%
volumetric water content. The gray area represents the range in saturation
values since 2005.
0
5
10
15
20
25
30
35
40
1‐Jan 1‐Feb 1‐Mar 1‐Apr 1‐May 1‐Jun
S n o w W a t e r E q u i v a l e n t ( i n )
Southeast Utah Snowpack
Current Average
Max imu m Minimum
6/1/2011
0
20
40
60
80
100
120
140
160
180
200
220
240
260
280
300
O ct Nov D e c Jan Feb Mar A pr May Ju n
P e r c e n t o f
A v e r a g e
Southeast Utah Precipitation
Monthly Year‐
to‐
date
6 1 2011
Scofield
Huntington North
Joe's Valley
Mill Site
Miller Flat
Cleveland
Ken's LakeSEUtah
June Southeast Utah Reservoir Storage
Previous Yr % Capacity Current % Capacity
8/6/2019 June 2011 Utah Water Supply Report
http://slidepdf.com/reader/full/june-2011-utah-water-supply-report 26/45

8/6/2019 June 2011 Utah Water Supply Report
http://slidepdf.com/reader/full/june-2011-utah-water-supply-report 27/45
June 1, 2011
Basin or RegionMay EOM* Ken's
Lake Reservoir
June‐July
Forecast Mill
Creek at Sheley
Reservoir +
StreamflowSWSI
#
KAF^ KAF KAF
Moab 1.7 3.4 5.1 1.83
Surface Water Supply Index
*EOM, end of month; #
SWSI, Surface Water Supply Index; ^KAF, thousand acre‐ feet.
0
1
2
3
4
5
6
7
8
9
T h o u
s a n d A c r e
‐ f t
Moab ‐ Surface Water Supply Index
June Streamflow

8/6/2019 June 2011 Utah Water Supply Report
http://slidepdf.com/reader/full/june-2011-utah-water-supply-report 28/45
June 1, 2011
Basin or RegionMay EOM* Joe's
Valley
June‐July
Forecast Inflow to
Joe's Valley
Reservoir +
StreamflowSWSI
#
KAF^ KAF KAF
Joe's Valley 33.8 75.0 108.8 3.47
Surface Water Supply Index
*EOM, end of month; #
SWSI, Surface Water Supply Index; ^KAF, thousand acre‐ feet.
0
20
40
60
80
100
120
140
T h o u
s a n d A c r e
‐ f t
Joe's Valley ‐ Surface Water Supply Index
June Streamflow R

8/6/2019 June 2011 Utah Water Supply Report
http://slidepdf.com/reader/full/june-2011-utah-water-supply-report 29/45
June 1, 2011
Basin or RegionMay EOM*
Scofield Reservoir
June‐July
Forecast Scofield
Reservoir +
StreamflowSWSI
#
KAF^ KAF KAF
Price River 47.8 50.0 97.8 0.66
Surface Water Supply Index
*EOM, end of month; #
SWSI, Surface Water Supply Index; ^KAF, thousand acre‐ feet.
0
20
40
60
80
100
120
140
160
180
200
T h o
u s a n d A c r e
‐ f t
Price River ‐ Surface Water Supply Index
June Streamflow R

8/6/2019 June 2011 Utah Water Supply Report
http://slidepdf.com/reader/full/june-2011-utah-water-supply-report 30/45
June 1, 2011
Basin or RegionMay EOM*
Millsite Reservoir
June‐July
Forecast Ferron
creek
Reservoir +
StreamflowSWSI
#
KAF^ KAF KAF
Ferron Creek 13.9 50.0 63.9 1.64
Surface Water Supply Index
*EOM, end of month; #
SWSI, Surface Water Supply Index; ^KAF, thousand acre‐ feet.
0
20
40
60
80
100
120
T h o
u s a n d A c r e
‐ f t
Ferron Creek ‐ Surface Water Supply Index
June Streamflow R

8/6/2019 June 2011 Utah Water Supply Report
http://slidepdf.com/reader/full/june-2011-utah-water-supply-report 31/45
CARBON, EMERY, WAYNE, GRAND, & SAN JUAN Co. as of June 1, 2011
==================================================================================================================================
CARBON, EMERY, WAYNE, GRAND, & SAN JUAN Co.
Streamflow Forecasts - June 1, 2011
==================================================================================================================================
| <<====== Drier ====== Future Conditions ======= Wetter =====>> |
| |
Forecast Point Forecast | ==================== Chance Of Exceeding * ====================== |
Period | 90% 70% | 50% | 30% 10% | 30-Yr Avg.
| (1000AF) (1000AF) | (1000AF) (% AVG.) | (1000AF) (1000AF) | (1000AF)
====================================================================|=======================|=====================================
Fish Creek ab Reservoir nr Scofield APR-JUL 62 66 | 68 212 | 70 74 32
JUN-JUL 34 38 | 40 348 | 42 46 11.5
| |
Price R nr Scofield Reservoir (2) APR-JUL 73 82 | 88 196 | 95 107 45
JUN-JUL 35 44 | 50 294 | 57 69 17.0
| |
White R bl Tabbyune Ck APR-JUL 33 34 | 36 208 | 37 39 17.3
JUN-JUL 6.50 7.90 | 9.00 216 | 10.20 12.00 4.16
| |
Green R at Green River, UT (2) APR-JUL 5550 5980 | 6290 198 | 6610 7100 3170
JUN-JUL 3660 4090 | 4400 257 | 4720 5210 1710
| |
Electric Lake Inflow (2) APR-JUL 25 27 | 29 185 | 31 33 15.7
JUN-JUL 16.20 18.40 | 20.00 348 | 22.00 24.00 5.75
| |
Huntington Ck nr Huntington (2) APR-JUL 77 83 | 87 178 | 91 98 49
JUN-JUL 55 61 | 65 250 | 69 76 26
| |
Joe's Valley Reservoir Inflow (2) APR-JUL 75 87 | 95 164 | 104 118 58
JUN-JUL 55 67 | 75 214 | 84 98 35
| |
Ferron Ck (Upper Station) nr Ferron APR-JUL 55 60 | 64 164 | 68 73 39
JUN-JUL 41 46 | 50 217 | 54 59 23
| |
Seven Mile Ck nr Fish Lake APR-JUL 9.00 10.30 | 11.20 160 | 12.10 13.40 7.00JUN-JUL 5.30 6.60 | 7.50 242 | 8.40 9.70 3.10
| |
Colorado R nr Cisco APR-JUL 5970 6340 | 6600 142 | 6870 7280 4650
JUN-JUL 3900 4270 | 4530 178 | 4800 5210 2550
| |
Mill Ck at Sheley Tunnel nr Moab APR-JUL 4.40 4.90 | 5.30 106 | 5.70 6.40 5.00
JUN-JUL 2.50 3.00 | 3.40 136 | 3.80 4.50 2.50
| |
Muddy Ck nr Emery APR-JUL 28 32 | 35 176 | 38 42 19.9
JUN-JUL 19.9 23 | 26 219 | 29 33 11.9
| |
Pine Ck nr Escalante APR-JUL 2.90 3.20 | 3.40 142 | 3.60 4.00 2.40
JUN-JUL 0.39 0.63 | 0.82 87 | 1.04 1.40 0.94
| |
South Ck ab Lloyd's Reservoir nr Mon MAR-JUL 0.37 0.41 | 0.44 32 | 0.48 0.56 1.38
JUN-JUL 0.04 0.08 | 0.11 33 | 0.15 0.23 0.33
| |
San Juan R nr Bluff (2) APR-JUL 815 895 | 950 77 | 1010 1110 1230
JUN-JUL 440 520 | 575 103 | 635 730 560
| |
==================================================================================================================================
CARBON, EMERY, WAYNE, GRAND, & SAN JUAN Co. | CARBON, EMERY, WAYNE, GRAND, & SAN JUAN Co.
Reservoir Storage (1000 AF) - End of May | Watershed Snowpack Analysis - June 1, 2011
==================================================================================================================================
Usable | *** Usable Storage *** | Number This Year as % of
Reservoir Capacity| This Last | Watershed of =================
| Year Year Avg | Data Sites Last Yr Average
========================================================================|=========================================================
HUNTINGTON NORTH 4.2 4.0 3.5 3.9 | PRICE RIVER 3 0 660
|
JOE'S VALLEY 61.6 33.8 46.5 51.4 | SAN RAFAEL RIVER 3 626 420
|
KEN'S LAKE 2.3 1.7 1.2 2.0 | MUDDY CREEK 1 0 620
|
MILL SITE 16.7 13.9 8.3 15.5 | FREMONT RIVER 3 0 0
|
SCOFIELD 65.8 47.8 39.9 53.7 | LASAL MOUNTAINS 1 0 0
|
| BLUE MOUNTAINS 1 0 0
|
| WILLOW CREEK 1 0 0
|
| SOUTHEASTERN UTAH 13 1143 444
|
==================================================================================================================================* 90%, 70%, 50%, 30%, and 10% chances of exceeding are the probabilities that the actual volume will exceed the volumes in the table.
The average is computed for the 1971-2000 base period.
(1) - The values listed under the 10% and 90% Chance of Exceeding are actually 5% and 95% exceedance levels.
(2) - The value is natural volume - actual volume may be affected by upstream water management.
(3) - Median value used in place of average.
8/6/2019 June 2011 Utah Water Supply Report
http://slidepdf.com/reader/full/june-2011-utah-water-supply-report 32/45
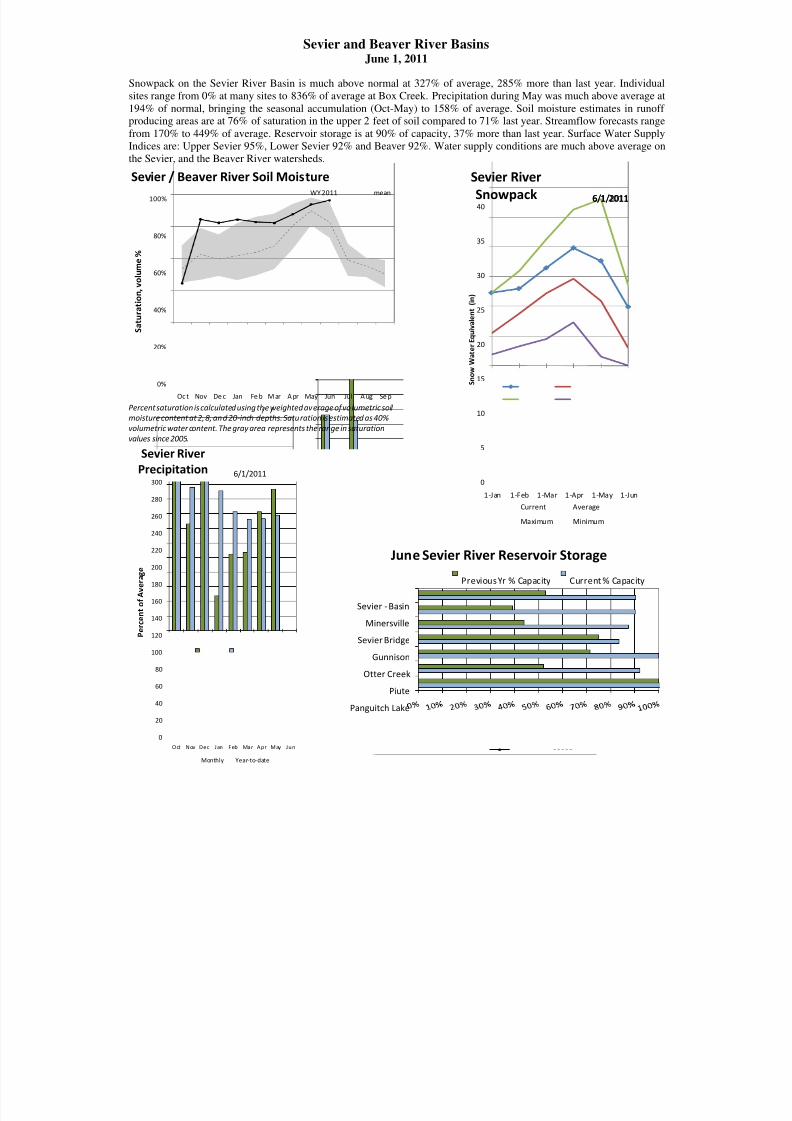
Sevier and Beaver River BasinsJune 1, 2011
Snowpack on the Sevier River Basin is much above normal at 327% of average, 285% more than last year. Individual
sites range from 0% at many sites to 836% of average at Box Creek. Precipitation during May was much above average a
194% of normal, bringing the seasonal accumulation (Oct-May) to 158% of average. Soil moisture estimates in runoffproducing areas are at 76% of saturation in the upper 2 feet of soil compared to 71% last year. Streamflow forecasts range
from 170% to 449% of average. Reservoir storage is at 90% of capacity, 37% more than last year. Surface Water Supply
Indices are: Upper Sevier 95%, Lower Sevier 92% and Beaver 92%. Water supply conditions are much above average onthe Sevier, and the Beaver River watersheds.
0%
20%
40%
60%
80%
100%
Oc t Nov De c Jan Fe b M ar A pr May Jun Jul A ug Se p
S a t u r a t i o n , v o l u m e %
Sevier / Beaver River Soil MoistureWY 2011 mean
Percent saturation is calculated using the weighted average of volumetric soil
moisture content at 2, 8, and 20-inch depths. Saturation is estimated as 40%
volumetric water content. The gray area represents the range in saturation
values since 2005.
0
5
10
15
20
25
30
35
40
1-Jan 1-Feb 1-Mar 1-Apr 1-May 1-Jun
S n o w W a t e r E q u i v a l e n t ( i n )
Sevier River
Snowpack
Current Average
Maximum Minimum
6 1 20116/1/20116/1/2011
0
20
40
60
80
100
120
140
160
180
200
220
240
260
280
300
Oct Nov Dec Jan Feb Mar Apr May Jun
P e r c e n t o
f A v e r a g e
Sevier RiverPrecipitation
Monthly Year-to-date
6/1/2011
Panguitch Lake
Piute
Otter Creek
Gunnison
Sevier Bridge
Minersville
Sevier -Basin
June Sevier River Reservoir Storage
Previous Yr % Capacity Current % Capacity

8/6/2019 June 2011 Utah Water Supply Report
http://slidepdf.com/reader/full/june-2011-utah-water-supply-report 33/45
June 1, 2011 Upper Sevier Surface Water Supply Index
Basin or Region
May EOM* Piute
& Otter Creek
Reservoir
June-July
Forecast Inflow
to Piute
Reservoir
Reservoir +
StreamflowSWSI
# PercentileYears with
similar SWSI
KAF^ KAF KAF %
Upper Sevier 118.6 102 221 3.76 95 70,88,87,95
*EOM, end of month;#
SWSI, Surface Water Supply Index; ̂ KAF, thousand acre-feet.
0
50
100
150
200
250
300
T h o u s a n d A c
r e -
f t
Upper Sevier River Surface Water Supply Index
June Streamflow Reservoir
8/6/2019 June 2011 Utah Water Supply Report
http://slidepdf.com/reader/full/june-2011-utah-water-supply-report 34/45
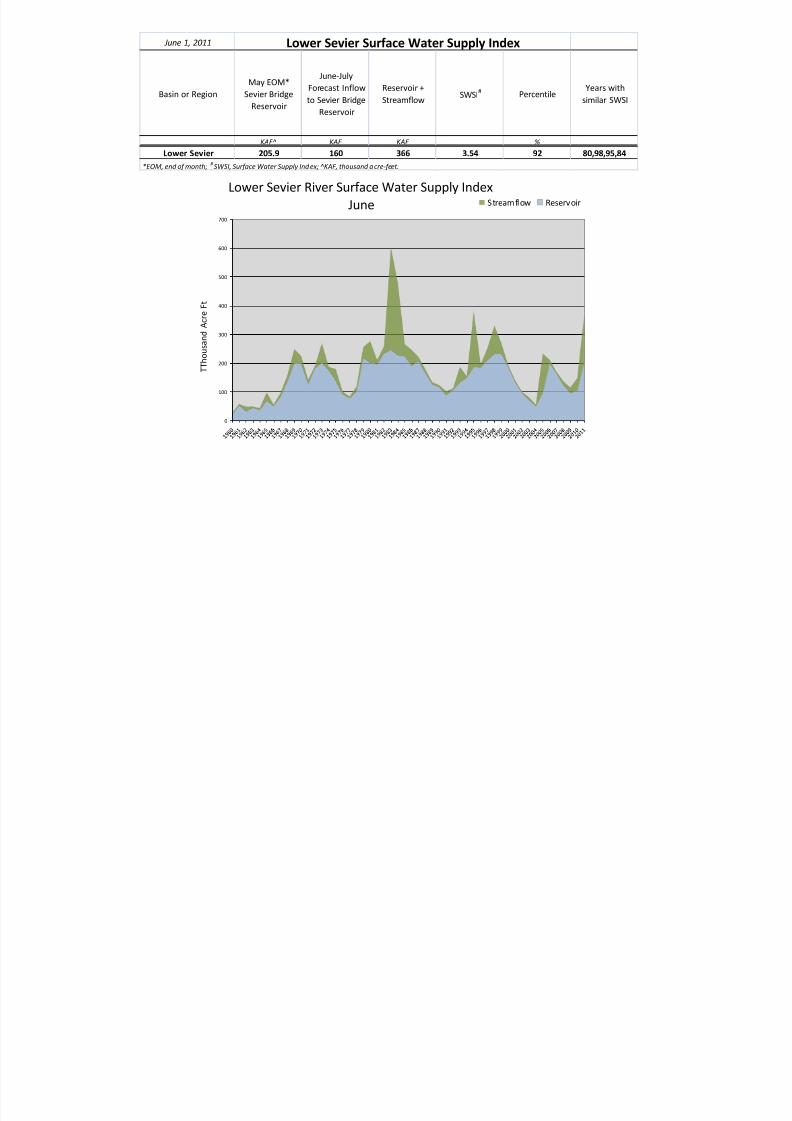
June 1, 2011 Lower Sevier Surface Water Supply Index
Basin or Region
May EOM*
Sevier Bridge
Reservoir
June-July
Forecast Inflow
to Sevier Bridge
Reservoir
Reservoir +
StreamflowSWSI
#Percentile
Years with
similar SWSI
KAF^ KAF KAF %
Lower Sevier 205.9 160 366 3.54 92 80,98,95,84
*EOM, end of month;# SWSI, Surface Water Supply Index; ̂ KAF, thousand acre-feet.
0
100
200
300
400
500
600
700
T T h o u s a n d
A c r e
F t
Lower Sevier River Surface Water Supply Index
June Streamflow Reservoir
8/6/2019 June 2011 Utah Water Supply Report
http://slidepdf.com/reader/full/june-2011-utah-water-supply-report 35/45
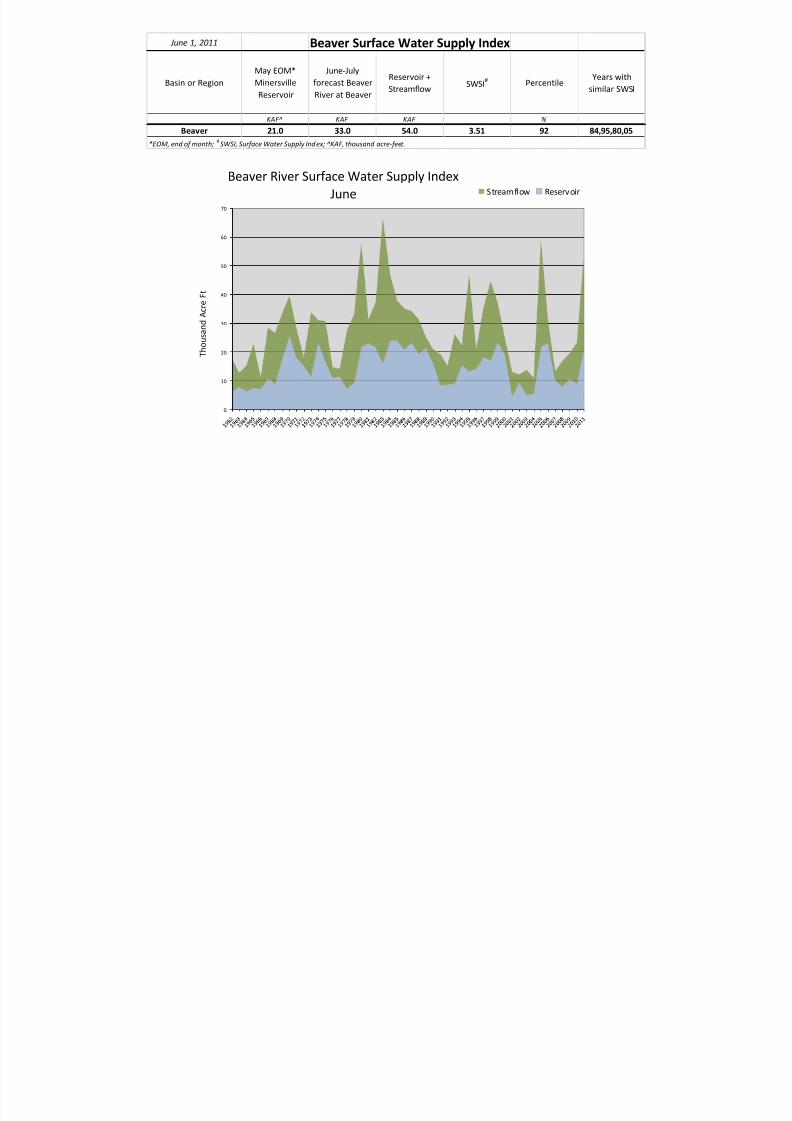
June 1, 2011 Beaver Surface Water Supply Index
Basin or Region
May EOM*
Minersville
Reservoir
June-July
forecast Beaver
River at Beaver
Reservoir +
StreamflowSWSI
# PercentileYears with
similar SWSI
KAF^ KAF KAF %
Beaver 21.0 33.0 54.0 3.51 92 84,95,80,05
*EOM, end of month;#
SWSI, Surface Water Supply Index; ̂ KAF, thousand acre-feet.
0
10
20
30
40
50
60
70
T h o u s a n d
A c r e
F t
Beaver River Surface Water Supply Index
June Streamflow Reservoir

8/6/2019 June 2011 Utah Water Supply Report
http://slidepdf.com/reader/full/june-2011-utah-water-supply-report 36/45
SEVIER & BEAVER RIVER BASINS as of June 1, 2011
==================================================================================================================================
SEVIER & BEAVER RIVER BASINS
Streamflow Forecasts - June 1, 2011
==================================================================================================================================
| <<====== Drier ====== Future Conditions ======= Wetter =====>> |
| |
Forecast Point Forecast | ==================== Chance Of Exceeding * ====================== |
Period | 90% 70% | 50% | 30% 10% | 30-Yr Avg.
| (1000AF) (1000AF) | (1000AF) (% AVG.) | (1000AF) (1000AF) | (1000AF)
====================================================================|=======================|=====================================
Mammoth Ck nr Hatch APR-JUL 31 49 | 61 237 | 73 91 26
JUN-JUL 10.1 26 | 37 272 | 48 64 13.6
| |
Sevier R at Hatch APR-JUL 129 138 | 144 262 | 150 159 55
JUN-JUL 65 68 | 70 259 | 72 75 27
| |
Sevier R nr Kingston APR-JUL 120 132 | 140 424 | 148 160 33
JUN-JUL 47 56 | 62 449 | 68 77 13.8
| |
EF Sevier R nr Kingston APR-JUL 60 70 | 77 220 | 84 94 35
JUN-JUL 29 35 | 40 222 | 45 51 18.0
| |
Sevier R bl Piute Dam APR-JUL 25 150 | 225 341 | 300 405 66
JUN-JUL 52 80 | 102 319 | 127 168 32
| |
Clear Ck ab Diversions nr Sevier APR-JUL 41 45 | 48 218 | 51 55 22
JUN-JUL 16.50 19.70 | 22.00 239 | 24.00 28.00 9.20
| |
Salina Ck nr Emery APR-JUL 11.80 14.90 | 17.00 189 | 19.10 22.00 9.00
JUN-JUL 10.50 11.20 | 11.60 305 | 12.00 12.70 3.80
| |
Salina Ck at Salina APR-JUL 26 35 | 42 213 | 50 62 19.7
JUN-JUL 7.80 13.00 | 17.30 270 | 22.00 30.00 6.40
| |
Manti Ck Blw Dugway Ck Nr Manti APR-JUL 20 23 | 25 137 | 27 30 18.3
JUN-JUL 12.8 16.0 | 18.4 170 | 21 25 10.8| |
Sevier R nr Gunnison APR-JUL 285 305 | 315 297 | 325 345 106
JUN-JUL 122 145 | 160 314 | 175 198 51
| |
Chicken Ck nr Levan APR-JUL 5.80 6.40 | 6.90 153 | 7.40 8.11 4.50
JUN-JUL 1.48 2.10 | 2.50 202 | 3.00 3.80 1.24
| |
Oak Creek nr Oak City APR-JUL 1.75 2.00 | 2.20 133 | 2.40 2.70 1.66
JUN-JUL 0.38 0.55 | 0.68 219 | 0.83 1.07 0.31
| |
Beaver R nr Beaver APR-JUL 38 45 | 50 185 | 55 62 27
JUN-JUL 18.9 26 | 33 225 | 41 58 14.7
| |
Minersville Res Inflow APR-JUL 19.2 27 | 34 205 | 42 55 16.6
JUN-JUL 15.40 21.00 | 26.00 277 | 31.00 39.00 9.40
| |
==================================================================================================================================
SEVIER & BEAVER RIVER BASINS | SEVIER & BEAVER RIVER BASINS
Reservoir Storage (1000 AF) - End of May | Watershed Snowpack Analysis - June 1, 2011
==================================================================================================================================
Usable | *** Usable Storage *** | Number This Year as % of
Reservoir Capacity| This Last | Watershed of =================
| Year Year Avg | Data Sites Last Yr Average
========================================================================|=========================================================
GUNNISON 20.3 16.9 15.2 15.2 | UPPER SEVIER RIVER 8 359 414
|
MINERSVILLE (RkyFd) 23.3 21.0 9.1 16.4 | EAST FORK SEVIER RIVER 3 0 557
|
OTTER CREEK 52.5 52.5 37.4 46.2 | SOUTH FORK SEVIER RIVER 5 254 388
|
PIUTE 71.8 66.1 37.5 52.6 | LOWER SEVIER RIVER 6 407 360
|
SEVIER BRIDGE 236.0 205.9 103.6 170.7 | BEAVER RIVER 2 162 214
|
PANGUITCH LAKE 22.3 22.8 22.3 183.5 | SEVIER & BEAVER RIVER BAS 16 295 325
|
==================================================================================================================================
* 90%, 70%, 50%, 30%, and 10% chances of exceeding are the probabilities that the actual volume will exceed the volumes in the table.
The average is computed for the 1971-2000 base period.
(1) - The values listed under the 10% and 90% Chance of Exceeding are actually 5% and 95% exceedance levels.
(2) - The value is natural volume - actual volume may be affected by upstream water management.
(3) - Median value used in place of average.

8/6/2019 June 2011 Utah Water Supply Report
http://slidepdf.com/reader/full/june-2011-utah-water-supply-report 37/45
E. Garfield, Kane, Washington, & Iron Co.June 1, 2011
Snowpacks in this region are much above normal at 400% of average, which is 260% of last year. Although most sites
have melted off, Kolob and Midway Valley Snotel sites are holding significant snow packs. May precipitation was much
above average at 178%, bringing the seasonal accumulation (Oct-May) to 175% of average. The average soil moisture
estimate in runoff producing areas is at 63% of saturation within the upper 2 feet of soil, compared to 60% last year
Forecast streamflows (June–July) range from 200% to 277% of average. Reservoir storage is at 89% of capacity, 19%
higher than last year at this time. The Surface Water Supply Index is at 85%, indicating much above average water supplyconditions.
0%
20%
40%
60%
80%
100%
Oct Nov Dec Jan Feb Mar Apr May Jun Jul Aug Sep
S a t u r a t i o n , v o l u m e %
Southwest Soil MoistureWY 2011 mean
Percent saturation is calculated using the weighted average of volumetric soil
moisture content at 2, 8, and 20-inch depths. Saturation is estimated as 40%
volumetric water content. The gray area represents the range in saturation
values since 2005.
0
20
40
60
80
100
120
140
160
180
200
220
240
260
280
300
320
340
360
380
400
420
440
460
480
500
520
540
560
Oct NovDec Jan Feb Mar Apr May Jun Jul Aug Sep
P e r c e n t o f A
v e r a g e
Southwest Utah
Precipitation
Monthly Year-to-date
6/1/20110
5
10
15
20
25
30
35
40
1-Jan 1-Feb 1-Mar 1-Apr 1-May 1-Ju
S n o w W a t e r E q u i v a l e n t ( i n )
Southwest Utah
Snowpack
Current Average
Maximum Minimum
6/1/20116/1/2011
Upper Enterprise
Lower Enterprise
Gunlock
Quail Creek
Sand Hollow
Kolob
SWUtah
June Southwest Utah Reservoir Storage
Previous Yr % Capacity Current % Capacity

8/6/2019 June 2011 Utah Water Supply Report
http://slidepdf.com/reader/full/june-2011-utah-water-supply-report 38/45

8/6/2019 June 2011 Utah Water Supply Report
http://slidepdf.com/reader/full/june-2011-utah-water-supply-report 39/45
June 1, 2011
Basin or Region
May EOM*
Quail Creek and
Gunlock
Reservoirs
June-July
forecast Virgin
and Santa Clara
Rivers
Reservoir +
StreamflowSWSI
# PercentileYears with
similar SWSI
KAF^ KAF KAF %
Virgin River 41.2 41 82 2.88 85 88,93,98,95
Surface Water Supply Index
*EOM, end of month;#
SWSI, Surface Water Supply Index; ^KAF, thousand acre-feet.
0
20
40
60
80
100
120
T h o u s a n
d
A c r e - f t
Virgin River - Surface Water Supply Index
June Streamflow Reservoir

8/6/2019 June 2011 Utah Water Supply Report
http://slidepdf.com/reader/full/june-2011-utah-water-supply-report 40/45
E. GARFIELD, KANE, WASHINGTON, & IRON Co. as of June 1, 2011
==================================================================================================================================
E. GARFIELD, KANE, WASHINGTON, & IRON Co.
Streamflow Forecasts - June 1, 2011
==================================================================================================================================
| <<====== Drier ====== Future Conditions ======= Wetter =====>> |
| |
Forecast Point Forecast | ==================== Chance Of Exceeding * ====================== |
Period | 90% 70% | 50% | 30% 10% | 30-Yr Avg.
| (1000AF) (1000AF) | (1000AF) (% AVG.) | (1000AF) (1000AF) | (1000AF)
====================================================================|=======================|=====================================
Lake Powell Inflow (2) APR-JUL 11000 11900 | 12600 159 | 13300 14400 7930
JUN-JUL 7800 8730 | 9400 203 | 10100 11200 4640
| |
Virgin R at Virgin APR-JUL 148 151 | 153 239 | 155 159 64
JUN-JUL 31 34 | 36 220 | 38 42 16.4
| |
Virgin R nr Hurricane APR-JUL 155 160 | 163 236 | 167 172 69
JUN-JUL 33 38 | 41 227 | 45 50 18.1
| |
Santa Clara R nr Pine Valley APR-JUL 9.50 10.10 | 10.50 191 | 10.90 11.60 5.50
JUN-JUL 3.80 4.40 | 4.80 200 | 5.20 5.90 2.40
| |
Coal Ck nr Cedar City APR-JUL 39 41 | 42 218 | 43 45 19.3
JUN-JUL 13.60 16.20 | 18.00 277 | 19.80 22.00 6.50
| |
==================================================================================================================================
E. GARFIELD, KANE, WASHINGTON, & IRON Co. | E. GARFIELD, KANE, WASHINGTON, & IRON Co.
Reservoir Storage (1000 AF) - End of May | Watershed Snowpack Analysis - June 1, 2011
==================================================================================================================================
Usable | *** Usable Storage *** | Number This Year as % of
Reservoir Capacity| This Last | Watershed of =================
| Year Year Avg | Data Sites Last Yr Average
========================================================================|=========================================================
GUNLOCK 10.4 10.4 10.4 --- | VIRGIN RIVER 5 260 420
|
LAKE POWELL 24322.0 13958.0 14463.0 --- | PAROWAN 2 217 382|
QUAIL CREEK 40.0 30.8 31.2 29.6 | ENTERPRISE TO NEW HARMONY 2 0 0
|
UPPER ENTERPRISE 10.0 10.0 5.2 --- | COAL CREEK 2 217 358
|
LOWER ENTERPRISE 2.6 2.4 1.3 --- | ESCALANTE RIVER 2 0 0
|
| SOUTHWESTERN UTAH 9 260 400
|
==================================================================================================================================
* 90%, 70%, 50%, 30%, and 10% chances of exceeding are the probabilities that the actual volume will exceed the volumes in the table.
The average is computed for the 1971-2000 base period.
(1) - The values listed under the 10% and 90% Chance of Exceeding are actually 5% and 95% exceedance levels.
(2) - The value is natural volume - actual volume may be affected by upstream water management.
(3) - Median value used in place of average.

8/6/2019 June 2011 Utah Water Supply Report
http://slidepdf.com/reader/full/june-2011-utah-water-supply-report 41/45
DATA CURRENT AS OF:06/03/11 14:34:31
S N O W C O U R S E D A T A
JUNE 2011
SNOW COURSE ELEV. DATE SNOW WATER LAST AVERAGE
DEPTH CONTENT YEAR 71-00
----------------------------------------------------------------------
AGUA CANYON SNOTEL 8900 6/01 0 .0 .0 .0
ALTA CENTRAL 8800 5/26 131 65.1 31.4 14.4
BEAR RIVER RS SNOTEL 8780 6/01 5 .7 - -
BEAVER DAMS SNOTEL 8000 6/01 0 .0 .0 .1
BEAVER DIVIDE SNOTEL 8280 6/01 13 5.5 .0 .0
BEN LOMOND PK SNOTEL 8000 6/01 81 46.2 6.8 13.0
BEN LOMOND TR SNOTEL 6000 6/01 1 .2 .0 .0BEVAN'S CABIN 6450 - -
BIG FLAT SNOTEL 10290 6/01 87 35.2 22.0 16.2
BIRCH CROSSING 8100 - -
BLACK FLAT-U.M. CK S 9400 6/01 0 .0 .0 .1
BLACK'S FORK GS-EF 9340 - -
BLACK'S FORK JUNCTN 8930 - -
BLACKS FORK JCT SNT 8870 6/01 12 5.8 - -
BOX CREEK SNOTEL 9800 6/01 28 11.7 .0 1.4
BRIAN HEAD 10000 - -
BRIGHTON SNOTEL 8750 6/01 66 33.4 8.7 5.3
BRIGHTON CABIN 8700 5/26 78 35.7 14.8 6.7
BROWN DUCK SNOTEL 10600 6/01 87 40.3 6.6 13.2
BRYCE CANYON 8000 - -BUCK FLAT SNOTEL 9800 6/01 32 14.2 .0 2.8
BUCK PASTURE 9700 - 6.1
BUCKBOARD FLAT 9000 - -
BUG LAKE SNOTEL 7950 6/01 55 30.3 4.0 2.6
BURT'S-MILLER RANCH 7900 - -
BURTS-MILLER RANCH S 7860 6/01 0 .0 .0 -
CAMP JACKSON SNOTEL 8600 6/01 0 .0 .0 .2
CASCADE MOUNTAIN SNO 7770 6/01 11 3.2 .0 -
CASTLE VALLEY SNOTEL 9580 6/01 0 .0 .0 .3
CHALK CK #1 SNOTEL 9100 6/01 83 40.5 15.6 12.0
CHALK CK #2 SNOTEL 8200 6/01 47 16.4 .0 .8
CHALK CREEK #3 7500 - -
CHEPETA SNOTEL 10300 6/01 48 20.0 3.9 3.8CLAYTON SPRINGS SNTL 10000 6/01 0 .0 .0 -
CLEAR CK RIDG #1 SNT 9200 6/01 31 16.9 .0 2.2
CLEAR CK RIDG #2 SNT 8000 6/01 0 .0 .0 .0
CORRAL 8200 - -
CURRANT CREEK SNOTEL 8000 6/01 0 .0 .0 .0
DANIELS-STRAWBERRY S 8000 6/01 4 1.7 .0 .1
DILL'S CAMP SNOTEL 9200 6/01 6 3.1 .0 .5
DONKEY RESERVOIR SNO 9800 6/01 0 .0 .0 .0

8/6/2019 June 2011 Utah Water Supply Report
http://slidepdf.com/reader/full/june-2011-utah-water-supply-report 42/45

8/6/2019 June 2011 Utah Water Supply Report
http://slidepdf.com/reader/full/june-2011-utah-water-supply-report 43/45
LIGHTNING RIDGE SNTL 8220 6/01 51 24.4 .0 -
LILY LAKE SNOTEL 9050 6/01 48 21.7 .0 1.4
LITTLE BEAR LOWER 6000 - -
LITTLE BEAR SNOTEL 6550 6/01 0 .0 .0 .0
SNOW COURSE ELEV. DATE SNOW WATER LAST AVERAGEDEPTH CONTENT YEAR 71-00
----------------------------------------------------------------------
LITTLE GRASSY SNOTEL 6100 6/01 0 .0 .0 .0
LONG FLAT SNOTEL 8000 6/01 0 .0 .0 .0
LONG VALLEY JCT. SNT 7500 6/01 0 .0 .0 .0
LOOKOUT PEAK SNOTEL 8200 6/01 90 49.0 11.4 3.8
LOST CREEK RESERVOIR 6130 - -
LOST CREEK RESV SNT 6080 6/01 0 .0 - -
LOUIS MEADOW SNOTEL 6700 6/01 5 4.2 .0 -
MAMMOTH-COTTONWD SNT 8800 6/01 25 11.5 .0 2.1
MERCHANT VALLEY SNTL 8750 6/01 2 .4 .0 .4
MIDDLE CANYON 7000 - -
MIDWAY VALLEY SNOTEL 9800 6/01 70 35.1 16.2 8.9MILL CREEK 6950 5/25 53 23.1 15.0 4.3
MILL-D NORTH SNOTEL 8960 6/01 74 38.9 7.8 4.9
MILL-D SOUTH FORK 7400 5/26 23 10.1 .0 -
MINING FORK SNOTEL 8000 6/01 56 28.5 1.4 2.9
MONTE CRISTO SNOTEL 8960 6/01 105 49.6 15.5 12.5
MOSBY MTN. SNOTEL 9500 6/01 30 11.3 .0 2.7
MT.BALDY R.S. 9500 - 15.2
MUD CREEK #2 8600 - -
OAK CREEK 7760 - -
OAK CREEK SNOTEL 7850 6/01 0 .0 - -
PANGUITCH LAKE R.S. 8200 - -
PARLEY'S CANYON SNTL 7500 6/01 12 5.3 .0 .4
PARRISH CREEK SNOTEL 7740 6/01 75 35.9 8.2 -PAYSON R.S. SNOTEL 8050 6/01 0 .0 .0 .9
PICKLE KEG SNOTEL 9600 6/01 23 9.0 .0 2.3
PINE CREEK SNOTEL 8800 6/01 36 20.3 5.5 3.7
RED PINE RIDGE SNTL 9200 6/01 15 5.8 .0 1.6
REDDEN MINE LOWER 8500 - 3.1
REES'S FLAT 7300 - -
ROCK CREEK SNOTEL 7900 6/01 0 .0 .0 .0
ROCKY BN-SETTLEMT SN 8900 6/01 76 40.1 13.6 9.6
SEELEY CREEK SNOTEL 10000 6/01 42 18.2 6.1 4.7
SMITH MOREHOUSE SNTL 7600 6/01 13 6.2 .0 .0
SNOWBIRD SNOTEL 9700 6/01 140 75.1 36.4 18.2
SPIRIT LAKE 10300 - 6.9
SPIRIT LK SNOTEL 10200 6/01 42 18.5 2.0 -SQUAW SPRINGS 9300 - -
SQUAW SPRINGS SNOTEL 9110 6/01 0 .0 - -
STEEL CREEK PARK SNO 10100 6/01 75 29.1 18.2 11.8
STILLWATER CAMP 8550 - -
STRAWBERRY DIVIDE SN 8400 6/01 7 2.6 .0 .1
SUSC RANCH 8200 - -
TALL POLES 8800 - -
TEMPLE FORK SNOTEL 7410 6/01 - 7.6 .0 -

8/6/2019 June 2011 Utah Water Supply Report
http://slidepdf.com/reader/full/june-2011-utah-water-supply-report 44/45
THAYNES CANYON SNTL 9200 6/01 78 38.8 9.2 6.6
THISTLE FLAT 8500 - -
TIMBERLINE 9100 - -
TIMBERLINE SNOTEL 8680 6/01 0 .0 .0 -
TIMPANOGOS DIVIDE SN 8140 6/01 43 21.7 .0 2.4
SNOW COURSE ELEV. DATE SNOW WATER LAST AVERAGE
DEPTH CONTENT YEAR 71-00
----------------------------------------------------------------------
TONY GROVE LK SNOTEL 8400 6/01 107 57.8 15.6 14.0
TONY GROVE R.S. 6250 - -
TONY GROVE RS SNOTEL 6400 6/01 0 .0 .0 -
TRIAL LAKE 9960 - 16.8
TRIAL LAKE SNOTEL 9960 6/01 89 51.6 12.5 14.5
TROUT CREEK SNOTEL 9400 6/01 3 .8 .0 .9
UPPER JOES VALLEY 8900 - -
USU DOC DANIEL SNTL 8270 6/01 107 51.2 24.0 -
VERNON CREEK SNOTEL 7500 6/01 0 .0 .0 .1
VIPONT 7670 - -WEBSTER FLAT SNOTEL 9200 6/01 0 .0 .0 .9
WHITE RIVER #1 SNTL 8550 6/01 0 .0 .0 .0
WHITE RIVER #3 7400 - -
WIDTSOE #3 SNOTEL 9500 6/01 0 .0 .0 .7
WRIGLEY CREEK 9000 - -
YANKEE RESERVOIR 8700 - -
(d) Denotes discontinued site.
8/6/2019 June 2011 Utah Water Supply Report
http://slidepdf.com/reader/full/june-2011-utah-water-supply-report 45/45
Issued by Released by
David White Sylvia GillenChief State ConservationistNatural Resources Conservation Service Natural Resources Conservation Service
U.S. Department of Agriculture Salt Lake City, Utah
Prepared by Snow Survey StaffRandall Julander, SupervisorTroy Brosten, HydrologistMike Bricco, HydrologistBeau Uriona, HydrologistKaren Vaughan, Soil ScientistBob Nault, Electronics Technician
YOU MAY OBTAIN THIS PRODUCT AS WELL AS CURENTSNOW, PRECIPITATION, TEMPERATURE AND SOIL MOISTURE,RESERVOIR, SURFACE WATER SUPPLY INDEX, AND OTHER DATA BY VISITING OUR WEBSITE @: http://www.ut.nrcs.usda.gov/snow/
Snow Survey, NRCS, USDA245 North Jimmy Doolittle RoadSalt Lake City, UT 84116 (801) 524-5213
Utah Water SupplyOutlook Report